Embed Size (px)
Citation preview
MARTIN SCHOOL OF PUBLIC POLICY AND ADMINISTRATION
The Socioeconomic Impact of Coal in the Appalachian Region of Kentucky
Laura Oxley
Graduate Capstone Spring 2014
Oxley 2
Executive Summary The coal debate seems to be in a state of inertia. Proponents of coal claim the industry brings economic benefit to Kentucky. Environmentalists claim the industry creates irreparable harm to the Appalachian Mountain region. While these opinions are not unfounded, seldom do stakeholders explore the impact incurred directly in the Appalachian communities that mine coal. Moving the debate to a discussion about coal’s direct impact in the communities that support the industry may broaden stakeholders’ perspective. Determining whether the industry helps or harms the Appalachian community may be the break in the debate’s stalemate. Thus, this paper explores the socioeconomic impact of the coal industry in Eastern Kentucky. To measure the socioeconomic impact, the parameters of “socioeconomic” must be defined. For the purposes of this research, socioeconomic includes median household income, poverty rates and age-adjusted mortality. When median household income was measured against coal mining employment percentages, an inverse relationship was revealed; a one percent increase in coal mining employment could decrease median income by 152 dollars. Also, a direct impact was revealed between coal mining employment and poverty rates; when coal mining employment increased by one percent, poverty increased by .003 percent. Lastly, as coal mining employment increased by one percent, age-adjusted mortality increased by approximately 9 lives. The issue of coal is no longer a normative topic of debate. Recent studies show that coal’s presence in Eastern Kentucky is declining, both in terms of mineral reserve and employment opportunities. Stakeholders must acknowledge this potentially devastating economic event. An economic transition strategy is necessary to protect Appalachian economies from collapsing when the coal industry substantially declines. It is far more prudent to take measures now to ensure a smooth transition rather than wait for a collapse and plan for recovery. Introduction
Coal is a hot topic of debate in the state of Kentucky. Any visitor to the state
could notice the importance of the coal industry to the Commonwealth. Television
advertisements, car stickers and billboards are outward displays of the on-going debate.
Supporters of coal want to preserve the livelihood of a region, market freedom and social
inheritance. This side of the argument is commonly supported by referencing the revenue
collected by the state in the form of coal severance taxes; during the 2012-2013 fiscal
Oxley 3
year, the coal severance tax collected from coal companies totaled to $154 million dollars
(Bailey, 2013).
On the opposite side of the argument, opponents cite concerns about the adverse
effects of coal on the environment as pollutants are released and natural habitats are
destroyed. One topic that is particularly important to this side of the debate is
mountaintop removal. Many have argued that this process, although expedient for
companies, leaves the environment compromised. Most notably, the water supply near
mountaintop removal sites has recorded high levels of poisons, such as arsenic and lead.
At one reading, a local water supply registered arsenic levels at 130-times what is
considered safe by the EPA (House, 2011).
The passion of the debate is undeniable, but this passion can overshadow basic
problems. Some of these issues are lost in the emotion of the debate. This paper will
examine an often absent piece of this discussion by examining whether the delayed social
development in Appalachian coal communities in Kentucky is attributable to coal
production. While admittedly a narrow aspect of the overall coal debate, a review of the
socioeconomic impact could have significant ramifications for public policy. This topic is
of particular importance as policymakers often overlook coal’s direct impact on the
communities that actually mine the mineral. For example, Kentucky stakeholders often
focus on the economic benefit of coal production for the state on the whole; however, the
question is seldom narrowed to the coal mining communities. To this end, past studies
relating to mortality, birth defects, education and employment are explored in this study.
Additionally, data related to median income, poverty and age-adjusted mortality is
Oxley 4
presented. Based upon past studies and initial data collection, the hypothesis is that as
coal’s presence increases for a given county a negative impact is observed for income,
poverty and age-adjusted mortality rates.
Problem Statement
According to recent government studies, the coal reserves in Eastern Kentucky
are declining ("Annual Coal Report 2012"). As last measured, from 2011 to 2012, the
overall reserve decreased approximately 12.2 percent. In conjunction with this decrease,
government reports reflect a decrease in mining employment in Eastern Kentucky of 17.0
percent. By some accounts, it seems the market share of coal is shifting to the Interior and
Western regions (Ward, 2013). Furthermore, the energy market is transitioning to cleaner
and cheaper initiatives such as natural gas (Ward, 2013).
Some policy watchers are concerned that state and local leaders are not preparing
coal communities for the seemingly inevitable decline of a significant economic
contributor. It seems that if policymakers understood the current state of existence for the
coal communities and the potential economic devastation in the future, they would be
more open to discussing Eastern Kentucky’s transition into a viable, more diverse
economy. Since policymakers should be apprised of the many layers of a topic before
making such crucial decisions, the goal of this paper is to provide additional information
for policymakers to fill the gaps in the conversation that have been missing. Hopefully, a
focused study on the direct impact on coal counties will encourage a broad perspective
for the coal debate.
Oxley 5
Literature Review
While the Appalachian region is no stranger to socioeconomic disadvantage, it
seems that coal regions are particularly plagued with these struggles (Goodell, 2007).
According to the Appalachian Regional Commission, a relationship exists between coal-
dependent economies and undiversified economies, fewer professional service
employment positions and lower educational attainment (Wood, 2005). Perhaps even
more troubling, studies have shown that coal mining communities have higher mortality
rates (Hendryx, 2008). Mortality is a significant factor to consider in any discussion of
socioeconomic standing. To this end, the Universities of West Virginia and Washington
State collaborated to evaluate the costs and benefits of the coal industry, specifically in
Appalachia (Hendryx and Ahern, 2009). The study approached the issue of coal in a
manner atypical of the Appalachian coal discussion; the study incorporated the value of
life lost associated with the coal industry. Many of the problems that plague the
Appalachian community, such as disparity of professional services and low educational
attainment, are commonly associated with the region’s undiversified economy. The
Hendryx and Ahern study goes beyond the measure of traditional economic indicators.
While some empirical studies have shown that health disparities in Appalachian coal
counties exist at rates higher than other populations, the Hendryx and Ahern study
highlights the alarming mortality rates in coal-producing areas. Mortality rates in
Appalachian coal mining areas are not only higher than national averages, but also higher
than their non-mining Appalachian counterparts.
Oxley 6
Although coal is a core economic effort in Appalachia, researchers hypothesize
the cost of coal potentially outweigh the benefits. To evaluate this proposition, Hendryx
and Ahem (2009), analyzed four different groups: (1) Appalachian counties mining coal
at levels above the median production levels; (2) Appalachian counties mining coal at
levels below the median production levels; (3) Appalachian counties not mining coal; and
(4) other counties in the United States (Hendryx and Ahern, 2009). Then, the researchers
converted mortality data to a monetary unit by applying a Value of Statistical Life (VSL)
rate based upon the research of various U.S. regulatory agencies. The VSL compares the
risk associated with an activity to the cost of reducing such risk. Once these values were
calculated, they were further converted through Consumer Price Index (CPI) estimates.
After adjusting for mortality factors unrelated to coal mining specifically, the cost
calculated was approximately $18.166 billion per year. This cost, standing alone, does
not have much value to the analysis. To serve as a comparator, the study calculates the
economic benefit of the coal industry in the Appalachian Region.
To assess the economic benefit of the coal industry, a formula was created to
reflect the direct and indirect economic contributions, induced contributions and
severance tax collections, less tax credits. The result of this calculation was
approximately $8.088 billion per year in economic benefit. Thus, the net effect was
approximately -$10.078 billion (Hendryx and Ahern, 2009).
Furthermore, the researchers relied on prior research to narrow the scope of
certain socioeconomic indicators to assess correlations to the coal industry. The selection
of socioeconomic indicators was based upon characteristics that have traditionally
Oxley 7
explained the plight of Appalachia, such as median household income, poverty rates,
educational attainment and unemployment rates (Hendryx and Ahern, 2009). The results
demonstrated that not only did coal-producing counties in Appalachia appear to be
“worse off” in terms of these selected socioeconomic variables, but also, as production
levels of coal increased in a county, the level of socioeconomic disparity also increased.
Additionally, it was discovered that the levels of poverty and unemployment were not
statistically higher in non-mining Appalachian areas as compared to other regions across
the nation. Lastly, the data revealed that heightened levels of mortality in Appalachian
coal-mining counties were not exclusive to males (Hendryx and Ahern, 2009). As coal
miners are predominately male, the excessive life lost does not seem to be explained
merely by the industrial hazards of mining; the research suggests that air and water
pollutants, as byproducts of coal mining production, are factors that explain the poor
health conditions in Appalachian coal counties.
The health of the communities that mine coal is also a significant piece of this
discussion. While mining is an inherently dangerous industry, the health effect is not
isolated solely to coal miners. For example, low birth weights have been correlated to
coal mining (Ahern et al., 2011). This could be explained in part by pollutants released in
the water supply and air during mining; such pollutants include heightened levels of
sulfate, calcium, magnesium and hydrogen sulfate (Palmer, 2010). To illustrate that these
effects are not limited to miners, fetal deliveries have been studied, and the following
impacts have been recorded: gene mutation, orofacial clefts, limb reduction, gastrochisis
and congenital heart disease (Ahern et al., 2011). A specific article was examined for its
Oxley 8
analysis of birth defects in Appalachian coal mining counties (Ahern et al., 2011). Based
upon past studies in China, which uncovered a statistically significant relationship
between proximity to coalmines and neural birth defects, the authors of this article
hypothesized that the rate of birth anomalies would be greater in mountaintop-mining
areas as compared to other mining and non-mining areas. First, in order to understand the
impact of mountain-top removal, the process itself may require an explanation. In this
process, coal companies cut down forests, remove mountain peaks, dig into the surface,
remove coal and cover the “hole” before leaving. Mountain peaks are essentially reduced
to a plateau. Mountaintop removal is a process that is practiced in Kentucky; thus, the
outcomes of the study demonstrate the potential harms to Kentucky residents (House,
2011).
In order to test their hypothesis concerning mountain-top removal, the researchers
relied on data from the National Center for Health Statistics, which maintains data for
every live birth in the United States (Ahern et al., 2011). This data helped the researchers
compile information about birth defects in Appalachia and measure certain indicators
such as age, race, mother’s education, prenatal care and per capita primary physicians and
obstetrician-gynecologists. The study found that mining and mountaintop reported areas
produced higher incidents of birth defect. Additionally, the rate of birth defect was higher
in mountaintop removal areas compared to other mining areas. The researchers concluded
that a potentially strong relationship between birth defects and residency in an area that
conducts mountaintop removal (Ahern et al., 2011).
Oxley 9
Lastly, as one may suspect, poverty is an on-going concern in the Appalachian
region. According to the Appalachian Regional Commission, Central Appalachia reports
higher poverty rates as compared to other Appalachian regions (Ross, 1999). Syracuse,
the University of Colorado and the University of Maryland conducted a study to test the
Human Capital Theory in terms of secondary educational attainment (Black et al., 2005).
The researchers focused a portion of their study on the Appalachian coal community. The
theory explains that furthering one’s education, in this analysis a high school diploma,
depends upon the cost/benefit analysis of expected returns. If the earnings associated with
a higher degree outweigh the opportunity cost of entering the workforce immediately, the
student will remain in school; otherwise, the student will leave school and enter the
workforce. The researchers cite previous studies that indicate that as the wages of low-
skilled workers increase, the high school completion rates decrease. In particular, the
researchers wanted to measure the effects of “shocks,” or the highs and lows of the coal
market, on human capital.
To study the Human Capital Theory in coal communities, the researchers were
particularly interested in the coal boom of the 1970s and the bust in the 1980s. Before the
coal boom, the Pike County community only earned 56 percent of the national per capita
income; during the coal boom of the 1970s, the level increased to 90 percent of the
national average. However, when the industry busted in the early 1980s, the per captia
income dropped down to 63 percent of the national average. Additionally, research
revealed that the majority of coal workers have lower educational attainment. The
industry bust essentially nullified any wage gains, setting the wages back to their original
Oxley 10
values. Therefore, the researchers believed this was an ideal market to test the theories,
and in so doing, revealed consequences within the coal communities (Black et al., 2005).
To test the applicability of the Human Capital Theory in Appalachian coal
communities, the authors began by dividing the data into three different categories: (1)
Big Coal counties, meaning at least one billion tons of coal reserves; (2) Medium Coal
counties, meaning those with at least 100 million tons but less than 1 billion tons; and (3)
Low Coal counties, meaning those with less than 100 million tons in coal reserves. As
predicted, the high school enrollment rate decreased in Big Coal counties, as compared to
the Low Coal counties, when the coal boom was in full swing (Black et al., 2005).
Researchers predict that the effects of an increase in wages during a boom will
only be temporary; the long-term effects of a boom will not sustain benefits to the worker
for choosing to leave high school (Black et al., 2005). Researchers found that no
statistically significant relationship existed between earnings per worker and high school
enrollment rates; from this result, the researchers inferred that short-term shocks do not
substantially affect overall high school enrollment. The second results were statistically
significant. The finding showed that each 10 percent increase in coal workers’ wages
reduced high school enrollment 6.5 percent. Additionally, the research discovered that the
amount of coal reserve in a county was a strong indicator of high school enrollment
(Black et al., 2005).
These studies certainly have applicability to Kentucky, but they do not
specifically focus on Kentucky data in their conclusions. These articles gave guidance for
the variable collection and the methodology of this project, however, these articles alone
Oxley 11
do not explain the potential policy concerns Kentucky leaders face. Focusing the study to
the state gives the findings more credence in the Kentucky coal discussion.
Research Design and Findings
Variable Collection
In a broad sense, the goal of the project is to compare Kentucky’s Appalachian
coal mining counties to Kentucky counties that do not directly participate in the mining
industry. The focus is the state itself, and while comparing Kentucky to other states
within and outside the Appalachian region could prove noteworthy (as is demonstrated in
the aforementioned Hendryx studies), the approach taken in this project reveals
information specifically related to the Kentucky coal industry. As previously stated, it is
hypothesized that Appalachian coal mining correlates to lower socioeconomic outputs.
To begin the study, it was paramount to have coal production variables. Again, the
suspicion is that as coal’s presence increases for a given county, the socioeconomic
characteristics decrease. Coal production and employment levels were available through
the Kentucky Energy and Environment Cabinet. These variables were available per
county for nearly a hundred years. As other variables were collected, it was clear that a
hundred years of data is unique. To conform to the availability of other variables, this list
was narrowed to the years 2000-2010.
To set the parameters of “socioeconomic” is difficult; the term is not inherently
defined. Because the Hendryx study had similar a hypothesis, it was consulted for
guidance on variable collection. Hendryx considered age-adjusted mortality rates, coal
employment and production, certain socioeconomic characteristics such as median
Oxley 12
household income, poverty rates, high school and college educational attainment and
unemployment rates; these variables were likewise considered for this study.
Additionally, Hendryx included smoking rates. This project was unable to obtain county-
level smoking data for Kentucky.
Like the Hendryx study, mortality was a key concern for this study. From a
normative standpoint, mortality is a variable that most people would agree should not
vary; in an ideal world, differing areas of the United States would not experience higher
rates of death. Additionally, indicators of income were of interest for this study. As
Hendryx discussed, the presence of the coal industry does not mean an economic benefit
exists. In Kentucky, many argue that coal positively impacts mining communities directly
by providing employment opportunities.1 This study empirically examines these claims.
Therefore, median income and poverty rates were also included in the study.
Next, specific socioeconomic variables for each Kentucky county were collected
from the Kentucky Energy and Environment Cabinet. Specifically, a data set provided the
following information per county per year: total coal mining employment, coal
production, total labor force, total unemployment rate, median income and population. A
coal employment percentage was generated based upon the coal employment and total
labor force variables provided by the Cabinet. While coal production levels measured in
the thousand ton were available, it seemed that employment percentages reflect a more
accurate picture of the industry. Production has increased over time, but employment
does not always follow that trend. Through technological advances, companies have
1 http://www.facesofcoal.org/index.php?u-s-coal-and-kentucky

Oxley 13
increased productivity and thereby reduced the labor force. The purpose of this project is
to measure socioeconomic factors of these communities. Production levels would be
important to an analysis that focused on the coal companies alone, but the focus of this
project is the impact of coal production in Eastern Kentucky. Similarly, a conversion was
necessary to measure poverty. Crude poverty numbers were collected from the Kentucky
Data Center, but rather than measure these crude numbers across counties, these variables
were converted into a poverty rate. The rate allows for comparison that seems more
explanatory than raw numbers.
Lastly, educational attainment was identified as an important element of the study.
While many agencies define “educational attainment” differently, two methods seem to
prevail. Most agencies report the attainment of 1) high school diploma or equivalent and
2) 4-year degree or higher. The U.S. Census Bureau provided most of the data for this
variable. To supplement this data, the Kentucky Council on Post Secondary Education
provided information for some of the missing years. For the counties that had missing
data, estimates were assigned based upon the static nature of educational attainment.
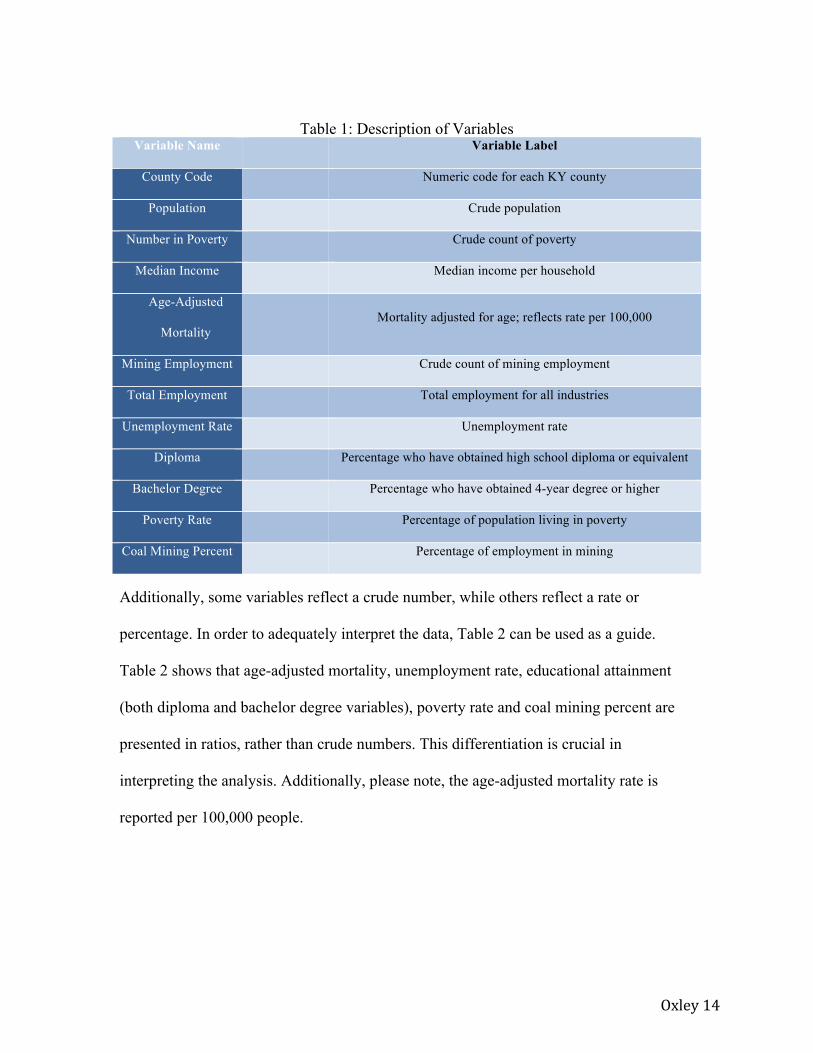
Table 1 represents the collected data.
Oxley 14
Table 1: Description of Variables Variable Name Variable Label
County Code Numeric code for each KY county
Population Crude population
Number in Poverty Crude count of poverty
Median Income Median income per household
Age-Adjusted
Mortality Mortality adjusted for age; reflects rate per 100,000
Mining Employment Crude count of mining employment
Total Employment Total employment for all industries
Unemployment Rate Unemployment rate
Diploma Percentage who have obtained high school diploma or equivalent
Bachelor Degree Percentage who have obtained 4-year degree or higher
Poverty Rate Percentage of population living in poverty
Coal Mining Percent Percentage of employment in mining
Additionally, some variables reflect a crude number, while others reflect a rate or
percentage. In order to adequately interpret the data, Table 2 can be used as a guide.
Table 2 shows that age-adjusted mortality, unemployment rate, educational attainment
(both diploma and bachelor degree variables), poverty rate and coal mining percent are
presented in ratios, rather than crude numbers. This differentiation is crucial in
interpreting the analysis. Additionally, please note, the age-adjusted mortality rate is
reported per 100,000 people.
Oxley 15
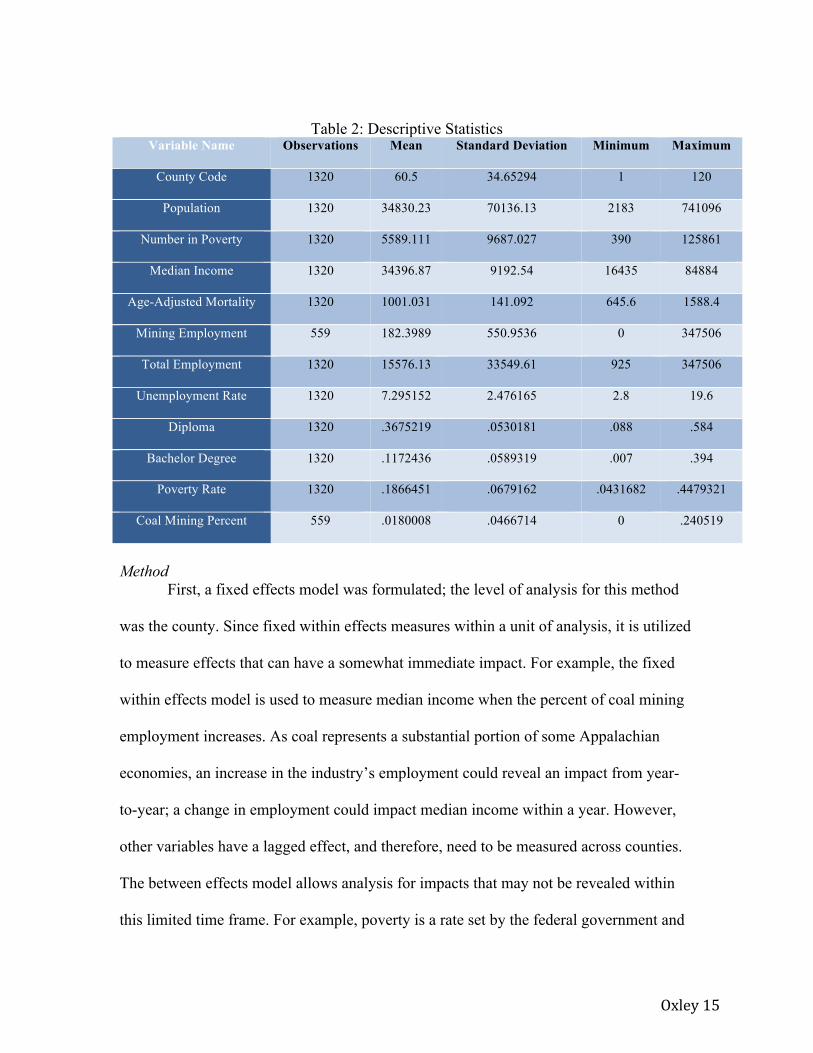
Table 2: Descriptive Statistics Variable Name Observations Mean Standard Deviation Minimum Maximum
County Code 1320 60.5 34.65294 1 120
Population 1320 34830.23 70136.13 2183 741096
Number in Poverty 1320 5589.111 9687.027 390 125861
Median Income 1320 34396.87 9192.54 16435 84884
Age-Adjusted Mortality 1320 1001.031 141.092 645.6 1588.4
Mining Employment 559 182.3989 550.9536 0 347506
Total Employment 1320 15576.13 33549.61 925 347506
Unemployment Rate 1320 7.295152 2.476165 2.8 19.6
Diploma 1320 .3675219 .0530181 .088 .584
Bachelor Degree 1320 .1172436 .0589319 .007 .394
Poverty Rate 1320 .1866451 .0679162 .0431682 .4479321
Coal Mining Percent 559 .0180008 .0466714 0 .240519
Method First, a fixed effects model was formulated; the level of analysis for this method
was the county. Since fixed within effects measures within a unit of analysis, it is utilized
to measure effects that can have a somewhat immediate impact. For example, the fixed
within effects model is used to measure median income when the percent of coal mining
employment increases. As coal represents a substantial portion of some Appalachian
economies, an increase in the industry’s employment could reveal an impact from year-
to-year; a change in employment could impact median income within a year. However,
other variables have a lagged effect, and therefore, need to be measured across counties.
The between effects model allows analysis for impacts that may not be revealed within
this limited time frame. For example, poverty is a rate set by the federal government and
Oxley 16
uses comparative factors, such as Consumer Price Index-adjusted cost of minimum food
diet, pre-tax cash income and family size.2 The Appalachian Region has historically
struggled with poverty, as evident by the 50th anniversary of the War on Poverty and its
efforts to combat poverty in the Region.3 So, it seems that gradual changes in coal
employment may not be adequately reflected in a fixed within effects model. However, a
between effects model analyzes across Kentucky counties. The analysis shows how coal
affects counties that mine coal in Appalachia versus counties that do not mine. Therefore,
as coal employment changes across counties, rather than within a county, changes in
poverty are likewise measured. Similarly, consider the variable age-adjusted mortality. If
a change in mortality is due to environmental pollutants, it is unlikely that the results
would have an immediate, measurable effect.
First, a fixed effects model was formulated; the level of analysis for this method
was the county. This method was selected based upon the collection of data; since data
was collected from 2000-2010 for each county, a time-series regression was needed to
reflect the change over time. The fixed effects model removes time-invariant qualities in
order to glean a net effect (Torres-‐Reyna). A time variable was added to the formula in
order to control for invariant correlations between the dependent and independent
variables. The formula for a fixed effect model is as follows:
2 http://www.irp.wisc.edu/faqs/faq2.htm 3 http://www.usatoday.com/story/news/nation/2014/01/25/war-on-poverty-50th-anniversary/4326109/
Oxley 17
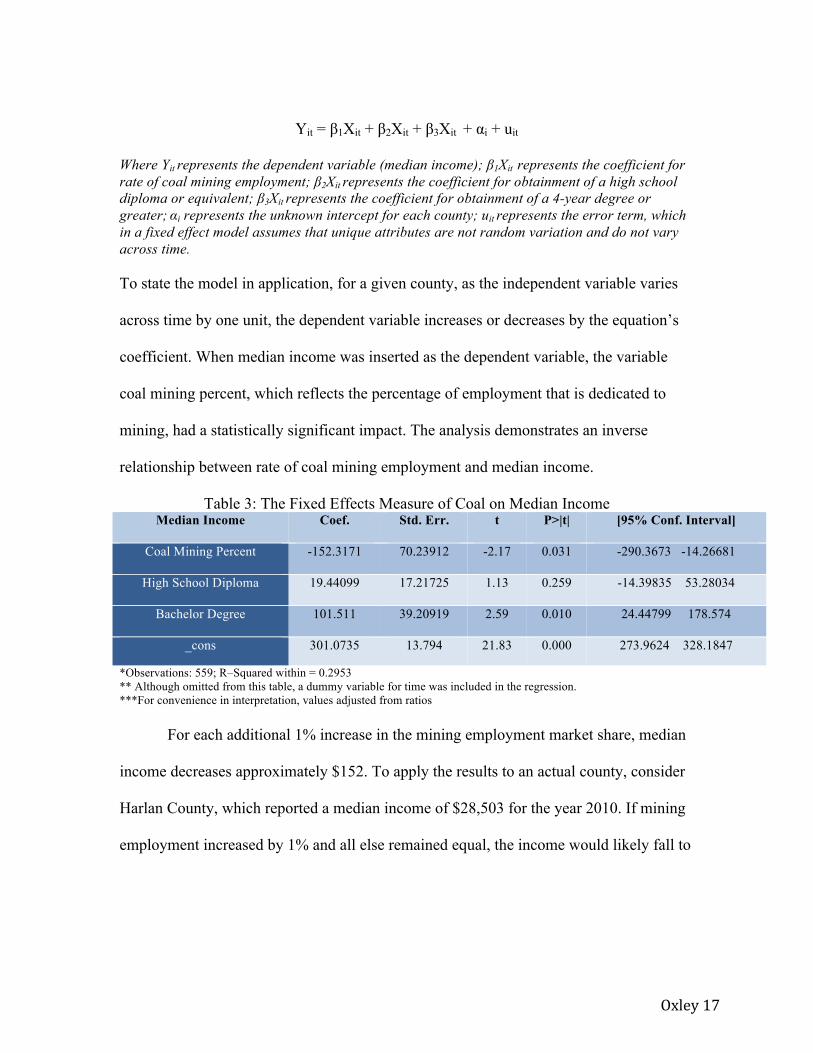
Yit = β1Xit + β2Xit + β3Xit + αi + uit
Where Yit represents the dependent variable (median income); β1Xit represents the coefficient for rate of coal mining employment; β2Xit represents the coefficient for obtainment of a high school diploma or equivalent; β3Xit represents the coefficient for obtainment of a 4-year degree or greater; αi represents the unknown intercept for each county; uit represents the error term, which in a fixed effect model assumes that unique attributes are not random variation and do not vary across time. To state the model in application, for a given county, as the independent variable varies
across time by one unit, the dependent variable increases or decreases by the equation’s
coefficient. When median income was inserted as the dependent variable, the variable
coal mining percent, which reflects the percentage of employment that is dedicated to
mining, had a statistically significant impact. The analysis demonstrates an inverse
relationship between rate of coal mining employment and median income.
Table 3: The Fixed Effects Measure of Coal on Median Income Median Income Coef. Std. Err. t P>|t| [95% Conf. Interval]
Coal Mining Percent -152.3171 70.23912 -2.17 0.031 -290.3673 -14.26681
High School Diploma 19.44099 17.21725 1.13 0.259 -14.39835 53.28034
Bachelor Degree 101.511 39.20919 2.59 0.010 24.44799 178.574
_cons 301.0735 13.794 21.83 0.000 273.9624 328.1847
*Observations: 559; R–Squared within = 0.2953 ** Although omitted from this table, a dummy variable for time was included in the regression. ***For convenience in interpretation, values adjusted from ratios
For each additional 1% increase in the mining employment market share, median
income decreases approximately $152. To apply the results to an actual county, consider
Harlan County, which reported a median income of $28,503 for the year 2010. If mining
employment increased by 1% and all else remained equal, the income would likely fall to
Oxley 18
approximately $28,351.4 This finding shows that when the county market is less reliant
on coal for employment, median incomes are higher. Perhaps this is an indication of an
undiversified economy. When a local economy has many employment options, the local
citizenry benefits.
The fixed within effects model only analyzes within the unit of analysis, which is
the county in this study. In order to compare among the counties, the method was altered
to a between effects model. In the first between effects model, the dependent variable was
poverty rate while the independent variables included coal mining employment rate,
educational attainment (high school diploma or equivalent and 4-year degree or higher)
and unemployment rate. The formula is as follows:
Yit = β1Xit + β2Xit + β3Xit + αi + uit
Where Yit represents a dependent variable that reflects the percentage of the population living in poverty; β1Xit represents the coefficient for rate of coal mining employment; β2Xit represents the coefficient for obtainment of a high school diploma or equivalent; β3Xit represents the coefficient for obtainment of a 4-year degree or greater; αi represents the unknown intercept for each county; uit represents the error term, which in a fixed between model assumes that unique attributes are not random variation and do not vary across time. To state the model in application, for a given county, as the independent variable varies
across time by one unit, the dependent variable increases or decreases by the equation’s
coefficient. When poverty rate was inserted as the dependent variable, the variable coal
mining percent, which reflects the percentage of employment that is dedicated to mining,
had a statistically significant impact. The analysis demonstrates a direct relationship
between rate of coal mining employment and poverty.
4 Based upon employment estimates from the Energy Cabinet, an additional 95 jobs would increase total mining employment from 1,979 to 2,074. This increase would alter the market share of employment opportunities from 20.76% to 21.76% share of mining employment.
Oxley 19
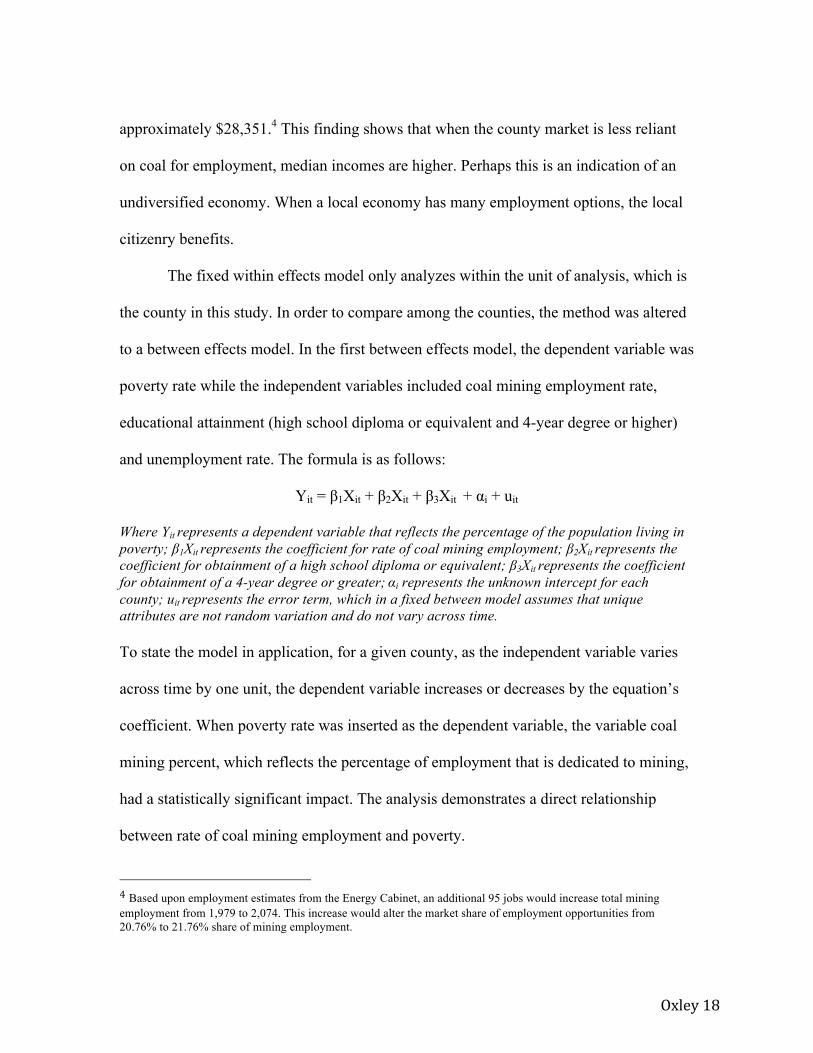
Table 4: The Between Effects of Coal on Poverty Poverty Rate Coef. Std. Err. t P>|t| [95% Conf. Interval]
Coal Mining Percent .00295259 .000864713 3.41 0.001 .001238213 .004666967
High School Diploma -.006627707 .001076226 -6.16 0.000 -.00876142 -.00449398
Bachelor Degree -.005664378 .000984516 -5.75 0.000 -.007616277 -.300712479
Total Unemployment Rate .000174127 .00003379 5.15 0.000 .000107136 .000241119
_cons .003621809 .000655441 5.53 0.000 .002322333 .004921286
*Observations: 559; R-Squared between= 0.6709 **The dummy variable for time was omitted from this model; it demonstrated no statistically significant impact. ***For convenience in interpretation, values adjusted from ratios
The results show that an additional 1% in mining employment increases the
percentage of the population living in poverty by approximately .003%. This finding is
somewhat counterintuitive. One would suspect that employment brings more economic
benefit. In this analysis, mining employment is measured as a percentage of total
employment. For example, coal miners represent approximately 18% of Pike County’s
labor force; additionally, roughly one in four citizens live in poverty. If coal-related jobs
increased in the county to account for an additional .5% of the labor force (which would
be an additional 118 jobs all things equal), an additional 4 citizens would live in poverty.5
It seems that a diverse employment base would be beneficial to areas like Pike County.
These results should encourage state and local policymakers to pursue initiatives that
diversify the local economies where mining represents a portion of the employment
sphere. As previously discussed, reports from the Energy Information Administration
show a decline in the Central Appalachian coal reserves. Furthermore, reports predict that
5 Based upon employment estimates from the Energy Cabinet, an additional 118 jobs would increase total mining employment from 4,390 to 4,508. This increase would alter the market share of employment opportunities from 18.70% to 19.2% share of mining employment.
Oxley 20
coal mining will shift to the Interior and Western regions of the United States (Ward,
2013). As the industry declines in Kentucky, local leaders should transition these counties
into a new economic strategy.
The second analysis follows the previous between effects model, but age-adjusted
mortality6 was inserted as the dependent variable while keeping the same independent
variables as the previous model. The formula for this model is as follows:
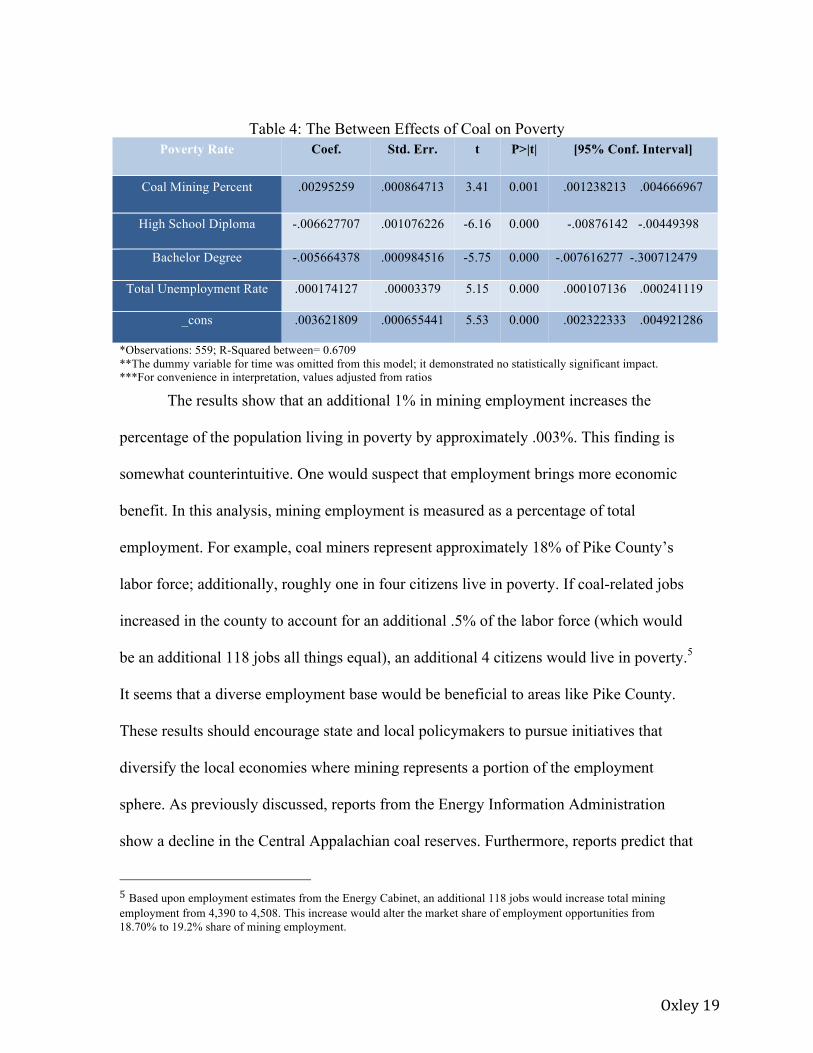
Yit = β1Xit + β2Xit + β3Xit + αi + uit
Where Yit represents the dependent variable (age-adjusted mortality); β1Xit represents the coefficient for rate of coal mining employment; β2Xit represents the coefficient for obtainment of a high school diploma or equivalent; β3Xit represents the coefficient for obtainment of a 4-year degree or greater; αi represents the unknown intercept for each county; uit represents the error term, which in a fixed between model assumes that unique attributes are not random variation and do not vary across time.
The analysis shows a direct relationship between coal and age-adjusted mortality;
when coal represents a larger portion of a county’s work force, age-adjusted mortality
increases. Specifically, the findings show that for each additional 1% in mining
employment, age-adjusted mortality increases on average by 9.56 lives per 100,000
people. This result could reflect pollutants in the local environs or overall socioeconomic
hardships; either way, the result is troublesome.
6 Where age-‐adjusted mortality is calculated by: [(Deaths in Age Group)÷(Estimated Population of Age Group)] * 100,000
Oxley 21
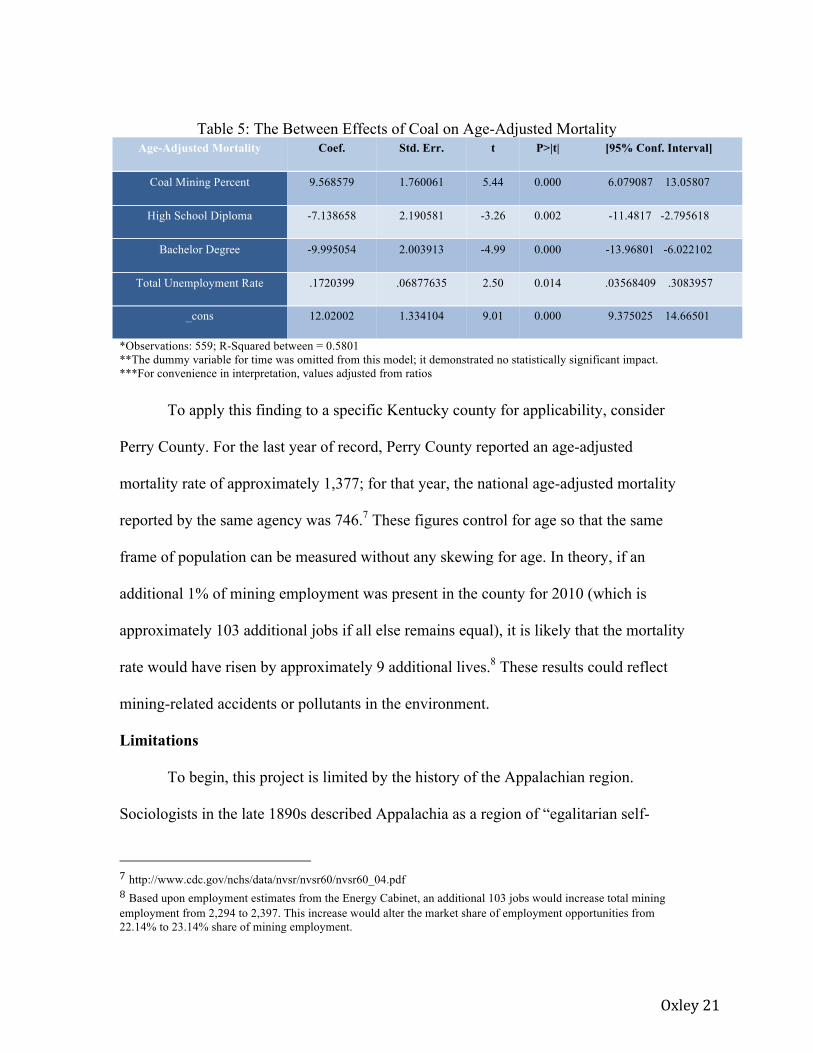
Table 5: The Between Effects of Coal on Age-Adjusted Mortality Age-Adjusted Mortality Coef. Std. Err. t P>|t| [95% Conf. Interval]
Coal Mining Percent 9.568579 1.760061 5.44 0.000 6.079087 13.05807
High School Diploma -7.138658 2.190581 -3.26 0.002 -11.4817 -2.795618
Bachelor Degree -9.995054 2.003913 -4.99 0.000 -13.96801 -6.022102
Total Unemployment Rate .1720399 .06877635 2.50 0.014 .03568409 .3083957
_cons 12.02002 1.334104 9.01 0.000 9.375025 14.66501
*Observations: 559; R-Squared between = 0.5801 **The dummy variable for time was omitted from this model; it demonstrated no statistically significant impact. ***For convenience in interpretation, values adjusted from ratios
To apply this finding to a specific Kentucky county for applicability, consider
Perry County. For the last year of record, Perry County reported an age-adjusted
mortality rate of approximately 1,377; for that year, the national age-adjusted mortality
reported by the same agency was 746.7 These figures control for age so that the same
frame of population can be measured without any skewing for age. In theory, if an
additional 1% of mining employment was present in the county for 2010 (which is
approximately 103 additional jobs if all else remains equal), it is likely that the mortality
rate would have risen by approximately 9 additional lives.8 These results could reflect
mining-related accidents or pollutants in the environment.
Limitations
To begin, this project is limited by the history of the Appalachian region.
Sociologists in the late 1890s described Appalachia as a region of “egalitarian self-
7 http://www.cdc.gov/nchs/data/nvsr/nvsr60/nvsr60_04.pdf 8 Based upon employment estimates from the Energy Cabinet, an additional 103 jobs would increase total mining employment from 2,294 to 2,397. This increase would alter the market share of employment opportunities from 22.14% to 23.14% share of mining employment.
Oxley 22
sufficiency” (Pudup, 1989). Without commercial activity, the region lacked capital means
for progress. In addition to the weak local commercial activity, other factors further
created an isolated environment for the Appalachian region. Beyond issues of commerce,
transportation deficiency isolated the mountainous region of Eastern Kentucky from the
rest of the state. Central Kentucky was settled earlier than the mountain region and thus
began development sooner; it became the center of political and economic strength in the
state. This imbalance in power manifested in state policies that favored financial support
for development in the Bluegrass Region but not the Appalachian Region. These factors
establish a unique history within Appalachian coal counties that cannot be completely
controlled for in a regression model. While the research for this study reflects statistically
significant results, one should be aware that the unique Appalachian culture cannot be
completely controlled for a study set in a ten-year time frame.
Also, for educational attainment, some observations were missing from the
original data set. After consulting the U.S. Census Bureau and Kentucky Council on Post
Secondary Education, data was missing for 2001 through 2004. Because of the static
nature of the variable, estimates were projected for these missing years based upon the
linear trend of the available data.
Additionally, missing variable bias is a possible limitation to this study. One
particularly desirable variable, smoking tobacco rates, is missing from this analysis.
Smoking rates are not reported at the county level for the needed time period, 2000-2010.
Furthermore, it is possible that variables were overlooked in the initial planning process,
and thus, are missing from the results of this analysis.
Oxley 23
Lastly, as is true with nearly all panel set data, research cannot construe these
counties in the alternative; meaning, the results are limited in their ability to explain
causation. If the Appalachian Region never had a coal industry, it is difficult to know
how the county data would differ if coal never took root in the area. This analysis does
not prove that coal alone is the cause of lower socioeconomic standing in Eastern
Kentucky. This project only shows that recent data indicate a relationship between coal
and lower socioeconomic standing.
Conclusions
The goal of this project was not to advocate for a political position. The intent was
to contribute information that has been missing from the discussion. The benefits of coal
for Kentucky on the whole often overshadow the issues created by coal. If policymakers
make coal-related decisions based upon its benefits, the decision could be swayed by an
inaccurate representation of coal’s overall impact. In order to achieve the best results,
policymakers need complete and accurate information, and this project hopes to further
that goal.
Among other factors, researchers have analyzed the effects of coal mining on
mortality, birth defects and educational attainment. These studies reflect a negative
impact on the communities that mine coal. While these studies have applicability to
Kentucky, the work does not directly represent the effect of coal within the state. Thus,
this project considers similar variables of socioeconomic standing but narrowed the scope
to Kentucky.
Oxley 24
For the fixed within effects model, the data reflected a statistically significant
relationship between median income and percentage of mining employment. For the
between effects models, the results reported similar findings; coal mining employment
revealed a negative impact on the communities when measuring poverty and age-adjusted
mortality. Although coal supporters believe the industry adds value to the Appalachian
region, this report does not review the positive aspects within the cost/benefit analysis of
the coal discussion. These findings should supplement policymakers’ discussions about
the costs of the coal industry in Kentucky.
References
Ahern, Melissa, et al. "The association between mountaintop mining and birth defects
among live births in central Appalachia, 1996–2003." Environmental Research
111.6 (2011): 838-846.
<http://www.sciencedirect.com/science/article/pii/S0013935111001484>.
Ahern, Melissa, et al. "Residence in coal-mining areas and low-birth-weight outcomes."
Maternal and child health journal 15.7 (2011): 974-979.
< http://link.springer.com/article/10.1007/s10995-009-0555-1>.
Bailey, Jason. “Sharp Decline in Coal Severance Tax Revenue Underscores Need for
Economic Plan.” KCEP (2013). MACED.
< http://www.kypolicy.us/content/sharp-decline-coal-severance-tax-revenue-
underscores-need-economic-plan >.
Oxley 25
Black, Dan A., Terra G. McKinnish, and Seth G. Sanders. "Tight labor markets and the
demand for education: Evidence from the coal boom and bust." Indus. & Lab. Rel.
Rev. 59 (2005): 3.
<http://heinonline.org/HOL/LandingPage?handle=hein.journals/ialrr59&div=
4&id=&page=>.
Hendryx, Michael. "Mortality rates in Appalachian coal mining counties: 24 years behind
the nation." Environmental Justice 1.1 (2008): 5-11.
< http://online.liebertpub.com/doi/abs/10.1089/env.2008.0500>.
Hendryx, Michael, and Melissa M. Ahern. "Mortality in Appalachian coal mining
regions: the value of statistical life lost." Public Health Reports 124.4 (2009): 541.
< http://www.ncbi.nlm.nih.gov/pmc/articles/PMC2693168/>.
House, Silas. "My polluted Kentucky home." The New York Times (2011): 11.
<http://www.nytimes.com/2011/02/20/opinion/20House.html?_r=0>.
Goodell, Jeff. Big coal: the dirty secret behind America's energy future. Houghton
Mifflin Harcourt, 2007. < Big coal: the dirty secret behind America’s energy
future>.
Ross, Michael L. "The political economy of the resource curse." World politics 51
(1999): 297-322.
<http://journals.cambridge.org/action/displayAbstract;jsessionid=0D0067760347
DC170D282960FCE97EA0.journals?fromPage=online&aid=7625772>.
Palmer, Margaret A., et al. "Mountaintop mining consequences." Science 327.5962
(2010): 148-149.
<http://www.filonverde.org/images/Mountaintop_Mining_Consequences_
Oxley 26
Science1%5B1%5D.pdf>.
Pudup, Mary Beth. "The boundaries of class in preindustrial Appalachia." Journal of
Historical Geography 15.2 (1989): 139-162.
<http://www.sciencedirect.com/science/article/pii/S0305748889800192>.
Torres-‐Reyna, O. "Panel Data Analysis Fixed & Random Effects (using Stata 10.x)
(ver. 4.1)." Data & Statistical Services . Princeton University, Web.
<http://www.princeton.edu/~otorres/Panel101.pdf>.
U.S. Department of Energy. U.S. Energy Information Administration. Annual Coal
Report 2012. Washington, DC: 2013. Web.
<http://www.eia.gov/coal/annual/pdf/acr.pdf>.
Ward, Ken. "Forecast Troubling for Central Appalachian Coal." West Virginia Gazette
[Charleston] 02 Feb 2013.
<http://www.wvgazette.com/News/201302020086?page=1>.
Wood, Lawrence E. Trends in National and Regional Economic Distress, 1960-2000.
Washington, DC: Appalachian Regional Commission, 2005.
<http://www.arc.gov/assets/research_reports/TrendsinNationalandRegionalEcono
mic Distress1960to2000.pdf>.

Oxley 27