Embed Size (px)
Citation preview

1
OXIDATION STUDY OF AN ULTRA HIGH TEMPERATURE CERAMIC
COATINGS BASED ON HFSICN
Dagny Sacksteder *1, Deborah L. Waters 1 and Dongming Zhu 1 * On NASA Internship at NASA Glenn Research Center, Cleveland, Ohio, USA 1 Environmental Effects and Coatings Branch, NASA Glenn Research Center, Cleveland, Ohio,
USA
ABSTRACT
High temperature fiber-reinforced ceramic matrix composites (CMCs) are important for
aerospace applications because of their low density, high strength, and significantly higher-
temperature capabilities compared to conventional metallic systems. The use of the
SiCf/SiC and Cf/SiC CMCs allows the design of lighter-weight, more fuel efficient aircraft
engines and also more advanced spacecraft airframe thermal protection systems. However,
CMCs have to be protected with advanced environmental barrier coatings when they are
incorporated into components for the harsh environments such as in aircraft engine or
spacecraft applications. In this study, high temperature oxidation kinetics of an advanced
HfSiCN coating on Cf/SiC CMC substrates were investigated at 1300°C, 1400°C, and
1500°C by using thermogravimetric analysis (TGA). The coating oxidation reaction
parabolic rate constant and activation energy were estimated from the experimental results.
The oxidation reaction studies showed that the coatings formed the most stable,
predominant HfSiO4-HfO2 scales at 1400°C. A peroxidation test at 1400°C then followed
by subsequent oxidation tests at various temperatures also showed more adherent scales
and slower scale growth because of reduced the initial transient oxidation stage and
increased HfSiO4-HfO2 content in the scales formed on the HfSiCN coatings.
1.INTRODUCTION
Ceramic matrix composites (CMCs) such as SiCf/SiC and Cf/SiC are being
considered for use in advanced aircraft and spacecraft applications. CMCs are valued for
their light weight, and superior ability to withstand higher temperatures without major
losses in mechanical strength as compared to nickel based superalloys. However, CMCs
must be protected with ceramic coatings that can withstand aggressive oxidation and
corrosive combustion during engine or spacecraft entry, descent, and landing (EDL) in
order to be viable candidate materials [1]. Improving oxidation resistance is therefore of
great importance for Ultra High Temperature Ceramic (UHTC) substrates and coatings that
are designed for the harsh operating environments and long-term durability. In general, the
oxidation of the SiC based material system is mostly driven by the diffusion of oxygen into
the material, although the diffusion of silicon and hafnium towards the surface also
contributes to the scale formation reactions [2, 3, 4]. To resist recession and consumption
caused by oxidation, coatings must to be designed to form a layer of oxide scales that are
strong and have a low oxygen diffusivity to impede further oxygen and metal ion transfer

2
[1]. To better understand how coatings can be integrated to protect structural ceramic
materials, this study was conducted to investigate the oxidation kinetics of an UHTC
HfSiCN coating at high temperatures.
2.EXPERIMENTAL
The coating studied was a silicon doped compound HfSiCN, an UHTC
composition. The coating composition, whose design is described in References [1] and
[2], included silicon added to a HfCN UHTC to help improve the material’s oxidation
resistance. The coating was deposited onto Cf/SiC composite or SiC monolithic substrates
by the Southwest Research Institute using a Plasma-Enhanced Physical Vapor Deposition
process.
To study the kinetics of oxide scale formation on ceramic coatings, a series of
thermogravimetric analysis (TGA) tests were conducted similar to the work described in
Reference [4]. Each Cf/SiC CMC coupon was fully coated all sides with the HfSiCN
coating. Three of these samples were initially tested at 1300°C, 1400°C, or 1500°C under
1 atm of O2 for 100 hours. To better understand the nature of scale growth after the initial
transient state, a subsequent round of tests was conducted on three additional samples.
These samples were first ‘pre-oxidized’ at 1400°C for 20 hours in 1 atm of O2 to develop
a consistent scale layer. The pre-oxidation temperature was selected because the samples
tested at 1400°C in the initial round of TGA runs showed the shortest initial transient stage
(they best fit the parabolic rate behavior) and good scale adherence. The pre-oxidized
samples were then further oxidized in the same atmosphere for 100 hours at either 1300°C,
1400°C, or 1500°C. The weight gain data for the test specimens were continuously
recorded for the duration of the tests. After the TGA tests, the samples were characterized
and analyzed using a Phenom Pro X Scanning Electron Microscope (SEM) and
accompanying Energy Dispersive Spectroscopy (EDS) system. X-Ray Diffraction (XRD)
was also used to characterize the phase structures of the coating and scales.
3.RESULTS AND DISCUSSION
3.1 TGA Kinetics and Analysis
Data from the TGA showed a sharp drop in the mass of all the HfSiCN coated
Cf/SiC samples during their first hour of testing. This can be accounted for by the
evaporation of moisture that had been absorbed by the sample prior to testing, as well as
organic residue that may have built up during processing and handling. The weight gain
data from all the samples were made comparable by dividing each sample’s change in mass
by its surface area (the resulting term is referred to as the specific weight gain). Because
the main objective was to study the growth of scales that takes place on the surface of

3
ceramic materials at high temperatures, the data was adjusted and graphed to show only
the mass gain that takes place after the initial burnout. Initially, the sample weight gain rate
is relatively high. Once oxide scales cover the original surface, the rate of weight gain
decreases because the scales slow the oxygen diffusion rate [3, 4, 5]. The data fit well with
the proposed parabolic rate law, which supports the assertion that the reaction is controlled
by diffusion and the formation of relatively protective scales [3, 4, 6].
To better characterize the oxidation kinetics of the HfSiCN coatings, plots were
made comparing change in specific mass squared versus time. The parabolic nature of the
reaction leads to relatively linear trends when graphed using this relationship, which makes
it possible to extrapolate the reaction rate constants for longer time. As shown in Figure 1,
the first round of TGA tests showed that the sample tested at 1300°C had the highest growth
rate, followed by the sample tested at 1500°C and 1400°C, respectively. However, it is
unlikely that the 1300°C sample demonstrated the highest growth rate over the course of
100 hours because of a true temperature dependence for a temperature-activated process.
Instead, it is believed that this sample had a higher relative growth rate because, at the
lower temperature, the formation of the initial continuous protective oxide layer, as
expected to be predominantly hafnia silicate or hafnon, is slower. Since the protective oxide
scale layer did not form quickly, the sample remained in its transient stage for a longer
period of time during the test. The sample tested at 1400°C seemed to have achieved a
stable reaction rate the quickest, which is why the samples for the next round of testing
were pre-oxidized at 1400°C. The pre-oxidation at 1400°C for 20 hours allowed for the
assumption that all samples would have the initial layer of steady-state protective scales
already formed when the 100 hour test began, so that the temperature effect on the steady-
state reaction rates could be studied for the specimens.
In both rounds of testing, the samples tested at 1400°C proved to have the most
stable reaction rates, as shown by their increasingly linear behavior. This is supported by
XRD data discussed below. The 1500°C pre-oxidized sample also showed a fairly strong
linear behavior, although the overall growth rate quickly slowed, due to the high
temperature and quick formation of the protective scales. It is possible that SiO2-containing
scales were more prone to volatility at 1500°C, and thus may have contributed to the
relatively lower observed scale growth rate at 1500°C.
Special attention was paid to data from the end of the test, at which point the formed
protective scales can effectively control diffusion. In analyzing the last 30 hours of testing
for all of the samples, linear regressions were used to estimate the oxidation rate constant
𝑘𝑝 of the reactions at various temperatures.

4
Figure 1. The HfSiCN coating oxidation weight gain squared vs. time. The standard form
of a parabolic rate law is ∆𝑤2 = 𝑘𝑝 × 𝑡 + 𝐶, where ∆𝑤 is specific weight gain,
𝑘𝑝 is parabolic rate constant, C is a constant. As can be seen from the parabolic
rate law relation, when the change in specific mass is squared, the graph is linear,
and therefore the slope can be treated as an approximation of 𝑘𝑝 for the coating
system.
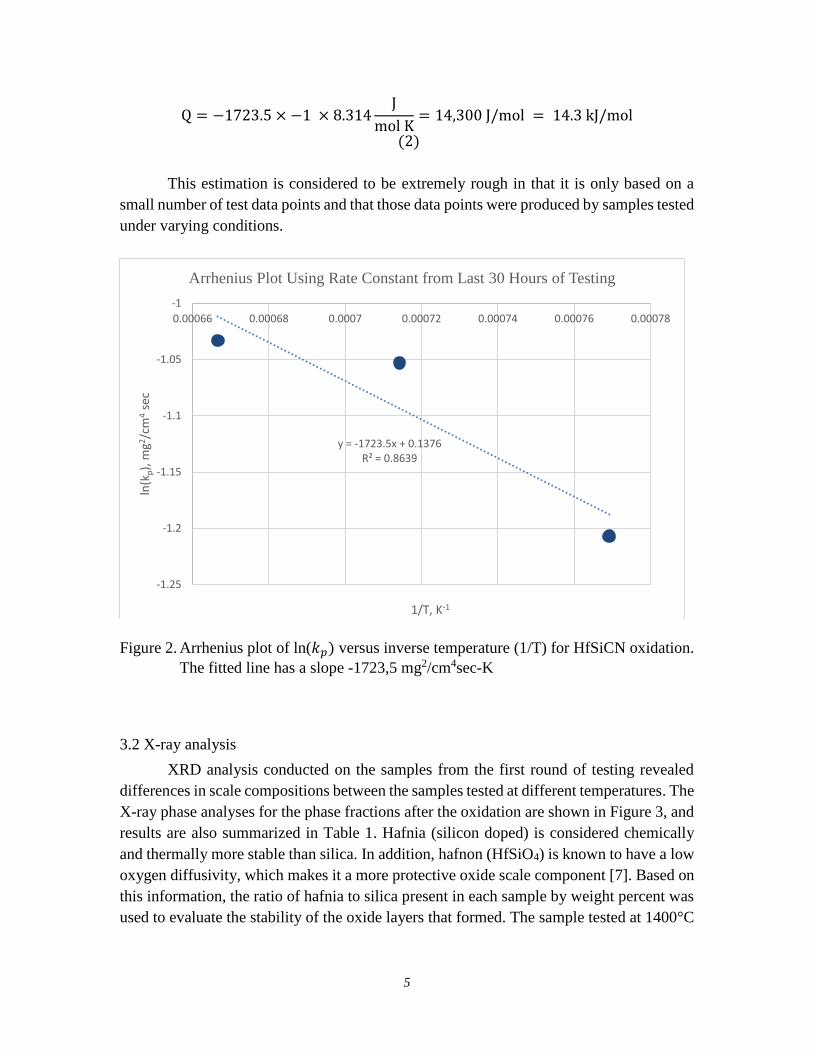
In Figure 2, data from the 1300°C pre-oxidized sample was plotted alongside data
from the 1400°C and 1500°C 100 hour test samples. The activation energy can be
estimated, as show from Equations (1a), (1b) and (2) below:
𝑘𝑝 = 𝐴 ∙ 𝑒𝑥𝑝(−𝑄
𝑅𝑇) (1a)
where A is the pre-exponential factor, Q is the activation energy, R is gas constant. Take
the natural logarithm of both sides of Equation (1a),
ln 𝑘𝑝 = ln(𝐴) −𝑄
𝑅∙ 𝑇 (1b)
where the slope is −Q
R= −1723.5, thus the activation energy is
0
10
20
30
40
50
0 20 40 60 80 100 120
chan
ge in
sp
ecif
ic m
ass
(mg/
cm2)2
Time(hours)
Scale Growth Rate on HfSiCN Coating at 1300°C, 1400°C, and 1500°C
1300C 100 hrs 1400C 100 hrs 1500C 100 hrs
1300C 120 hrs 1400C 120 hrs 1500C 120 hrs
5
Q = −1723.5 × −1 × 8.314J
mol K= 14,300 J/mol = 14.3 kJ/mol
(2)
This estimation is considered to be extremely rough in that it is only based on a
small number of test data points and that those data points were produced by samples tested
under varying conditions.
Figure 2. Arrhenius plot of ln(𝑘𝑝) versus inverse temperature (1/T) for HfSiCN oxidation.
The fitted line has a slope -1723,5 mg2/cm4sec-K
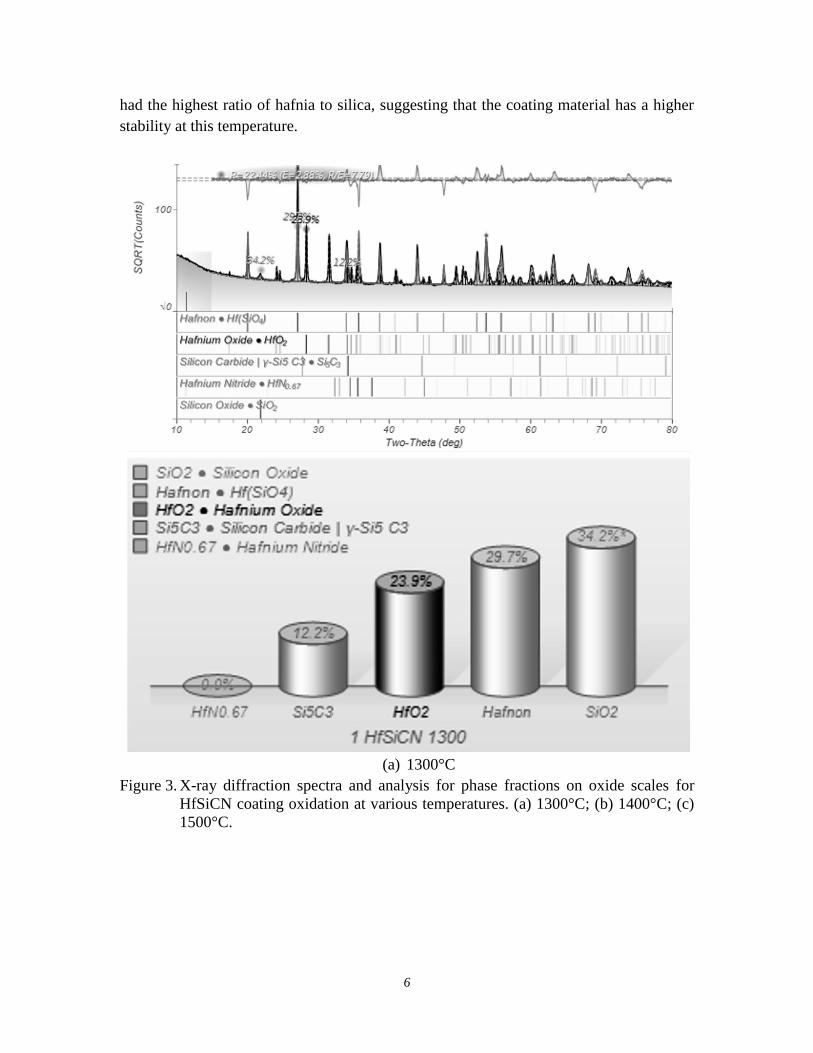
3.2 X-ray analysis
XRD analysis conducted on the samples from the first round of testing revealed
differences in scale compositions between the samples tested at different temperatures. The
X-ray phase analyses for the phase fractions after the oxidation are shown in Figure 3, and
results are also summarized in Table 1. Hafnia (silicon doped) is considered chemically
and thermally more stable than silica. In addition, hafnon (HfSiO4) is known to have a low
oxygen diffusivity, which makes it a more protective oxide scale component [7]. Based on
this information, the ratio of hafnia to silica present in each sample by weight percent was
used to evaluate the stability of the oxide layers that formed. The sample tested at 1400°C
y = -1723.5x + 0.1376R² = 0.8639
-1.25
-1.2
-1.15
-1.1
-1.05
-1
0.00066 0.00068 0.0007 0.00072 0.00074 0.00076 0.00078
ln(k
p),
mg2
/cm
4se
c
1/T, K-1
Arrhenius Plot Using Rate Constant from Last 30 Hours of Testing
6
had the highest ratio of hafnia to silica, suggesting that the coating material has a higher
stability at this temperature.
(a) 1300°C
Figure 3. X-ray diffraction spectra and analysis for phase fractions on oxide scales for
HfSiCN coating oxidation at various temperatures. (a) 1300°C; (b) 1400°C; (c)
1500°C.

7
(b) 1400°C
Figure 3. X-ray diffraction spectra and analysis for phase fractions on oxide scales for
HfSiCN coating oxidation at various temperatures. (a) 1300°C; (b) 1400°C; (c)
1500°C (Continued).

8
(c) 1500°C
Figure 3. X-ray diffraction spectra and analysis for phase fractions on oxide scales for
HfSiCN coating oxidation at various temperatures. (a) 1300°C; (b) 1400°C; (c)
1500°C (Continued).

9
Table 1. XRD Phase Analysis of Samples Tested at 1300°C, 1400°C, and 1500°C
for 100 hours, in flowing Oxygen
1300°C 1400°C 1500°C
Phase
Chemical
Formula
Weight
Percent
Phase
Chemical
Formula
Weight
Percent
Phase
Chemical
Formula
Weight
Percent
Hf(SiO4) 29.7 Hf(SiO4) 50.9 Hf(SiO4) 27.4
SiO2 34.2 SiO2 15.0 SiO2 61.5
HfO2 23.9 HfO2 33.2 HfO2 11.1
Si5C3 12.2 HfN 1.0
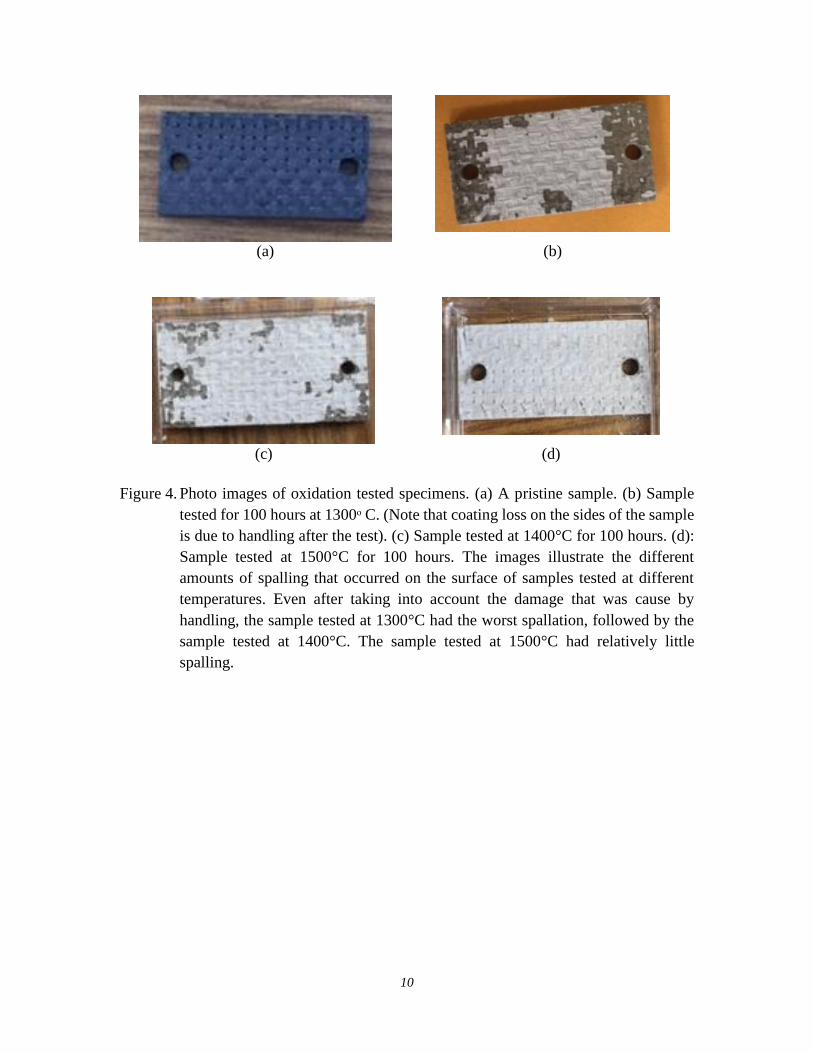
3.3 Optical and Microscopic Analysis
After TGA testing, all of the samples showed spalling, as shown in Figure 4. The
samples that were tested at a lower temperature had worse spalling that those tested at
higher temperatures, which supports the hypothesis that at a lower temperature, continuous,
strong protective scales are slower to form. Images from SEM analysis showed the
beginnings of spallation at a magnification of 500x (Figure 5). In addition to spalling, SEM
analysis also showed differences in the two sides of the sample. On each sample, the
‘smooth’ side had better fine spherical grains, while the ‘rough’ side showed parallel linear
shaped morphologies that are possibly a result of the more porous or detached SiC fibers
underneath the coating. The EDS analysis showed that there was less carbon and nitrogen
present on the rough side, which implies that the differences in texture might have caused
different oxidation rates, and higher amounts of material recession on the rough side as
gaseous oxides formed.
10
(a) (b)
(c) (d)
Figure 4. Photo images of oxidation tested specimens. (a) A pristine sample. (b) Sample
tested for 100 hours at 1300ᵒ C. (Note that coating loss on the sides of the sample
is due to handling after the test). (c) Sample tested at 1400°C for 100 hours. (d):
Sample tested at 1500°C for 100 hours. The images illustrate the different
amounts of spalling that occurred on the surface of samples tested at different
temperatures. Even after taking into account the damage that was cause by
handling, the sample tested at 1300°C had the worst spallation, followed by the
sample tested at 1400°C. The sample tested at 1500°C had relatively little
spalling.

11
(a) (b)
Figure 5. Scanning Electron Microscope (SEM) images of a 1500°C oxidation tested
specimen. Image (a) shows the ‘smooth’ side of the sample tested at 1500°C for
100 hours, while image (b) shows the ‘rough’ side of the same sample. One can
note the difference in grain texture, as well as the beginnings of spallation on the
‘smooth’ side.
It is important to discuss possible error in the EDS system, as it is not always the
most accurate method for composition analysis, particularly for light elements such as
carbon and nitrogen. The EDS system counted larger than expected atomic percent of
silicon even when directed at hafnia grains, which may be due to the fact that EDS
emissions penetrate the surface of the sample, and may have been incorporating the silicon
present in the substrate below the scales. Finally, while it is believable that boron detected
by the EDS system could have escaped from the CMC (boron is used in the processing of
the CMC), the atomic percent estimated by the system is not. This could be another effect
of the EDS recording composition below the surface, or error cause by a flaw in the
calibration of the system and a lack of standard available for comparison. To get better
data, it will be necessary to conduct other spectrometry tests that measure only on-surface
composition, perhaps using an Auger or X-ray Photoelectron Spectroscopy (XPS) system,
and using a quantitative Wavelength Dispersive Spectroscopy (WDS) system where better
peak resolutions can be obtained and also with composition standards and calibrations.
4. CONCLUSION
A series of TGA tests were conducted to study the oxidation kinetics of a
composition series of HfSiCN ceramic coating systems on Cf/SiC CMCs. Results showed
that the reactions follow an approximate parabolic rate law, where the reaction rate is
initially more rapid and then slows down, when more protective oxide scales form and
12
reduce further diffusion fluxes of oxygen and metal hafnium and silicon through the
coating scales. Samples tested at lower temperatures showed greater recession and spalling
because, at lower temperatures, the formation of the more protective oxide scales was
slower. Data collected from these tests was used to estimate the activation energy of the
oxidation reaction (approximately 14.3 kJ/mol). However, a higher activation energy is
possible when considering possible scale volatility at 1500°C. SEM, EDS, and XRD
analyses were also done after the TGA testing to characterize the coatings’ microstructures
and collect data on the composition of the oxide scale phases. The SEM/EDS system
revealed recession as constituents of the coating formed gaseous oxides, as well as the
spalling of the mechanically weaker oxide scales. XRD analysis showed that the samples
tested at 1400°C had the most favorable ratio of hafnia to silica scales, which, along with
the steadier reaction rate of samples tested at this condition, suggests that the material is
able to maintain stability at this temperature.
Further testing could be conducted using methods of spectroscopy more accurate
than EDS to characterize the oxide scale composition. In addition, identical TGA tests
should be conducted to improve the statistical integrity of calculated reaction constants and
activation energies.
AKNOWLEGEMENTS
The authors are grateful to John Setlock, who made all of the TGA testing possible,
and Bernadette J. (Sue) Puleo, who did the XRD analysis. We would also like to thank all
the members of the NASA Glenn Environmental Effects and Coatings Branch for their
kind willingness to answer questions and offer additional insight, as well as the NASA
Glenn Education Office for making this internship possible.

13
REFERENCES
[1] Zhu, D., Harder, B., Hurst, J. B., Good, B., Costa, G., Bhatt, R., and Fox, D.,
“Development of Advanced Environmental Barrier Coatings for SiC/SiC Ceramic Matrix
Composites: Path Towards 2700ᵒF Temperature Capability and Beyond,” presented at the
Conference on Composites, Materials, and Structures, Cocoa Beach, FL, 2017.
[2] Zhu, D., Hurst, J. B., NASA GRC. U.S. Patent Application, “Advanced High
Temperature and Fatigue resistant Environmental Barrier Coating Bond Coat Systems for
SiC/SiC Ceramic Matrix Composites” Publication No. US 2013/0344319, June 21. 2013.
[3] Luthra, K. L., “Some New Perspectives on Oxidation of Silicon carbide and Silicon
Nitride,” Journal of the American Ceramics Society, Vol. 74, No. 5, 1991, pp. 1095-1103.
[4] Ahlborg, N., and Zhu, D, “Silicon Carbide Nanotube Oxidation at High temperatures”
Ceramic Engineering and Science Proceedings, Vol. 33, No. 3, 2012, pp. 89-97.
[5] Douglass, D. L., Wagner, C., “The Oxidation of Oxygen Deficient Zirconia and Its
Relationship to the Oxidation of Zirconium”, Journal of the Electrochemical Society, Vol.
113, No. 7, pp. 671-676. July 1966.
[6] Pultz, W. W., “Oxidation of Submicroscopic Fibrous Silicon Carbide,” Journal of the
American Ceramics Society, Vol. 50, No. 8, 1967, pp. 419-420.
[7] Ionescu, E., Papendorf, B., Hans-Joachim, K., Riedel, R., “Polymer-Derived Silicon
Oxycarbide/Hafnia Ceramic Nanocomposites. Part II: Stability Toward Decomposition
and Microstructure evolution at T>>1000ᵒC,” Journal of the American Ceramics Society,
Vol. 93, No. 6, 2010, pp. 1783-1789.