Embed Size (px)
Citation preview
10
Oxidation Resistance of Nanocrystalline Alloys
Rajeev Kumar Gupta1, Nick Birbilis1 and Jianqiang Zhang2
1Department of Materials Engineering, Monash University, 2School of Materials Science & Engineering, The University of New South Wales,
Australia
1. Introduction
Nanocrystalline (nc) materials are single or multi-phase polycrystalline solids with a grain size of a few nanometers, typically less than 100 nm. Owing to the very fine grain size, the volume fraction of atoms located at grain boundaries or interfaces increases significantly in nanocrystalline materials [1]. A simple geometrical estimation, where the grains are assumed as spheres or cubes, yields the following values for the volume fraction of the interfaces: 50% for 5 nm grains, 30% for 10 nm grains and about 3% for 100 nm grains [2-5]. These values of interface volume fraction are several orders of magnitude higher than those of conventional microcrystalline materials. Consequently, nanocrystalline materials exhibit properties that are significantly different from and often improved over, their conventional microcrystalline (mc) counterparts. For example, nanocrystalline materials exhibit increased mechanical strength [6-10], enhanced diffusivity [11], improved corrosion resistance (some nanocrystalline materials) [12-20], optical, electrical and magnetic properties [21-24]. Due to their unique properties, nanocrystalline materials have attracted considerable research interests and the field of nanocrystalline materials has now become one of major identifiable activities in materials science and engineering.
Metals exposed to high temperature oxygen-containing environments form oxides. If an
oxide scale can form and the oxide is dense and adherent, then this scale can function as a
barrier isolating the metal from the external corrosive atmosphere. This oxide scale is called
protective oxide scale. On the other hand, if a non-protective oxide scale is formed, oxygen
can penetrate through the scale and the oxidation will extend further into the metal
substrate, causing a rapid metal recession. Of all oxides, chromia and alumina are two kinds
of oxides thermodynamically and kinetically feasible to meet the requirement for resisting
high temperature oxidation.
Alloys containing aluminium or chromium can be selectively oxidised to form alumina or chromia. To form an external oxide scale, the concentration of aluminium or chromium should reach a critical value. Nanocrystalline alloys promote this selective oxidation process by reducing the critical value. For example, in the conventional microcrystalline Ni-20Cr-Al alloy system, > 6 wt% Al is required to form a protective Al2O3 scale at 1000°C [25]. If the Al content is lower than 6 wt%, complex oxide mixtures consisting of Cr2O3, NiCr2O4 and internal Al2O3 form, resulting in high reaction rates and poor oxidation resistance. With a nano-crystalline alloy structure, this value can be substantially reduced to 2 wt% Al, when
www.intechopen.com

Corrosion Resistance
214
the grain size is 60 nm [26]. This promotion effect is also evident for the K38G alloy containing 3.5-4 wt% Al and 16% Cr, which forms external Cr2O3 scale and internal Al2O3 precipitates in the cast form (large grains) but only Al2O3 when in the form of sputtered nano-crystalline structure [27-30].
The unique structure and high grain boundary fraction, enhances diffusion of impurities and alloying elements, and changes materials thermodynamic properties [31-33] which are expected to cause a considerable difference in the resistance of nanocrystalline materials to environmental degradation (oxidation) at high temperatures. For practical application of these nanocrystalline materials, an acceptable level of resistance to environmental degradation is required. However, the effect of the nanocrystalline structure on the high-temperature oxidation resistance has attracted only a limited research attention. Oxidation resistance of nanocrystalline Ni-Cr-Al [34-36], Fe-Cr [37-39], and Zr [40-43] based alloys have been mainly investigated and in most of the cases, oxidation resistance has been reported to improve due to nanocrystalline structure.
The properties of oxides (Al2O3, SiO2 or Cr2O3) formed during oxidation [44,45,46] also depend upon the grain size of the alloy and nanocrystalline structure alters the properties of oxide. For example, more uniform oxide scale with finer grain size and higher Cr or Al content is formed on the nanocrystalline alloys [34-36]. The oxide scales formed from nanocrystalline materials exhibit enhanced plastic deformation (due to fine grain size of formed oxide), which can release the stresses accumulated in the scales, and therefore the scale spallation tendency is reduced. It was reported that cyclic and long-time oxidation resistance was significantly improved by applying nanocrystalline coatings on type 304 stainless steel [47,48], Ni-Cr-Al [27], Co-Cr-Al [49], and Ni-(Co)-Cr-Al [28-30].
In order to investigate the possible differences in oxidation resistance along with any underlying mechanisms, understanding the nanocrystalline structure of a material is essential. This chapter will therefore first describe the structure of nanocrystalline materials, their thermodynamic properties and the possible effects of changes in the material structure (caused by such fine grain size) that may influence the oxidation resistance of a material.
2. Structure and properties of nanocrystalline alloys
2.1 Dual phase model
The unique properties of nanocrystalline materials are associated with very fine grain size, whereby, depending upon the grain size, interfaces can include up to 50% of the atoms in the material [2-5]. Therefore determination of the structure and associated properties of individual features of a nanocrystalline structure becomes very important. Various models representing the structure of nanocrystalline materials, such as “gas like” model as suggested by Birringer et al. [5] and a ”frozen gas like” model suggested later [1,50], are proposed in the literature. However, the structure of nc-materials, in general, may be described as a composition of two components: a crystalline component (CC), which is formed by small equiaxed single crystals each with random crystallographic orientations and the intercrystalline component (IC), which is formed by the interfaces between the crystallites (grain boundaries) and intersection points of these interfaces (triple junctions). The second component may be characterized by the reduced atomic density and inter-atomic spacing deviating from those in the perfect crystal lattice. The IC surrounds the
www.intechopen.com
Oxidation Resistance of Nanocrystalline Alloys
215
nanometer-sized crystals and forms a network between them [1,21]. As grain size reduces, the IC increases and it may even exceed CC.
Various researchers support the view of the two phase model of nanocrystalline metals. For example, extended x-ray-adsorption fine structure (EXAFS) and Mössbauer spectroscopy of ball-milled iron indicated the presence of two phases as characterized by significantly different atomic arrangements. These different atomic arrangements can be attributed to the presence of interfacial region and crystalline region [51]. Similarly, EXFAS investigation of nanocrystalline Fe and Pd indicated a large reduction in the atomic coordination number, supporting the idea of a very disordered structure at the interfaces [52-56]. Positron-lifetime spectroscopy measurements showed a large density of vacancy-like defects in grain boundaries and relatively large free volume at the triple points arising from misorientation-induced atomic instability of these sites [57]. Elastic relaxation of the interfaces occurred with a very different parameter than conventional coarse grain size polycrystalline materials. Modelling of thermoplastic properties and structure demonstrates that two phase model is an appropriate mean to account for the vibrational density of states and excess energy density in terms of grain boundary [58]. Similar to experimental findings, computer simulation of nanocrystalline iron has shown that grain boundary component in nanocrystalline material is very high and is a strong function of grain size [59,60].
In discussing the structure of nanocrystalline materials further, the following terminology will be used in the text. Three types of grain contacts are possible in a polycrystalline material. They include, a) contact surfaces, b) contact lines and c) contact points. Surfaces of two grains which contact one another are called as contact interfaces. A contact line may represent a common line for three or more adjacent grains. A contact line of three grains is called triple junction. The boundary of grain is its surfaces. Grain boundaries which are seen in the metallographic slides are the section of interfaces by slide plane. A triple point is a section of triple junction by a plane. A detailed description of the terminology used here can be found elsewhere [61].
2.2 Volume fraction of crystalline and intercrystalline regions
Mutschele and Kirchheim [62] proposed following relation to evaluate the volume fraction (Cic) of nanocrystalline materials associated with intercrystalline regions,
3 /icC d (1)
where, is the average grain boundary thickness and d is the average diameter of the grains
and grains are considered to be cubes. Later, Palumbo et. al. [2] have shown that equation 1
was not suitable for the calculation of volume associated with triple points and to make it more
general (to account for the triple points associated with the intercrystalline component) they
proposed following relationship for the calculation of the intercrystalline component ( ictV ):
3
1ict
dV
d
(2)
where, d is the maximum diameter of an inscribed sphere. This yields the following relation
for grain boundary volume fraction ( gbtV ),
www.intechopen.com
Corrosion Resistance
216
2
3
3 ( )gbt
dV
d
(3)
The volume fraction associated with triple points (Vttp) is then given by,
tp gbict t tV V V (4)
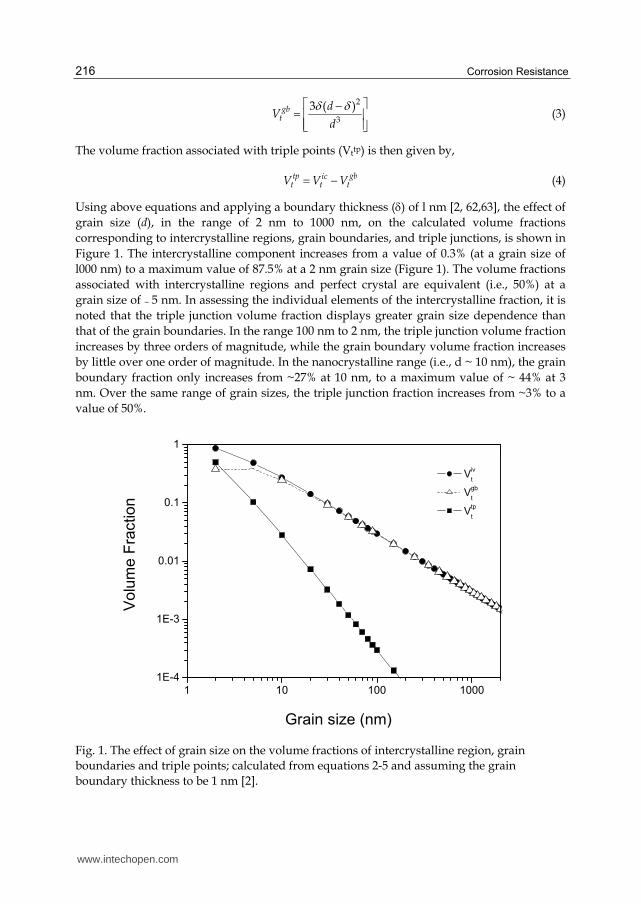
Using above equations and applying a boundary thickness () of l nm [2, 62,63], the effect of
grain size (d), in the range of 2 nm to 1000 nm, on the calculated volume fractions
corresponding to intercrystalline regions, grain boundaries, and triple junctions, is shown in
Figure 1. The intercrystalline component increases from a value of 0.3% (at a grain size of
l000 nm) to a maximum value of 87.5% at a 2 nm grain size (Figure 1). The volume fractions
associated with intercrystalline regions and perfect crystal are equivalent (i.e., 50%) at a
grain size of ~ 5 nm. In assessing the individual elements of the intercrystalline fraction, it is
noted that the triple junction volume fraction displays greater grain size dependence than
that of the grain boundaries. In the range 100 nm to 2 nm, the triple junction volume fraction
increases by three orders of magnitude, while the grain boundary volume fraction increases
by little over one order of magnitude. In the nanocrystalline range (i.e., d ~ 10 nm), the grain
boundary fraction only increases from ~27% at 10 nm, to a maximum value of ~ 44% at 3
nm. Over the same range of grain sizes, the triple junction fraction increases from ~3% to a
value of 50%.
Fig. 1. The effect of grain size on the volume fractions of intercrystalline region, grain
boundaries and triple points; calculated from equations 2-5 and assuming the grain
boundary thickness to be 1 nm [2].
1 10 100 1000
1E-4
1E-3
0.01
0.1
1
Viv
t
Vgb
t
Vtp
t
Volu
me F
raction
Grain size (nm)
www.intechopen.com
Oxidation Resistance of Nanocrystalline Alloys
217
Based on Figure 1, properties which are influenced by the grain boundary and triple points are expected to be altered significantly when grain size is refined to, or below, 100 nm. The effect of triple points is more pronounced when the grain size is less than 10 nm; consequently material properties with grain size less than 10 nm would be significantly different than those with grain size > 10 nm.
2.3 Thermodynamic properties of nanocrystalline materials
Many researchers have described grain boundaries in nanocrystalline materials as more
disordered than those in conventional microcrystalline materials [64-67]. For example,
investigations on nanocrystalline Fe have demonstrated that grain boundaries in
nanocrystalline Fe differ significantly from the grain boundaries in conventional
polycrystalline Fe [64-69]. Thermodynamic properties (specific heat at constant pressure,
heat of fusion and stored enthalpy) of ball-milled Fe and other nanocrystalline materials,
investigated by Fecht suggested [64-69] that the grain boundaries’ energy in nanocrystalline
materials to be considerably greater than in the case of equilibrated grain boundaries in
microcrystalline materials. In conventional polycrystalline materials, grain boundary
energy, as determined by experiments, as well as static and dynamic simulations, is
approximately 1 J/m2, whereas, this value soars to 4 J/m2 in nanocrystalline materials [70-
75].
Significantly different thermodynamic properties of nanocrystalline materials are expected
to increase the Gibbs free energy of the materials alloys which can be represented as per
following relationship:
G= gbtV .Ggb+ tp
tV .Gtp+ cctV .Gcc (5)
where, Ggb, Gtp and Gcc are the standard gibbs free energies of grain boundaries, triple points
and grains.
Increases in the interfacial energy may lead to a significant increase in the free energy which
can be described simply as (neglecting second order contributions due to specific heat
differences):
ΔG= ΔH –TΔS (6)
Enthalpy difference, ΔH, is shown to be quite higher in nanocrystalline materials than
conventional microcrystalline materials. For example it has been shown that ΔH of
nanocrystalline Fe increases with decrease in grain size [64-67,76]. Similar behaviour was
reported for nanocrystalline copper as well. For example, nanocrystalline Cu, prepared as a
powder by vapour deposition followed by compaction releases 300 J/mol at 430K when
analysed immediately after compaction and 53 J/mol at 450K when analysed five days after
preparation. Such values of enthalpy release have also been confirmed by a study on
nanocrystalline Cu prepared by electrodeposition and cold rolling [77-79]. Comparison of
these data show that nanocrystalline materials are far from equilibrium, not only because
they contain a large amount of interfaces but also because these interfaces are not
equilibrated. Therefore, these materials should have high value of free energy which may
result in higher reaction rate at the nanocrystalline surfaces.
www.intechopen.com
Corrosion Resistance
218
The total free energy also depends upon entropy term (equation 1), however, evaluation ΔS
is not straightforward since there is a little reported in the literature on the entropy
contribution from grain boundaries and interfaces for crystals of any size. Although it is
expected that this entropy contribution is small and it can also be conceived that non-
equilibrated grain boundaries have higher entropy. A value of 0.36 mJ/m2 K has been
estimated for as-prepared nanocrystalline Pt, in contrast to the value for conventional grain
boundaries of 0.18 mJ/m2 K [80]. In fact, the excess entropy per atom sitting in a grain
boundary is a substantial part of the entropy of fusion, but the overall entropy per mole of
substance sums up to a limited amount even for materials with very small grains. Using this
knowledge of enthalpy and entropy, the free energy of nanocrystalline copper has been
reported to be higher than that of coarse grain copper [80,81].
2.4 Diffusion in nanocrystalline materials
In general, atomic transport in nanocrystalline materials differs substantially from that in
coarse-grained material, due to the crystallite interfaces providing paths of high diffusivity.
In conventional microcrystalline materials, crystal volume self-diffusion or substitutional
diffusion dominates, at least at temperatures higher than approximately half of the melting
temperature. Interface diffusion, in combination with a high fraction of atoms in interfaces,
gives rise to modified physical properties of nanocrystalline solids. Furthermore, diffusion
processes may control the formation of nanocrystalline materials, for example, by means of
crystallization of amorphous precursors, as well as the stability of nanocrystalline materials
(relaxation, crystallite growth), their reactivity, corrosion behaviour, or interaction with
gases. The relevance of diffusion-controlled processes demands a comprehensive
understanding of atomic diffusion in nanocrystalline materials. Detailed discussion of the
diffusion processes in the nanocrystalline material is out of the scope. For the readers
interest it could be found elsewhere [82-85]. A recent study on nanocrystalline Fe has shown
that the diffusion coefficient of Cr in Fe can be enhanced by several orders of magnitude by
reducing the grain size to nanometer level [11].
Diffusion in a material can be expressed as the combined effect of diffusion through the
grain boundaries and lattice diffusion and can be written as:
経喋 噺 血経直長 髪 岫な 伐 血岻経長 → 経喋 噺 血盤経直長 伐 経長匪 髪 経長 (7)
where, f is the grain boundary fraction, Dgb is the grain boundary diffusion coefficient and
Db is the bulk diffusion coefficient of B in the alloy. Assuming the cubic shape of grains, the
grain boundary area fraction (f) can be calculated as per equation (1). Because Dgb is much
larger than Db, the effective diffusion coefficient of nanomaterials increases significantly by
their high area proportion of grain boundaries.
3. Factors effecting the oxidation behavior of a nanocrystalline alloy
An effective protection of metallic materials against high temperature oxidation is based on
the protective oxide scale which acts as diffusion barrier, isolating the material from the
aggressive atmosphere. The principle is simple, however its application is complex; to act as
a real barrier the oxide film needs to be dense and homogenous and has to cover entire
www.intechopen.com
Oxidation Resistance of Nanocrystalline Alloys
219
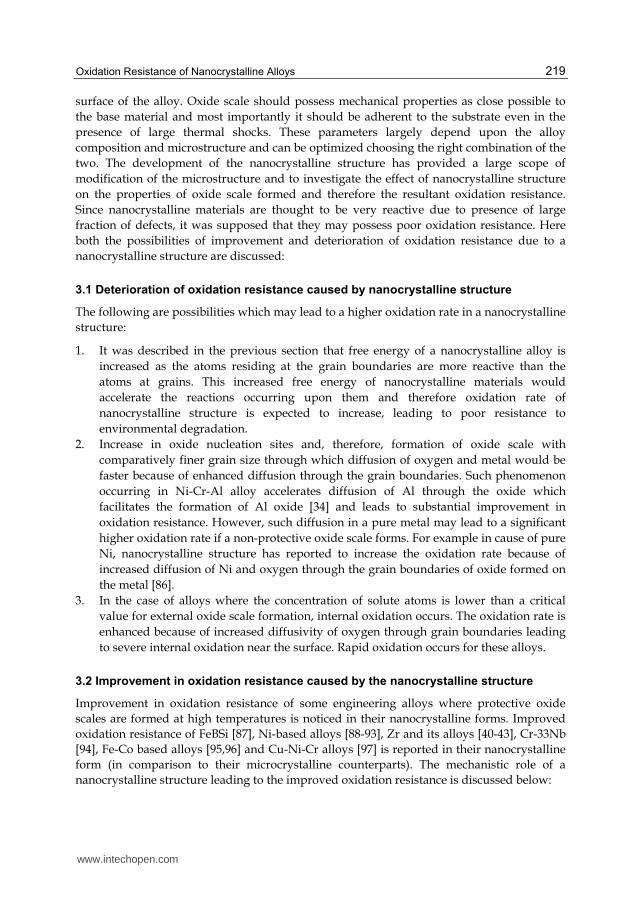
surface of the alloy. Oxide scale should possess mechanical properties as close possible to
the base material and most importantly it should be adherent to the substrate even in the
presence of large thermal shocks. These parameters largely depend upon the alloy
composition and microstructure and can be optimized choosing the right combination of the
two. The development of the nanocrystalline structure has provided a large scope of
modification of the microstructure and to investigate the effect of nanocrystalline structure
on the properties of oxide scale formed and therefore the resultant oxidation resistance.
Since nanocrystalline materials are thought to be very reactive due to presence of large
fraction of defects, it was supposed that they may possess poor oxidation resistance. Here
both the possibilities of improvement and deterioration of oxidation resistance due to a
nanocrystalline structure are discussed:
3.1 Deterioration of oxidation resistance caused by nanocrystalline structure
The following are possibilities which may lead to a higher oxidation rate in a nanocrystalline
structure:
1. It was described in the previous section that free energy of a nanocrystalline alloy is
increased as the atoms residing at the grain boundaries are more reactive than the
atoms at grains. This increased free energy of nanocrystalline materials would
accelerate the reactions occurring upon them and therefore oxidation rate of
nanocrystalline structure is expected to increase, leading to poor resistance to
environmental degradation.
2. Increase in oxide nucleation sites and, therefore, formation of oxide scale with
comparatively finer grain size through which diffusion of oxygen and metal would be
faster because of enhanced diffusion through the grain boundaries. Such phenomenon
occurring in Ni-Cr-Al alloy accelerates diffusion of Al through the oxide which
facilitates the formation of Al oxide [34] and leads to substantial improvement in
oxidation resistance. However, such diffusion in a pure metal may lead to a significant
higher oxidation rate if a non-protective oxide scale forms. For example in cause of pure
Ni, nanocrystalline structure has reported to increase the oxidation rate because of
increased diffusion of Ni and oxygen through the grain boundaries of oxide formed on
the metal [86].
3. In the case of alloys where the concentration of solute atoms is lower than a critical
value for external oxide scale formation, internal oxidation occurs. The oxidation rate is
enhanced because of increased diffusivity of oxygen through grain boundaries leading
to severe internal oxidation near the surface. Rapid oxidation occurs for these alloys.
3.2 Improvement in oxidation resistance caused by the nanocrystalline structure
Improvement in oxidation resistance of some engineering alloys where protective oxide
scales are formed at high temperatures is noticed in their nanocrystalline forms. Improved
oxidation resistance of FeBSi [87], Ni-based alloys [88-93], Zr and its alloys [40-43], Cr-33Nb
[94], Fe-Co based alloys [95,96] and Cu-Ni-Cr alloys [97] is reported in their nanocrystalline
form (in comparison to their microcrystalline counterparts). The mechanistic role of a
nanocrystalline structure leading to the improved oxidation resistance is discussed below:
www.intechopen.com
Corrosion Resistance
220
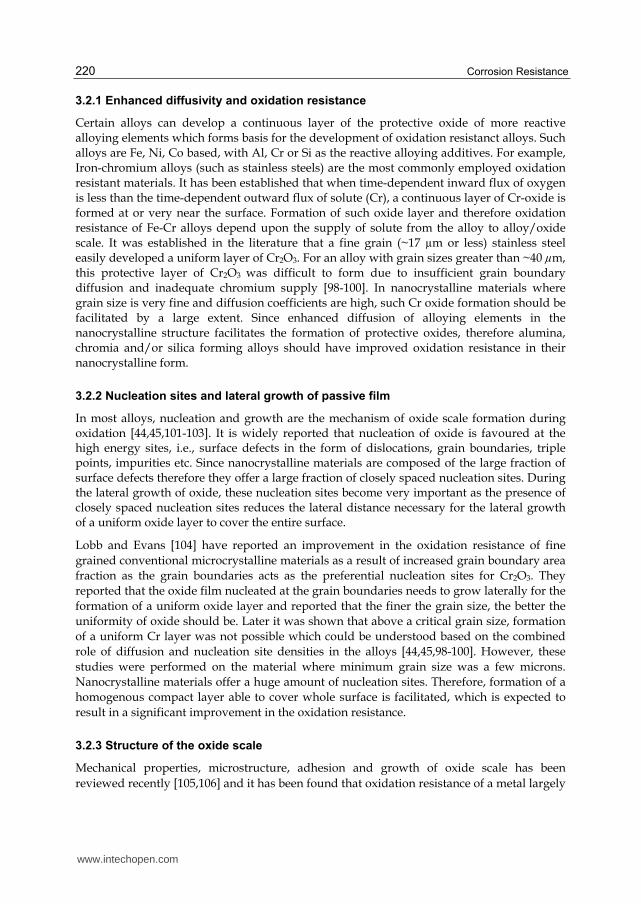
3.2.1 Enhanced diffusivity and oxidation resistance
Certain alloys can develop a continuous layer of the protective oxide of more reactive alloying elements which forms basis for the development of oxidation resistanct alloys. Such alloys are Fe, Ni, Co based, with Al, Cr or Si as the reactive alloying additives. For example, Iron-chromium alloys (such as stainless steels) are the most commonly employed oxidation resistant materials. It has been established that when time-dependent inward flux of oxygen is less than the time-dependent outward flux of solute (Cr), a continuous layer of Cr-oxide is formed at or very near the surface. Formation of such oxide layer and therefore oxidation resistance of Fe-Cr alloys depend upon the supply of solute from the alloy to alloy/oxide scale. It was established in the literature that a fine grain (~17 µm or less) stainless steel easily developed a uniform layer of Cr2O3. For an alloy with grain sizes greater than ~40 µm, this protective layer of Cr2O3 was difficult to form due to insufficient grain boundary diffusion and inadequate chromium supply [98-100]. In nanocrystalline materials where grain size is very fine and diffusion coefficients are high, such Cr oxide formation should be facilitated by a large extent. Since enhanced diffusion of alloying elements in the nanocrystalline structure facilitates the formation of protective oxides, therefore alumina, chromia and/or silica forming alloys should have improved oxidation resistance in their nanocrystalline form.
3.2.2 Nucleation sites and lateral growth of passive film
In most alloys, nucleation and growth are the mechanism of oxide scale formation during oxidation [44,45,101-103]. It is widely reported that nucleation of oxide is favoured at the high energy sites, i.e., surface defects in the form of dislocations, grain boundaries, triple points, impurities etc. Since nanocrystalline materials are composed of the large fraction of surface defects therefore they offer a large fraction of closely spaced nucleation sites. During the lateral growth of oxide, these nucleation sites become very important as the presence of closely spaced nucleation sites reduces the lateral distance necessary for the lateral growth of a uniform oxide layer to cover the entire surface.
Lobb and Evans [104] have reported an improvement in the oxidation resistance of fine
grained conventional microcrystalline materials as a result of increased grain boundary area
fraction as the grain boundaries acts as the preferential nucleation sites for Cr2O3. They
reported that the oxide film nucleated at the grain boundaries needs to grow laterally for the
formation of a uniform oxide layer and reported that the finer the grain size, the better the
uniformity of oxide should be. Later it was shown that above a critical grain size, formation
of a uniform Cr layer was not possible which could be understood based on the combined
role of diffusion and nucleation site densities in the alloys [44,45,98-100]. However, these
studies were performed on the material where minimum grain size was a few microns.
Nanocrystalline materials offer a huge amount of nucleation sites. Therefore, formation of a
homogenous compact layer able to cover whole surface is facilitated, which is expected to
result in a significant improvement in the oxidation resistance.
3.2.3 Structure of the oxide scale
Mechanical properties, microstructure, adhesion and growth of oxide scale has been
reviewed recently [105,106] and it has been found that oxidation resistance of a metal largely
www.intechopen.com
Oxidation Resistance of Nanocrystalline Alloys
221
depends upon their physical properties (e.g., crystal size, morphology and crystallographic
orientation of oxides formed, lattice mismatch with the base metal, adhesion of oxide layer)
of oxide [105,106]. For example, fine grained oxide scales often show a fast creep rate at high
temperatures, releasing the stresses accumulated in the scales and, therefore, decrease in
scale spallation tendency. This may have important implication in reducing the spallation of
oxides at high temperature. Since nanocrystalline materials provide several orders of
magnitude more nucleation sites than the microcrystalline materials therefore grain size of
the oxide developed on nanocrystalline materials is expected to be finer. This finer grain size
of oxide suppresses oxide scale spallation in nanocrystalline form. This effect has been
demonstrated in high temperature oxidation tests of several nanocrystalline alloys [27-
30,47].
It was also proposed that fine nano-sized oxide structure reduces conductivity which
suppresses the transport of the oxidizing species, enhancing oxidation resistance. This
proposal was successfully used to explain improved oxidation resistance of Zr and Zr based
alloys [107]. However, it is not clear if this model also applies for other alloys.
It is important to note that the above factors can operate both indifferently and in
combination [12]. The nature of the influence of nanostructure on the diffusion-assisted
corrosion (viz., high temperature oxidation) depends on the role of the predominantly
diffusing species in a given alloy. For example, oxidation resistances of an iron-
aluminide and an Fe-B-Si alloy in the nanocrystalline state are reported to be superior to
that in their microcrystalline state [87,108]. This behaviour is attributed to Al and Si, the
well-known protective oxide film formers, being the predominantly diffusing species
respectively in the two alloys, and the nanostructure facilitating their diffusion and
expedited formation of protective films (of Al/Si oxide). Therefore, it is important to
consider all the factors effecting the oxidation resistant, and the net effect of all the
parameters would determine the change in the oxidation rate caused by nanocrystalline
structure.
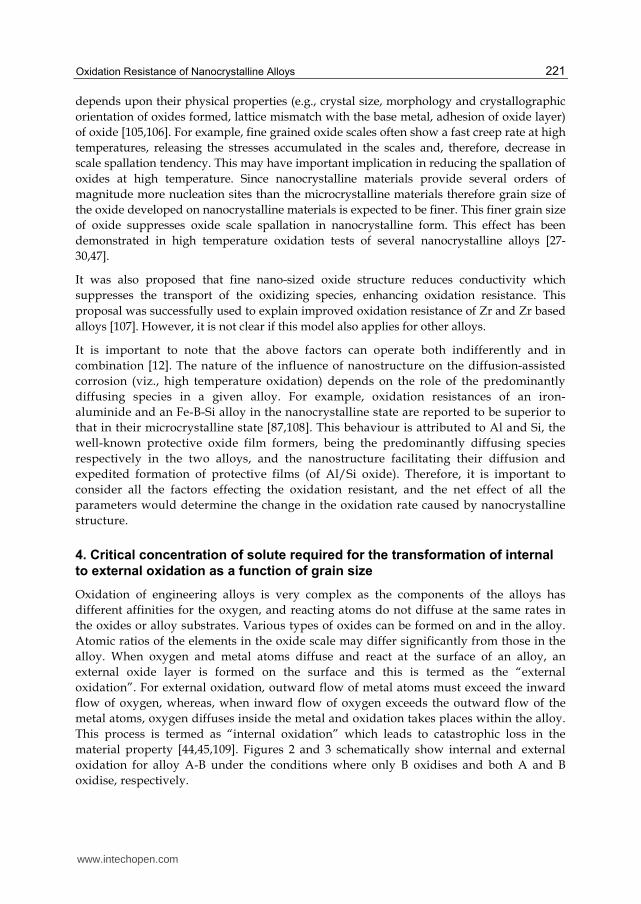
4. Critical concentration of solute required for the transformation of internal
to external oxidation as a function of grain size
Oxidation of engineering alloys is very complex as the components of the alloys has
different affinities for the oxygen, and reacting atoms do not diffuse at the same rates in
the oxides or alloy substrates. Various types of oxides can be formed on and in the alloy.
Atomic ratios of the elements in the oxide scale may differ significantly from those in the
alloy. When oxygen and metal atoms diffuse and react at the surface of an alloy, an
external oxide layer is formed on the surface and this is termed as the “external
oxidation”. For external oxidation, outward flow of metal atoms must exceed the inward
flow of oxygen, whereas, when inward flow of oxygen exceeds the outward flow of the
metal atoms, oxygen diffuses inside the metal and oxidation takes places within the alloy.
This process is termed as “internal oxidation” which leads to catastrophic loss in the
material property [44,45,109]. Figures 2 and 3 schematically show internal and external
oxidation for alloy A-B under the conditions where only B oxidises and both A and B
oxidise, respectively.
www.intechopen.com
Corrosion Resistance
222
A +
BO A-B alloy
a)
BO A-B alloy
b)
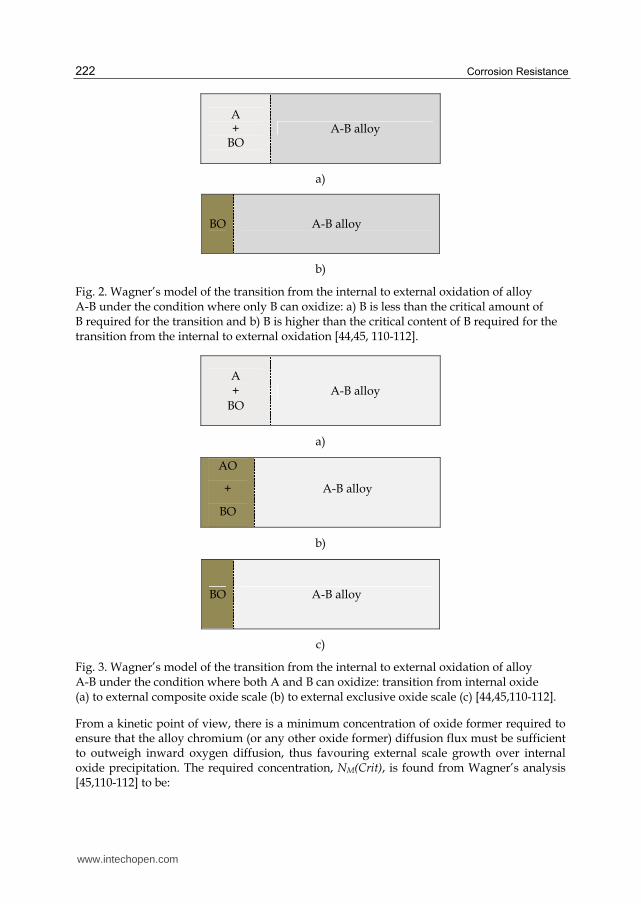
Fig. 2. Wagner’s model of the transition from the internal to external oxidation of alloy A-B under the condition where only B can oxidize: a) B is less than the critical amount of B required for the transition and b) B is higher than the critical content of B required for the transition from the internal to external oxidation [44,45, 110-112].
A +
BO A-B alloy
a)
AO
+
BO
A-B alloy
b)
BO A-B alloy
c)
Fig. 3. Wagner’s model of the transition from the internal to external oxidation of alloy A-B under the condition where both A and B can oxidize: transition from internal oxide (a) to external composite oxide scale (b) to external exclusive oxide scale (c) [44,45,110-112].
From a kinetic point of view, there is a minimum concentration of oxide former required to ensure that the alloy chromium (or any other oxide former) diffusion flux must be sufficient to outweigh inward oxygen diffusion, thus favouring external scale growth over internal oxide precipitation. The required concentration, NM(Crit), is found from Wagner’s analysis [45,110-112] to be:
www.intechopen.com
Oxidation Resistance of Nanocrystalline Alloys
223
軽喋岫系堅件建な岻 噺 磐直.訂戴 . 蝶豚遁蝶遁捺 . 朝捺岫濡岻帖捺帖遁 卑怠/態
(8)
Here 軽潮岫鎚岻経潮 is the oxygen permeability in the alloy matrix, 撃凋喋, 撃喋潮 are the molar volumes
of alloy and oxide, DB is the diffusion coefficient of chromium or aluminium in the alloy,
and g the critical volume fraction of oxide required to form a continuous layer. According to
this equation, the critical value for external chromia formation in Ni-Cr at 1000°C is
NCr = 0.29 and for alumina formation in Ni-Al at 1200°C is NAl = 0.11 [45], both in agreement
with the experimental measurements. The requirement for these relatively large
concentrations of Cr or Al to form a complete protective scale will, in many cases, change
other alloy properties, which limits the applicability of this approach, particularly at lower
temperatures.
No sooner has the continuous scale of chromia or alumina become established than the
steady-state growth of this oxide starts. For chromia/alumina scale growth to be
maintained, an alloy must supply chromium/aluminium by diffusion from its interior at a
rate sufficient to balance the rate at which the metal is consumed in forming new oxide.
Wagner’s diffusional analysis [112] leads to the requirement:
軽喋岫系堅件建に岻 噺 蝶豚遁蝶遁捺岾訂賃妊態帖遁 峇怠/態
(9)
where 撃凋喋, 撃喋潮 are the molar volumes of alloy and oxide, kp is the parabolic rate constant
for scale thickening:
x2 = 2kpt (10)
with x the scale thickness formed in time, t, and DB the alloy interdiffusion coefficient. The
quantity NB(Crit2) is the minimum original alloy chromium concentration necessary to
supply metal to the alloy-scale interface fast enough to support exclusive chromia scale
growth.
To avoid internal oxidation and maintain external chromia/alumina scale, the concentration
of aluminium/chromium should be higher than both NB(Crit1) and NB(Crit2). In
nanocrystalline materials, DB could be very high [11,12] according to Eqn 6, and therefore
both NB(Crit1) and NB(Crit2) decrease significantly which will lead to substantial increase in
the formation of a protective alumina/chromia external scale, therefore increased oxidation
resistance. Assuming the alloy grains are cubic, the area proportion of grain boundary f can
be calculated f=2/d. Also considering Dgb>>Db, Eqn 7 can be simplified as [113]:
軽喋岫系堅件建な岻 噺 畦岫経長 髪 態弟鳥 経直長岻貸怠/態 (11)
where
畦 噺 岫直訂朝捺岫濡岻帖捺蝶豚遁態蝶遁捺岻怠/態,
thus reduction in grain size results in the reduction of NB(Crit1).
Using Equations (1) and (6), the critical concentration NB(Crit2) is calculated as:
www.intechopen.com
Corrosion Resistance
224
軽喋岫潔堅件建に岻 噺 稽. 岾経長 髪 態弟鳥 経直長 伐 態弟鳥 経長峇貸迭鉄 噺 稽 嵜 √鳥謬態弟盤帖虹弐貸帖弐匪袋鳥.帖弐崟 (12)
Where,
B=諾澱田諾田菟
岾窒谷東態 峇怠/態.
At a given temperature and external oxygen partial pressure, NB (crit1) and NB (crit2) are a
function of only grain size (d) of the alloy, diffusion coefficients (Dgb and Db) and grain
boundary width (δ) of the alloy.
The critical concentration of B required, where only bulk diffusion can control the oxidation
(i.e., the area fraction of grain boundary is very small such that D=Db), can be calculated as:
軽墜喋岫潔堅件建に岻 噺 稽. 岫経長岻貸迭鉄 and 軽墜喋岫潔堅件建な岻 噺 畦. 岫経長岻貸迭鉄 (13)
From equations (10), (11) and (12), for an alloy of grain size, d, the ratio (X), critical
concentration of B required for external oxidation in material with a grain size d to that
when the bulk diffusion coefficient dominates, can be given as:
隙 噺 朝遁岫頂追沈痛怠岻朝任遁岫頂追沈痛怠岻 噺 朝遁岫頂追沈痛態岻朝任遁岫頂追沈痛態岻 噺 俵 鳥態弟磐呑虹弐呑弐 貸怠卑袋鳥 噺 俵 怠捗磐呑虹弐呑弐 貸怠卑袋怠 (14)
Since, the values of Dgb and Db are available from the literature, the value of X can be
calculated as a function of grain size, time and temperature. Above relationship may be very
useful in comparing the change in the critical amount of B (Al or Cr) caused by
nanocrystalline structure at a given temperature.
Given that the critical amount of B (NB(crit1)) required for a material with grain size d0 is w,
according to equation (13), the ratio for the critical amount of B required for a grain size of d
to that for the grain size d0 can be expressed as X’:
隙嫗 噺 朝遁栂 噺 謬鳥岫態弟盤帖虹弐貸帖弐匪袋鳥轍.帖弐岻鳥轍岫態弟盤帖虹弐貸帖弐匪袋鳥.帖弐岻 (15)
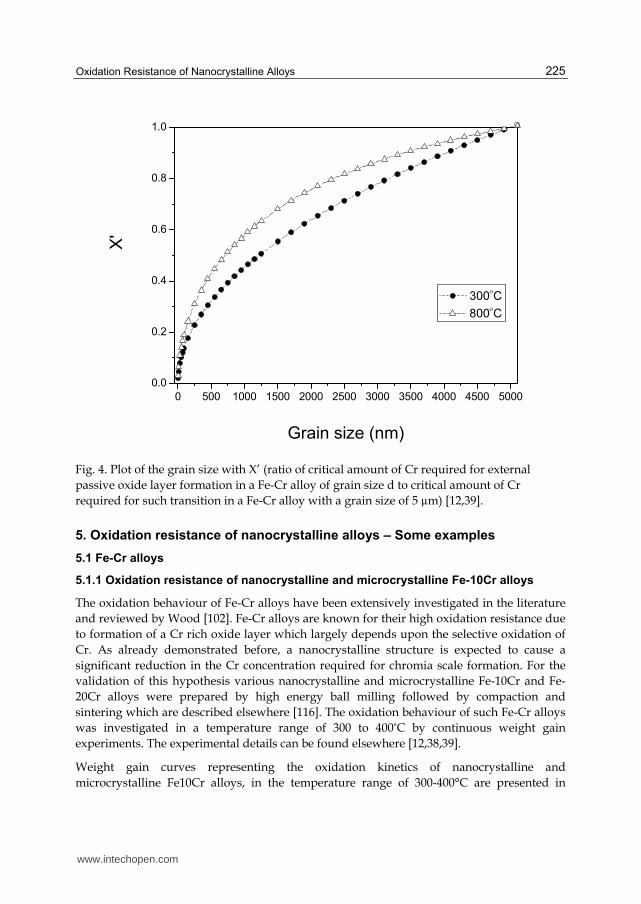
For Fe-Cr alloy, X’ is calculated based on available data listed in the Table 1 (extrapolated
from the literature [114,115] with d0 assumed to be 5 micron, and plotted it as a function of
grain size in Fig 4. Figure 4 clearly shows that Cr required for such transition decreases
substantially when grain size is below 100 nm.
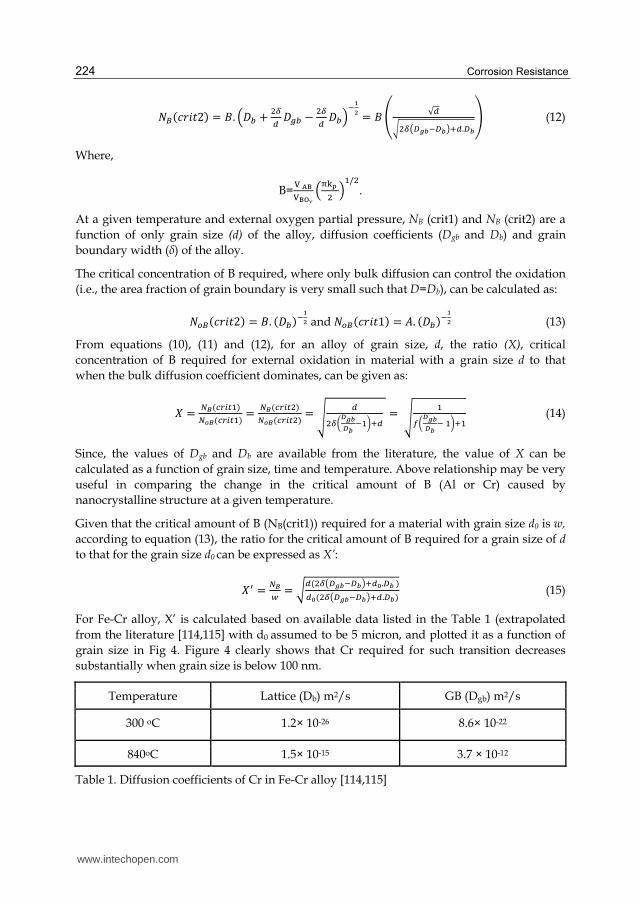
Temperature Lattice (Db) m2/s GB (Dgb) m2/s
300 oC 1.2× 10⁻²⁶ 8.6× 10⁻²²
840oC 1.5× 10⁻¹⁵ 3.7 × 10⁻¹²
Table 1. Diffusion coefficients of Cr in Fe-Cr alloy [114,115]
www.intechopen.com
Oxidation Resistance of Nanocrystalline Alloys
225
Fig. 4. Plot of the grain size with X’ (ratio of critical amount of Cr required for external
passive oxide layer formation in a Fe-Cr alloy of grain size d to critical amount of Cr
required for such transition in a Fe-Cr alloy with a grain size of 5 µm) [12,39].
5. Oxidation resistance of nanocrystalline alloys – Some examples
5.1 Fe-Cr alloys
5.1.1 Oxidation resistance of nanocrystalline and microcrystalline Fe-10Cr alloys
The oxidation behaviour of Fe-Cr alloys have been extensively investigated in the literature
and reviewed by Wood [102]. Fe-Cr alloys are known for their high oxidation resistance due
to formation of a Cr rich oxide layer which largely depends upon the selective oxidation of
Cr. As already demonstrated before, a nanocrystalline structure is expected to cause a
significant reduction in the Cr concentration required for chromia scale formation. For the
validation of this hypothesis various nanocrystalline and microcrystalline Fe-10Cr and Fe-
20Cr alloys were prepared by high energy ball milling followed by compaction and
sintering which are described elsewhere [116]. The oxidation behaviour of such Fe-Cr alloys
was investigated in a temperature range of 300 to 400°C by continuous weight gain
experiments. The experimental details can be found elsewhere [12,38,39].
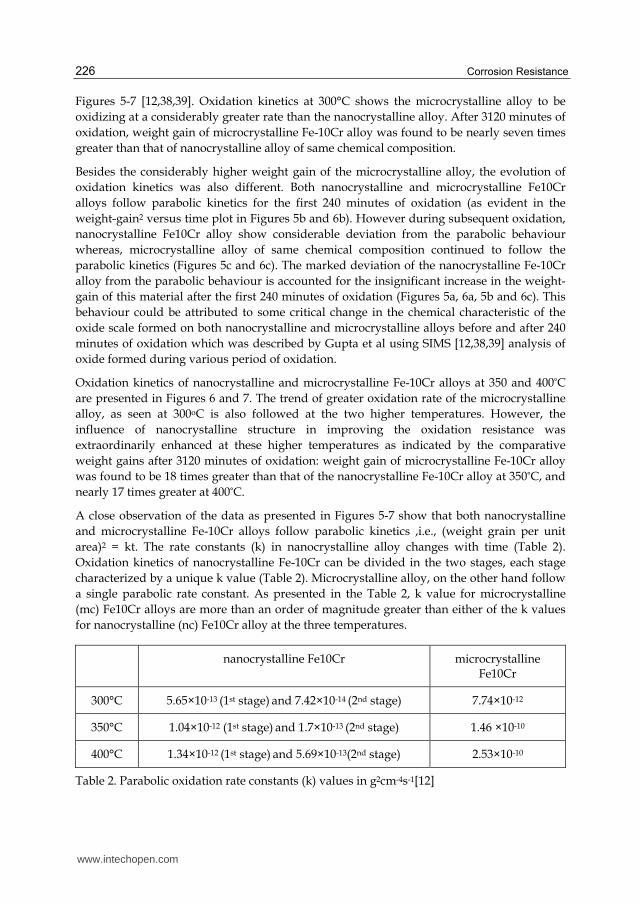
Weight gain curves representing the oxidation kinetics of nanocrystalline and
microcrystalline Fe10Cr alloys, in the temperature range of 300-400°C are presented in
0 500 1000 1500 2000 2500 3000 3500 4000 4500 5000
0.0
0.2
0.4
0.6
0.8
1.0X
'
Grain size (nm)
300C
800C
www.intechopen.com
Corrosion Resistance
226
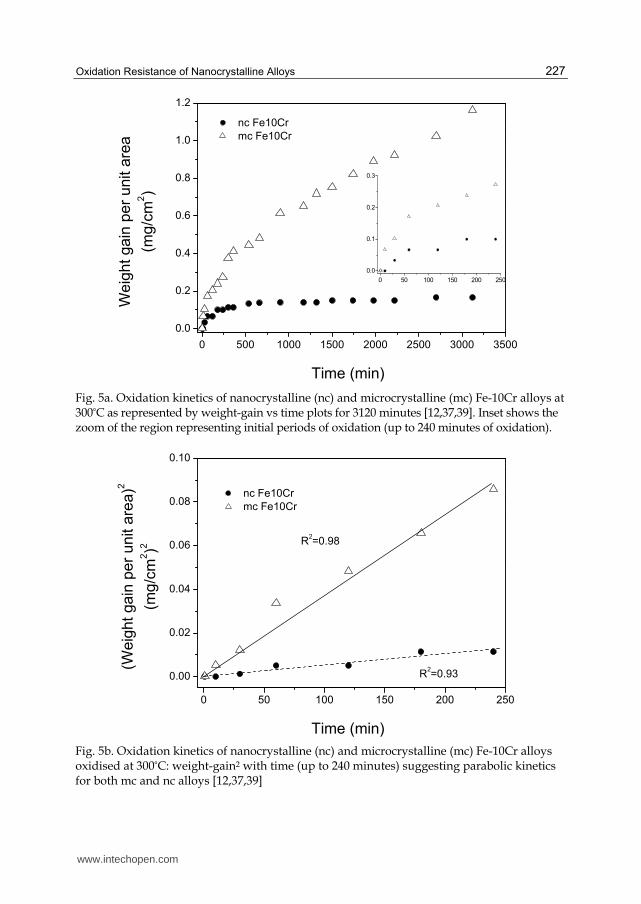
Figures 5-7 [12,38,39]. Oxidation kinetics at 300°C shows the microcrystalline alloy to be
oxidizing at a considerably greater rate than the nanocrystalline alloy. After 3120 minutes of
oxidation, weight gain of microcrystalline Fe-10Cr alloy was found to be nearly seven times
greater than that of nanocrystalline alloy of same chemical composition.
Besides the considerably higher weight gain of the microcrystalline alloy, the evolution of
oxidation kinetics was also different. Both nanocrystalline and microcrystalline Fe10Cr
alloys follow parabolic kinetics for the first 240 minutes of oxidation (as evident in the
weight-gain2 versus time plot in Figures 5b and 6b). However during subsequent oxidation,
nanocrystalline Fe10Cr alloy show considerable deviation from the parabolic behaviour
whereas, microcrystalline alloy of same chemical composition continued to follow the
parabolic kinetics (Figures 5c and 6c). The marked deviation of the nanocrystalline Fe-10Cr
alloy from the parabolic behaviour is accounted for the insignificant increase in the weight-
gain of this material after the first 240 minutes of oxidation (Figures 5a, 6a, 5b and 6c). This
behaviour could be attributed to some critical change in the chemical characteristic of the
oxide scale formed on both nanocrystalline and microcrystalline alloys before and after 240
minutes of oxidation which was described by Gupta et al using SIMS [12,38,39] analysis of
oxide formed during various period of oxidation.
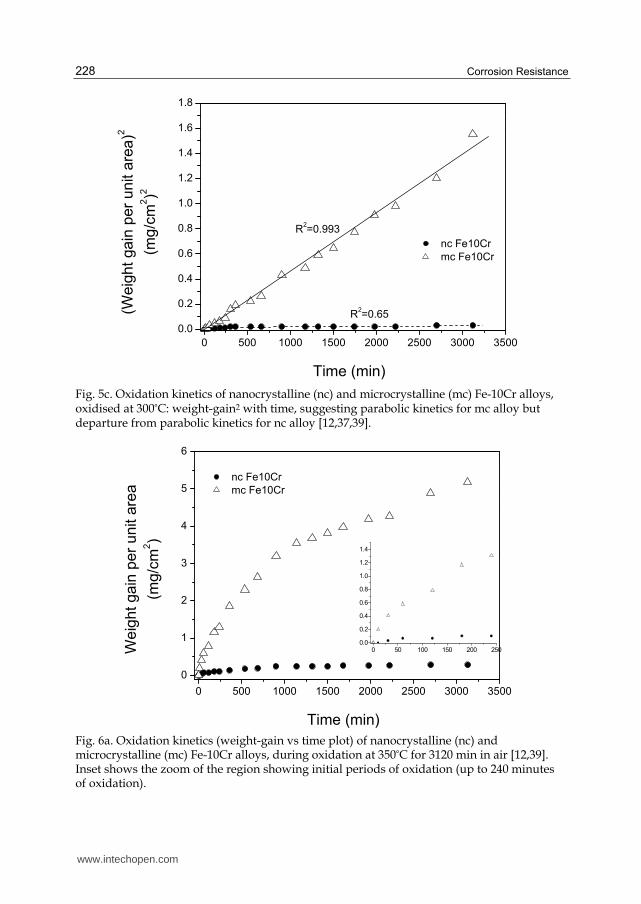
Oxidation kinetics of nanocrystalline and microcrystalline Fe-10Cr alloys at 350 and 400°C
are presented in Figures 6 and 7. The trend of greater oxidation rate of the microcrystalline
alloy, as seen at 300oC is also followed at the two higher temperatures. However, the
influence of nanocrystalline structure in improving the oxidation resistance was
extraordinarily enhanced at these higher temperatures as indicated by the comparative
weight gains after 3120 minutes of oxidation: weight gain of microcrystalline Fe-10Cr alloy
was found to be 18 times greater than that of the nanocrystalline Fe-10Cr alloy at 350°C, and
nearly 17 times greater at 400°C.
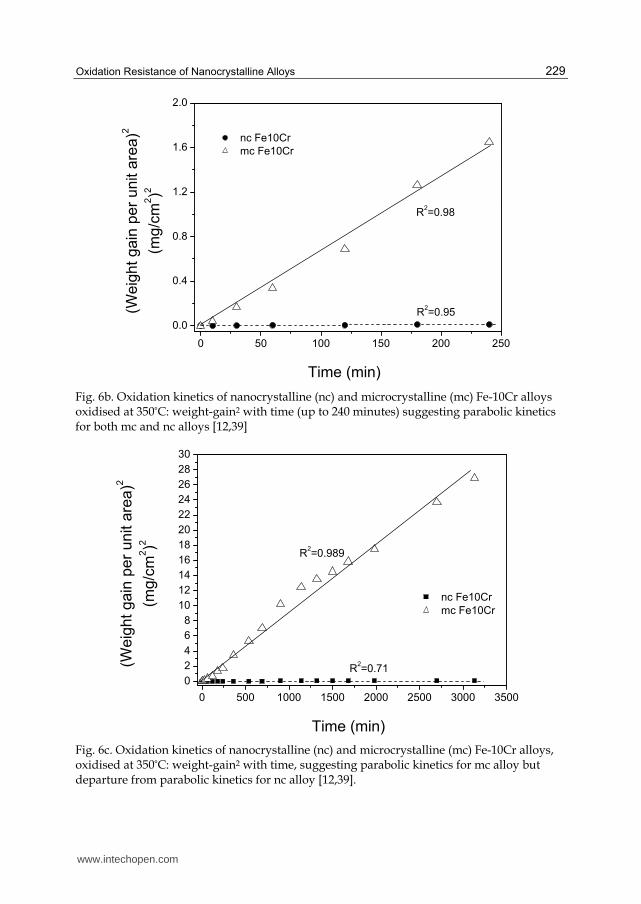
A close observation of the data as presented in Figures 5-7 show that both nanocrystalline
and microcrystalline Fe-10Cr alloys follow parabolic kinetics ,i.e., (weight grain per unit
area)2 = kt. The rate constants (k) in nanocrystalline alloy changes with time (Table 2).
Oxidation kinetics of nanocrystalline Fe-10Cr can be divided in the two stages, each stage
characterized by a unique k value (Table 2). Microcrystalline alloy, on the other hand follow
a single parabolic rate constant. As presented in the Table 2, k value for microcrystalline
(mc) Fe10Cr alloys are more than an order of magnitude greater than either of the k values
for nanocrystalline (nc) Fe10Cr alloy at the three temperatures.
nanocrystalline Fe10Cr microcrystalline Fe10Cr
300°C 5.65×10⁻¹³ (1st stage) and 7.42×10⁻¹⁴ (2nd stage) 7.74×10⁻¹²
350°C 1.04×10⁻¹² (1st stage) and 1.7×10⁻¹³ (2nd stage) 1.46 ×10⁻¹⁰
400°C 1.34×10⁻¹² (1st stage) and 5.69×10⁻¹³(2nd stage) 2.53×10⁻¹⁰
Table 2. Parabolic oxidation rate constants (k) values in g2cm-4s-1[12]
www.intechopen.com
Oxidation Resistance of Nanocrystalline Alloys
227
Fig. 5a. Oxidation kinetics of nanocrystalline (nc) and microcrystalline (mc) Fe-10Cr alloys at 300°C as represented by weight-gain vs time plots for 3120 minutes [12,37,39]. Inset shows the zoom of the region representing initial periods of oxidation (up to 240 minutes of oxidation).
Fig. 5b. Oxidation kinetics of nanocrystalline (nc) and microcrystalline (mc) Fe-10Cr alloys oxidised at 300°C: weight-gain2 with time (up to 240 minutes) suggesting parabolic kinetics for both mc and nc alloys [12,37,39]
0 500 1000 1500 2000 2500 3000 3500
0.0
0.2
0.4
0.6
0.8
1.0
1.2
0 50 100 150 200 250
0.0
0.1
0.2
0.3
nc Fe10Cr
mc Fe10CrW
eig
ht
ga
in p
er
unit a
rea
(mg
/cm
2)
Time (min)
0 50 100 150 200 250
0.00
0.02
0.04
0.06
0.08
0.10
R2=0.93
nc Fe10Cr
mc Fe10Cr
(Weig
ht ga
in p
er
un
it a
rea)2
(mg
/cm
2)2
Time (min)
R2=0.98
www.intechopen.com
Corrosion Resistance
228
Fig. 5c. Oxidation kinetics of nanocrystalline (nc) and microcrystalline (mc) Fe-10Cr alloys, oxidised at 300°C: weight-gain2 with time, suggesting parabolic kinetics for mc alloy but departure from parabolic kinetics for nc alloy [12,37,39].
Fig. 6a. Oxidation kinetics (weight-gain vs time plot) of nanocrystalline (nc) and microcrystalline (mc) Fe-10Cr alloys, during oxidation at 350°C for 3120 min in air [12,39]. Inset shows the zoom of the region showing initial periods of oxidation (up to 240 minutes of oxidation).
0 500 1000 1500 2000 2500 3000 3500
0.0
0.2
0.4
0.6
0.8
1.0
1.2
1.4
1.6
1.8
R2=0.65
nc Fe10Cr
mc Fe10Cr
(Weig
ht
gain
per
unit a
rea)2
(mg
/cm
2)2
Time (min)
R2=0.993
0 500 1000 1500 2000 2500 3000 3500
0
1
2
3
4
5
6
0 50 100 150 200 2500.0
0.2
0.4
0.6
0.8
1.0
1.2
1.4
nc Fe10Cr
mc Fe10Cr
Weig
ht gain
per
unit a
rea
(mg/c
m2)
Time (min)
www.intechopen.com
Oxidation Resistance of Nanocrystalline Alloys
229
Fig. 6b. Oxidation kinetics of nanocrystalline (nc) and microcrystalline (mc) Fe-10Cr alloys oxidised at 350°C: weight-gain2 with time (up to 240 minutes) suggesting parabolic kinetics for both mc and nc alloys [12,39]
Fig. 6c. Oxidation kinetics of nanocrystalline (nc) and microcrystalline (mc) Fe-10Cr alloys, oxidised at 350°C: weight-gain2 with time, suggesting parabolic kinetics for mc alloy but departure from parabolic kinetics for nc alloy [12,39].
0 50 100 150 200 250
0.0
0.4
0.8
1.2
1.6
2.0
R2=0.95
nc Fe10Cr
mc Fe10Cr
(Weig
ht gain
per
unit a
rea)2
(mg/c
m2)2
Time (min)
R2=0.98
0 500 1000 1500 2000 2500 3000 3500
0
2
4
6
8
10
12
14
16
18
20
22
24
26
28
30
R2=0.71
nc Fe10Cr
mc Fe10Cr
(Weig
ht
gain
per
unit a
rea)2
(mg/c
m2)2
Time (min)
R2=0.989
www.intechopen.com
Corrosion Resistance
230
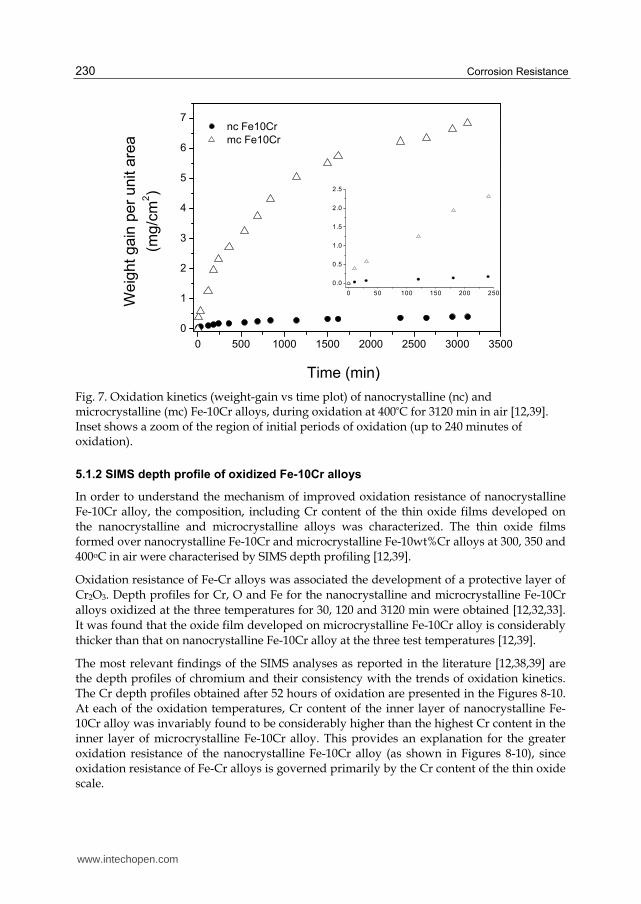
Fig. 7. Oxidation kinetics (weight-gain vs time plot) of nanocrystalline (nc) and microcrystalline (mc) Fe-10Cr alloys, during oxidation at 400°C for 3120 min in air [12,39]. Inset shows a zoom of the region of initial periods of oxidation (up to 240 minutes of oxidation).
5.1.2 SIMS depth profile of oxidized Fe-10Cr alloys
In order to understand the mechanism of improved oxidation resistance of nanocrystalline Fe-10Cr alloy, the composition, including Cr content of the thin oxide films developed on the nanocrystalline and microcrystalline alloys was characterized. The thin oxide films formed over nanocrystalline Fe-10Cr and microcrystalline Fe-10wt%Cr alloys at 300, 350 and 400oC in air were characterised by SIMS depth profiling [12,39].
Oxidation resistance of Fe-Cr alloys was associated the development of a protective layer of
Cr2O3. Depth profiles for Cr, O and Fe for the nanocrystalline and microcrystalline Fe-10Cr
alloys oxidized at the three temperatures for 30, 120 and 3120 min were obtained [12,32,33].
It was found that the oxide film developed on microcrystalline Fe-10Cr alloy is considerably
thicker than that on nanocrystalline Fe-10Cr alloy at the three test temperatures [12,39].
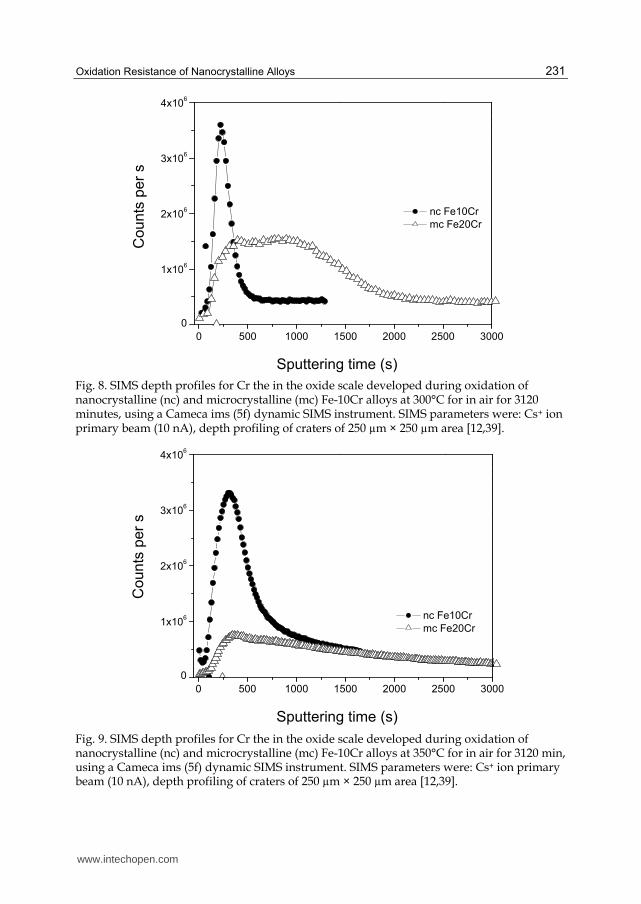
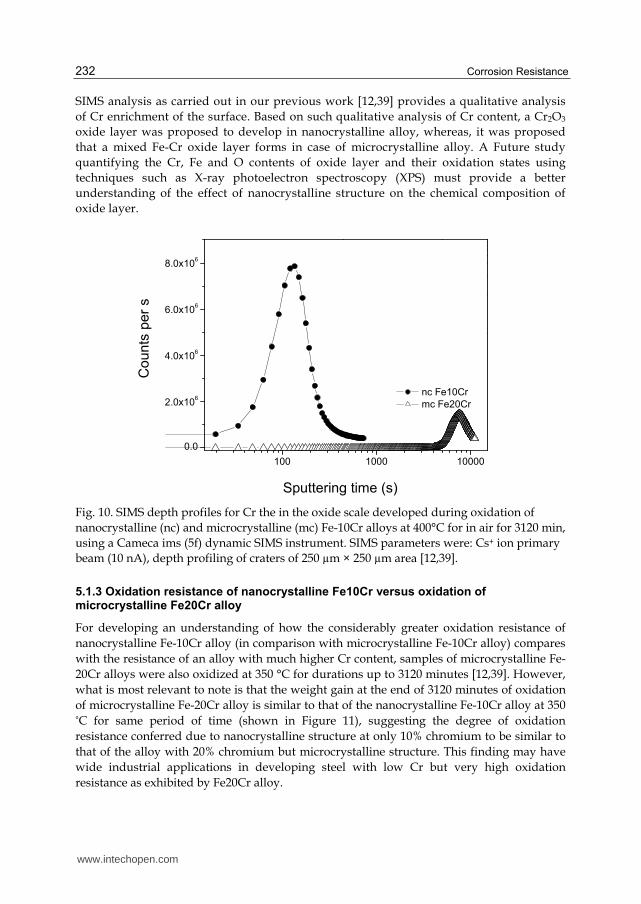
The most relevant findings of the SIMS analyses as reported in the literature [12,38,39] are the depth profiles of chromium and their consistency with the trends of oxidation kinetics. The Cr depth profiles obtained after 52 hours of oxidation are presented in the Figures 8-10. At each of the oxidation temperatures, Cr content of the inner layer of nanocrystalline Fe-10Cr alloy was invariably found to be considerably higher than the highest Cr content in the inner layer of microcrystalline Fe-10Cr alloy. This provides an explanation for the greater oxidation resistance of the nanocrystalline Fe-10Cr alloy (as shown in Figures 8-10), since oxidation resistance of Fe-Cr alloys is governed primarily by the Cr content of the thin oxide scale.
0 500 1000 1500 2000 2500 3000 3500
0
1
2
3
4
5
6
7
0 50 100 150 200 250
0.0
0.5
1.0
1.5
2.0
2.5
nc Fe10Cr
mc Fe10CrW
eig
ht g
ain
pe
r un
it a
rea
(mg/c
m2)
Time (min)
www.intechopen.com
Oxidation Resistance of Nanocrystalline Alloys
231
Fig. 8. SIMS depth profiles for Cr the in the oxide scale developed during oxidation of nanocrystalline (nc) and microcrystalline (mc) Fe-10Cr alloys at 300°C for in air for 3120 minutes, using a Cameca ims (5f) dynamic SIMS instrument. SIMS parameters were: Cs+ ion primary beam (10 nA), depth profiling of craters of 250 µm × 250 µm area [12,39].
Fig. 9. SIMS depth profiles for Cr the in the oxide scale developed during oxidation of nanocrystalline (nc) and microcrystalline (mc) Fe-10Cr alloys at 350°C for in air for 3120 min, using a Cameca ims (5f) dynamic SIMS instrument. SIMS parameters were: Cs+ ion primary beam (10 nA), depth profiling of craters of 250 µm × 250 µm area [12,39].
0 500 1000 1500 2000 2500 3000
0
1x10⁶
2x10⁶
3x10⁶
4x10⁶
nc Fe10Cr
mc Fe20Cr
Counts
per
s
Sputtering time (s)
0 500 1000 1500 2000 2500 3000
0
1x10⁶
2x10⁶
3x10⁶
4x10⁶
nc Fe10Cr
mc Fe20Cr
Coun
ts p
er
s
Sputtering time (s)
www.intechopen.com
Corrosion Resistance
232
SIMS analysis as carried out in our previous work [12,39] provides a qualitative analysis
of Cr enrichment of the surface. Based on such qualitative analysis of Cr content, a Cr2O3
oxide layer was proposed to develop in nanocrystalline alloy, whereas, it was proposed
that a mixed Fe-Cr oxide layer forms in case of microcrystalline alloy. A Future study
quantifying the Cr, Fe and O contents of oxide layer and their oxidation states using
techniques such as X-ray photoelectron spectroscopy (XPS) must provide a better
understanding of the effect of nanocrystalline structure on the chemical composition of
oxide layer.
Fig. 10. SIMS depth profiles for Cr the in the oxide scale developed during oxidation of
nanocrystalline (nc) and microcrystalline (mc) Fe-10Cr alloys at 400°C for in air for 3120 min,
using a Cameca ims (5f) dynamic SIMS instrument. SIMS parameters were: Cs+ ion primary
beam (10 nA), depth profiling of craters of 250 µm × 250 µm area [12,39].
5.1.3 Oxidation resistance of nanocrystalline Fe10Cr versus oxidation of microcrystalline Fe20Cr alloy
For developing an understanding of how the considerably greater oxidation resistance of
nanocrystalline Fe-10Cr alloy (in comparison with microcrystalline Fe-10Cr alloy) compares
with the resistance of an alloy with much higher Cr content, samples of microcrystalline Fe-
20Cr alloys were also oxidized at 350 °C for durations up to 3120 minutes [12,39]. However,
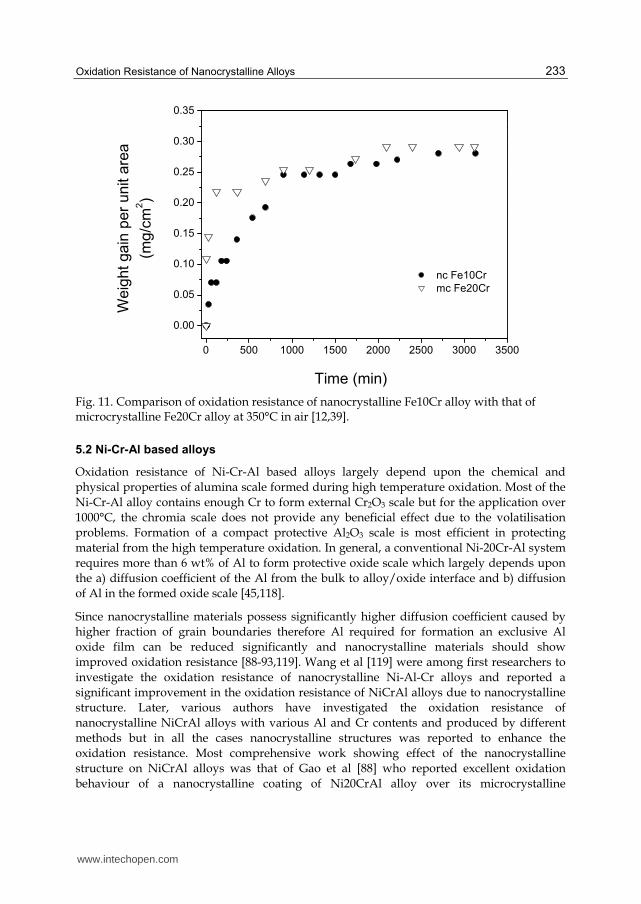
what is most relevant to note is that the weight gain at the end of 3120 minutes of oxidation
of microcrystalline Fe-20Cr alloy is similar to that of the nanocrystalline Fe-10Cr alloy at 350 °C for same period of time (shown in Figure 11), suggesting the degree of oxidation
resistance conferred due to nanocrystalline structure at only 10% chromium to be similar to
that of the alloy with 20% chromium but microcrystalline structure. This finding may have
wide industrial applications in developing steel with low Cr but very high oxidation
resistance as exhibited by Fe20Cr alloy.
100 1000 10000
0.0
2.0x10⁶
4.0x10⁶
6.0x10⁶
8.0x10⁶
nc Fe10Cr
mc Fe20Cr
Counts
per
s
Sputtering time (s)
www.intechopen.com
Oxidation Resistance of Nanocrystalline Alloys
233
Fig. 11. Comparison of oxidation resistance of nanocrystalline Fe10Cr alloy with that of microcrystalline Fe20Cr alloy at 350°C in air [12,39].
5.2 Ni-Cr-Al based alloys
Oxidation resistance of Ni-Cr-Al based alloys largely depend upon the chemical and
physical properties of alumina scale formed during high temperature oxidation. Most of the
Ni-Cr-Al alloy contains enough Cr to form external Cr2O3 scale but for the application over
1000°C, the chromia scale does not provide any beneficial effect due to the volatilisation
problems. Formation of a compact protective Al2O3 scale is most efficient in protecting
material from the high temperature oxidation. In general, a conventional Ni-20Cr-Al system
requires more than 6 wt% of Al to form protective oxide scale which largely depends upon
the a) diffusion coefficient of the Al from the bulk to alloy/oxide interface and b) diffusion
of Al in the formed oxide scale [45,118].
Since nanocrystalline materials possess significantly higher diffusion coefficient caused by
higher fraction of grain boundaries therefore Al required for formation an exclusive Al
oxide film can be reduced significantly and nanocrystalline materials should show
improved oxidation resistance [88-93,119]. Wang et al [119] were among first researchers to
investigate the oxidation resistance of nanocrystalline Ni-Al-Cr alloys and reported a
significant improvement in the oxidation resistance of NiCrAl alloys due to nanocrystalline
structure. Later, various authors have investigated the oxidation resistance of
nanocrystalline NiCrAl alloys with various Al and Cr contents and produced by different
methods but in all the cases nanocrystalline structures was reported to enhance the
oxidation resistance. Most comprehensive work showing effect of the nanocrystalline
structure on NiCrAl alloys was that of Gao et al [88] who reported excellent oxidation
behaviour of a nanocrystalline coating of Ni20CrAl alloy over its microcrystalline
0 500 1000 1500 2000 2500 3000 3500
0.00
0.05
0.10
0.15
0.20
0.25
0.30
0.35
nc Fe10Cr
mc Fe20Cr
Weig
ht ga
in p
er
unit a
rea
(mg/c
m2)
Time (min)
www.intechopen.com
Corrosion Resistance
234
counterpart. They reported a coating with grain size less than 70 nm may increase the
oxidation rate by 4 times. Increment in oxidation resistance due to grain refinement was
more pronounced when grain size was below 100 nm. It has been shown than Al content
required to prevent external oxidation can be reduced from 6% to only 2% by reducing the
grain size to ~ 60 nm [88-93]. These findings may have large industrial implications as it
would provide an opportunity to achieve the desired oxidation resistance with lower Al
content.
6. Challenges for application of nanocrystalline alloys at high temperature
For high temperature application, a major problem is thermal stability of the nanocrystalline
structure. Thermodynamically, such fine structures could not survive for long times at high
temperatures because of the large specific surface energy (driving force) for grain growth.
An effective way to prevent this grain growth is by introducing stable second-phase
particles in the microstructure, where they play a particle pinning effect (Zener effect) on
grain growth [120]. Surprisingly, the coarsening kinetics for nanocrystalline alloys prepared
by sputtering is rather slow even without apparent second-phase particles in the
microstructure. Lou et al. [19] found that after 100 h oxidation in air at 1000°C, the grains of
a sputtered K38G nanocrystalline coating were somewhat coarsened, but still rather fine-
grained, growing from 20-100 nm to 200-1000 nm. It is not clear if this high stability against
grain growth comes from grain boundary segregation of alloy elements (e.g. K38G alloy
contains 3.6% Ti, 1.7% Mo, 2.6% W, 1.7% Ta in the Ni-Cr-Al base), which anchor or retard
the grain boundary movement (similar to Zener effect) although no particle formation was
apparent, or from the sputtered coating structure itself (columnar structure). Unfortunately,
no systematic investigation of temperature and alloy composition effects on the thermal
stability of these nanocrystalline alloys is available to date, future research should be carried
out for high temperature application of nanocrystallline alloys.
Another problem limiting the application of nanocrystalline materials is preparation of
nanocrystalline alloys. Currently, the bulk metallic nanomaterials can only be prepared at
the laboratory scale, usually by compacting prepared nanocrystalline powders. However,
consolidation of the nanopowders into bulk materials needs high temperature and pressure
which may considerably coarsen the structure. Because of this difficulty, surface
nanocoating has been considered a potential industry application. Nanocrystalline costing
are often prepared by chemical vapour deposition (CVD), physical vapour deposition
(PVD), electrochemical deposition, electro-spark deposition, and laser and electron beam
surface treatment.
7. Future research
All studies reporting excellent oxidation resistance of nanocrystalline NiCrAl alloys were
conducted at high temperatures. However, the grain growth behaviour of the alloys at these
elevated temperatures was not determined and therefore many questions remain
unanswered. Detailed studies investigating the effect of such fine grain size on the oxide
scale formation along with grain growth of material will be helpful in understanding the
underlying mechanism of the improved oxidation resistance.
www.intechopen.com
Oxidation Resistance of Nanocrystalline Alloys
235
Oxidation behaviour of Fe-Cr alloys as described in the section 5.1 was investigated at moderate temperatures [12,37-39]. Choice of moderate temperature was motivated by: 1) a very high difference in the grain boundary and lattice diffusion coefficient values at moderate temperatures and 2) higher grain growth at elevated temperatures. Grain growth of the nanocrystalline materials at high temperatures limits their use for high temperature applications. However, it was shown recently that addition of Zr to Fe-Cr based alloys prevents grain growth of these materials [120,121] and therefore such alloys with small amount of Zr (i.e., Fe-Cr-Zr alloys) will be ideal for investigation of oxidation resistance in the temperature range of 600-800°C.
Grain size of Fe-Cr alloys (used for the investigation of the effect of nanocrystalline structure on oxidation resistance) was limited to 54 (±4) nm which could be further decreased with the recent advancements in the sample preparation techniques such as one recently developed by Gupta et al [122] where an artefact free FeCrNi alloy with a grain size less than 10 nm was produced by in-situ consolidation technique. Further investigations on such alloys with grain size below 10 nm will demonstrate pronounced effect of triple points and grain boundaries and it may be possible to develop stainless steels with further improved oxidation resistance but less Cr content.
Improved oxidation resistance of nanocrystalline Fe-Cr or Ni-Cr-Al alloys have been attributed to the greater Cr and/or Al enrichment of the oxide scale (i.e., change in chemical composition of the oxide scale) due to faster diffusion of Cr and/or Al. However, physical properties of oxide scale, which are very important in determining the oxidation resistance of an alloy, have attracted only a little research attention. Investigation of the physical properties (grain size, morphology, crystallographic details etc.) of the oxide scale formed on the nanocrystalline alloys will further help in understanding the effect of nanocrystalline structure on the oxidation resistance of an alloy.
8. Concluding remarks
Nanocrystalline materials are being investigated due to their unique properties. More generally, development of materials resistant to environmental degradation is not the main focus of nanocrystalline metals research to date, but it seems possible that nanocrystalline metallic materials may lead to a substantial increment in oxidation resistance; caused by promoted oxide scale formation, improved adherence and reduced spallation tendency of the oxide scale. Nanocrystalline Fe-Cr and M-Cr-Al alloys have demonstrated improved oxidation resistance and present potential to be used for high temperature applications in future. More fundamental investigations are required to fully characterise the oxidation phenomenon and underlying principles for nanocrystalline materials.
9. References
[1] H. Gleiter, Progress in Materials Science, 33 (1989) 223. [2] G. Palumbo, S. J. Thorpe, K. T. Aust, Scripta Metall. Mater. 24 (1990) 2347. [3] C. C. Koch, K.M. Yousef, R. O. Scattergood, K. L. Murty, Advanced Eng. Mater. 7 (2005)
787 [4] R. W. Siegel, NanoStructured Materials 4 (1994) 121 [5] R. Birringer, H. Gleiter, H. P. Klein, P. Marquardt, Phys. Lett. A 102 (1984) 365. [6] M. A. Meyers, A. Mishra, D. J. Benson, Progress in Materials Science 51 (2006) 427.
www.intechopen.com
Corrosion Resistance
236
[7] T. Zhu, J. Li, Progress in Materials Science 55 (2010) 710. [8] C. C. Koch, Encyclopedia of Materials: Science and Technology (2001) 5901. [9] C. C. Koch, Scripta Materialia, 49 (2003) 657. [10] S. Cheng, E. Ma, Y. M. Wang, L. J. Kecskes, K. M. Youssef, C. C. Koch, U. P. Trociewitz,
K. Han, Acta Materialia 53 (2005) 1521. [11] Z. B. Wang, N. R. Tao, W. P. Tong, J. Lu, K. Lu, Acta Materilia 51 (2003), 4319. [12] R. K. Gupta, PhD thesis, Synthesis and corrosion behaviour of nanocrystalline Fe-Cr
alloys, Monash University (2010). [13] K. D. Ralston, N. Birbilis, Corrosion 66 (7) (2010) 075005 – 1 [14] G. Meng, Y. Li, F. Wang, Electrochimica Acta 51 (2006) 4277. [15] C. T. Kwok, F. T. Cheng, H. C. Man, W. H. Ding, Materials Letters 60 (2006) 2419. [16] Y. Li, F. Wang, Electrochimica Acta 51 (2006) 4426. [17] X. Y. Wang, D. Y. Li, Electrochimica Acta 47 (2002) 3939. [18] Sh. Hassani, K. Raeissi, M. Azzi, D. Li, M. A. Golozar, J. A. Szpunar, Corrosion Science
51 (2009) 2371. [19] Kh. M. S. Youssef, C. C. Koch, P.S. Fedkiw, Corrosion Science 46 (2004) 51. [20] L. Wang, Y. Lin, Z. Zeng, W. Liu, Q. Xue, L. Hu, J. Zhang, Electrochimica Acta 52 (2007)
4342. [21] H. Gleiter, Acta Mater 48 (2000) 1. [22] J. Y. Fan, X. L. Wu, K. Paul, K. Chu, Progress in Materials Science 51 (2006) 983. [23] T. Sourmail, Progress in Materials Science 50 (2005) 816. [24] M. E. McHenry, M. A. Willard, D. E. Laughlin, Progress in Materials Science 44 (1999) 291. [25] G.R. Wallwork, A.Z. Hed, Oxidation of Metals, 3 (1971) 171. [26] G. Chen, H. Lou, Surface and Coatings Technology 123 ( 2000) 92. [27] Z. Liu, W. Gao, K.L. Dahm, F. Wang, Acta Materialia 46 (1998) 1691. [28] L. Hanyi, W. Fuhui, X. Bangjie, Z. Lixin, Oxidation of Metals, 38 (1992) 299. [29] H. Lou, S. Zhu, F. Wang, Oxidation of Metals, 43 (1995) 317. [30] H. Lou, F. Wang, S. Zhu, B. Xia, L. Zhang, Surface and Coatings Technology, 63 (1994)
105. [31] W. Xu, X. Song, N. Lu, C. Huang , Acta Materialia 58, (2010) 396. [32] C. X. wang, C. W. Yang, Materials Science and Engineering R 49 (2005) 157. [33] P. Keblinski, S.R. Phillpot, D. Wolf, H. Gleiter, Physics Letters A 226 (1997) 205. [34] G. Chen, H. Lou, NanoStructured Materials, 11 (1999) 637 [35] G. Chen, H. Lou, Surface and Coatings Technology 123 ( 2000) 92. [36] G. Chen, H. Lou, Corrosion Science 42 (2000) 1185. [37] R. K. Singh Raman, R. K. Gupta, Corrosion science 51 (2009) 316. [38] R. K. Gupta, R. K. Singh Raman, C. C. Koch, Journal of Materials Science 45 (2010) 4884. [39] R. K. Singh Raman, R. K. Gupta ,C. C. Koch, Philosophical Magazine 90 (2010) 4884. [40] U. Köster, L. Jastrow, Materials Science and Engineering A 449-451 (2007) 57. [41] U. Köster, D. Zander, Triwikantoro, A. Rüdiger, L. Jastrow, Scripta Materialia 44 ( 2001)
1649. [42] Triwikantoro, D. Toma, M. Meuris, U. Köster , Journal of Non-Crystalline Solids 250-
252 (1999) 719. [43] K. Mondal, U.K. Chatterjee, B.S. Murty, Journal of Non-Crystalline Solids, 334-335
(2004) 544. [44] P. Kofstad, High Temperature Corrosion, Elsevier Applied Scicnece, New York (1988). [45] D.J. Young, High Temperature Oxidation and Corrosion of Metals, Elsevier, Amsterdam
(2008).
www.intechopen.com
Oxidation Resistance of Nanocrystalline Alloys
237
[46] M.K. Hossain, Corrosion Science 19 (1979) 1031. [47] X. Peng, J. Yan, Y. Zhou, F. Wang, Acta Materialia 53 (2005) 5079. [48] M.D. Merz, Metallurgical and Materials Transactions A, 10 (1979) 71. [49] F. Wang, H. Lou, W. Wu, Vacuum, 43 (1992) 752. [50] X. Zhu, R. Birringer, U. Herr, H. Gleiter, Phys. Rev. B 35 (1987) 9085. [51] L. D. Bianco, A. Hernando, E. Bonetti, E. Navarro, Phys. Rev. B 56 (1997) 8894. [52] T. Haubold, R. Birringer, B. Lengeler, H. Gleiter, Phys. Lett. A 135 (1989) 461. [53] T. Haubold, W. Krauss, H. Gleiter, Philos. Mag. Lett 63 (1991) 245. [54] A. DiCicco, M. Berrettoni, S. Stizza, E. Bonetti, G. Cocco Phys. Rev. B 12 (1994) 386. [55] A.D. Cicco, M. Berrettoni, S. Stizza, E. Bonetti, Physica B 208-209 (1995) 547. [56] R. K. Islamgaliev, R. Kuzel, E.D. Obraztsova, J. Burianek, F. Chmelik, R.Z. Valiev, Mater
Sci and Engineering A 249 (1998) 152. [57] H. E. Schaefer, R. Wurschum, R. Birringer, H. Gleiter, Phys. Rev. B 38 (1988) 9545. [58] J. Wang, D. Wolf, S. R. Phillippot, H. Gleiter, Philos. Mag. A 73 ( 1996) 517 [59] D. Chen, Mater Sci and Engineering A 190 (1995) 193. [60] D. Chen, Materials Letters 21 (1994) 405. [61] R.E. Read-Hill, Physical Metallurgy Principles, Litton Educational Publishing, Inc. 1973 [62] T. Mutschele, R. Kirchheim, Scripta materialia 21 (1987) 1101. [63] R. Kirchheim, T. Mutschele, W. Kieninger, H. Gleiter, R. Birringer, T. D. Koble, Mater
Sci and Engineering A 99 (1988) 457. [64] H. J. Fecht, NanoStructured Materials 1 (1992) 125. [65] H. J. Fecht, Phys. Rev. Lett 65 (1990) 610. [66] H. J. Fecht, E. Hellstern, Z. Fu, W.L Johnson, Adv. Powd. Met 2 (1989) 111. [67] H. J. Fecht, Materials Science and Engineering A 179-180 (1994) 491. [68] E. Hellstern E, H. J. Fecht, Z. Fu Z, W. L. Johnson, J. appl. Phys 65 (1989) 305. [69] G. Wallner, E. Jorra, H. Franz, J. Peisl, R. Birringer, H. Gleiter, T. Haubold. W. Petry,
MRS Symp. Proc 132 (1989) 149. [70] J. Horvath, R. Birringer, H. Gleiter, Solid State Comm 62 (1987) 319. [71] R. Birringer, P. Zimmer, Acta Materialia 57 (2009) 1703. [72] A. Seeger, G. S. Acta metall. 1959;7:495. [73] D. A. Smith, V. Vitek, R.C. Pond, Acta metal 24 (1977) 475. [74] H. J.Fros, M. F. Ashby, F. Spaepen, Scripta matallurgica 14 (1980) 1051. [75] D. Wolf, Philos. Mag. B 69 (1989) 667. [76] Y. H. Zhao, H. W. Sheng, K. Lu, Acta Mater 49 (2001) 265. [77] A. Lucci, G. Riontino, M. C. Tabasso, V. G. Tamanini, Acta Metall. 26 (1978) 615. [78] B. Gu¨ nther, A. Kupmann, H. D. Kunze, 27 (1992) 833. [79] L. Lu, M. L. Sui, K. Lu, Acta Mater. 49 (2001) 4127 [80] A. Tscho¨ pe, R. Birringer, Acta Metall. 41 (1993) 2791. [81] A.T. Dinsdale, Calphad 15 (1991) 317. [82] Y. K. Huang, A. A. Menovsky, F. R. Boer, NanoStructured Materials Materials 2 (1992)
587. [83] R. Würschum, S. Herth, U. Brossmann, Advanced Engineering Materials, 5 (2003) 365 [84] I.V. Belova, G.E. Murch, J. of physics and chemistry of solids 64 (2003) 873 [85] H. Mehrer, Diffusion in Nanocrystalline Materials, springer Series in Solid-State
Sciences (2007) [86] G. Shujiang , F. Wang, S. Zhang, Surface and Coatings Technology 167 ( 2003) 212. [87] H. Y. Tong, F. G. Shi , E. J. Lavernia, Scripta Metall Mater 32 (1995) 511. [88] W. Gao, Z. Liu, Z. Li, Advanced Materials, 13 (2001) 1001.
www.intechopen.com
Corrosion Resistance
238
[89] G. Chen, H. Lou, Scripta materialia 43 (2000) 119. [90] G. F. Chen, H. Y. Lou, Materials Letters 45 (2000) 286. [91] L. Liu, F. Wang, Materials Letters 62 ( 2008) 4081. [92] F. Wang, X. Tian, Q. Li, L. Li, X. Peng, Thin and Solid Films 516 (2008) 5740. [93] G. Cao, L. Geng, Z. Zheng, M. Naka, Intermetallics 15 (2007) 1672. [94] H. Z. Zheng, S. Q. Lu, X. J. Dong, D. L. Quyang, Materials Science and Engineering A
496 (2008) 524. [95] J. E. May, S. E. Kuri, P. A. P Nascente, Mater Sci and Engineering A 428 (2006) 290. [96] J. E. May, G. Galerie, T. P. Busquim, S. E. Kuri, Materials and Corrosion 58 (2008) 87 [97] Y. Niu, Z. Q. Cao, F. G, Farne, G. Randi, C. L. Wang, Corrosion Science 45 (2003) 1125. [98] S. Leistikow, I. Wolf and H.J. Grabke, Werkst. Korros., 38 (1987) 556. [99] Y. Shida, N. Ohtsuka, J. Muriama, N. Fujino and H. Fujikawa, Proc. JIMS-3, High Temp.
Corros., Trans. Jap. Inst. Met., 1983, 631. [100] H. J. Grabke, E. M. Muller-Lorenz, S. Strauss, E. Pippel, J. Woltersdorf, Oxidation of
Metals, 50 (1998) 314. [101] M. Martin, N. Lakshmi, U. Koops, H.-I. Yoo, Z. Phys. Chem. 221 (2007) 1449. [102] G. C. Wood, Oxidation of Metals, 2 (1970) [103] V. R. Howes, Corrosion Science, 7 (1967) 735 [104] R. Lobb, H. Evans, Metal Science 26 ( 1981). [105] M. Schutz, Oxidation of Metals, 44, (1995), 29 [106] H. Hindam, D. P. Whittle, Oxidaiton of Metals, 18 (1982) 245 [107] X. Y. Zhang, M.H. Shi, C. Li, N. F. Liu, Y.M. Wei, Mater Sci and Engineering A 448
(2007) 259. [108] O. E. Kedim, S. Paris, C. Phigini, F. Bernard, E. Gaffet, Z. A. Munir, Mater Sci and
Engineering A 369 (2004) 49. [109] W. W. Smeltzer, D. P. Whittle, J. Electrochem. Soc. 125 (1978) 1116. [110] C. J. Wagner, J. Electrochem. Soc. 99 (1952) 369. [111] C. J. Wagner, J. Electrochem. Soc. 103 (1956) 571. [112] C. J. Wagner, J. Electrochem. Soc. 63 (1959) 772. [113] X. Peng, F. Wang, Oxidation – resistant nanocrystalline coatings, Development in high-
temperature corrosion and protection of materials, W. Gao, Z. Li (Eds.), CRC Press, 2008.
[114] I. Kaur, W. Gust, L. Kozma, Handbook of grain and interphase boundary diffusion data: Stuttgart: Zigler Press, (1989), 523.
[115] A. W. Bowen, G .M. Leak, Metall. Trans. 1 (1970), 1695. [116] R. Gupta, R. K. Singh Raman, C. C. Koch, Materials Science and Engineering A 494
(2008) 253. [117] J. G. Goedjen, D. A. Shores, Oxidation of Metals 37 (1992) 125 [118] F. Wang, Oxidation of Metals 47 (1997) 247. [119] F.J. Humphreys, M. Hatherly, Recrystallization and related annealing phenomena,
Pergamon, 1996. [120] R. K. Gupta, R. K. Singh Raman, C. C. Koch, TMS 2008 Annual Meeting 1 (2008) 151-157. [121] K.S. Darling, R.N. Chan, P.Z. Wong, J. E. Semones, R.O. Scattergood, C.C. Koch,
Scripta Materlialia 59 (2008) 530. [122] R. K. Gupta, K. S. Darling, R. K. Singh Raman, K. R. Ravi, C. C. Koch, B. S. Murty, R. O.
Scattergood, Journal of Materials Science (2011) DOI 10.1007/s10853-011-5986-6.
www.intechopen.com
Corrosion ResistanceEdited by Dr Shih
ISBN 978-953-51-0467-4Hard cover, 472 pagesPublisher InTechPublished online 30, March, 2012Published in print edition March, 2012
InTech EuropeUniversity Campus STeP Ri Slavka Krautzeka 83/A 51000 Rijeka, Croatia Phone: +385 (51) 770 447 Fax: +385 (51) 686 166www.intechopen.com
InTech ChinaUnit 405, Office Block, Hotel Equatorial Shanghai No.65, Yan An Road (West), Shanghai, 200040, China
Phone: +86-21-62489820 Fax: +86-21-62489821
The book has covered the state-of-the-art technologies, development, and research progress of corrosionstudies in a wide range of research and application fields. The authors have contributed their chapters oncorrosion characterization and corrosion resistance. The applications of corrosion resistance materials will alsobring great values to reader's work at different fields. In addition to traditional corrosion study, the book alsocontains chapters dealing with energy, fuel cell, daily life materials, corrosion study in green materials, and insemiconductor industry.
How to referenceIn order to correctly reference this scholarly work, feel free to copy and paste the following:
Rajeev Kumar Gupta, Nick Birbilis and Jianqiang Zhang (2012). Oxidation Resistance of NanocrystallineAlloys, Corrosion Resistance, Dr Shih (Ed.), ISBN: 978-953-51-0467-4, InTech, Available from:http://www.intechopen.com/books/corrosion-resistance/oxidation-resistance-of-nanocrystalline-alloys

© 2012 The Author(s). Licensee IntechOpen. This is an open access articledistributed under the terms of the Creative Commons Attribution 3.0License, which permits unrestricted use, distribution, and reproduction inany medium, provided the original work is properly cited.