Embed Size (px)
Citation preview
Article
OX40 Regulates Both Inna
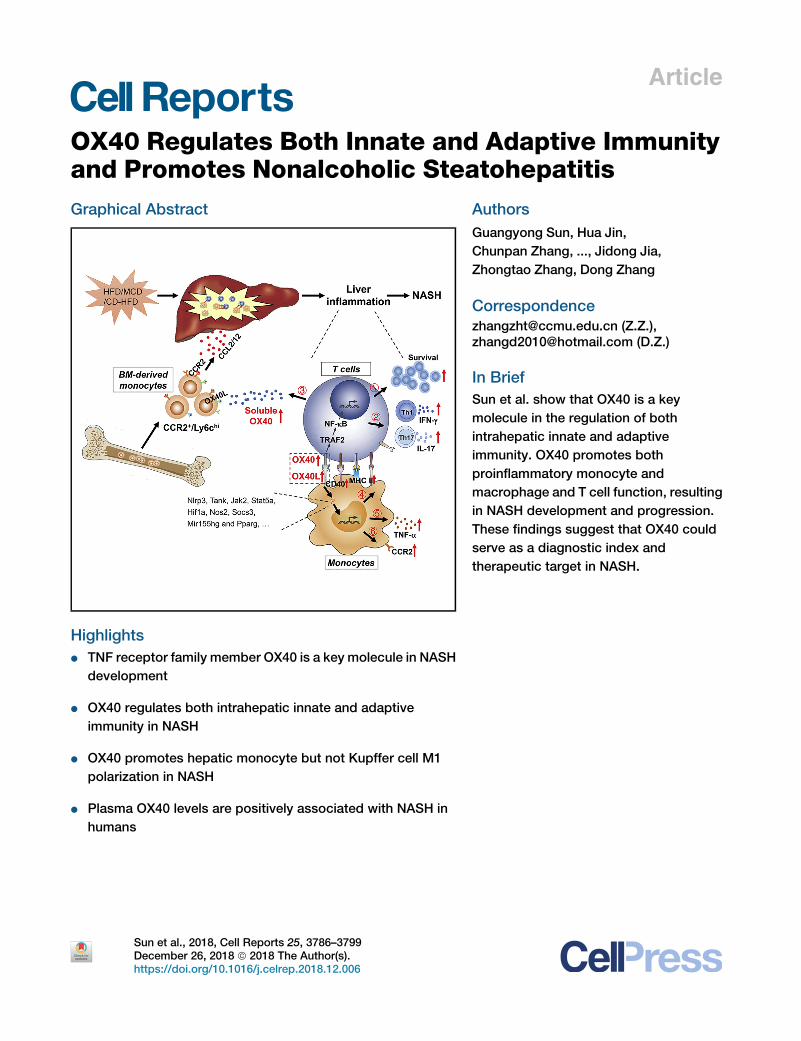
te and Adaptive Immunityand Promotes Nonalcoholic SteatohepatitisGraphical Abstract
Highlights
d TNF receptor family member OX40 is a key molecule in NASH
development
d OX40 regulates both intrahepatic innate and adaptive
immunity in NASH
d OX40 promotes hepatic monocyte but not Kupffer cell M1
polarization in NASH
d Plasma OX40 levels are positively associated with NASH in
humans
Sun et al., 2018, Cell Reports 25, 3786–3799December 26, 2018 ª 2018 The Author(s).https://doi.org/10.1016/j.celrep.2018.12.006
Authors
Guangyong Sun, Hua Jin,
Chunpan Zhang, ..., Jidong Jia,
Zhongtao Zhang, Dong Zhang
[email protected] (Z.Z.),[email protected] (D.Z.)
In Brief
Sun et al. show that OX40 is a key
molecule in the regulation of both
intrahepatic innate and adaptive
immunity. OX40 promotes both
proinflammatory monocyte and
macrophage and T cell function, resulting
in NASH development and progression.
These findings suggest that OX40 could
serve as a diagnostic index and
therapeutic target in NASH.
Cell Reports
Article
OX40 Regulates Both Innate and Adaptive Immunityand Promotes Nonalcoholic SteatohepatitisGuangyong Sun,1,2,3,8 Hua Jin,1,2,3,8 Chunpan Zhang,1,2,3,8 Hua Meng,4,5,8 Xinyan Zhao,6 Dan Wei,4,5 Xiaojuan Ou,5,6
Qianyi Wang,5,6 Shuxiang Li,6 Tianqi Wang,1,2,3 Xiaojing Sun,1,2,3 Wen Shi,1,2,3 Dan Tian,1,2,3 Kai Liu,1,2,3 Hufeng Xu,1,2,3
Yue Tian,1,2,3 Xinmin Li,1,2,3 Wei Guo,4,5 Jidong Jia,5,6,7 Zhongtao Zhang,4,5,* and Dong Zhang1,2,3,5,9,*1Experimental and Translational Research Center, Beijing Friendship Hospital, Capital Medical University, Beijing, 100050, China2Beijing Clinical Research Institute, Beijing, 100050, China3Beijing Key Laboratory of Tolerance Induction and Organ Protection in Transplantation, Beijing, 100050, China4General Surgery Department, Beijing Friendship Hospital, Capital Medical University, Beijing, 100050, China5National Clinical Research Center for Digestive Diseases, Beijing, 100050, China6Liver Research Center, Beijing Friendship Hospital, Capital Medical University, Beijing, 100050, China7Beijing Key Laboratory of Translational Medicine in Liver Cirrhosis, Beijing, 100050, China8These authors contributed equally9Lead Contact
*Correspondence: [email protected] (Z.Z.), [email protected] (D.Z.)https://doi.org/10.1016/j.celrep.2018.12.006
SUMMARY
Both innate and adaptive immune cells are involvedin the pathogenesis of nonalcoholic steatohepatitis(NASH), but the crosstalk between innate and adap-tive immunity is largely unknown. Here we show thatcompared with WT mice, OX40�/� mice exhibitdecreased liver fat accumulation, lobular inflamma-tion, and focal necrosis after feeding with diets thatinduce NASH. Mechanistically, OX40 deficiency sup-presses Th1 and Th17 differentiation, and OX40 defi-ciency in T cells inhibits monocyte migration, antigenpresentation, and M1 polarization. Soluble OX40stimulation alone upregulates antigen presentation,chemokine receptor expression, and proinflamma-tory cytokine secretion by liver monocytes. Further-more, plasma soluble OX40 levels are positivelyassociated with NASH in humans, suggesting clinicalrelevance of the findings. In conclusion, we show amechanism for T cell regulation of innate immunecells. OX40 is a key regulator of both intrahepaticinnate and adaptive immunity, generates two-waysignals, and promotes both proinflammatory mono-cyte and macrophage and T cell function, resultingin NASH development.
INTRODUCTION
Nonalcoholic fatty liver disease (NAFLD) represents a spectrum
of progressive liver disease and has become one of the
most common liver pathological conditions worldwide. NAFLD
ranges from isolated intrahepatic triglyceride accumulation
(simple steatosis) to intrahepatic triglyceride accumulation plus
inflammation and hepatocyte injury (nonalcoholic steatohepatitis
[NASH]) and ultimately progresses to fibrosis and cirrhosis and
potentially hepatocellular carcinoma (Angulo, 2002; Anstee
et al., 2013; Arab et al., 2018; Borrelli et al., 2018; Lee et al.,
2017; Suzuki and Diehl, 2017). Inflammation in the liver is crucial
for the progression from hepatic steatosis to NASH, and infiltra-
tion of different subsets of inflammatory cells is the hallmark of
steatohepatitis (Tilg and Moschen, 2010).
The liver is a central immunological organwith a high density of
myeloid and lymphoid immune cells (Heymann and Tacke,
2016). Interactions among different immune cells are essential
for the development and progression of NASH. In the early stage,
steatotic hepatocytes release apoptotic bodies and modified li-
poproteins, which activates proinflammatory cytokine and che-
mokine secretion by resident Kupffer cells, consequentially re-
cruiting and activating inflammatory leukocytes (neutrophils
and monocytes). In addition to metabolic factors, free fatty acids
(FFAs), gut bacterial lipopolysaccharide (LPS), chemokines, cy-
tokines, and adipokines are also contribute to the activation of
innate immune cells (Ganz and Szabo, 2013; Tilg and Moschen,
2010). These cells directly promote additional fat accumulation
in the liver and trigger adaptive immune cell recruitment and acti-
vation (Ganz and Szabo, 2013; Nati et al., 2016). CD4 and CD8 T
lymphocytes, B lymphocytes, and natural killer T (NKT) cells are
recruited within the liver in parallel with worsening parenchymal
injury and lobular inflammation (Leroux et al., 2012; Sutti et al.,
2014; Wolf et al., 2014b). The presentation of oxidative stress-
derived antigens by liver antigen-presenting cells (APCs) to
CD4 T helper lymphocytes leads to CD4 T cell activation that
supports both cytotoxic CD8 T cell and B cell responses.
Costimulatory interactions likely mediate extensive crosstalk
between innate and adaptive immunity during the pathogenesis
of NASH. Crosstalk between B7-CD28 or CD40-CD40L plays a
dual role in liver inflammation and steatosis by inducing protec-
tive regulatory T cell responses and eliciting effector T cell proin-
flammatory functions (Chatzigeorgiou et al., 2014; Guo et al.,
2013;Wolf et al., 2014a). OX40 andOX40 ligand (OX40L) interac-
tion is essential for regulating conventional T cell division, differ-
entiation, and survival and plays an important role in inflamma-
tion development in models of multiple sclerosis (MS), colitis,
3786 Cell Reports 25, 3786–3799, December 26, 2018 ª 2018 The Author(s).This is an open access article under the CC BY-NC-ND license (http://creativecommons.org/licenses/by-nc-nd/4.0/).
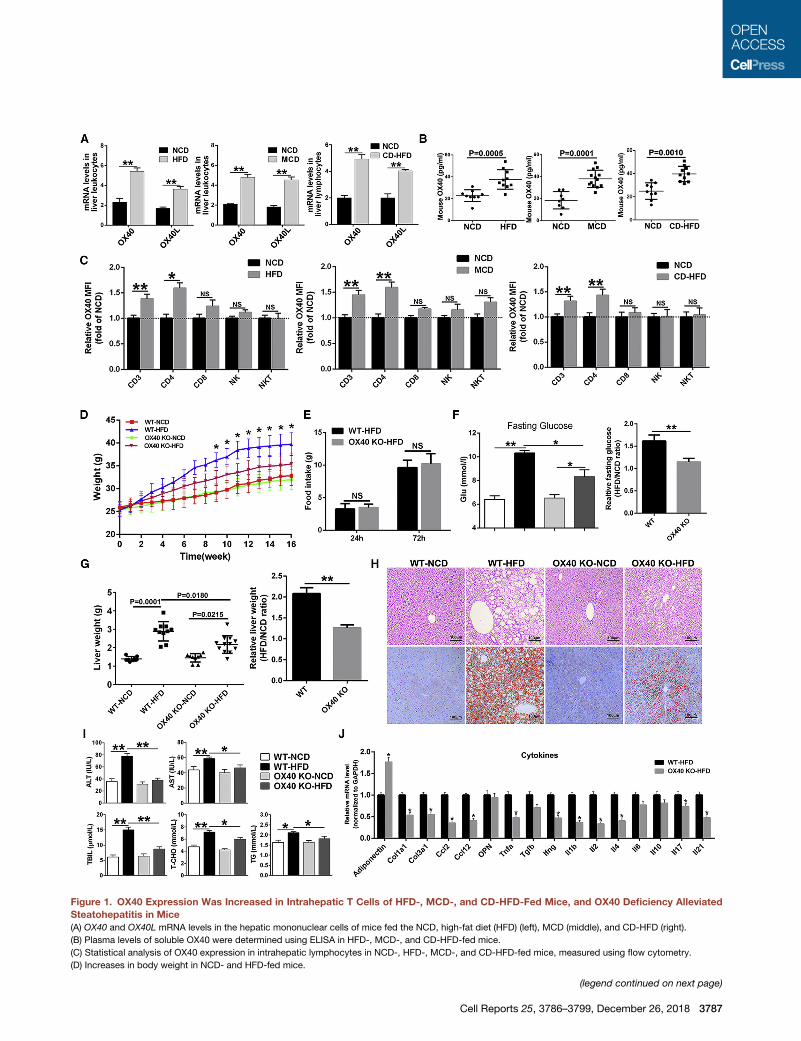
Figure 1. OX40 Expression Was Increased in Intrahepatic T Cells of HFD-, MCD-, and CD-HFD-Fed Mice, and OX40 Deficiency Alleviated
Steatohepatitis in Mice
(A) OX40 and OX40L mRNA levels in the hepatic mononuclear cells of mice fed the NCD, high-fat diet (HFD) (left), MCD (middle), and CD-HFD (right).
(B) Plasma levels of soluble OX40 were determined using ELISA in HFD-, MCD-, and CD-HFD-fed mice.
(C) Statistical analysis of OX40 expression in intrahepatic lymphocytes in NCD-, HFD-, MCD-, and CD-HFD-fed mice, measured using flow cytometry.
(D) Increases in body weight in NCD- and HFD-fed mice.
(legend continued on next page)
Cell Reports 25, 3786–3799, December 26, 2018 3787
rheumatoid arthritis (RA), graft-versus-host disease (GVHD), and
leishmaniosis (Akiba et al., 2000; Croft, 2010; Higgins et al.,
1999; Liu et al., 2017; Tsukada et al., 2000; Weinberg et al.,
1999; Yoshioka et al., 2000; Zhao et al., 2016). In a previous
study, we found that OX40 upregulation in CD4 T cells is crucial
for adipose tissue inflammation and insulin resistance develop-
ment (Liu et al., 2017). However, whether OX40-OX40L interac-
tion can regulate innate immunity and promote hepatic inflam-
mation and NASH development is largely unknown.
In this study, by inducing steatohepatitis in OX40-deficient
mice by altering their diet, we provide evidence that OX40 plays
a key role in regulating both liver innate and adaptive immunity in
liver inflammation and NASH development.
RESULTS
OX40 Deficiency Ameliorated SteatohepatitisTo investigate the involvement of OX40 and OX40L in NASH
development, we fed C57BL/6 mice a high-fat diet (HFD) for
16 weeks, a methionine and choline-deficient diet (MCD) for
4 weeks, or a choline-deficient HFD (CD-HFD) for 12 weeks.
As shown in Figure 1A, OX40 and OX40L mRNA expression
levels were strikingly increased in the liver mononuclear cells
(MNCs) of mice receiving the HFD compared with those of lean
animals, and similar results were found in MCD- and CD-HFD-
fed mice (Figure 1A). Additionally, the plasma soluble OX40
levels in HFD, MCD, and CD-HFD mice were also remarkably
higher than those in control mice (Figure 1B). The typical flow cy-
tometry gating strategy to distinguish hepatic T cells is shown in
Figure S1A. Compared with the normal control diet (NCD) con-
trols, HFD-, MCD-, and CD-HFD-fed mice showed significantly
increased OX40 levels in total CD3 T cells and CD4 T cells but
not in CD8 T cells, natural killer (NK) cells, or NKT cells (Figures
1C and S1B).
The mechanism of OX40 upregulation is still largely unknown.
OX40 is expressed predominantly on activated T cells. Inter-
leukin (IL)-2, IL-4, and TNF have been reported to enhance or
prolong OX40 expression (Croft, 2010). In this study, we found
that IL-2, TNF-a, interferon (IFN)-g, and leptin were highly ex-
pressed in liver tissues of NASH models, but only exogenous
IL-2 stimulation upregulated OX40 expression in CD4 T cells
(Figures S1C–S1F). Meanwhile, we also observed IL-2 inducing
CD4 T cell upregulation of transcription factors Sp1/Sp3 and
p65 (Figure S1G), which have been reported to bind to OX40 pro-
moter and enhance OX40 expression (Tone et al., 2007). These
results suggest that during NASH development, IL-2 secretion
by activated CD4 T cells can further upregulate and maintain
OX40 expression.
To determine the potential role of OX40 in the regulation of liver
inflammation andNASHdevelopment, wild-type (WT) andOX40-
knockout (KO) mice were fed an HFD. OX40-KO mice gained
remarkably less weight than age-matched WT mice (Figure 1D),
although food intake between WT and OX40-KO mice was not
significantly different (Figure 1E). After 16 weeks of HFD feeding,
fasting glucose levels were significantly lower in OX40-KO mice
than in HFD-fed WT mice (Figure 1F). Likewise, liver weight
trended lower and liver size smaller in OX40-deficient mice
compared with WT mice (Figure 1G). H&E and oil red O staining
revealed decreased fat accumulation in the livers of OX40-KO
mice compared with WT mice, accompanied by decreased he-
patocellular ballooning and histological signs of inflammation
(Figure 1H). OX40-KO mice fed the HFD exhibited significantly
decreased plasma levels of alanine transaminase (ALT), aspar-
tate transaminase (AST), total bilirubin (TBIL), total cholesterol
T-CHO, and triglyceride (TG) (Figure 1I). As shown in Figure 1J,
OX40-deficienct mice also exhibited decreased levels of Ccl2,
Ccl12, Tnfa, Tgfb, Ifng, Il1b, Il2, Il4, Il17, and Il21 in liver tissues.
Fibrosis-related genes, such as Col1a1 and Col3a1, were also
downregulated in the liver of OX40-deficient mice. Similar results
were also found inMCD- and CD-HFD-fedmice, andH&E and oil
red O staining of liver samples demonstrated that OX40 defi-
ciency restricted fat accumulation, lobular inflammation, and
focal necrosis (Figures S2A and S2C). The mRNA levels of
some proinflammatory cytokines, such as Tnfa, Tgfb, Ifng, Il1b,
Il6, Il10, and Il17, were also downregulated in OX40-deficient
livers compared with control livers (Figures S2B and S2D).
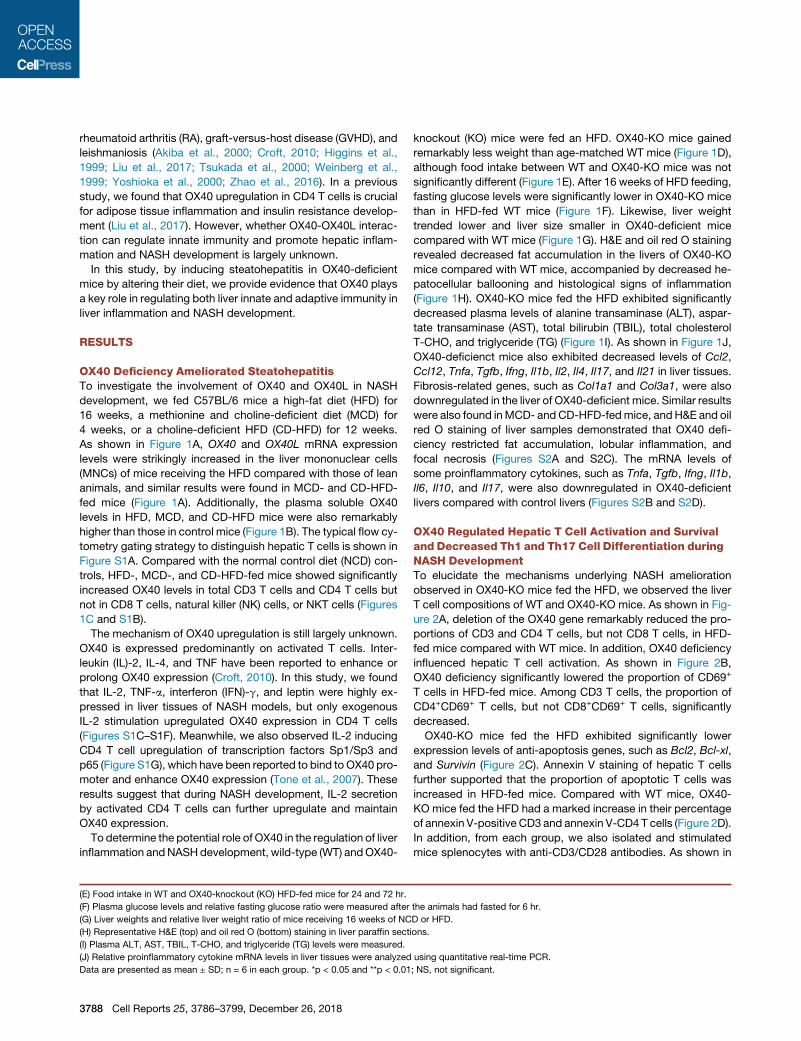
OX40 Regulated Hepatic T Cell Activation and Survivaland Decreased Th1 and Th17 Cell Differentiation duringNASH DevelopmentTo elucidate the mechanisms underlying NASH amelioration
observed in OX40-KO mice fed the HFD, we observed the liver
T cell compositions of WT and OX40-KO mice. As shown in Fig-
ure 2A, deletion of the OX40 gene remarkably reduced the pro-
portions of CD3 and CD4 T cells, but not CD8 T cells, in HFD-
fed mice compared with WT mice. In addition, OX40 deficiency
influenced hepatic T cell activation. As shown in Figure 2B,
OX40 deficiency significantly lowered the proportion of CD69+
T cells in HFD-fed mice. Among CD3 T cells, the proportion of
CD4+CD69+ T cells, but not CD8+CD69+ T cells, significantly
decreased.
OX40-KO mice fed the HFD exhibited significantly lower
expression levels of anti-apoptosis genes, such as Bcl2, Bcl-xl,
and Survivin (Figure 2C). Annexin V staining of hepatic T cells
further supported that the proportion of apoptotic T cells was
increased in HFD-fed mice. Compared with WT mice, OX40-
KO mice fed the HFD had a marked increase in their percentage
of annexin V-positive CD3 and annexin V-CD4 T cells (Figure 2D).
In addition, from each group, we also isolated and stimulated
mice splenocytes with anti-CD3/CD28 antibodies. As shown in
(E) Food intake in WT and OX40-knockout (KO) HFD-fed mice for 24 and 72 hr.
(F) Plasma glucose levels and relative fasting glucose ratio were measured after the animals had fasted for 6 hr.
(G) Liver weights and relative liver weight ratio of mice receiving 16 weeks of NCD or HFD.
(H) Representative H&E (top) and oil red O (bottom) staining in liver paraffin sections.
(I) Plasma ALT, AST, TBIL, T-CHO, and triglyceride (TG) levels were measured.
(J) Relative proinflammatory cytokine mRNA levels in liver tissues were analyzed using quantitative real-time PCR.
Data are presented as mean ± SD; n = 6 in each group. *p < 0.05 and **p < 0.01; NS, not significant.
3788 Cell Reports 25, 3786–3799, December 26, 2018
Figure 2E, after 3 days of stimulation, HFD-fed WT mice had
higher proliferation rates than NCD-fed WT mice. OX40 deletion
suppressed CD3 and CD4 T cell division even for mice receiving
the same HFD.
Among T cells, HFD-fed mice had significantly increased
IFN-g-, IL-17-, IL-4-, and IL-13-producing CD4 T cells, while
OX40-KO mice fed the HFD only exhibited remarkably
decreased percentages of IFN-g- and IL-17-producing CD4
T cells. Additionally, OX40 deletion also lowered the proportion
of Foxp3-positive cells in the total CD4 T cells of HFD-fed mice
(Figures 2F and 2G). Furthermore, we quantified the expression
of Th lineage-defining transcription factors in liver MNCs using
Figure 2. OX40 Deficiency Decreased Hepatic T Cell Activation, Survival, and Th1 and Th17 Cell Differentiation in Mice Fed the HFD
(A) T cell levels in mouse liver MNCs from each group.
(B) Representative flow cytometry image (left) and statistical analysis (right) of the percentages of CD69+ cells in CD3, CD4, and CD8 T cells.
(C) mRNA levels of apoptosis-related genes in hepatic MNCs.
(D) Annexin V+ cells relative to the total numbers of CD3 T cells, CD4 T cells, and CD8 T cells.
(E) EdU+ cells relative to the total numbers of CD3 T cells, CD4 T cells, and CD8 T cells.
(F) Representative flow cytometry images of IFN-g+, IL-4+, IL-13+, IL-17+, and Foxp3+ cells of CD4 T cells.
(G) Changes in the percentages of IFN-g+ cells, IL-4+ cells, IL-13+ cells, IL-17+ cells, and Foxp3+ cells in CD4 T cells from the liver tissues of HFDWT andOX40-KO
mice plotted as fold changes in the percentages of these cells in WT NCD-fed mice.
(H) Real-time PCR analysis of Tbx21, Gata3, RORgT, and Foxp3 levels in the liver tissues of mice from each group.
Data are depicted as mean ± SD; n = 6 in each group. *p < 0.05 and **p < 0.01; NS, not significant.
Cell Reports 25, 3786–3799, December 26, 2018 3789
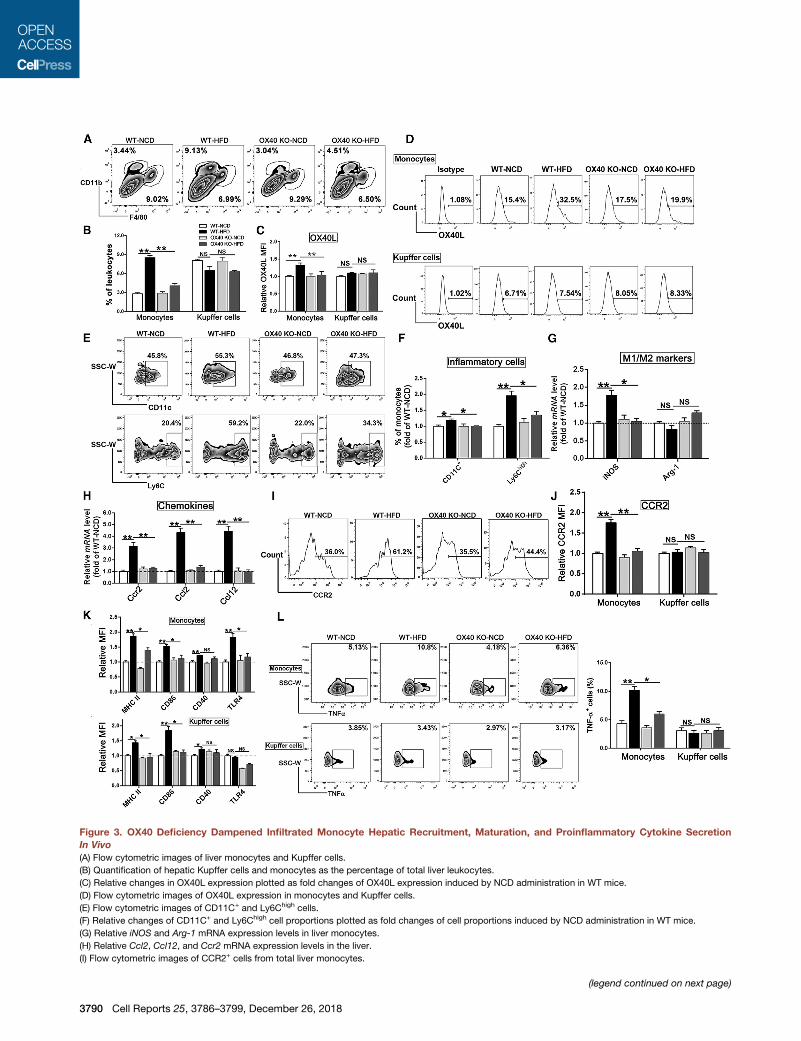
Figure 3. OX40 Deficiency Dampened Infiltrated Monocyte Hepatic Recruitment, Maturation, and Proinflammatory Cytokine Secretion
In Vivo
(A) Flow cytometric images of liver monocytes and Kupffer cells.
(B) Quantification of hepatic Kupffer cells and monocytes as the percentage of total liver leukocytes.
(C) Relative changes in OX40L expression plotted as fold changes of OX40L expression induced by NCD administration in WT mice.
(D) Flow cytometric images of OX40L expression in monocytes and Kupffer cells.
(E) Flow cytometric images of CD11C+ and Ly6Chigh cells.
(F) Relative changes of CD11C+ and Ly6Chigh cell proportions plotted as fold changes of cell proportions induced by NCD administration in WT mice.
(G) Relative iNOS and Arg-1 mRNA expression levels in liver monocytes.
(H) Relative Ccl2, Ccl12, and Ccr2 mRNA expression levels in the liver.
(I) Flow cytometric images of CCR2+ cells from total liver monocytes.
(legend continued on next page)
3790 Cell Reports 25, 3786–3799, December 26, 2018
real-time PCR. As shown in Figure 2H, HFD-fed mice showed
remarkably upregulated expression levels of transcription fac-
tors (Tbx21, RORgT, and Foxp3, but not Gata3), while OX40-
KO mice fed the HFD expressed significantly lower levels of
Tbx21 and RORgT.
To further prove that CD4 T cells are required for NASH devel-
opment, the mice in which CD4 T cells were depleted by anti-
body GK1.5 were fed the MCD for 4 weeks. As shown in
Figure S3, CD4 T cell depletion significantly lowered hepatic
steatosis and inflammation.
Taken together, these observations indicate that OX40
signaling contributes to hepatic inflammation and NASH devel-
opment by promoting hepatic CD4 T cell activation, proliferation,
survival, and Th1 and Th17 differentiation.
OX40 Deficiency Was Associated with theDownregulation of Infiltrated Monocytes HepaticRecruitment, Maturation, and ProinflammatoryCytokine SecretionTo further explore the changes in liver immunity associated with
NASH, the infiltrated monocytes and resident Kupffer cells of
OX40-KO mice were analyzed. No significant differences in
basal levels of bone marrow monocytes or liver monocytes
were found between WT and OX40-KO mice (Figures S4A and
S4B). However, as shown in Figures 3A and 3B, HFD-fed mice
showed increased proportions of liver infiltrated monocytes
(CD11bintF4/80low) but not resident Kupffer cells (CD11blow
F4/80hi). OX40 deficiency decreased liver infiltrated monocytes
in HFD-fed mice. The HFD-fed mice showed significantly upre-
gulated OX40L expression in monocytes (1.52-fold, p < 0.001;
Figures 3C and 3D). OX40-KOmice fed the HFD exhibited signif-
icantly lower expression levels of OX40L, while the OX40L
expression levels in resident Kupffer cells were not significantly
different.
The liver infiltrated monocytes of HFD-fed mice exhibited
remarkably higher percentages of inflammatory macro-
phages (CD11bintF4/80lowCD11C+, CD11bintF4/80lowLy6chigh)
with iNOS, but not Arg-1 mRNA expression. OX40 deletion
suppressed iNOS mRNA expression and lowered the
CD11C+ and Ly6chigh monocyte percentages (Figures 3E–
3G), indicating that the OX40 and OX40L signal promotes
liver monocyte and macrophage M1 polarization. CCR2 and
its chemokine ligand CCL2/CCL12, which regulate bone
marrow-derived monocyte recruitment to inflamed tissues dur-
ing hepatic steatosis (Baeck et al., 2012; Obstfeld et al., 2010),
were highly expressed in the liver tissues of HFD-fed mice
(Figure 3H). The liver infiltrated monocytes of HFD-fed mice
expressed higher levels of CCR2 than those of NCD-fed
mice, while OX40 deficiency decreased CCR2 expression
(Figures 3I and 3J). No significant difference in CCR2 expres-
sion was found in Kupffer cells from WT and OX40-KO mice
fed the HFD (Figure 3J).
Furthermore, HFD-fed mice exhibited remarkably upregulated
MCH II, CD86, CD40, and TLR4 expression in their infiltrated
monocytes, while OX40-KO mice fed the HFD exhibited signifi-
cantly lower levels of MCH II, CD86, and TLR4 (Figure 3K).
The HFD also induced Kupffer cells to highly express MHC
class II (MHC II), CD86, CD40, and TLR4, while OX40 deletion
decreased MHC II and CD86 expression in HFD-fed mice.
We also observed higher TNF-a production in infiltratedmono-
cytes after HFD feeding, and OX40 deficiency decreased TNF-a
secretion in HFD-fed mice. Additionally, TNF-a production in
Kupffer cells was not significantly different between the WT
and OX40-KO groups fed the HFD (Figure 3L). The same ana-
lyses were performed in MCD- or CD-HFD-fed WT and OX40-
KO mice, and similar results were obtained (Figures S4C–S4M
and S5A–S5I).
These results suggest that OX40 deficiency is associated with
the downregulation of infiltrated monocyte recruitment, matura-
tion, and proinflammatory cytokine secretion, which may play
important roles in the improvement of liver steatosis.
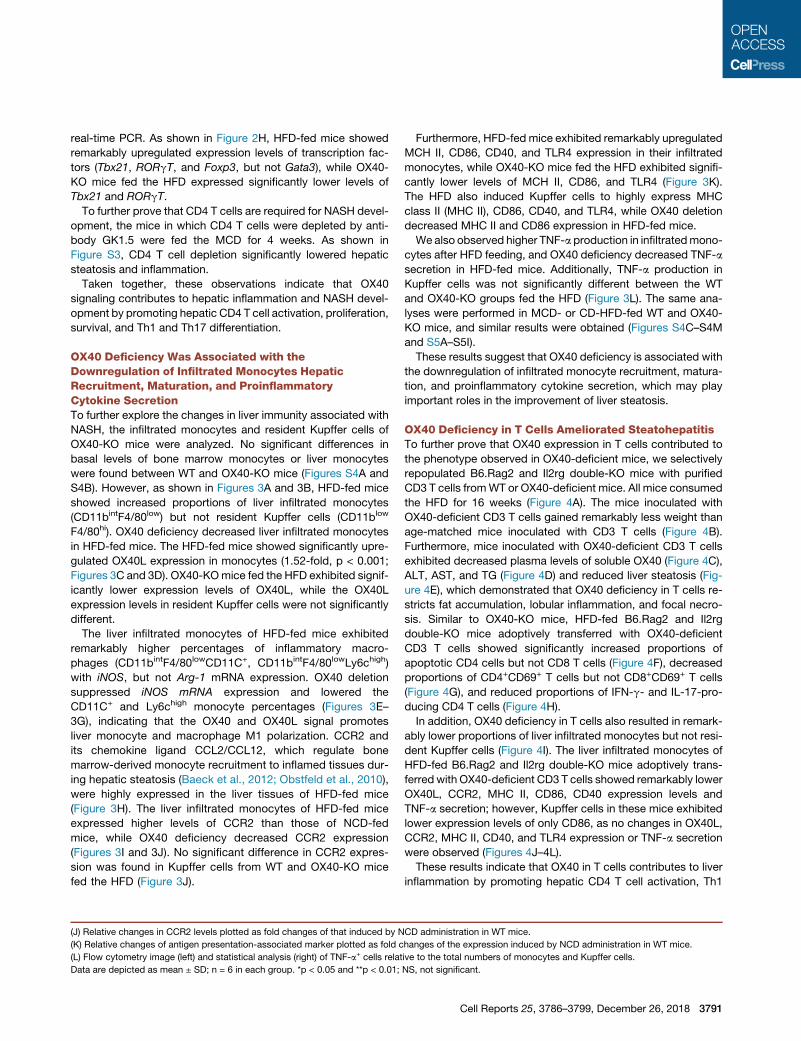
OX40 Deficiency in T Cells Ameliorated SteatohepatitisTo further prove that OX40 expression in T cells contributed to
the phenotype observed in OX40-deficient mice, we selectively
repopulated B6.Rag2 and Il2rg double-KO mice with purified
CD3 T cells fromWT or OX40-deficient mice. All mice consumed
the HFD for 16 weeks (Figure 4A). The mice inoculated with
OX40-deficient CD3 T cells gained remarkably less weight than
age-matched mice inoculated with CD3 T cells (Figure 4B).
Furthermore, mice inoculated with OX40-deficient CD3 T cells
exhibited decreased plasma levels of soluble OX40 (Figure 4C),
ALT, AST, and TG (Figure 4D) and reduced liver steatosis (Fig-
ure 4E), which demonstrated that OX40 deficiency in T cells re-
stricts fat accumulation, lobular inflammation, and focal necro-
sis. Similar to OX40-KO mice, HFD-fed B6.Rag2 and Il2rg
double-KO mice adoptively transferred with OX40-deficient
CD3 T cells showed significantly increased proportions of
apoptotic CD4 cells but not CD8 T cells (Figure 4F), decreased
proportions of CD4+CD69+ T cells but not CD8+CD69+ T cells
(Figure 4G), and reduced proportions of IFN-g- and IL-17-pro-
ducing CD4 T cells (Figure 4H).
In addition, OX40 deficiency in T cells also resulted in remark-
ably lower proportions of liver infiltrated monocytes but not resi-
dent Kupffer cells (Figure 4I). The liver infiltrated monocytes of
HFD-fed B6.Rag2 and Il2rg double-KO mice adoptively trans-
ferred with OX40-deficient CD3 T cells showed remarkably lower
OX40L, CCR2, MHC II, CD86, CD40 expression levels and
TNF-a secretion; however, Kupffer cells in these mice exhibited
lower expression levels of only CD86, as no changes in OX40L,
CCR2, MHC II, CD40, and TLR4 expression or TNF-a secretion
were observed (Figures 4J–4L).
These results indicate that OX40 in T cells contributes to liver
inflammation by promoting hepatic CD4 T cell activation, Th1
(J) Relative changes in CCR2 levels plotted as fold changes of that induced by NCD administration in WT mice.
(K) Relative changes of antigen presentation-associated marker plotted as fold changes of the expression induced by NCD administration in WT mice.
(L) Flow cytometry image (left) and statistical analysis (right) of TNF-a+ cells relative to the total numbers of monocytes and Kupffer cells.
Data are depicted as mean ± SD; n = 6 in each group. *p < 0.05 and **p < 0.01; NS, not significant.
Cell Reports 25, 3786–3799, December 26, 2018 3791
and Th17 differentiation, and monocyte M1 polarization during
NASH development.
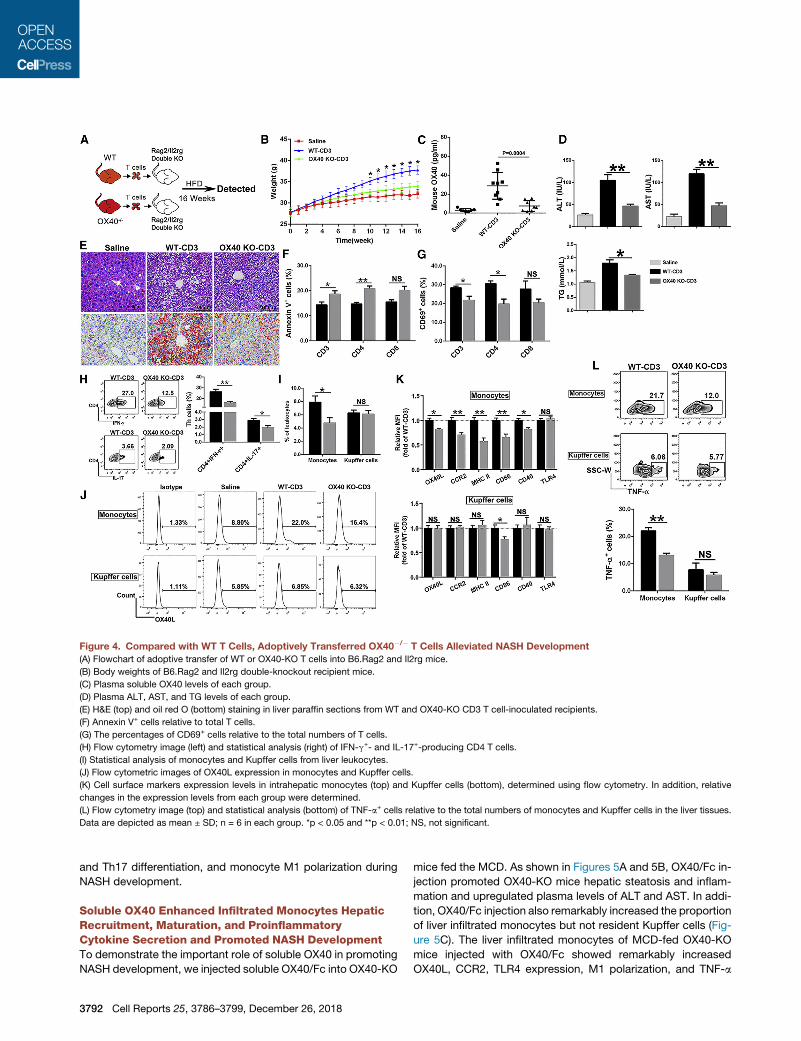
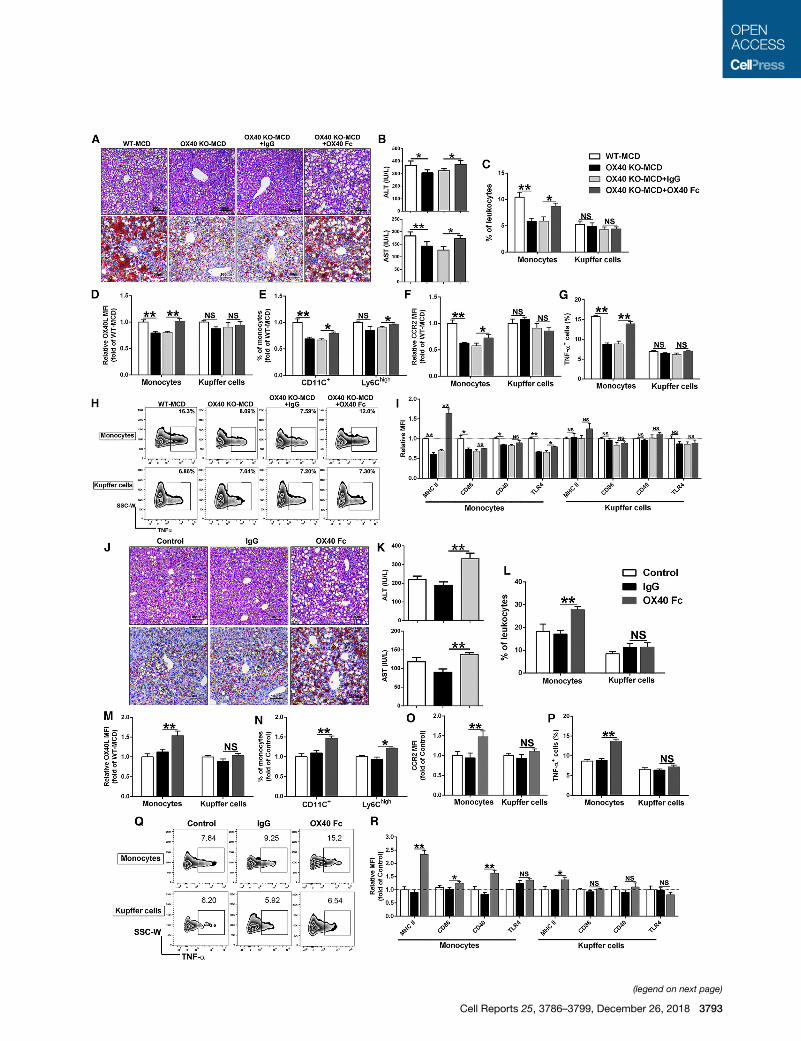
Soluble OX40 Enhanced Infiltrated Monocytes HepaticRecruitment, Maturation, and ProinflammatoryCytokine Secretion and Promoted NASH DevelopmentTo demonstrate the important role of soluble OX40 in promoting
NASH development, we injected soluble OX40/Fc into OX40-KO
mice fed the MCD. As shown in Figures 5A and 5B, OX40/Fc in-
jection promoted OX40-KO mice hepatic steatosis and inflam-
mation and upregulated plasma levels of ALT and AST. In addi-
tion, OX40/Fc injection also remarkably increased the proportion
of liver infiltrated monocytes but not resident Kupffer cells (Fig-
ure 5C). The liver infiltrated monocytes of MCD-fed OX40-KO
mice injected with OX40/Fc showed remarkably increased
OX40L, CCR2, TLR4 expression, M1 polarization, and TNF-a
Figure 4. Compared with WT T Cells, Adoptively Transferred OX40�/� T Cells Alleviated NASH Development
(A) Flowchart of adoptive transfer of WT or OX40-KO T cells into B6.Rag2 and Il2rg mice.
(B) Body weights of B6.Rag2 and Il2rg double-knockout recipient mice.
(C) Plasma soluble OX40 levels of each group.
(D) Plasma ALT, AST, and TG levels of each group.
(E) H&E (top) and oil red O (bottom) staining in liver paraffin sections from WT and OX40-KO CD3 T cell-inoculated recipients.
(F) Annexin V+ cells relative to total T cells.
(G) The percentages of CD69+ cells relative to the total numbers of T cells.
(H) Flow cytometry image (left) and statistical analysis (right) of IFN-g+- and IL-17+-producing CD4 T cells.
(I) Statistical analysis of monocytes and Kupffer cells from liver leukocytes.
(J) Flow cytometric images of OX40L expression in monocytes and Kupffer cells.
(K) Cell surface markers expression levels in intrahepatic monocytes (top) and Kupffer cells (bottom), determined using flow cytometry. In addition, relative
changes in the expression levels from each group were determined.
(L) Flow cytometry image (top) and statistical analysis (bottom) of TNF-a+ cells relative to the total numbers of monocytes and Kupffer cells in the liver tissues.
Data are depicted as mean ± SD; n = 6 in each group. *p < 0.05 and **p < 0.01; NS, not significant.
3792 Cell Reports 25, 3786–3799, December 26, 2018
(legend on next page)
Cell Reports 25, 3786–3799, December 26, 2018 3793
secretion; however, Kupffer cells in these mice exhibited no
changes in OX40L, CCR2, TLR4 expression, or TNF-a secretion
(Figures 5D–5I). Meanwhile, we also observed similar results in
B6.Rag2 and Il2rg double-KO mice injected with soluble OX40/
Fc (Figures 5J–5R). These observations demonstrated that
without CD4 T cell involvement, soluble OX40 in vivo stimulation
alone can enhance infiltrated monocyte hepatic recruitment,
maturation, and proinflammatory cytokine secretion and pro-
mote NASH development.
To further examine the mechanism of OX40 in regulating liver
monocyte andmacrophage inflammation during NASH develop-
ment, highly purified (>98% purity) Kupffer cells and monocytes
were isolated from the livers of WT mice and stimulated with re-
combinant soluble OX40/Fc (2 mg/mL) with or without recombi-
nant OX40L (0.5 mg/mL) for 2 days. As shown in Figure 6A, the
expression levels of antigen presentation-associated markers
(MHC II, CD40, CD86, and OX40L) and chemokine receptors
(CCR2, CCR5, and CCR9) in monocytes were markedly higher
than those in the IgG-treated control groups. However, when
soluble OX40L was presented in the culture, the responses of
monocytes induced by OX40/Fc were neutralized. No such
effects were observed in Kupffer cells, indicating that OX40
mainly regulates infiltrated monocyte antigen presentation
and migration. Additionally, recombinant OX40/Fc stimulation
could also elevate the mRNA levels of Tnfa and Il1b in isolated
hepatic monocytes (Figure 6B). We also demonstrated these
observations by stimulating bone marrow monocytes with
OX40/Fc and OX40L (Figures 6C and 6D). Moreover, GFP+
monocyte migration was significantly increased upon treatment
with OX40/Fc for 8 and 24 hr, while the GFP+ Kupffer cell
numbers were not significantly different after OX40/Fc treatment
(Figure 6E).
To better understand the role of OX40 in the regulation of
monocyte activation and polarization, OX40/Fc- or control IgG-
treated liver monocytes were compared in a transcriptome
sequencing study (Figure 6F). Gene Ontology (GO) and Kyoto
Encyclopedia of Genes and Genomes (KEGG) pathway analyses
(Figure 6G) revealed that upregulated genes from OX40-stimu-
lated monocytes are involved in the inflammatory response;
cytokine production regulation; lipid, cytokine, and bacteria re-
sponses; the innate immune response; the enhanced cellular
response to cytokines and cytokine-cytokine receptor interac-
tion; and the phagosome and chemokine signaling pathway,
among others. Compared with control monocytes, OX40/Fc-
treated monocytes exhibited upregulated levels of cytokines
(Tnf, Il1a, Il1b, Il6, and Il12a), cytokine receptors (Il1rl1, Il2r,
Il18r, and Il23r), chemokines (Ccl3, Ccl4, Ccl22, Cxcl1, Cxcl2,
Cxcl10, and Cx3cl1), chemokine receptors (Ccr2, Ccrl2, Cxcr5,
and Cxcr6), and antigen processing and presentation molecules
(Cd40, Cd80, Cd86, Tlr1, Tlr2, and Ox40l) (Figure 6H).
The coordinated action of various inflammatory modulators,
signaling molecules, and transcription factors, including Nlrp3,
Tank, Jak2, Stat5a, Hif1a, Nos2, Socs3, Mir155hg, and Pparg,
was determined to be involved in the OX40 regulation of mono-
cyte M1 polarization. MyD88, Irf3, Irf5, Stat1, Nod1, and Nod2
may not be involved in OX40-triggered monocyte M1 polariza-
tion (Figure 6I).
OX40 Is Associated with NASH in HumansTo determine whether our findings are relevant for humans, we
analyzed the plasma soluble OX40 (sOX40) levels of 54 NASH
patients and 58 healthy controls in this observational study. Their
demographic and clinical characteristics are shown in Table S1.
Notably, we detected higher soluble OX40 plasma levels in
NASH patients (11.29 ± 3.399 pg/mL) than in healthy controls
(6.161 ± 1.213 pg/mL) (p < 0.0001; Figure 7A). In NASH patients,
soluble OX40 levels were positively correlated with BMI (rho =
0.427, p = 0.001), ALT (rho = 0.382, p = 0.004), fasting glucose
(rho = 0.399, p = 0.003), liver steatosis (rho = 0.636, p = 0.001),
lobular inflammation (rho = 0.417, p = 0.002), ballooning (rho =
0.304, p = 0.026), and fibrosis (rho = 0.356, p = 0.008). No corre-
lations of soluble OX40were foundwith T-CHO, TG, high-density
lipoprotein cholesterol (HDL-C), and low-density lipoprotein
cholesterol (LDL-C) levels (Table S2). As shown in Figure 7B,
notably, higher soluble OX40 plasma levels in NASH patients
were associated with higher steatosis, activity, and fibrosis
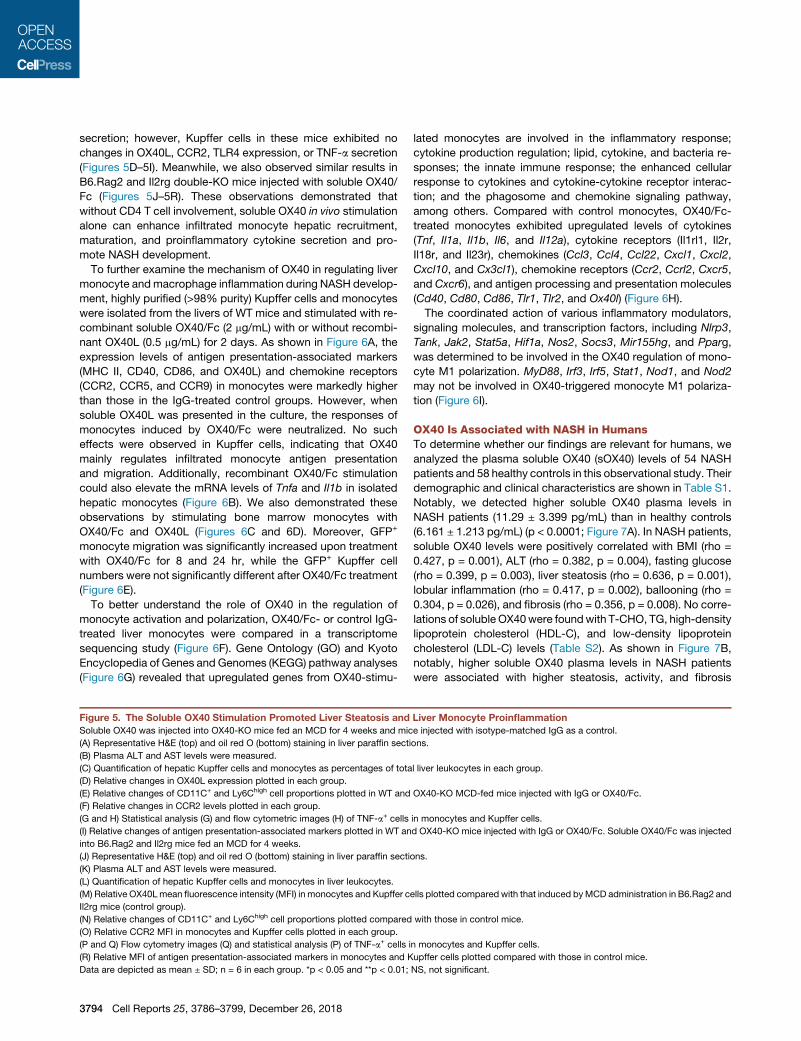
Figure 5. The Soluble OX40 Stimulation Promoted Liver Steatosis and Liver Monocyte Proinflammation
Soluble OX40 was injected into OX40-KO mice fed an MCD for 4 weeks and mice injected with isotype-matched IgG as a control.
(A) Representative H&E (top) and oil red O (bottom) staining in liver paraffin sections.
(B) Plasma ALT and AST levels were measured.
(C) Quantification of hepatic Kupffer cells and monocytes as percentages of total liver leukocytes in each group.
(D) Relative changes in OX40L expression plotted in each group.
(E) Relative changes of CD11C+ and Ly6Chigh cell proportions plotted in WT and OX40-KO MCD-fed mice injected with IgG or OX40/Fc.
(F) Relative changes in CCR2 levels plotted in each group.
(G and H) Statistical analysis (G) and flow cytometric images (H) of TNF-a+ cells in monocytes and Kupffer cells.
(I) Relative changes of antigen presentation-associated markers plotted in WT and OX40-KO mice injected with IgG or OX40/Fc. Soluble OX40/Fc was injected
into B6.Rag2 and Il2rg mice fed an MCD for 4 weeks.
(J) Representative H&E (top) and oil red O (bottom) staining in liver paraffin sections.
(K) Plasma ALT and AST levels were measured.
(L) Quantification of hepatic Kupffer cells and monocytes in liver leukocytes.
(M) Relative OX40Lmean fluorescence intensity (MFI) in monocytes and Kupffer cells plotted compared with that induced byMCD administration in B6.Rag2 and
Il2rg mice (control group).
(N) Relative changes of CD11C+ and Ly6Chigh cell proportions plotted compared with those in control mice.
(O) Relative CCR2 MFI in monocytes and Kupffer cells plotted in each group.
(P and Q) Flow cytometry images (Q) and statistical analysis (P) of TNF-a+ cells in monocytes and Kupffer cells.
(R) Relative MFI of antigen presentation-associated markers in monocytes and Kupffer cells plotted compared with those in control mice.
Data are depicted as mean ± SD; n = 6 in each group. *p < 0.05 and **p < 0.01; NS, not significant.
3794 Cell Reports 25, 3786–3799, December 26, 2018
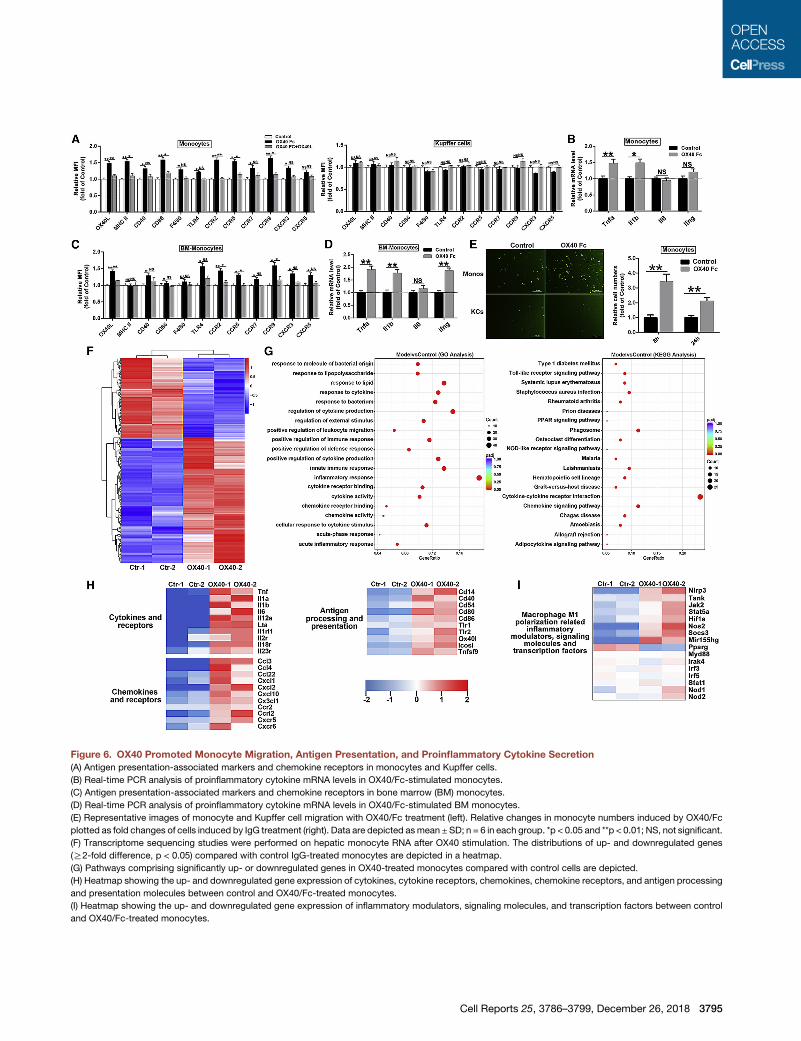
Figure 6. OX40 Promoted Monocyte Migration, Antigen Presentation, and Proinflammatory Cytokine Secretion
(A) Antigen presentation-associated markers and chemokine receptors in monocytes and Kupffer cells.
(B) Real-time PCR analysis of proinflammatory cytokine mRNA levels in OX40/Fc-stimulated monocytes.
(C) Antigen presentation-associated markers and chemokine receptors in bone marrow (BM) monocytes.
(D) Real-time PCR analysis of proinflammatory cytokine mRNA levels in OX40/Fc-stimulated BM monocytes.
(E) Representative images of monocyte and Kupffer cell migration with OX40/Fc treatment (left). Relative changes in monocyte numbers induced by OX40/Fc
plotted as fold changes of cells induced by IgG treatment (right). Data are depicted asmean ±SD; n = 6 in each group. *p < 0.05 and **p < 0.01; NS, not significant.
(F) Transcriptome sequencing studies were performed on hepatic monocyte RNA after OX40 stimulation. The distributions of up- and downregulated genes
(R2-fold difference, p < 0.05) compared with control IgG-treated monocytes are depicted in a heatmap.
(G) Pathways comprising significantly up- or downregulated genes in OX40-treated monocytes compared with control cells are depicted.
(H) Heatmap showing the up- and downregulated gene expression of cytokines, cytokine receptors, chemokines, chemokine receptors, and antigen processing
and presentation molecules between control and OX40/Fc-treated monocytes.
(I) Heatmap showing the up- and downregulated gene expression of inflammatory modulators, signaling molecules, and transcription factors between control
and OX40/Fc-treated monocytes.
Cell Reports 25, 3786–3799, December 26, 2018 3795
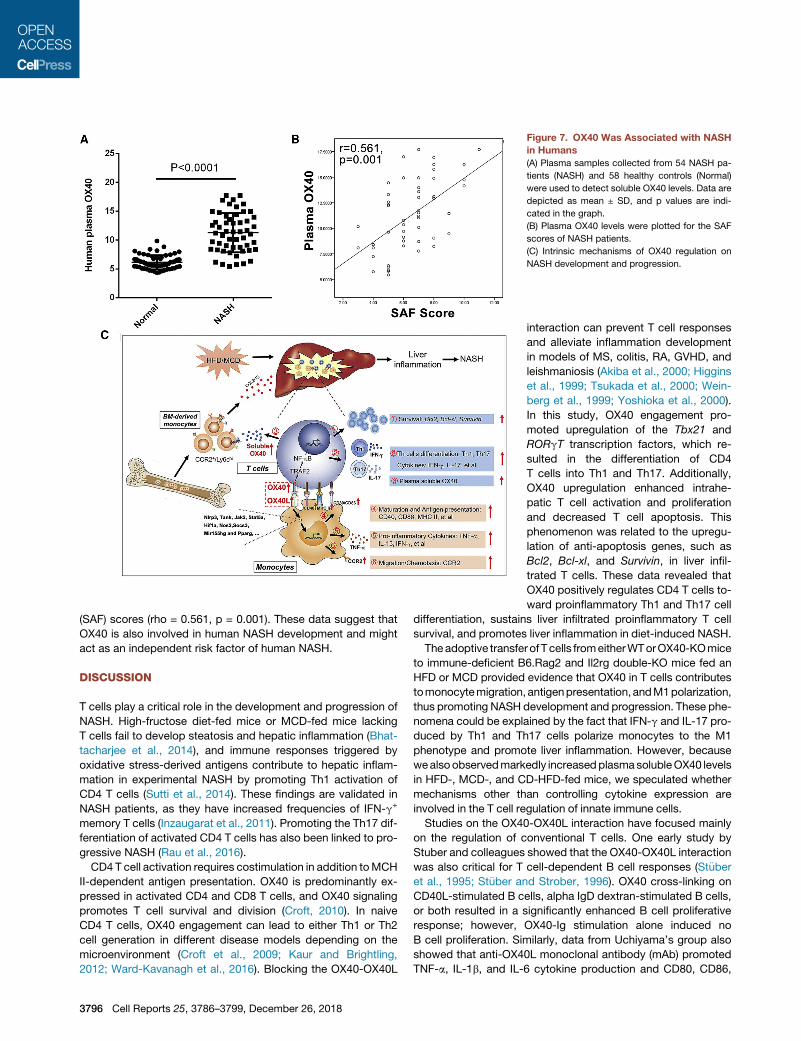
(SAF) scores (rho = 0.561, p = 0.001). These data suggest that
OX40 is also involved in human NASH development and might
act as an independent risk factor of human NASH.
DISCUSSION
T cells play a critical role in the development and progression of
NASH. High-fructose diet-fed mice or MCD-fed mice lacking
T cells fail to develop steatosis and hepatic inflammation (Bhat-
tacharjee et al., 2014), and immune responses triggered by
oxidative stress-derived antigens contribute to hepatic inflam-
mation in experimental NASH by promoting Th1 activation of
CD4 T cells (Sutti et al., 2014). These findings are validated in
NASH patients, as they have increased frequencies of IFN-g+
memory T cells (Inzaugarat et al., 2011). Promoting the Th17 dif-
ferentiation of activated CD4 T cells has also been linked to pro-
gressive NASH (Rau et al., 2016).
CD4 T cell activation requires costimulation in addition toMCH
II-dependent antigen presentation. OX40 is predominantly ex-
pressed in activated CD4 and CD8 T cells, and OX40 signaling
promotes T cell survival and division (Croft, 2010). In naive
CD4 T cells, OX40 engagement can lead to either Th1 or Th2
cell generation in different disease models depending on the
microenvironment (Croft et al., 2009; Kaur and Brightling,
2012; Ward-Kavanagh et al., 2016). Blocking the OX40-OX40L
Figure 7. OX40 Was Associated with NASH
in Humans
(A) Plasma samples collected from 54 NASH pa-
tients (NASH) and 58 healthy controls (Normal)
were used to detect soluble OX40 levels. Data are
depicted as mean ± SD, and p values are indi-
cated in the graph.
(B) Plasma OX40 levels were plotted for the SAF
scores of NASH patients.
(C) Intrinsic mechanisms of OX40 regulation on
NASH development and progression.
interaction can prevent T cell responses
and alleviate inflammation development
in models of MS, colitis, RA, GVHD, and
leishmaniosis (Akiba et al., 2000; Higgins
et al., 1999; Tsukada et al., 2000; Wein-
berg et al., 1999; Yoshioka et al., 2000).
In this study, OX40 engagement pro-
moted upregulation of the Tbx21 and
RORgT transcription factors, which re-
sulted in the differentiation of CD4
T cells into Th1 and Th17. Additionally,
OX40 upregulation enhanced intrahe-
patic T cell activation and proliferation
and decreased T cell apoptosis. This
phenomenon was related to the upregu-
lation of anti-apoptosis genes, such as
Bcl2, Bcl-xl, and Survivin, in liver infil-
trated T cells. These data revealed that
OX40 positively regulates CD4 T cells to-
ward proinflammatory Th1 and Th17 cell
differentiation, sustains liver infiltrated proinflammatory T cell
survival, and promotes liver inflammation in diet-induced NASH.
Theadoptive transferof Tcells fromeitherWTorOX40-KOmice
to immune-deficient B6.Rag2 and Il2rg double-KO mice fed an
HFD or MCD provided evidence that OX40 in T cells contributes
tomonocytemigration, antigenpresentation, andM1polarization,
thus promoting NASH development and progression. These phe-
nomena could be explained by the fact that IFN-g and IL-17 pro-
duced by Th1 and Th17 cells polarize monocytes to the M1
phenotype and promote liver inflammation. However, because
wealsoobservedmarkedly increasedplasmasolubleOX40 levels
in HFD-, MCD-, and CD-HFD-fed mice, we speculated whether
mechanisms other than controlling cytokine expression are
involved in the T cell regulation of innate immune cells.
Studies on the OX40-OX40L interaction have focused mainly
on the regulation of conventional T cells. One early study by
Stuber and colleagues showed that the OX40-OX40L interaction
was also critical for T cell-dependent B cell responses (St€uber
et al., 1995; St€uber and Strober, 1996). OX40 cross-linking on
CD40L-stimulated B cells, alpha IgD dextran-stimulated B cells,
or both resulted in a significantly enhanced B cell proliferative
response; however, OX40-Ig stimulation alone induced no
B cell proliferation. Similarly, data from Uchiyama’s group also
showed that anti-OX40L monoclonal antibody (mAb) promoted
TNF-a, IL-1b, and IL-6 cytokine production and CD80, CD86,
3796 Cell Reports 25, 3786–3799, December 26, 2018
and CD54 expression in CD40L-activated dendritic cells (DCs),
while anti-OX40L mAb alone had no significant effect on DCs
(Ohshima et al., 1997).
In the present study, similar to the results in vivo, OX40
engagement upregulated antigen presentation-associated mol-
ecules, chemokine receptors, and proinflammatory cytokines
in monocytes. These phenomena could be blocked by recombi-
nant OX40L. All these data indicate that OX40 in T cells or soluble
OX40 alone can regulate monocyte maturation, migration and
M1 polarization through the OX40-OX40L interaction. Although
the coordinated action of various inflammatory modulators,
signaling molecules, and transcription factors (including Nlrp3,
Tank, Jak2, Stat5a, Hif1a, Nos2, Socs3, Mir155hg, and Pparg)
was determined to be involved in the OX40 regulation of mono-
cyte M1 polarization, the signaling pathways between OX40L
engagement and inflammatory consequences in monocytes/
macrophages still need to be further explored.
Soluble formshavebeendemonstrated for severalmembers of
the TNF receptor family, including TNF and NGF receptors, such
as CD27, CD30, CD95, and CD137 (Cascino et al., 1995; Cheng
et al., 1994; Kohno et al., 1990; Michel et al., 1998; Pizzolo et al.,
1990). Similar to these receptors, solubleOX40maybeproduced
through cleavage from cell-surface OX40 or alternative splicing
(Taylor and Schwarz, 2001). NASH is not only a liver-exclusive
disease but also a hepatic manifestation of a systemic disease
state characterized by obesity, insulin resistance, and chronic
low-grade inflammation. The increased soluble OX40 in serum
may also further promote systemic inflammation and onset of
other inflammation-related diseases. To investigate the rele-
vance of our findings to humans, we measured soluble OX40 in
plasma from NASH patients and healthy controls. We observed
that individuals with NASH exhibited significantly higher soluble
OX40 plasma levels than healthy controls. These findings indi-
cate that OX40 may also be an important regulator and potential
contributor in human NASH development and progression.
In summary, duringNASHdevelopment, the activationof T cells
upregulated costimulatory OX40 expression, and OX40 further
promoted intrahepatic T cell activation, proliferation, anddifferen-
tiation into Th1 andTh17 cells. Additionally,OX40Lwasalso upre-
gulated in infiltrated monocytes during hepatic steatosis. The
cross-linking of OX40with its ligandOX40L enhanced the antigen
presentation abilities of monocytes and macrophages, TNF-a
secretion,migration, and recruitment in steatotic livers.Moreover,
the soluble OX40 secreted by activated T cells could further pro-
mote bone marrow-derived monocyte hepatic recruitment and
increase systemic inflammation (Figure 7C).
In conclusion, we have elucidated a novel pathway for T cell
regulation of innate immune cells. OX40 is a key molecule that
mediates crosstalk between intrahepatic innate and adaptive
immunity, generates two-way signals, and promotes both proin-
flammatory monocyte and macrophage and T cell function, re-
sulting in NASH development and progression. OX40 could
serve as a diagnostic index and therapeutic target of NASH.
STAR+METHODS
Detailed methods are provided in the online version of this paper
and include the following:
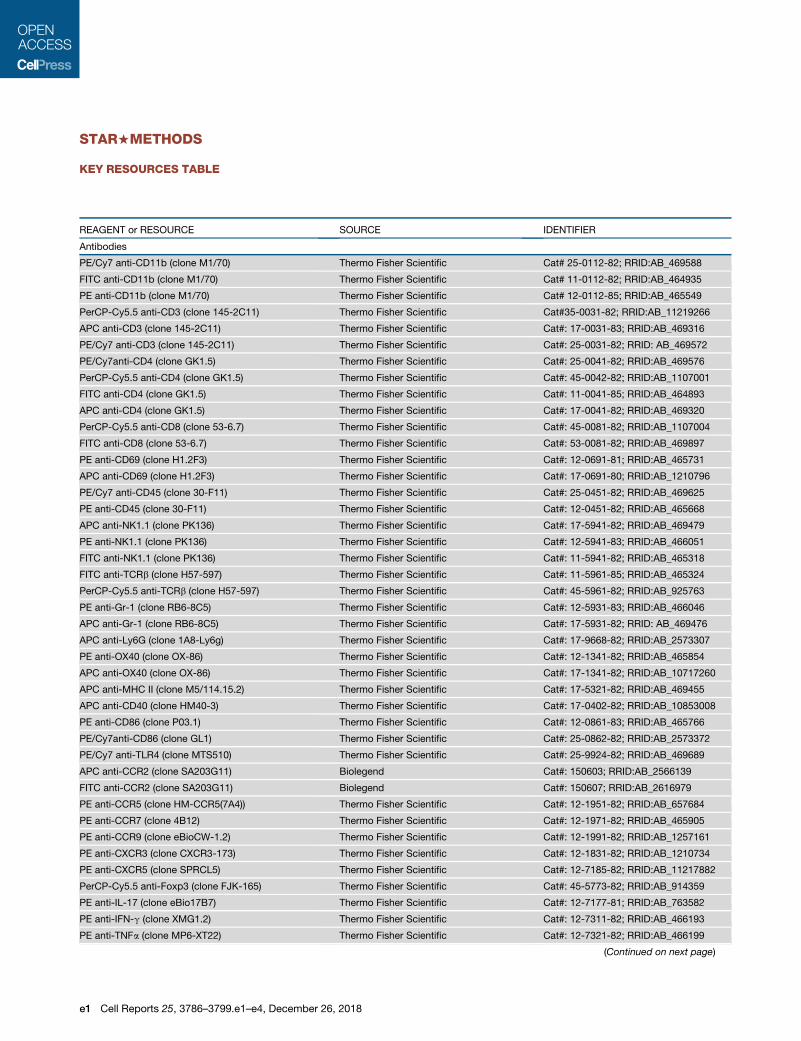
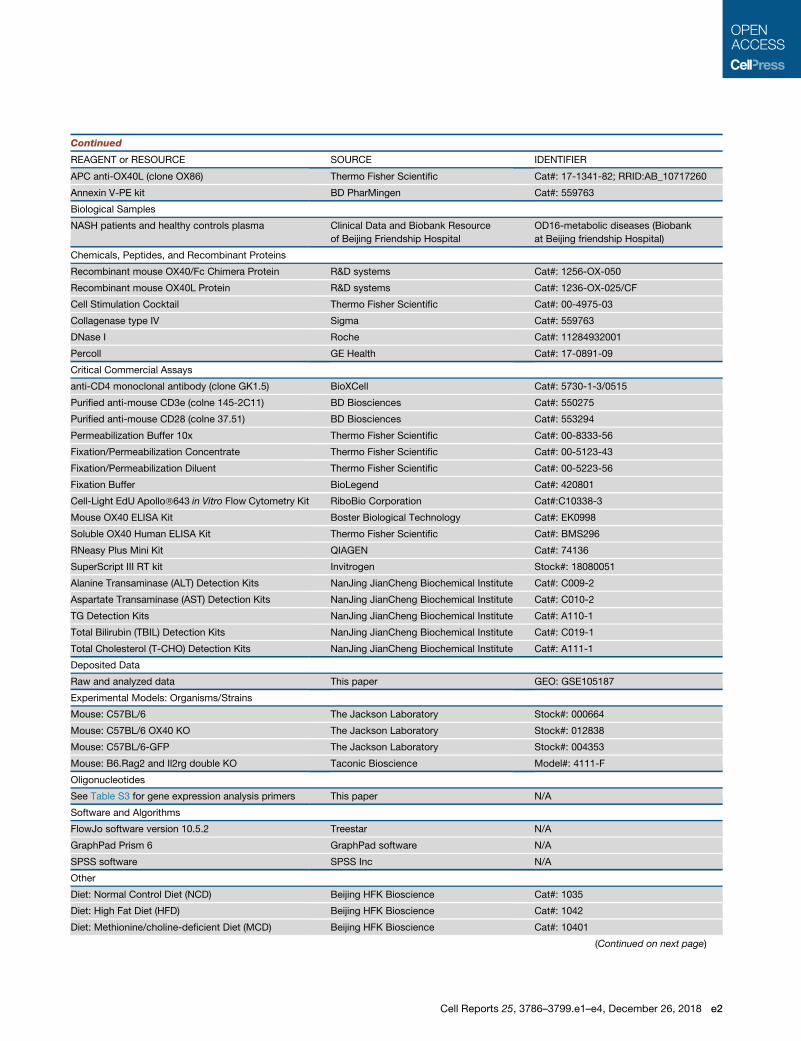
d KEY RESOURCES TABLE
d CONTACT FOR REAGENT AND RESOURCE SHARING
d EXPERIMENTAL MODEL AND SUBJECT DETAILS
B Mice
d METHOD DETAILS
B Isolation of liver immune cells by enzymatic digestion
B Real-time PCR
B Flow cytometry analysis
B T cell isolation and T cell proliferation assay
B CD4+ T cell depletion in vivo
B Adoptive transfer of T cells
B Soluble OX40 stimulation in vivo
B Transwell assays
B Clinical study
d QANTIFICATION AND STATISTICAL ANALYSIS
SUPPLEMENTAL INFORMATION
Supplemental Information includes five figures and three tables and can be
found with this article online at https://doi.org/10.1016/j.celrep.2018.12.006.
ACKNOWLEDGMENTS
This work was supported by grants from the National Natural Science
Foundation of China (81570510, 81500598, and 81501379), the Beijing Natural
Science Foundation (7172060), and the WBE Liver Fibrosis Foundation
(CFHPC20161054).
AUTHOR CONTRIBUTIONS
All listed authors participated meaningfully in the study and have seen and
approved the submission of this manuscript. G.S., H.J., and C.Z. performed
the research, analyzed the data, and initiated the original draft of the article.
H.M. performed the clinical study. X.Z., D.W., X.O., Q.W., S.L., T.W., X.S.,
W.S., D.T., K.L., W.G., H.X., Y.T., X.L., and J.J. performed the research and
collected the data. D.Z. established the hypotheses, supervised the studies,
analyzed the data, and co-wrote the manuscript. Z.Z. supervised the clinical
studies, analyzed the data, and co-wrote the manuscript.
DECLARATION OF INTERESTS
The authors declare no competing interests.
Received: December 22, 2017
Revised: July 26, 2018
Accepted: November 30, 2018
Published: December 26, 2018
REFERENCES
Akiba, H., Miyahira, Y., Atsuta, M., Takeda, K., Nohara, C., Futagawa, T., Mat-
suda, H., Aoki, T., Yagita, H., and Okumura, K. (2000). Critical contribution of
OX40 ligand to T helper cell type 2 differentiation in experimental leishmani-
asis. J. Exp. Med. 191, 375–380.
Angulo, P. (2002). Nonalcoholic fatty liver disease. N. Engl. J. Med. 346, 1221–
1231.
Anstee, Q.M., Targher, G., and Day, C.P. (2013). Progression of NAFLD to dia-
betes mellitus, cardiovascular disease or cirrhosis. Nat. Rev. Gastroenterol.
Hepatol. 10, 330–344.
Arab, J.P., Arrese, M., and Trauner, M. (2018). Recent insights into the patho-
genesis of nonalcoholic fatty liver disease. Annu. Rev. Pathol. 13, 321–350.
Baeck, C., Wehr, A., Karlmark, K.R., Heymann, F., Vucur, M., Gassler, N.,
Huss, S., Klussmann, S., Eulberg, D., Luedde, T., et al. (2012).
Cell Reports 25, 3786–3799, December 26, 2018 3797
Pharmacological inhibition of the chemokine CCL2 (MCP-1) diminishes liver
macrophage infiltration and steatohepatitis in chronic hepatic injury. Gut 61,
416–426.
Bedossa, P.; FLIP Pathology Consortium (2014). Utility and appropriateness of
the fatty liver inhibition of progression (FLIP) algorithm and steatosis, activity,
and fibrosis (SAF) score in the evaluation of biopsies of nonalcoholic fatty liver
disease. Hepatology 60, 565–575.
Bhattacharjee, J., Kumar, J.M., Arindkar, S., Das, B., Pramod, U., Juyal, R.C.,
Majumdar, S.S., and Nagarajan, P. (2014). Role of immunodeficient animal
models in the development of fructose induced NAFLD. J. Nutr. Biochem.
25, 219–226.
Borrelli, A., Bonelli, P., Tuccillo, F.M., Goldfine, I.D., Evans, J.L., Buonaguro,
F.M., and Mancini, A. (2018). Role of gut microbiota and oxidative stress in
the progression of non-alcoholic fatty liver disease to hepatocarcinoma: Cur-
rent and innovative therapeutic approaches. Redox Biol. 15, 467–479.
Cascino, I., Fiucci, G., Papoff, G., and Ruberti, G. (1995). Three functional sol-
uble forms of the human apoptosis-inducing Fas molecule are produced by
alternative splicing. J. Immunol. 154, 2706–2713.
Chatzigeorgiou, A., Chung, K.J., Garcia-Martin, R., Alexaki, V.I., Klotzsche-
von Ameln, A., Phieler, J., Sprott, D., Kanczkowski, W., Tzanavari, T., Bdeir,
M., et al. (2014). Dual role of B7 costimulation in obesity-related nonalco-
holic steatohepatitis and metabolic dysregulation. Hepatology 60, 1196–
1210.
Cheng, J., Zhou, T., Liu, C., Shapiro, J.P., Brauer, M.J., Kiefer, M.C., Barr, P.J.,
andMountz, J.D. (1994). Protection from Fas-mediated apoptosis by a soluble
form of the Fas molecule. Science 263, 1759–1762.
Croft, M. (2010). Control of immunity by the TNFR-related molecule OX40
(CD134). Annu. Rev. Immunol. 28, 57–78.
Croft, M., So, T., Duan, W., and Soroosh, P. (2009). The significance of OX40
and OX40L to T-cell biology and immune disease. Immunol. Rev. 229,
173–191.
Ganz, M., and Szabo, G. (2013). Immune and inflammatory pathways in NASH.
Hepatol. Int. 7 (Suppl 2), 771–781.
Guo, C.A., Kogan, S., Amano, S.U., Wang, M., Dagdeviren, S., Friedline,
R.H., Aouadi, M., Kim, J.K., and Czech, M.P. (2013). CD40 deficiency in
mice exacerbates obesity-induced adipose tissue inflammation, hepatic
steatosis, and insulin resistance. Am. J. Physiol. Endocrinol. Metab. 304,
E951–E963.
Heymann, F., and Tacke, F. (2016). Immunology in the liver–from homeostasis
to disease. Nat. Rev. Gastroenterol. Hepatol. 13, 88–110.
Higgins, L.M., McDonald, S.A., Whittle, N., Crockett, N., Shields, J.G., and
MacDonald, T.T. (1999). Regulation of T cell activation in vitro and in vivo by
targeting the OX40-OX40 ligand interaction: amelioration of ongoing inflam-
matory bowel disease with an OX40-IgG fusion protein, but not with an
OX40 ligand-IgG fusion protein. J. Immunol. 162, 486–493.
Inzaugarat, M.E., Ferreyra Solari, N.E., Billordo, L.A., Abecasis, R., Gadano,
A.C., and Chernavsky, A.C. (2011). Altered phenotype and functionality of
circulating immune cells characterize adult patients with nonalcoholic steato-
hepatitis. J. Clin. Immunol. 31, 1120–1130.
Kaur, D., and Brightling, C. (2012). OX40/OX40 ligand interactions in T-cell
regulation and asthma. Chest 141, 494–499.
Kohno, T., Brewer, M.T., Baker, S.L., Schwartz, P.E., King, M.W., Hale, K.K.,
Squires, C.H., Thompson, R.C., and Vannice, J.L. (1990). A second tumor ne-
crosis factor receptor gene product can shed a naturally occurring tumor ne-
crosis factor inhibitor. Proc. Natl. Acad. Sci. U S A 87, 8331–8335.
Lee, J., Kim, Y., Friso, S., and Choi, S.W. (2017). Epigenetics in non-alcoholic
fatty liver disease. Mol. Aspects Med. 54, 78–88.
Leroux, A., Ferrere, G., Godie, V., Cailleux, F., Renoud, M.L., Gaudin, F., Na-
veau, S., Prevot, S., Makhzami, S., Perlemuter, G., and Cassard-Doulcier,
A.M. (2012). Toxic lipids stored by Kupffer cells correlates with their pro-in-
flammatory phenotype at an early stage of steatohepatitis. J. Hepatol. 57,
141–149.
Liu, B., Yu, H., Sun, G., Sun, X., Jin, H., Zhang, C., Shi, W., Tian, D., Liu, K., Xu,
H., et al. (2017). OX40 promotes obesity-induced adipose inflammation and in-
sulin resistance. Cell. Mol. Life Sci. 74, 3827–3840.
Michel, J., Langstein, J., Hofstadter, F., and Schwarz, H. (1998). A soluble form
of CD137 (ILA/4-1BB), a member of the TNF receptor family, is released by
activated lymphocytes and is detectable in sera of patients with rheumatoid
arthritis. Eur. J. Immunol. 28, 290–295.
Nati, M., Haddad, D., Birkenfeld, A.L., Koch, C.A., Chavakis, T., and Chatzi-
georgiou, A. (2016). The role of immune cells in metabolism-related liver
inflammation and development of non-alcoholic steatohepatitis (NASH). Rev.
Endocr. Metab. Disord. 17, 29–39.
Obstfeld, A.E., Sugaru, E., Thearle, M., Francisco, A.M., Gayet, C., Ginsberg,
H.N., Ables, E.V., and Ferrante, A.W., Jr. (2010). C-C chemokine receptor 2
(CCR2) regulates the hepatic recruitment of myeloid cells that promote
obesity-induced hepatic steatosis. Diabetes 59, 916–925.
Ohshima, Y., Tanaka, Y., Tozawa, H., Takahashi, Y., Maliszewski, C., and Del-
espesse, G. (1997). Expression and function of OX40 ligand on human den-
dritic cells. J. Immunol. 159, 3838–3848.
Pizzolo, G., Vinante, F., Chilosi, M., Dallenbach, F., Josimovic-Alasevic, O., Di-
amantstein, T., and Stein, H. (1990). Serum levels of soluble CD30 molecule
(Ki-1 antigen) in Hodgkin’s disease: relationship with disease activity and clin-
ical stage. Br. J. Haematol. 75, 282–284.
Rau, M., Schilling, A.K., Meertens, J., Hering, I., Weiss, J., Jurowich, C., Ku-
dlich, T., Hermanns, H.M., Bantel, H., Beyersdorf, N., andGeier, A. (2016). Pro-
gression from nonalcoholic fatty liver to nonalcoholic steatohepatitis is marked
by a higher frequency of Th17 cells in the liver and an increased Th17/resting
regulatory T cell ratio in peripheral blood and in the liver. J. Immunol. 196,
97–105.
St€uber, E., and Strober, W. (1996). The T cell-B cell interaction via OX40-
OX40L is necessary for the T cell-dependent humoral immune response.
J. Exp. Med. 183, 979–989.
St€uber, E., Neurath, M., Calderhead, D., Fell, H.P., and Strober, W. (1995).
Cross-linking of OX40 ligand, a member of the TNF/NGF cytokine family, in-
duces proliferation and differentiation in murine splenic B cells. Immunity 2,
507–521.
Sutti, S., Jindal, A., Locatelli, I., Vacchiano, M., Gigliotti, L., Bozzola, C., and
Albano, E. (2014). Adaptive immune responses triggered by oxidative stress
contribute to hepatic inflammation in NASH. Hepatology 59, 886–897.
Suzuki, A., and Diehl, A.M. (2017). Nonalcoholic steatohepatitis. Annu. Rev.
Med. 68, 85–98.
Taylor, L., and Schwarz, H. (2001). Identification of a soluble OX40 isoform:
development of a specific and quantitative immunoassay. J. Immunol.
Methods 255, 67–72.
Tilg, H., and Moschen, A.R. (2010). Evolution of inflammation in nonalcoholic
fatty liver disease: the multiple parallel hits hypothesis. Hepatology 52,
1836–1846.
Tone, Y., Kojima, Y., Furuuchi, K., Brady, M., Yashiro-Ohtani, Y., Tykocinski,
M.L., and Tone,M. (2007). OX40 gene expression is up-regulated by chromatin
remodeling in its promoter region containing Sp1/Sp3, YY1, and NF-kappa B
binding sites. J. Immunol. 179, 1760–1767.
Tsukada, N., Akiba, H., Kobata, T., Aizawa, Y., Yagita, H., and Okumura, K.
(2000). Blockade of CD134 (OX40)-CD134L interaction ameliorates lethal
acute graft-versus-host disease in a murine model of allogeneic bone marrow
transplantation. Blood 95, 2434–2439.
Ward-Kavanagh, L.K., Lin, W.W., �Sedy, J.R., and Ware, C.F. (2016). The TNF
receptor superfamily in co-stimulating and co-inhibitory responses. Immunity
44, 1005–1019.
Weinberg, A.D., Wegmann, K.W., Funatake, C., and Whitham, R.H. (1999).
Blocking OX-40/OX-40 ligand interaction in vitro and in vivo leads to
decreased T cell function and amelioration of experimental allergic encepha-
lomyelitis. J. Immunol. 162, 1818–1826.
Wolf, D., Jehle, F., Michel, N.A., Bukosza, E.N., Rivera, J., Chen, Y.C., Hoppe,
N., Dufner, B., Rodriguez, A.O., Colberg, C., et al. (2014a). Coinhibitory
3798 Cell Reports 25, 3786–3799, December 26, 2018
suppression of T cell activation by CD40 protects against obesity and adipose
tissue inflammation in mice. Circulation 129, 2414–2425.
Wolf, M.J., Adili, A., Piotrowitz, K., Abdullah, Z., Boege, Y., Stemmer, K., Ring-
elhan, M., Simonavicius, N., Egger, M., Wohlleber, D., et al. (2014b). Metabolic
activation of intrahepatic CD8+ T cells and NKT cells causes nonalcoholic
steatohepatitis and liver cancer via cross-talk with hepatocytes. Cancer Cell
26, 549–564.
Yoshioka, T., Nakajima, A., Akiba, H., Ishiwata, T., Asano, G., Yoshino, S.,
Yagita, H., and Okumura, K. (2000). Contribution of OX40/OX40 ligand inter-
action to the pathogenesis of rheumatoid arthritis. Eur. J. Immunol. 30, 2815–
2823.
Zhao, X., Sun, G., Sun, X., Tian, D., Liu, K., Liu, T., Cong, M., Xu, H., Li, X., Shi,
W., et al. (2016). A novel differentiation pathway from CD4+ T cells to CD4�
T cells for maintaining immune system homeostasis. Cell Death Dis. 7, e2193.
Cell Reports 25, 3786–3799, December 26, 2018 3799
STAR+METHODS
KEY RESOURCES TABLE
REAGENT or RESOURCE SOURCE IDENTIFIER
Antibodies
PE/Cy7 anti-CD11b (clone M1/70) Thermo Fisher Scientific Cat# 25-0112-82; RRID:AB_469588
FITC anti-CD11b (clone M1/70) Thermo Fisher Scientific Cat# 11-0112-82; RRID:AB_464935
PE anti-CD11b (clone M1/70) Thermo Fisher Scientific Cat# 12-0112-85; RRID:AB_465549
PerCP-Cy5.5 anti-CD3 (clone 145-2C11) Thermo Fisher Scientific Cat#35-0031-82; RRID:AB_11219266
APC anti-CD3 (clone 145-2C11) Thermo Fisher Scientific Cat#: 17-0031-83; RRID:AB_469316
PE/Cy7 anti-CD3 (clone 145-2C11) Thermo Fisher Scientific Cat#: 25-0031-82; RRID: AB_469572
PE/Cy7anti-CD4 (clone GK1.5) Thermo Fisher Scientific Cat#: 25-0041-82; RRID:AB_469576
PerCP-Cy5.5 anti-CD4 (clone GK1.5) Thermo Fisher Scientific Cat#: 45-0042-82; RRID:AB_1107001
FITC anti-CD4 (clone GK1.5) Thermo Fisher Scientific Cat#: 11-0041-85; RRID:AB_464893
APC anti-CD4 (clone GK1.5) Thermo Fisher Scientific Cat#: 17-0041-82; RRID:AB_469320
PerCP-Cy5.5 anti-CD8 (clone 53-6.7) Thermo Fisher Scientific Cat#: 45-0081-82; RRID:AB_1107004
FITC anti-CD8 (clone 53-6.7) Thermo Fisher Scientific Cat#: 53-0081-82; RRID:AB_469897
PE anti-CD69 (clone H1.2F3) Thermo Fisher Scientific Cat#: 12-0691-81; RRID:AB_465731
APC anti-CD69 (clone H1.2F3) Thermo Fisher Scientific Cat#: 17-0691-80; RRID:AB_1210796
PE/Cy7 anti-CD45 (clone 30-F11) Thermo Fisher Scientific Cat#: 25-0451-82; RRID:AB_469625
PE anti-CD45 (clone 30-F11) Thermo Fisher Scientific Cat#: 12-0451-82; RRID:AB_465668
APC anti-NK1.1 (clone PK136) Thermo Fisher Scientific Cat#: 17-5941-82; RRID:AB_469479
PE anti-NK1.1 (clone PK136) Thermo Fisher Scientific Cat#: 12-5941-83; RRID:AB_466051
FITC anti-NK1.1 (clone PK136) Thermo Fisher Scientific Cat#: 11-5941-82; RRID:AB_465318
FITC anti-TCRb (clone H57-597) Thermo Fisher Scientific Cat#: 11-5961-85; RRID:AB_465324
PerCP-Cy5.5 anti-TCRb (clone H57-597) Thermo Fisher Scientific Cat#: 45-5961-82; RRID:AB_925763
PE anti-Gr-1 (clone RB6-8C5) Thermo Fisher Scientific Cat#: 12-5931-83; RRID:AB_466046
APC anti-Gr-1 (clone RB6-8C5) Thermo Fisher Scientific Cat#: 17-5931-82; RRID: AB_469476
APC anti-Ly6G (clone 1A8-Ly6g) Thermo Fisher Scientific Cat#: 17-9668-82; RRID:AB_2573307
PE anti-OX40 (clone OX-86) Thermo Fisher Scientific Cat#: 12-1341-82; RRID:AB_465854
APC anti-OX40 (clone OX-86) Thermo Fisher Scientific Cat#: 17-1341-82; RRID:AB_10717260
APC anti-MHC II (clone M5/114.15.2) Thermo Fisher Scientific Cat#: 17-5321-82; RRID:AB_469455
APC anti-CD40 (clone HM40-3) Thermo Fisher Scientific Cat#: 17-0402-82; RRID:AB_10853008
PE anti-CD86 (clone P03.1) Thermo Fisher Scientific Cat#: 12-0861-83; RRID:AB_465766
PE/Cy7anti-CD86 (clone GL1) Thermo Fisher Scientific Cat#: 25-0862-82; RRID:AB_2573372
PE/Cy7 anti-TLR4 (clone MTS510) Thermo Fisher Scientific Cat#: 25-9924-82; RRID:AB_469689
APC anti-CCR2 (clone SA203G11) Biolegend Cat#: 150603; RRID:AB_2566139
FITC anti-CCR2 (clone SA203G11) Biolegend Cat#: 150607; RRID:AB_2616979
PE anti-CCR5 (clone HM-CCR5(7A4)) Thermo Fisher Scientific Cat#: 12-1951-82; RRID:AB_657684
PE anti-CCR7 (clone 4B12) Thermo Fisher Scientific Cat#: 12-1971-82; RRID:AB_465905
PE anti-CCR9 (clone eBioCW-1.2) Thermo Fisher Scientific Cat#: 12-1991-82; RRID:AB_1257161
PE anti-CXCR3 (clone CXCR3-173) Thermo Fisher Scientific Cat#: 12-1831-82; RRID:AB_1210734
PE anti-CXCR5 (clone SPRCL5) Thermo Fisher Scientific Cat#: 12-7185-82; RRID:AB_11217882
PerCP-Cy5.5 anti-Foxp3 (clone FJK-165) Thermo Fisher Scientific Cat#: 45-5773-82; RRID:AB_914359
PE anti-IL-17 (clone eBio17B7) Thermo Fisher Scientific Cat#: 12-7177-81; RRID:AB_763582
PE anti-IFN-g (clone XMG1.2) Thermo Fisher Scientific Cat#: 12-7311-82; RRID:AB_466193
PE anti-TNFa (clone MP6-XT22) Thermo Fisher Scientific Cat#: 12-7321-82; RRID:AB_466199
(Continued on next page)
e1 Cell Reports 25, 3786–3799.e1–e4, December 26, 2018
Continued
REAGENT or RESOURCE SOURCE IDENTIFIER
APC anti-OX40L (clone OX86) Thermo Fisher Scientific Cat#: 17-1341-82; RRID:AB_10717260
Annexin V-PE kit BD PharMingen Cat#: 559763
Biological Samples
NASH patients and healthy controls plasma Clinical Data and Biobank Resource
of Beijing Friendship Hospital
OD16-metabolic diseases (Biobank
at Beijing friendship Hospital)
Chemicals, Peptides, and Recombinant Proteins
Recombinant mouse OX40/Fc Chimera Protein R&D systems Cat#: 1256-OX-050
Recombinant mouse OX40L Protein R&D systems Cat#: 1236-OX-025/CF
Cell Stimulation Cocktail Thermo Fisher Scientific Cat#: 00-4975-03
Collagenase type IV Sigma Cat#: 559763
DNase I Roche Cat#: 11284932001
Percoll GE Health Cat#: 17-0891-09
Critical Commercial Assays
anti-CD4 monoclonal antibody (clone GK1.5) BioXCell Cat#: 5730-1-3/0515
Purified anti-mouse CD3e (colne 145-2C11) BD Biosciences Cat#: 550275
Purified anti-mouse CD28 (colne 37.51) BD Biosciences Cat#: 553294
Permeabilization Buffer 10x Thermo Fisher Scientific Cat#: 00-8333-56
Fixation/Permeabilization Concentrate Thermo Fisher Scientific Cat#: 00-5123-43
Fixation/Permeabilization Diluent Thermo Fisher Scientific Cat#: 00-5223-56
Fixation Buffer BioLegend Cat#: 420801
Cell-Light EdU Apollo�643 in Vitro Flow Cytometry Kit RiboBio Corporation Cat#:C10338-3
Mouse OX40 ELISA Kit Boster Biological Technology Cat#: EK0998
Soluble OX40 Human ELISA Kit Thermo Fisher Scientific Cat#: BMS296
RNeasy Plus Mini Kit QIAGEN Cat#: 74136
SuperScript III RT kit Invitrogen Stock#: 18080051
Alanine Transaminase (ALT) Detection Kits NanJing JianCheng Biochemical Institute Cat#: C009-2
Aspartate Transaminase (AST) Detection Kits NanJing JianCheng Biochemical Institute Cat#: C010-2
TG Detection Kits NanJing JianCheng Biochemical Institute Cat#: A110-1
Total Bilirubin (TBIL) Detection Kits NanJing JianCheng Biochemical Institute Cat#: C019-1
Total Cholesterol (T-CHO) Detection Kits NanJing JianCheng Biochemical Institute Cat#: A111-1
Deposited Data
Raw and analyzed data This paper GEO: GSE105187
Experimental Models: Organisms/Strains
Mouse: C57BL/6 The Jackson Laboratory Stock#: 000664
Mouse: C57BL/6 OX40 KO The Jackson Laboratory Stock#: 012838
Mouse: C57BL/6-GFP The Jackson Laboratory Stock#: 004353
Mouse: B6.Rag2 and Il2rg double KO Taconic Bioscience Model#: 4111-F
Oligonucleotides
See Table S3 for gene expression analysis primers This paper N/A
Software and Algorithms
FlowJo software version 10.5.2 Treestar N/A
GraphPad Prism 6 GraphPad software N/A
SPSS software SPSS Inc N/A
Other
Diet: Normal Control Diet (NCD) Beijing HFK Bioscience Cat#: 1035
Diet: High Fat Diet (HFD) Beijing HFK Bioscience Cat#: 1042
Diet: Methionine/choline-deficient Diet (MCD) Beijing HFK Bioscience Cat#: 10401
(Continued on next page)
Cell Reports 25, 3786–3799.e1–e4, December 26, 2018 e2
CONTACT FOR REAGENT AND RESOURCE SHARING
Further information and requests for resources and reagents should be directed andwill be fulfilled by the Lead Contact, Dong Zhang
EXPERIMENTAL MODEL AND SUBJECT DETAILS
MiceEight weeks old weight-matched male wild-type (WT) C57BL/6, C57BL/6 OX40-KO and C57BL/6-GFP mice were purchased from
The Jackson Laboratory (Bar Harbor, ME, USA). B6.Rag2 and Il2rg double KO mice were purchased from Taconic Bioscience (Ger-
mantown, NY, USA). These mice were fed either a normal control diet (NCD), a HFD (45 kcal% fat, Beijing HFK Bioscience, Beijing,
China), amethionine/choline-deficient diet (MCD, Beijing HFKBioscience), a choline-deficient high fat diet (CD-HFD, Research Diets,
D05010402, NewBrunswick, NJ, Canada). Themiceweremaintained in a pathogen-free, temperature-controlled environment under
a 12-hour light/dark cycle at Beijing Friendship Hospital, and all animal protocols were approved by the Institutional Animal Care and
Ethics Committee.
METHOD DETAILS
Isolation of liver immune cells by enzymatic digestionAfter mice were anesthetized, each mouse liver was perfused with 30 mL of normal saline (NS) through left cardiac perfusion until its
liver changed to a pale color, at which point the liver was carefully removed and digested with 0.01% type IV collagenase for 30min at
37�C. The mixture was then dissociated using a gentle-MACS dissociator (Miltenyi Biotec, Bergisch-Gladbach, Germany). The cell
suspension was filtered through a 70-mm nylon cell strainer and centrifuged at 50 x g for 5 min to obtain the supernatant, which was
then centrifuged at 500 x g for 5 min. The cell pellet was used to detect hepatic infiltrated monocytes and Kupffer cells. The above-
mentioned cell pellet was resuspended in 30% Percoll in Hanks’ Balanced Salt Solution (HBSS, 1 3 ), gently overlaid onto 70%
Percoll and centrifuged at 800 x g for 25 min. The cells were collected from the interface to detect intrahepatic T cells.
Real-time PCRTotal RNA was isolated from liver tissue, splenocytes, liver immune cells using an RNeasy Plus Mini kit (QIAGEN, Valencia, CA, USA)
and reverse transcribed into cDNA using a SuperScript III RT kit (Invitrogen, Carlsbad, CA, USA). Specific message levels were quan-
tified by real-time PCR using the ABI 7500 sequence detection system (Applied Biosystems, Foster City, CA, USA). Amplicon expres-
sion in each sample was normalized to that of GAPDH, and after normalization, gene expression was quantified using the 2-DDCt
method. The genes and primer sequences are shown in Table S3.
Flow cytometry analysisLiver immune cells were harvested and analyzed to determine the expression levels of various cell surface and intra-cellular markers.
All samples were acquired on a FACS Aria II flow cytometer (BD Biosciences, CA, USA), and the data were analyzed using FlowJo
software (Treestar, Ashland, OR, USA).
T cell isolation and T cell proliferation assaySplenocytes from WT and OX40-KO mice were cultured in triplicate in wells pre-coated with the anti-CD3 mAb (3 mg/mL, BD Bio-
sciences) and the soluble anti-CD28mAb (1 mg/mL, BD Biosciences) at 37�Cwith 5%CO2. After 72 hours of incubation and 12 hours
before harvest, 5-ethynyl-20-deoxyuridine (EdU) was added to the plates (final concentration of 50 mM). Cell proliferation was
measured via EdU incorporation according to the manufacturer’s instructions (EdU staining kit, RiboBio Corporation, Guangzhou,
China).
CD4+ T cell depletion in vivo
Mice were intraperitoneally injected with 400 mg of rat anti-CD4 monoclonal antibody (GK1.5) every other day for the first week and
twice a week for the following 3 weeks before detection for NASH development, during these 4 weeks, mice were fed with MCD.
Continued
REAGENT or RESOURCE SOURCE IDENTIFIER
Diet: Choline-deficient High Fat Diet (CD-HFD) Research Diets Cat#: D05010402
Gentle-MACS dissociator Miltenyi Biotec Cat#: 130-093-235
ABI 7500 sequence detection system Applied Biosystems N/A
BD FACS Aria II BD Biosciences N/A
e3 Cell Reports 25, 3786–3799.e1–e4, December 26, 2018
Adoptive transfer of T cellsCD3 T cells (5 3 106, purity > 97%) were sorted from splenocytes of naive WT C57BL/6 or OX40-KO mice, and transferred into
B6.Rag2 and Il2rg double KO mice by tail vein injection. The control mice were injected with saline. Recipient mice subsequently
consumed HFD for 16 weeks and were detected for NASH development.
Soluble OX40 stimulation in vivo
The OX40-KO mice or B6.Rag2 and Il2rg double KO mice were intraperitoneally injected with 1 mg of OX40/Fc (Cat no. 1256-OX-50,
R&D Systems, Minneapolis, MN, USA) or control IgG 3 times a week for total 4 weeks. During these 4 weeks, mice were fed with
MCD. After 4 weeks OX40/Fc injection, recipient mice were detected for NASH development.
Transwell assaysMonocytes andKupffer cells were isolated from the livers of GFP+-C57BL/6mice, and isolated GFP+ cells (0.53 106) were pretreated
with OX40/Fc (2 mg/ml) or the IgG control with serum-starved media overnight. The starved monocytes or Kupffer cells were then
placed in the top chamber, and Dulbecco’s modified Eagle’s medium (DMEM)medium supplemented with 2 mg/ml CCL2was placed
in the lower chamber. Transwell plates were incubated at 37�C with 5% CO2 for 6 hours, after which the upper chambers were
removed. Then, GFP+ cells that had migrated to the lower wells were counted, and migration was quantified using inverted fluores-
cence microscopy by analyzing at least 10 random fields from each of three replicate filters for each experimental condition.
Clinical studyThe observation study involved 54 patients with NASH who underwent liver biopsy at Beijing Friendship Hospital. The NASH diag-
nosis was confirmed by the liver biopsy specimen showing steatosis with lobular inflammation and hepatocyte ballooning with or
without fibrosis in the setting of increased BMI or metabolic risk factors (type 2 diabetes, hypertension, hyperlipidemia). For each
biopsy, a SAF score summarizing the main histological lesions was defined based on the grade of steatosis, the grade of activity
(hepatocytes ballooning and lobular inflammation) and the stage of fibrosis (Bedossa and FLIP Pathology Consortium, 2014).
NASH patients were consuming less than 10 g/alcohol per day for women and 20 g/alcohol per day for men, and other causes of
steatosis or chronic liver disease were excluded. Fifty-eight patients visiting the Physical Examination Center Beijing Friendship Hos-
pital for routine physical examinations served as healthy controls. Healthy subjects were required to be nondiabetic and free of major
organ disease, chronic inflammatory conditions, cancer, active psychiatric diseases and surgical history. Plasma and sera were
collected in vacutainer tubes, and fasting serum glucose, ALT, AST, cholesterol and TG levels were measured using standard lab-
oratory techniques. All subjects provided written informed consent to participate in the study, and the study protocol was approved
by the Human Institutional Review Board of Beijing Friendship Hospital.
QANTIFICATION AND STATISTICAL ANALYSIS
Statistical analysis was performed with SPSS software (SPSS Inc), and values are expressed as the mean ± standard deviation (SD).
Significant differences were analyzed using Student’s t tests and one-way analysis of variance (ANOVA). In the clinical study, normal
variable distributions were tested with the Shapiro-Wilk test. Differences between groups were compared by t tests for normal vari-
ables and the Mann-Whitney U-test for non-normal variables. Spearman’s correlation coefficient was used to estimate the associ-
ation of serum OX40 levels and several factors of interest. p values < 0.05 were considered significant.
Cell Reports 25, 3786–3799.e1–e4, December 26, 2018 e4
Cell Reports, Volume 25
Supplemental Information
OX40 Regulates Both Innate and Adaptive Immunity
and Promotes Nonalcoholic Steatohepatitis
Guangyong Sun, Hua Jin, Chunpan Zhang, Hua Meng, Xinyan Zhao, Dan Wei, XiaojuanOu, Qianyi Wang, Shuxiang Li, Tianqi Wang, Xiaojing Sun, Wen Shi, Dan Tian, KaiLiu, Hufeng Xu, Yue Tian, Xinmin Li, Wei Guo, Jidong Jia, Zhongtao Zhang, and DongZhang
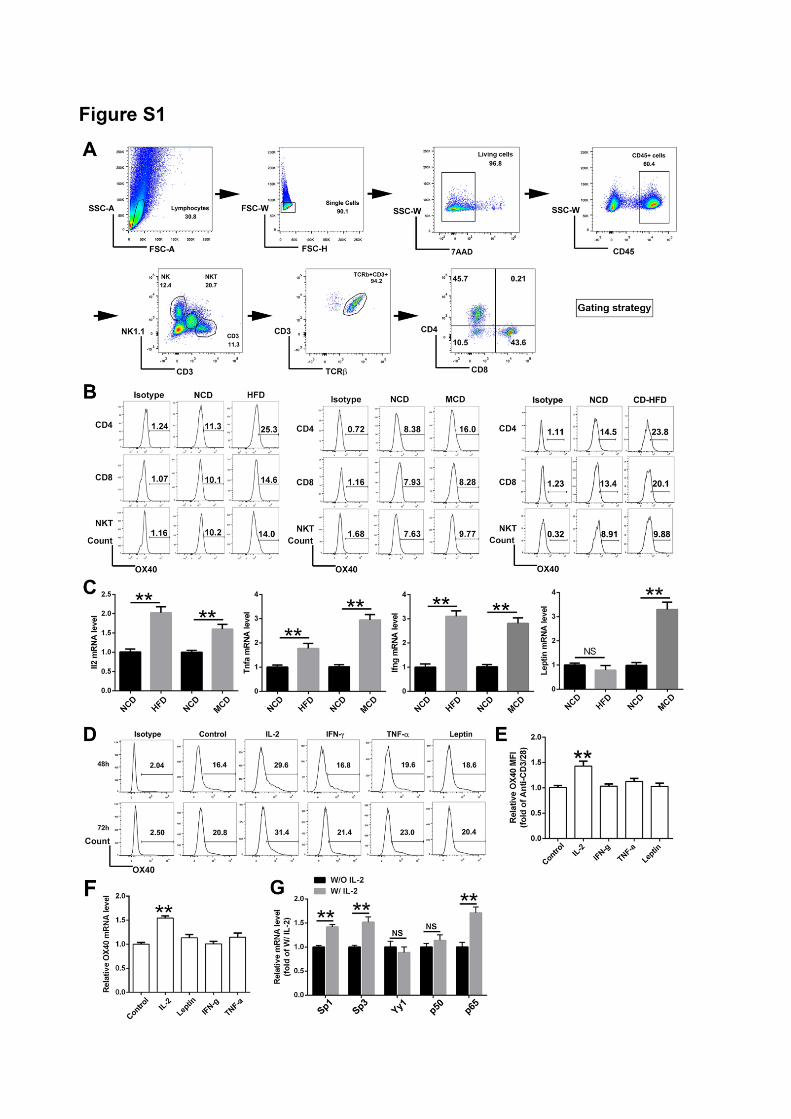
Supplementary Figure 1. IL-2 promoted OX40 expression in CD4 T-cells. Related to Figure 1.
A: Representative flow cytometry images of the gating strategy used for flow cytometry analysis. B:
Flow cytometry images of OX40 expression in different liver lymphocytes. C: Relative Il2, Tnfa, Ifng
and Leptin mRNA expression levels in normal and NASH liver tissues. D and E: Flow cytometry image
and the statistical analysis of OX40 expression in CD4 T-cells after stimulation with IL-2, IFN-γ, TNF-
or Leptin. F: Relative OX40 mRNA levels after stimulation with different cytokines. G: Relative
mRNA levels of the transcription factors Sp1, Sp3, Yy1, p50 and p65 in the presence or absence of IL-2
in CD4 T-cells. The data are depicted as the mean±SD, and n=6 in each group. * p<0.05, ** p<0.01, NS:
no significance.
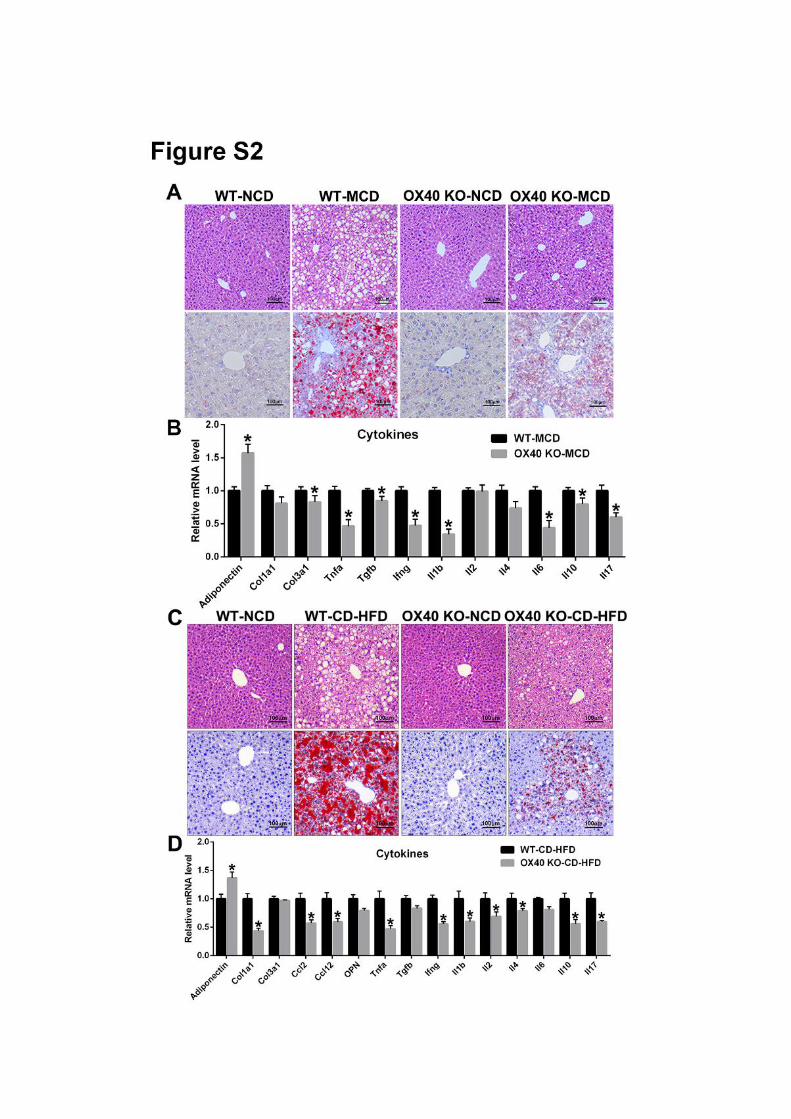
Supplementary Figure 2. OX40 deficiency alleviated steatohepatitis in mice received MCD or CD-
HFD. Related to Figure 1.
A: Representative hematoxylin and eosin staining (upper panel) and Oil Red O staining (lower panel) in
liver paraffin sections from WT and OX40-KO mice fed the NCD or MCD. B: Relative proinflammatory
cytokine mRNA levels in liver tissues were analyzed by quantitative real-time PCR in WT and OX40-
KO mice fed the NCD or MCD for 4 weeks. C: Representative hematoxylin and eosin staining (upper
panel) and Oil Red O staining (lower panel) in liver paraffin sections from WT and OX40-KO mice fed
the NCD or CD-HFD. D: Relative proinflammatory cytokine mRNA levels in liver tissues were analyzed
by quantitative real-time PCR in WT and OX40-KO mice fed the NCD or CD-HFD for 12 weeks. The
data are depicted as the mean±SD, and n=6 in each group. * p<0.05, ** p<0.01, NS: no significance.
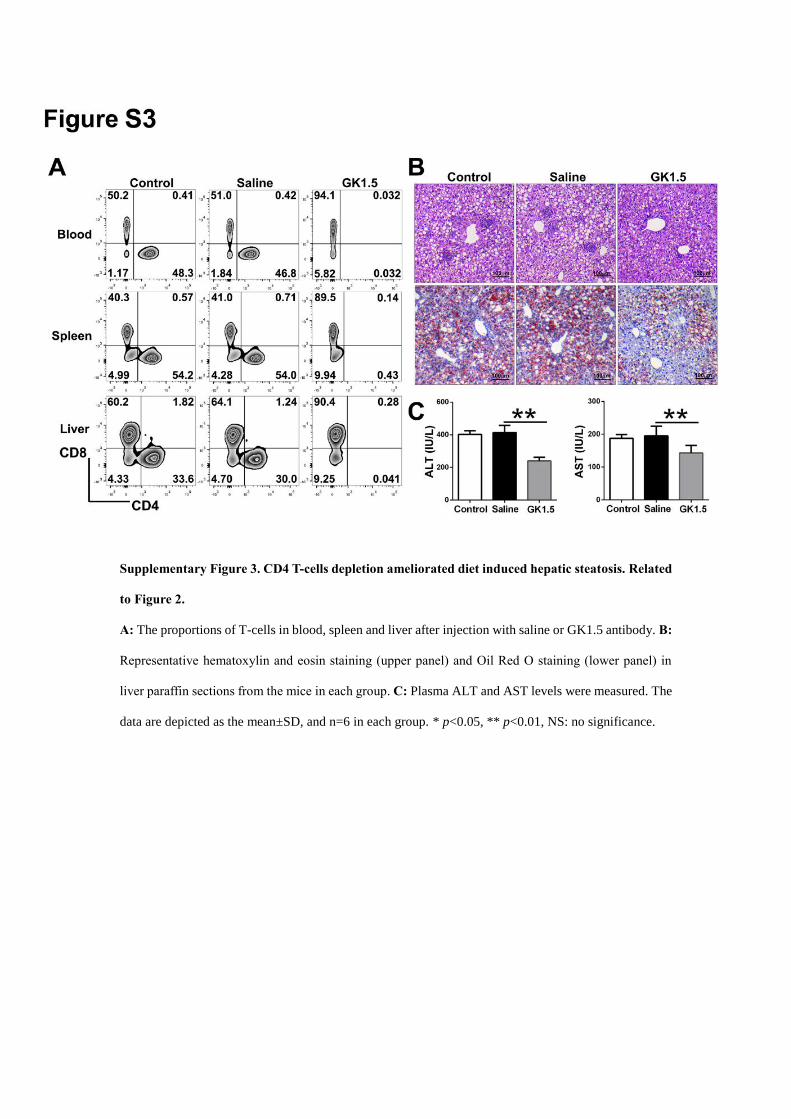
Supplementary Figure 3. CD4 T-cells depletion ameliorated diet induced hepatic steatosis. Related
to Figure 2.
A: The proportions of T-cells in blood, spleen and liver after injection with saline or GK1.5 antibody. B:
Representative hematoxylin and eosin staining (upper panel) and Oil Red O staining (lower panel) in
liver paraffin sections from the mice in each group. C: Plasma ALT and AST levels were measured. The
data are depicted as the mean±SD, and n=6 in each group. * p<0.05, ** p<0.01, NS: no significance.
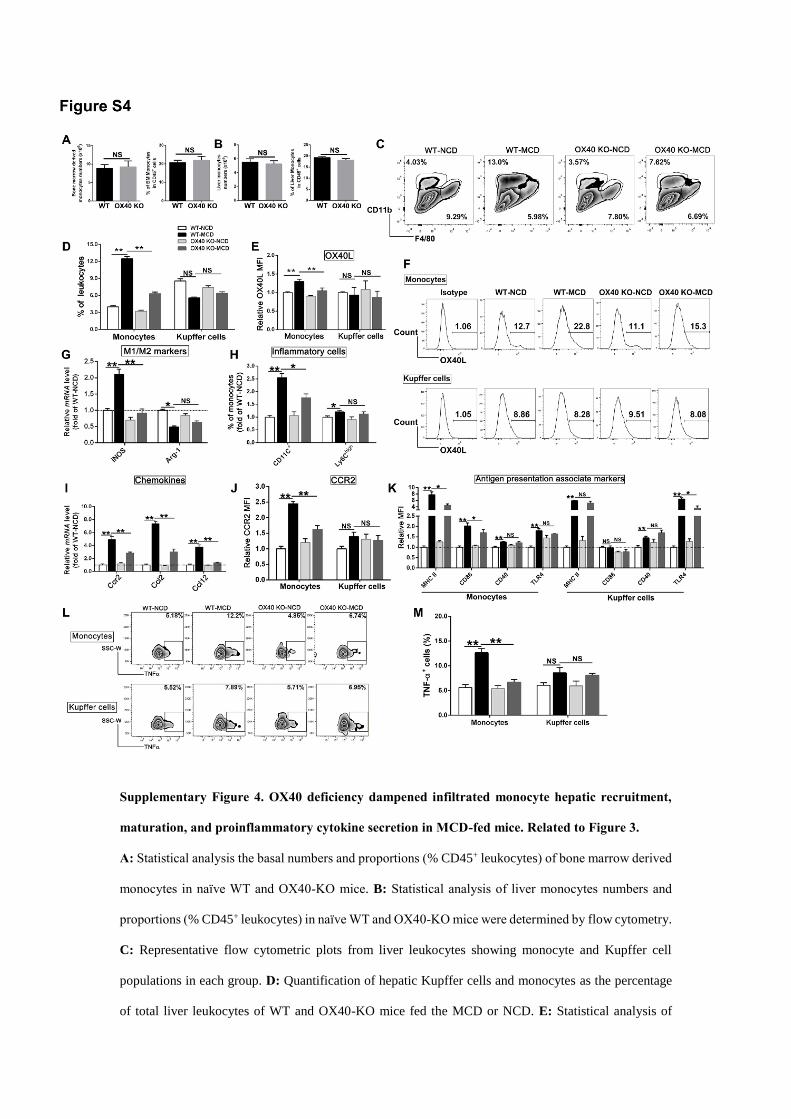
Supplementary Figure 4. OX40 deficiency dampened infiltrated monocyte hepatic recruitment,
maturation, and proinflammatory cytokine secretion in MCD-fed mice. Related to Figure 3.
A: Statistical analysis the basal numbers and proportions (% CD45+ leukocytes) of bone marrow derived
monocytes in naïve WT and OX40-KO mice. B: Statistical analysis of liver monocytes numbers and
proportions (% CD45+ leukocytes) in naïve WT and OX40-KO mice were determined by flow cytometry.
C: Representative flow cytometric plots from liver leukocytes showing monocyte and Kupffer cell
populations in each group. D: Quantification of hepatic Kupffer cells and monocytes as the percentage
of total liver leukocytes of WT and OX40-KO mice fed the MCD or NCD. E: Statistical analysis of
OX40L expression in the liver monocytes and Kupffer cells of WT and OX40-KO mice, as measured
via flow cytometry. In addition, relative changes in OX40L expression were plotted as fold changes of
OX40L expression induced by NCD administration in WT mice. F: Flow cytometric images of OX40L
expression in monocytes and Kupffer cells. G: Relative iNOS and Arg-1 mRNA expression levels in
each group. H: Statistical analysis of CD11C+ and Ly6Chigh cells (% CD11bintF4/80low monocytes) in the
livers of mice from each group, as determined by flow cytometry. In addition, relative changes of the
cell proportions were plotted as fold changes of the cell proportions induced by NCD administration in
WT mice. I: Relative chemokine (Ccl2, Ccl12) and chemokine receptor (Ccr2) mRNA expression levels
in each group. J: Statistical analysis of CCR2 levels in the liver monocytes and Kupffer cells of mice
from each group, as determined by flow cytometry. In addition, relative changes in CCR2 levels were
plotted as fold changes of that induced by NCD administration in WT mice. K: Statistical analysis of
antigen presentation-associated marker (MHC II, CD86, CD40 and TLR4) expression in intrahepatic
monocytes and Kupffer cells, as determined by flow cytometry. In addition, relative changes in the
expression were plotted as fold changes of expression induced by NCD administration in WT mice. L:
Flow cytometry analysis of TNF-α+ cells relative to the total numbers of monocytes and Kupffer cells in
the liver tissues of mice from each group. M: The statistical analysis of TNF-α+ cells relative to the total
numbers of monocytes and Kupffer cells in the liver tissues of mice from each group, as determined by
flow cytometry. The data are depicted as the mean±SD, and n=6 in each group. * p<0.05, ** p<0.01, NS:
no significance.
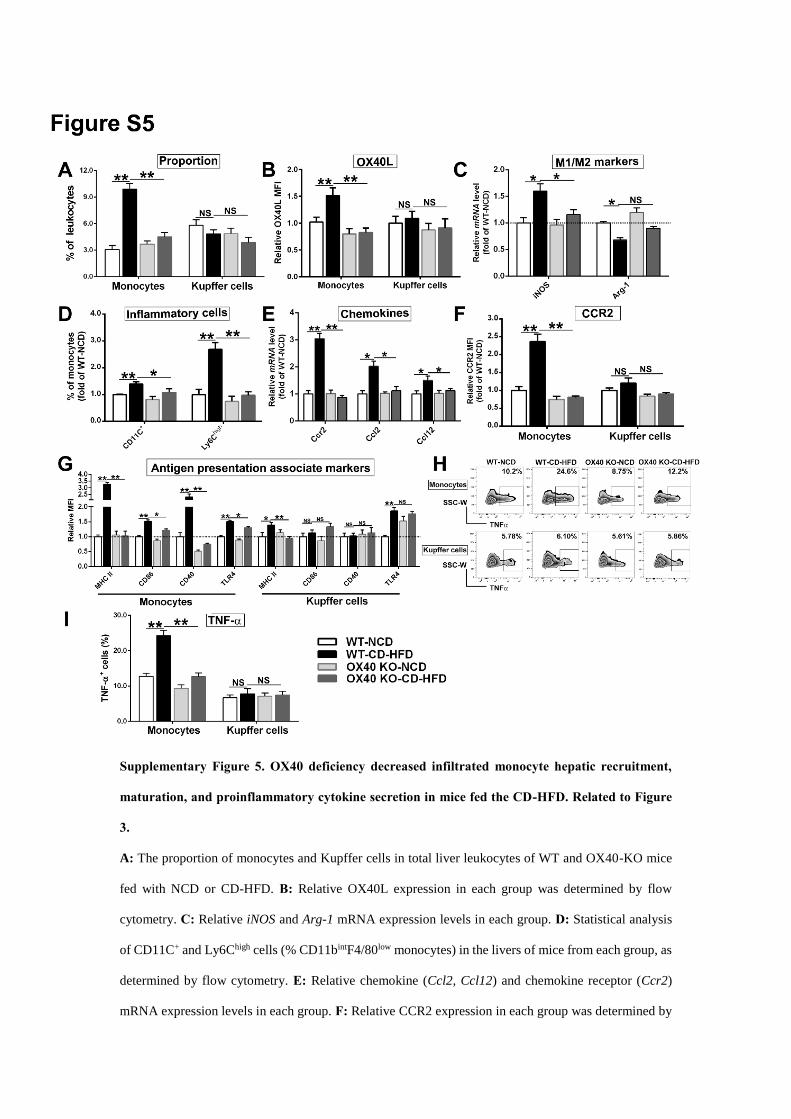
Supplementary Figure 5. OX40 deficiency decreased infiltrated monocyte hepatic recruitment,
maturation, and proinflammatory cytokine secretion in mice fed the CD-HFD. Related to Figure
3.
A: The proportion of monocytes and Kupffer cells in total liver leukocytes of WT and OX40-KO mice
fed with NCD or CD-HFD. B: Relative OX40L expression in each group was determined by flow
cytometry. C: Relative iNOS and Arg-1 mRNA expression levels in each group. D: Statistical analysis
of CD11C+ and Ly6Chigh cells (% CD11bintF4/80low monocytes) in the livers of mice from each group, as
determined by flow cytometry. E: Relative chemokine (Ccl2, Ccl12) and chemokine receptor (Ccr2)
mRNA expression levels in each group. F: Relative CCR2 expression in each group was determined by
flow cytometry. G: Statistical analysis of antigen presentation-associated marker (MHC II, CD86, CD40
and TLR4) expression in intrahepatic monocytes and Kupffer cells, as determined by flow cytometry. H
and I: Flow cytometry image and the statistical analysis of TNF-+ cells relative to the total numbers of
monocytes and Kupffer cells in each group. The data are depicted as the mean±SD, and n=6 in each
group. * p<0.05, ** p<0.01, NS: no significance.
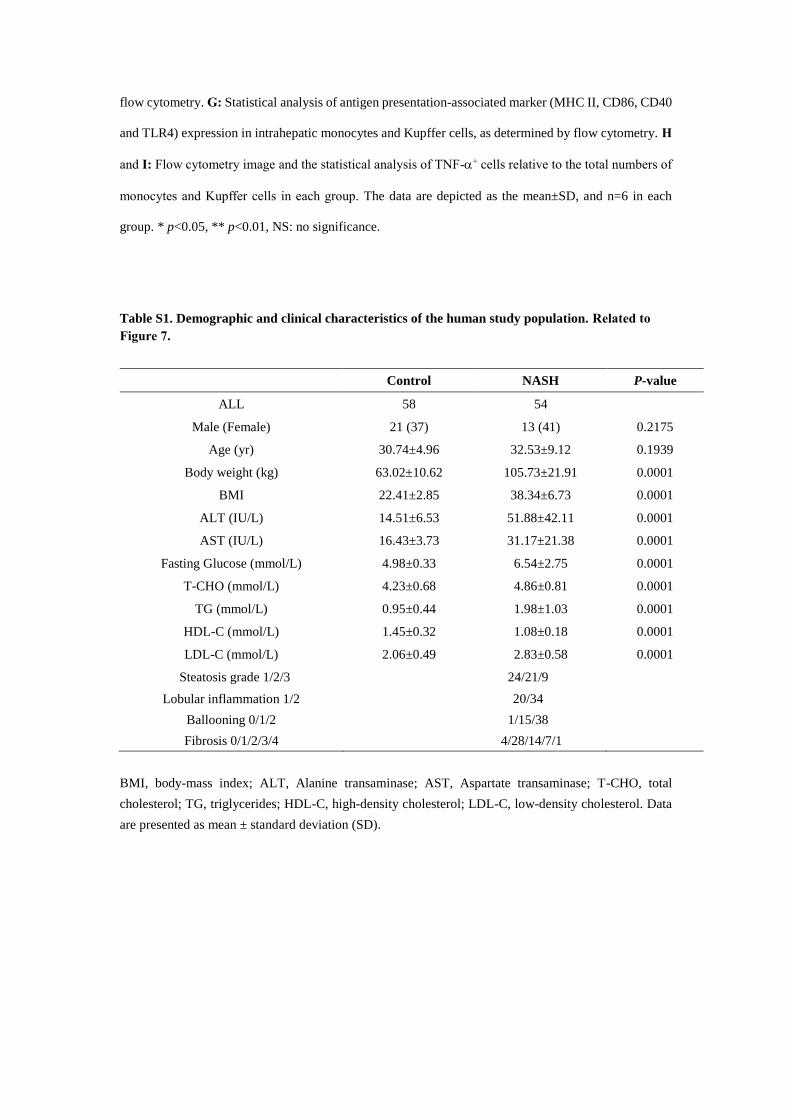
Table S1. Demographic and clinical characteristics of the human study population. Related to
Figure 7.
Control NASH P-value
ALL 58 54
Male (Female) 21 (37) 13 (41) 0.2175
Age (yr) 30.74±4.96 32.53±9.12 0.1939
Body weight (kg) 63.02±10.62 105.73±21.91 0.0001
BMI 22.41±2.85 38.34±6.73 0.0001
ALT (IU/L) 14.51±6.53 51.88±42.11 0.0001
AST (IU/L) 16.43±3.73 31.17±21.38 0.0001
Fasting Glucose (mmol/L) 4.98±0.33 6.54±2.75 0.0001
T-CHO (mmol/L) 4.23±0.68 4.86±0.81 0.0001
TG (mmol/L) 0.95±0.44 1.98±1.03 0.0001
HDL-C (mmol/L) 1.45±0.32 1.08±0.18 0.0001
LDL-C (mmol/L) 2.06±0.49 2.83±0.58 0.0001
Steatosis grade 1/2/3 24/21/9
Lobular inflammation 1/2 20/34
Ballooning 0/1/2 1/15/38
Fibrosis 0/1/2/3/4 4/28/14/7/1
BMI, body-mass index; ALT, Alanine transaminase; AST, Aspartate transaminase; T-CHO, total
cholesterol; TG, triglycerides; HDL-C, high-density cholesterol; LDL-C, low-density cholesterol. Data
are presented as mean ± standard deviation (SD).
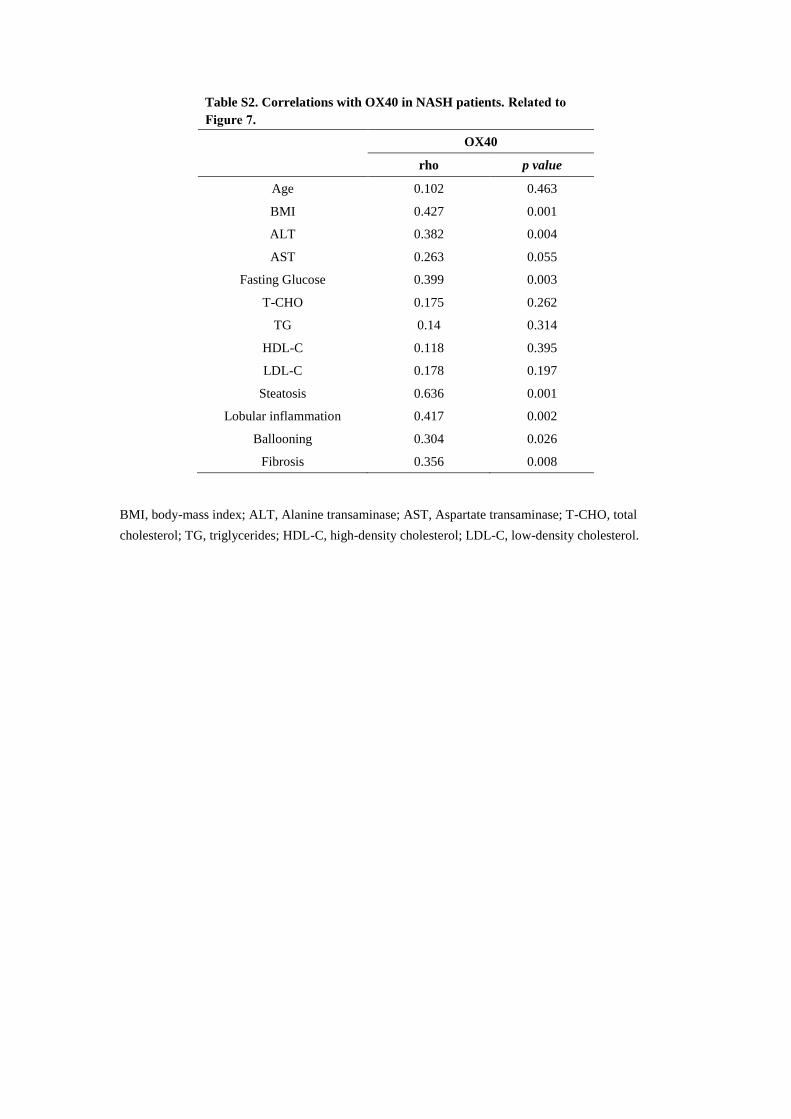
Table S2. Correlations with OX40 in NASH patients. Related to
Figure 7.
OX40
rho p value
Age 0.102 0.463
BMI 0.427 0.001
ALT 0.382 0.004
AST 0.263 0.055
Fasting Glucose 0.399 0.003
T-CHO 0.175 0.262
TG 0.14 0.314
HDL-C 0.118 0.395
LDL-C 0.178 0.197
Steatosis 0.636 0.001
Lobular inflammation 0.417 0.002
Ballooning 0.304 0.026
Fibrosis 0.356 0.008
BMI, body-mass index; ALT, Alanine transaminase; AST, Aspartate transaminase; T-CHO, total
cholesterol; TG, triglycerides; HDL-C, high-density cholesterol; LDL-C, low-density cholesterol.
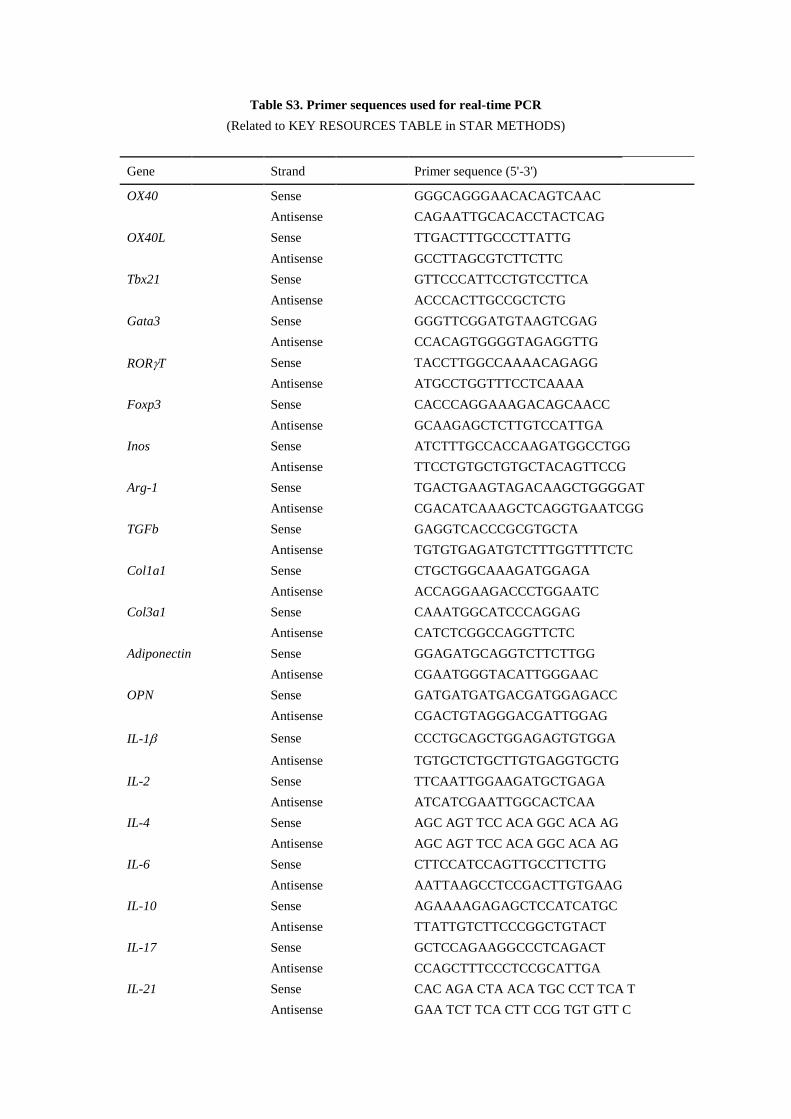
Table S3. Primer sequences used for real-time PCR
(Related to KEY RESOURCES TABLE in STAR METHODS)
Gene Strand Primer sequence (5'-3')
OX40 Sense GGGCAGGGAACACAGTCAAC
Antisense CAGAATTGCACACCTACTCAG
OX40L Sense TTGACTTTGCCCTTATTG
Antisense GCCTTAGCGTCTTCTTC
Tbx21 Sense GTTCCCATTCCTGTCCTTCA
Antisense ACCCACTTGCCGCTCTG
Gata3 Sense GGGTTCGGATGTAAGTCGAG
Antisense CCACAGTGGGGTAGAGGTTG
RORT Sense TACCTTGGCCAAAACAGAGG
Antisense ATGCCTGGTTTCCTCAAAA
Foxp3 Sense CACCCAGGAAAGACAGCAACC
Antisense GCAAGAGCTCTTGTCCATTGA
Inos Sense ATCTTTGCCACCAAGATGGCCTGG
Antisense TTCCTGTGCTGTGCTACAGTTCCG
Arg-1 Sense TGACTGAAGTAGACAAGCTGGGGAT
Antisense CGACATCAAAGCTCAGGTGAATCGG
TGFb Sense GAGGTCACCCGCGTGCTA
Antisense TGTGTGAGATGTCTTTGGTTTTCTC
Col1a1 Sense CTGCTGGCAAAGATGGAGA
Antisense ACCAGGAAGACCCTGGAATC
Col3a1 Sense CAAATGGCATCCCAGGAG
Antisense CATCTCGGCCAGGTTCTC
Adiponectin Sense GGAGATGCAGGTCTTCTTGG
Antisense CGAATGGGTACATTGGGAAC
OPN Sense GATGATGATGACGATGGAGACC
Antisense CGACTGTAGGGACGATTGGAG
IL-1 Sense CCCTGCAGCTGGAGAGTGTGGA
Antisense TGTGCTCTGCTTGTGAGGTGCTG
IL-2 Sense TTCAATTGGAAGATGCTGAGA
Antisense ATCATCGAATTGGCACTCAA
IL-4 Sense AGC AGT TCC ACA GGC ACA AG
Antisense AGC AGT TCC ACA GGC ACA AG
IL-6 Sense CTTCCATCCAGTTGCCTTCTTG
Antisense AATTAAGCCTCCGACTTGTGAAG
IL-10 Sense AGAAAAGAGAGCTCCATCATGC
Antisense TTATTGTCTTCCCGGCTGTACT
IL-17 Sense GCTCCAGAAGGCCCTCAGACT
Antisense CCAGCTTTCCCTCCGCATTGA
IL-21 Sense CAC AGA CTA ACA TGC CCT TCA T
Antisense GAA TCT TCA CTT CCG TGT GTT C
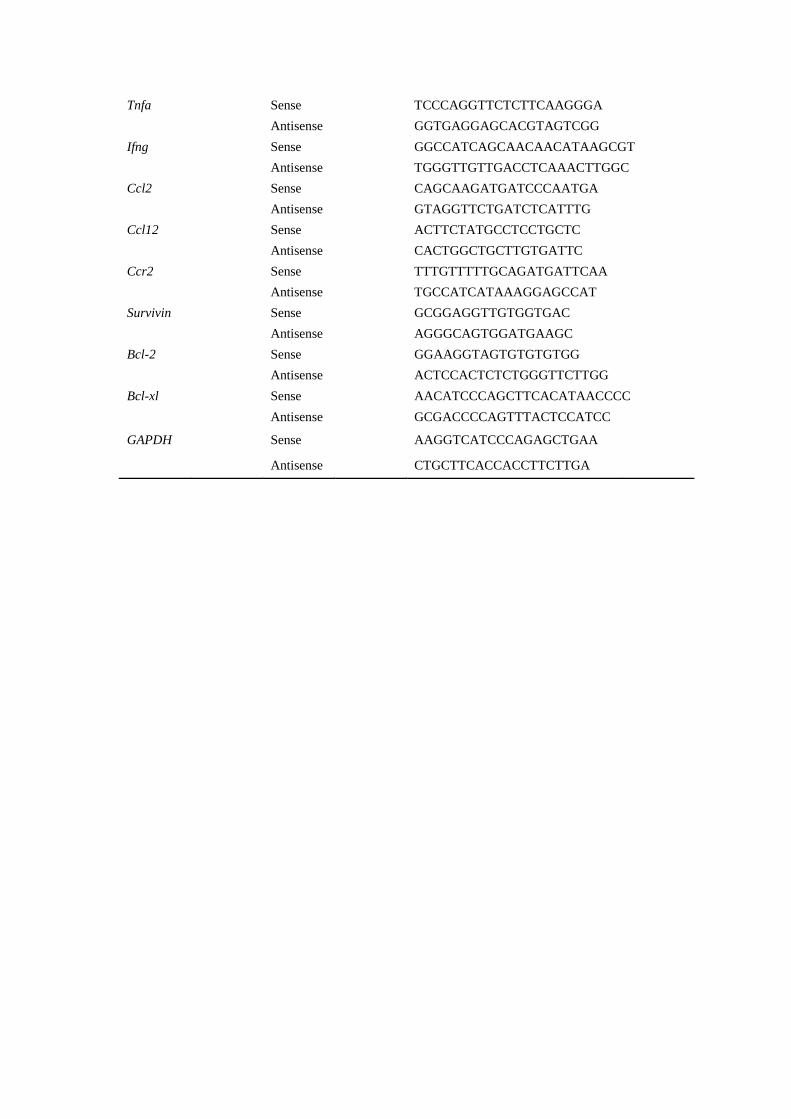
Tnfa Sense TCCCAGGTTCTCTTCAAGGGA
Antisense GGTGAGGAGCACGTAGTCGG
Ifng Sense GGCCATCAGCAACAACATAAGCGT
Antisense TGGGTTGTTGACCTCAAACTTGGC
Ccl2 Sense CAGCAAGATGATCCCAATGA
Antisense GTAGGTTCTGATCTCATTTG
Ccl12 Sense ACTTCTATGCCTCCTGCTC
Antisense CACTGGCTGCTTGTGATTC
Ccr2 Sense TTTGTTTTTGCAGATGATTCAA
Antisense TGCCATCATAAAGGAGCCAT
Survivin Sense GCGGAGGTTGTGGTGAC
Antisense AGGGCAGTGGATGAAGC
Bcl-2 Sense GGAAGGTAGTGTGTGTGG
Antisense ACTCCACTCTCTGGGTTCTTGG
Bcl-xl Sense AACATCCCAGCTTCACATAACCCC
Antisense GCGACCCCAGTTTACTCCATCC
GAPDH Sense AAGGTCATCCCAGAGCTGAA
Antisense CTGCTTCACCACCTTCTTGA