Embed Size (px)
Citation preview

Ownership Transition
Consulting Architects of Alberta
Edmonton, Alberta

Establish an “Exit Strategy”
“X” years
“Y” years
Do Nothing Sell the firm
Internal OT External sale
Liquidate
Who
When
How
How many
The Firm “Today”
TIME
The Firm “Long Term”
Future Vision
• Leadership Development
• Succession Planning
• Management Training
• Growth• Other (OT?)
Ultimate Strategy ?

Decide on Growth
• Growth Profits Headcount Locations Services Clients
• Status Quo Challenge Development Recruitment Retention
Create Your Firm Financial Vision
Financial Metric FY 2007 FY 200825th %ile Median
75th %ile FY 2009 FY 2010 FY 2011 FY 2012 FY 2013
Total (Gross) Revenue $19,920 $20,956 $23,000 $25,453 $28,350 $31,335 $35,225 Net Revenue $16,231 $17,636 $20,000 $22,144 $24,098 $26,635 $29,941 Net/Gross Revenue Ratio 0.81 0.84 0.87 0.87 0.85 0.85 0.85 Operating Profit (Pre-Bonus, Pre-Tax) $2,153 $2,493 $2,050 $1,971 $2,583 $2,756 $3,010 Profitability (% of Net Revenue) 13.3% 14.1% 6.7% 13.8% 19.5% 10.3% 8.9% 10.7% 10.3% 10.1%Total Direct Labor Hours 233,868 237,810 260,467 272,110 274,028 291,253 314,857Total Hours (all staff) 333,238 340,873 368,687 387,121 406,477 426,801 448,141Total Staff (Full Time Equivalents) 160 164 177 186 195 205 215No.Employees Departing During Year 29 40 26 26 25 25 26Staff Turnover Rate (per FTE) 18.1% 24.4% 8.0% 14.1% 21.5% 14.7% 14% 13% 12% 12%Staff Growth Rate (per FTE) -2.6% 2.3% 0.0% 5.1% 11.7% 8.2% 5% 5% 5% 5%New Hires Needed (FTEs) 25 44 39 35 35 34 36Net Revenue per FTE $101 $108 $92 $100 $115 $113 118.9814 $123 $130 $139Direct Labor Rate ($/hour) $28.38 $29.45 $30.11 $31.30 $32.57 $33.87 $35.22Total Direct Labor Costs $6,637 $7,004 $7,843 $8,517 $8,925 $9,865 $11,089Total Payroll (excluding fringes) $9,580 $10,004 $11,141 $12,167 $13,125 $14,507 $15,842Average Hourly Rate ($/hour) $28.75 $29.35 $30.22 $31.43 $32.29 $33.99 $35.35Target Direct Labor Multiplier 2.50 2.50 2.97 3.00 3.20 2.50 2.55 2.60 2.65 2.70Achieved Direct Labor Multiplier 2.45 2.52 2.71 2.99 3.19 2.55 2.60 2.70 2.70 2.70Labor Overhead $2,943 $3,000 $3,298 $3,650 $4,200 $4,642 $4,753Labor OH Rate (% of D.L.) 44% 43% 42% 43% 47% 47% 43%Non-labor Overhead (excl. bonus) $6,740 $5,268 $7,144 $8,006 $8,390 $9,372 $11,089Non-labor OH Rate (% of D.L.) 102% 75% 91% 94% 94% 95% 100%Total Overhead (excl.bonus) $9,683 $8,268 $10,442 $11,656 $12,590 $14,014 $15,842Total OH Rate (before Incentive/Bonus) 146% 118% 141% 158% 176% 133% 137% 141% 142% 143%Operating Return on Overhead (ROO) 22% 30% 12% 25% 41% 20% 17% 21% 20% 19%Chargeability (Based on $ of Labor) 69.3% 70.0% 56.5% 59.8% 63.5% 70.4% 70.0% 68.0% 68.0% 70.0%Chargeability (Based on hours) 70.2% 69.8% 70.6% 70.3% 67.4% 68.2% 70.3%Net Payroll Multiplier (Revenue Factor) 1.69 1.76 1.62 1.76 1.91 1.80 1.82 1.84 1.84 1.89

Know Your Culture, Purpose, and Alignment
PCP
BCP
PCB
BCB
PCP
PCB
BCP BCB
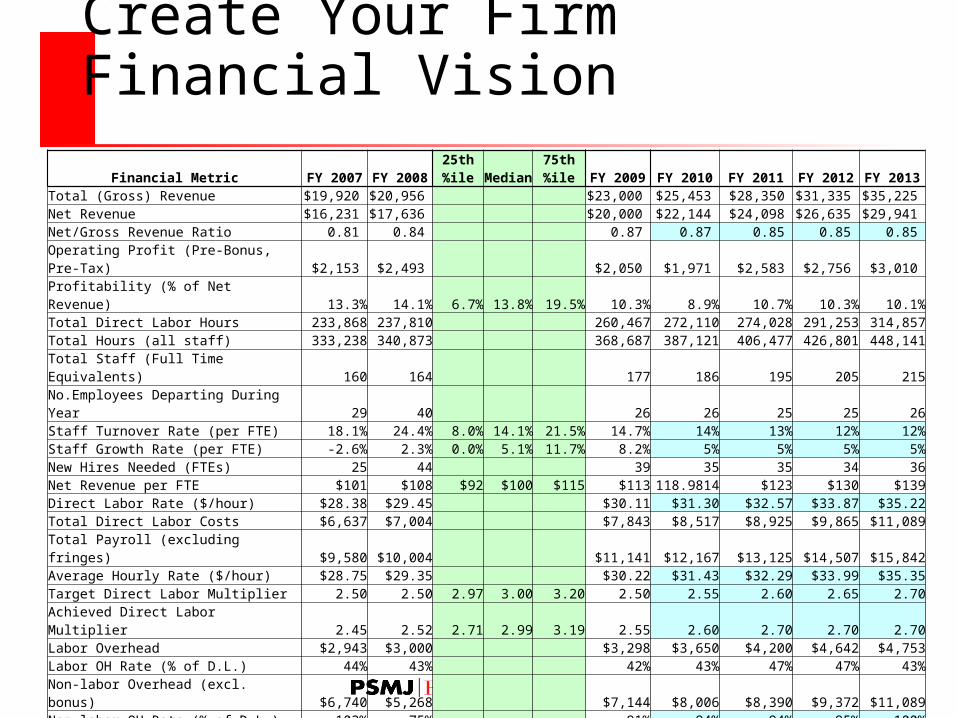
PCP VS BCB
PCP BCP
PCB BCB
• Primary/secondary practice focus
• Generally a niche based firm
• High “value”• Not differentiated on price• Generally high multiplier on
DL• Tend to be smaller firms• Business focus ($$) may be
present, but is not a driver• Quality is very high and part
of value proposition• Primary focus is practice• Secondary focus is business
($$)• Generally has niche like
qualities• “Value proposition” is high• Not solely differentiated on
price• Generally high multiplier on
DL• Business focus ($$) is
present, but is not the primary driver
• Primary/secondary focus is business ($$)
• Niche capabilities generally gone
• “Value proposition” is “cheapest”
• Differentiated solely on price• Generally low multiplier on DL• Tend to be larger, public firms• Practice focus is not the driver• Quality is “just enough”
• Primary focus is business ($$)
• Practice question is still asked, but is not the driver
• Specialty possible, but generally not a niche based firm
• Value differentiator still exists• Price differentiation occurs• Lower multipliers on DL• Tend to be larger firms

Time
Peop
le
Recognize Growth Plateaus
(20-30)
(80-120)
(300-500)
Recognize plateaus in firm growth. They occur for a variety of reasons and require different approaches to overcome.

Understand the 1st Plateau Span of control
Control tendencies/reluctance to let go
Founder syndrome
Trust breakdown
Team dysfunction
Leadership style (coach, delegate, micro manage, abandon)
Project size
Alignment issues around Purpose and Culture
Organizational structure/formalization
Sell-do traps
Lack of investment in BD and other necessary “infrastructure”

…And the 2nd
CFO
CEO
COO
PM
BD
BOD
Dept Dept Dept BU
HR

Pro
fits
Time
Performance consistency affects confidence in the future and drives the value of the business.
If You Care About the Future…
Manage Firm Growth to Fit Your Transition Plan and Financial Vision.

“The Work”
Doing “the Work” ?
Managing “the Work” ?
Managing and leading “the business” ?
As a Firm Leader, Know Where You Add Best Value
75% Utilization??

Establish Clearly Defined Participation Criteria
Management
• xxxxxx
• xxxxxx
• xxxxxx
• xxxxxx
• xxxxxx
Leadership
• xxxxxx
• xxxxxx
• xxxxxx
• xxxxxx
• xxxxxx
Ownership• xxxxxx
• xxxxxx
• xxxxxx
• xxxxxx
• xxxxxx

Know Your Organizational Life Cycle
Gro
wth
Stable
Aristocracy
Early Bureaucracy
Bureaucracy
Death
Mature
Adolescence
Go-Go
Infancy
Courtship
Divorce
Premature Aging
Founder Trap
Infant Mortality
Affair
Growing Aging

Understand the Generation Gap
You’re a…
Veteran, Traditionalist, Mature,Silent Generation
Baby Boomer,Boomer
Generation X Millennial,Generation Y, Gen Why?, “Nexter”, Echo Boomer
If you were born…
before 1945 between 1946 and 1964
between 1964 and 1980
since 1980
You’re shaped by…
World War II,the Depression, traditional family
television,the Cold War,student activism,youth culture,feminism, space travel, stay-at-home moms
the energy crisis, technology’s first wave, fall of the Berlin Wall, music videos, AIDS, working mothers (latchkey kids), rising divorce rates
explosion of technology and media, 9-11, Columbine shootings, multiculturalism, variety of family structures
You value… respect, loyalty, experience
standing out, recognition
flexibility, honesty, feedbackwork-life balance
strong leadership, concern for community, structure, fair play, diversity

Understand the Generation Gap
You’re a…
Veteran, Traditionalist, Mature,Silent Generation
Baby Boomer,Boomer
Generation X Millennial,Generation Y, Gen Why?, “Nexter”, Echo Boomer
On the job you are…
a disciplined, hard worker who appreciates order and a job well done
a driven, service-oriented team player who doesn’t want to be micro-managed. You live to work.
independent, self-reliant, unimpressed by authority and focused on self-development. You work to live.
self-confident, competent, optimistic, out-spoken and collaborative
Your career motto is…
Seek job security. Education plus hard work equals success.
Invest in portable career skills.
Multi-track or die!

The Implications of Generational Shift
Millenials are THE replacement generation for you
As a demographic group, they:
Are highly talented and are therefore quite valuable
Will be high maintenance
Believe they have “paid their dues” in 2 years or less
Do expect you to GIVE them your firm
Are projected to hold 26 different jobs over the span of their career
Require strong leadership and collaborative environments
So what are you going to do?

Operate With An “Open-Book” Approach Ownership level (or with those being extended ownership)
Share the above 3 measures, plus expose individuals to numbers related to cash flow, debt/borrowings, profit allocation, company capitalization, share valuation, etc.
Management team level Be fairly open, consistently sharing at least the key measures of (1) Sales, (2) Revenue, and (3) Profit on an EBBT basis (Earnings Before Bonus and Taxes)
General rank and file Disclose general financial information about the company sufficient to convey the state of the company and the business outlook for the future.

Instill a Strategic Planning Process and Culture
Purpose
Information Technology
Human Resources
Financial Management
Leadership Transition
Ownership Transition
Project Delivery
Business Development
Organizational Structure
StrategicPlanningWheel
The Business Continuum

Revisit Your “Exit Strategy”
“X” years
“Y” years
Do Nothing Sell the firm
Internal OT External sale
Liquidate
Who
When
How
How many
The Firm “Today”
TIME
The Firm “Long Term”
Future Vision
• Leadership Development
• Succession Planning
• Management Training
• Growth• Other (OT?)
Ultimate Strategy ?

Your Decision Tree
SELL
SELL IT DIES
YOU DIE
OUTSIDE
INSIDELEGACY
ECONOMICS
OUTSIDE
INDUSTRY
INSIDE
?? DON’T
OUTSIDE
USINSIDE
PUBLIC
PRIVATE
PUBLIC
PRIVATE
Most $ here
Least $ here
Stable, slow growing
Grow to maximize return
PUBLIC
PRIVATE

Internal Ownership Transition Process
Determine Buyer andSeller Cash Flow
Determine Buyer andSeller Cash Flow
Review Financing OptionsReview Financing Options
Contingency PlanContingency Plan
Establish Company Valuation
Develop Buy/Sell
Determine Stock Model
Refine O’ship. Criteria
Identify Potential Buyers (prospectus)
Formal Offer and Acceptance
Tax and Legal Input
Education on OT process (ongoing)
Internal Transition Steps

An Example of Mass Retirement of Senior Principals Leading edge of baby-boomers
now hitting early 60”s Many are senior principals Few have developed long-term
ownership transition plans Even fewer have developed the
next generation of leaders Result will be many failed
ownership transitions There will also be many more
acquisitions
AIA Members in California
0
500
1000
1500
2000
1989 2004
# Dead or Retiring # New Licenses

There Are Going to Be More Sellers Than Buyers
25 to 34 35 to 44 45 to 54 55 to 64 65 +0
10
20
30
40
50
60
70U.S. Population in Various Age Ranges
20052025
Age Range
Mill
ions
Creating an Increasing Number of Acquisitions

According to the Law of Supply and Demand…
This glut of firms seeking to be acquired will reduce their value.
What Impact Does This Have?
Valuations and expectations are down but improving.
It is definitely time to check your own valuation.
Big firms are being very selective – much harder to do deals with stock.

The “REALLY BIG” Challenge
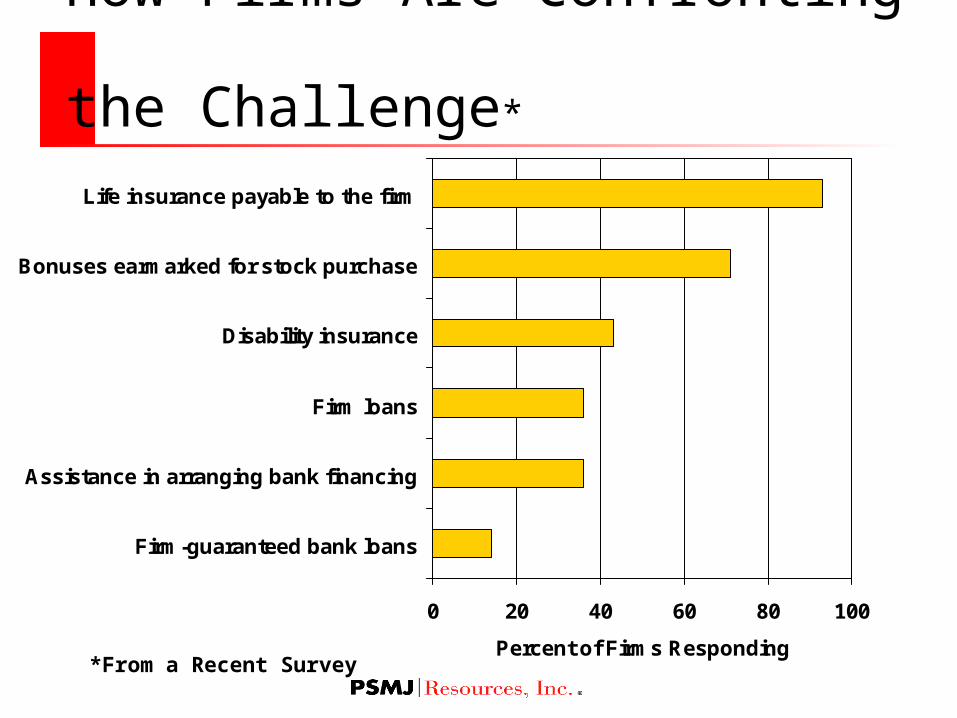
How Firms Are Confronting the Challenge*
0 20 40 60 80 100
Firm-guaranteed bank loans
Assistance in arranging bank financing
Firm loans
Disability insurance
Bonuses earmarked for stock purchase
Life insurance payable to the firm
Percent of Firms Responding*From a Recent Survey

Other Financing Options Be born rich, inherit $ from a rich aunt, or win the
lottery Gradual share buy-out from bonus money Escrow account from bonuses Pledge future profits to departing owner(s) Borrow the money Life insurance Find an equity partner If all else fails, sell outside

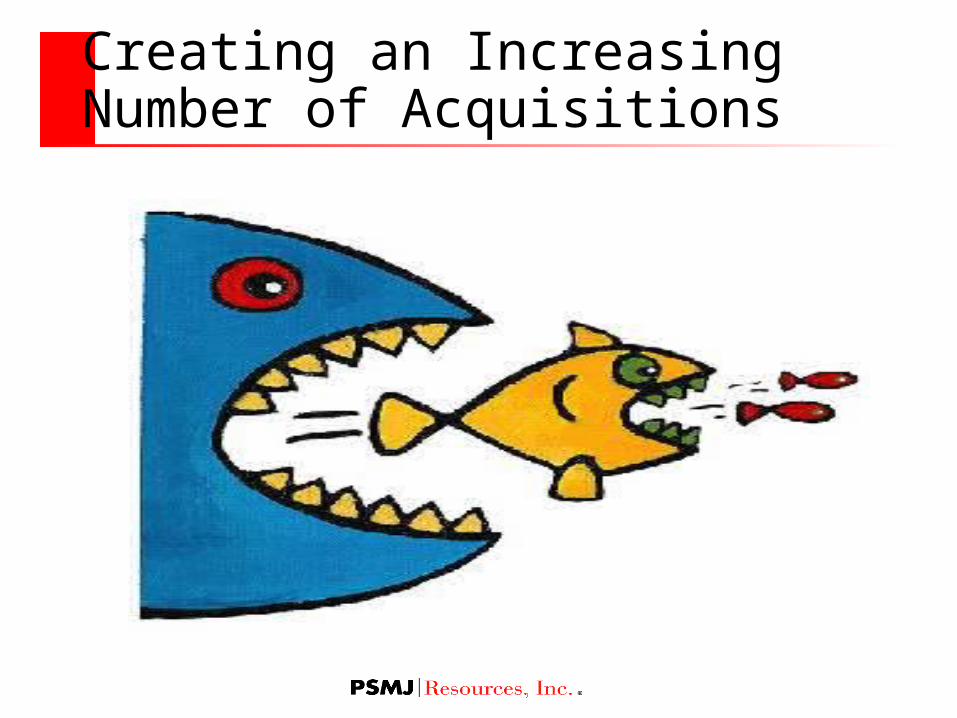
Link Your Firm Financial Plan To Your Transition Plan
Financial Metric FY 2007 FY 200825th %ile Median
75th %ile FY 2009 FY 2010 FY 2011 FY 2012 FY 2013
Total (Gross) Revenue $19,920 $20,956 $23,000 $25,453 $28,350 $31,335 $35,225 Net Revenue $16,231 $17,636 $20,000 $22,144 $24,098 $26,635 $29,941 Net/Gross Revenue Ratio 0.81 0.84 0.87 0.87 0.85 0.85 0.85 Operating Profit (Pre-Bonus, Pre-Tax) $2,153 $2,493 $2,050 $1,971 $2,583 $2,756 $3,010 Profitability (% of Net Revenue) 13.3% 14.1% 6.7% 13.8% 19.5% 10.3% 8.9% 10.7% 10.3% 10.1%Total Direct Labor Hours 233,868 237,810 260,467 272,110 274,028 291,253 314,857Total Hours (all staff) 333,238 340,873 368,687 387,121 406,477 426,801 448,141Total Staff (Full Time Equivalents) 160 164 177 186 195 205 215No.Employees Departing During Year 29 40 26 26 25 25 26Staff Turnover Rate (per FTE) 18.1% 24.4% 8.0% 14.1% 21.5% 14.7% 14% 13% 12% 12%Staff Growth Rate (per FTE) -2.6% 2.3% 0.0% 5.1% 11.7% 8.2% 5% 5% 5% 5%New Hires Needed (FTEs) 25 44 39 35 35 34 36Net Revenue per FTE $101 $108 $92 $100 $115 $113 118.9814 $123 $130 $139Direct Labor Rate ($/hour) $28.38 $29.45 $30.11 $31.30 $32.57 $33.87 $35.22Total Direct Labor Costs $6,637 $7,004 $7,843 $8,517 $8,925 $9,865 $11,089Total Payroll (excluding fringes) $9,580 $10,004 $11,141 $12,167 $13,125 $14,507 $15,842Average Hourly Rate ($/hour) $28.75 $29.35 $30.22 $31.43 $32.29 $33.99 $35.35Target Direct Labor Multiplier 2.50 2.50 2.97 3.00 3.20 2.50 2.55 2.60 2.65 2.70Achieved Direct Labor Multiplier 2.45 2.52 2.71 2.99 3.19 2.55 2.60 2.70 2.70 2.70Labor Overhead $2,943 $3,000 $3,298 $3,650 $4,200 $4,642 $4,753Labor OH Rate (% of D.L.) 44% 43% 42% 43% 47% 47% 43%Non-labor Overhead (excl. bonus) $6,740 $5,268 $7,144 $8,006 $8,390 $9,372 $11,089Non-labor OH Rate (% of D.L.) 102% 75% 91% 94% 94% 95% 100%Total Overhead (excl.bonus) $9,683 $8,268 $10,442 $11,656 $12,590 $14,014 $15,842Total OH Rate (before Incentive/Bonus) 146% 118% 141% 158% 176% 133% 137% 141% 142% 143%Operating Return on Overhead (ROO) 22% 30% 12% 25% 41% 20% 17% 21% 20% 19%Chargeability (Based on $ of Labor) 69.3% 70.0% 56.5% 59.8% 63.5% 70.4% 70.0% 68.0% 68.0% 70.0%Chargeability (Based on hours) 70.2% 69.8% 70.6% 70.3% 67.4% 68.2% 70.3%Net Payroll Multiplier (Revenue Factor) 1.69 1.76 1.62 1.76 1.91 1.80 1.82 1.84 1.84 1.89
It is critical that the Plan for transition be compatible with the firm financial vision and Strategic Plan.

Assess Your Leadership Capacity
Some other quantitative assessment tools: Blanchard Situational Leadership
Predictive Index (piprofilext)
Harrison Assessment
LMap
Numerous other tools

Most Firms Tend To Ignore Leadership Transition
1 to 20 21 to 50
51 to 100
101 to 200
201 to 350
351 to 500
Over 500
0102030405060708090
Firms with Succession Plans
Firm Size (Employees)
Perc
en
t w
/Pla
ns

Leaders vs. Managers The Leader
Does the right things Creates a better
system Motivates people Focuses on
achieving the vision Looks for long-term
effectiveness
The Manager Does things right Improves the
system Directs peoples’
activities Focuses on the job
at hand Looks for short-term
achievements

Ownership vs. Leadership
Ownership is a financial state. It requires:
$$$ to invest Judgment when
voting shares Judicious use of
power
Leadership is an attribute of employment:
“The ability to get others to support your ideas”
Absolutely nothing to do with $$$ or title
Provides a good foundation for being an owner – but not a guarantee
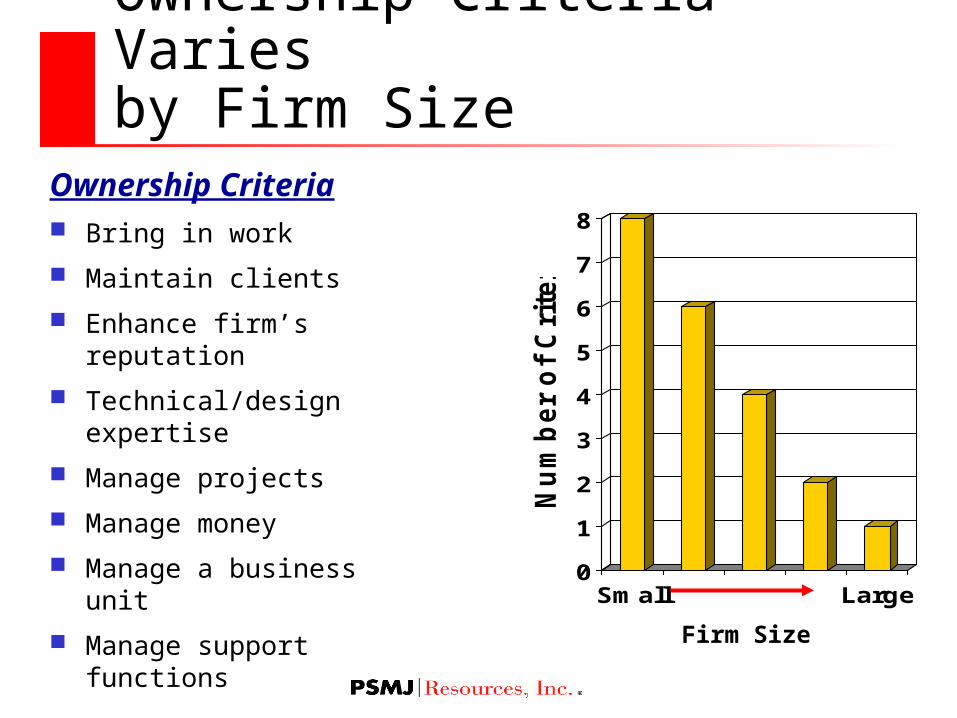
Ownership Criteria Varies by Firm Size
Ownership Criteria Bring in work
Maintain clients
Enhance firm’s reputation
Technical/design expertise
Manage projects
Manage money
Manage a business unit
Manage support functions0
1
2
3
4
5
6
7
8
Nu
mb
er
of
Cri
teri
a
Small Large
Firm Size

Linking Leadership and Ownership
Governance• Board• CEO• COO
Senior Management• Business Unit Leaders• Practice Area Leaders
Middle Management• Project Managers• Department Heads
Senior Principal
(largest ownership)
Principal
(mid-level ownership)
Associate(minor ownership)
Levels of Ownership Leadership Position

One Firm’s Ownership Criteria
Qualifications Associate PrincipalSenior
PrincipalEducation 4-year degree 4-year degree 4-year degree
Registration Required If available If available If available
Years Relevant Experience 5 10 10
Years With the Firm 1 2 2
Years as an Associate 1 1
Years as a Principal 1
Minimum Annual Workload $200,000 $300,000 $700,000
Minimum Marketing Results
$300,000 700,000
Investment Required 30% of Salary 100% of Salary 150% of Salary
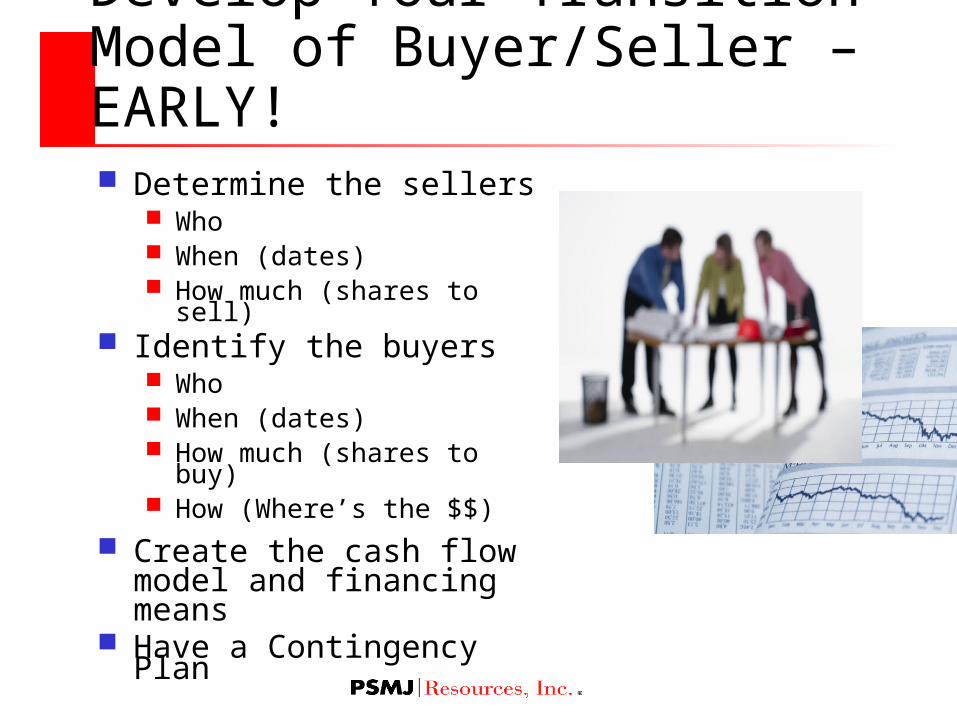
Develop Your Transition Model of Buyer/Seller – EARLY! Determine the sellers
Who When (dates) How much (shares to sell)
Identify the buyers Who When (dates) How much (shares to buy) How (Where’s the $$)
Create the cash flow model and financing means
Have a Contingency Plan
Other Things You Should Do Have a Strategic Plan
Know your Purpose
Achieve alignment
Involve NexGen’s in planning process
Operate with open-book management
Treat planning as a core business process

Thank You!
Questions?