Embed Size (px)
Citation preview
1
Ownership Structure, Board Composition and Investment Performance
Johan E. Eklundi, Johanna Palmberg* and Daniel Wibergii
*Corresponding Author Jönköping International Business School
P.O. Box 1026, SE-551 11 Jönköping, Sweden Phone: +46-36-101761
E-mail: [email protected] Web: http://www.ihh.hj.se
Abstract
This paper explores the relation between ownership structure, board composition and firm performance among Swedish listed firms. The descriptive statistics show that Swedish board of directors has become more diversified in terms of gender. The analysis shows that board size has a significant negative effect on investment performance. Gender diversity has a small but negative effect on investment performance, and the same holds for CEO being on the board. When incorporating all the explanatory variables into the same equation the negative effect of larger boards dilutes the effect of gender diversity and having the CEO on the board.
Keywords: Corporate governance, board composition, investments performance, marginal q. JEL-codes: G30, L20, L21, L22, L25 Acknowledgments: Financial support from Sparbanks Stiftelsen Alfa and CEFEO (Center for Family Enterprise and Ownership) to Johanna Palmberg’s dissertation work is gratefully acknowledged. The authors would also like to thank Torsten and Ragnar Söderberg’s foundation and the Ratio-Institute for financial support. ____________________________________________ Affiliations: i. RATIO and Jönköping International Business School ii. Jönköping International Business School and CESIS Royal Institute of Technology.

2
1. Introduction
A large body of research has examined the link between board composition and firm
performance. 1 A majority of the studies investigate how board structure influence firm
performance, usually measured by Tobin’s q or some accounting measure of profitability
such as ROA. There are a number of recent Nordic studies investigating board composition2
and firm performance, for example Bøhren and Strøm, (2005 ); Smith et al., (2006); Randøy
et al., (2006); and Rose, (2007). The empirical results in most studies generally support a
negative relation between board size and firm performance. The results of other board
composition factors such as age, gender and nationality are far less consistent. In particular,
the question of how ownership structure influences board composition and subsequently
firms’ performance is largely unresolved since very little empirical research exists.
This paper is a response to Randøy et al., (2006)’s call for further investigation and
for the use of alternative methodologies3 to evaluate performance. Marginal q is used as an
alternative, and in fact more appropriate, measure of firm performance. Contrary to the
commonly used market to book ratios measuring the average return on the firms’ investment,
marginal q measures the return on the firm’s marginal investment relative to the firms’ cost
of capital. Moreover, this paper adds further to the literature by empirically investigating the
links between ownership structure, board composition and firm performance.
By examining a comprehensive panel of firms listed on the Stockholm Stock
Exchange during 1999-2005 the paper also adds some methodological insights to the
empirical literature. When studying ownership structure and corporate governance issues
such as board composition Sweden provides a particularly advantageous example. Sweden is
1 See Carter et al. (2003); Hermalin and Weisbach (2003); John and Senbet (1998) for excellent reviews. 2 Board structure refers both to the size and to the composition of boards. 3 Most performance studies use Tobin’s market to book value as performance measure (see for example Dalton et al, (1998); Dalton et al, (1999); Hermalin and Weisbach, (2003) for an overview).
3
a small, open and export oriented economy with firms having a concentrated ownership
structure typical to the continental European corporate governance model.
Our key findings are that board size has a significant negative effect on investment
performance. The results also show that gender diversity has a small but negative effect on
investment performance, and the same holds for having the CEO on the board. When
incorporating all the explanatory variables into one equation however, the negative effect of
larger boards reduces the effect of gender diversity and CEO on the board on firm investment
performance. The descriptive statistics show that Swedish board of directors has become
more diversified in terms of gender. Moreover, fewer firms have the CEO on the board,
which can be interpreted as a sign of increased independency.
The rest of the paper is organized as follows. Section two continues with a discussion
of the theoretical framework and previous empirical findings regarding the relationship
between ownership, board composition and firm performance. Also, the empirically testable
hypotheses are presented. Section three contains a description of the methodology used in the
empirical investigation. Section four provides a description of the data and the descriptive
statistics. After the empirical analysis in section five, section six concludes the paper.
2. Ownership Structure, Board Composition and Firm Performance
A number of studies make use of the agency theory and the resource based theory 4 when
assessing the relation between board composition and firm performance (for overview see for
example Randøy et al., (2006); and Dalton et al., 1999). Overall, the theoretical literature is,
however, inconclusive as to the consequences of board structure. For example, the net effect
4 Randøy et al, (2006) provides the following description: Resource dependency theory addresses how a board
might facilitate access to valuable resources. The emphasis is on a firm’s ability to form links to secure access
to critical resources, such as capital, customers, suppliers, or cooperative partners (page 5).
4
of board heterogeneity could be either negative or positive. Hermalin and Weisbach (2003)
argues that the lack of a coherent theoretical framework is conducive to that most of the
contemporary research on board composition and firm performance is empirical driven.
Size and composition of boards usually differ to some extent between companies. Current
research show that show that smaller and more dependent 5 boards are more frequent in firms
characterized by “high growth opportunities; high R&D expenditures and high stock return
volatility whereas large firms have larger and more independent boards” (Linck et al.,
(2008), p. 2). Raheja (2005) presents a model that shows that the board of directors is larger
when high levels of private benefits to insiders prevail, and larger boards are less effective
than smaller boards.
2.1 Ownership and Board Structure
The main task of the board of directors is to control and monitor the management, i.e.
to align the classical principal agent problem between the management and the owners of the
firm (Fama and Jensen 1983). In corporate governance system characterized by concentrated
ownership a second type of agency problems between the controlling and minority
shareholders arise (see Villalonga and Amit, (2006); (Söderström Tson et al., (2003) for
further discussion). In the Swedish system the controlling owner has a considerable impact on
the composition of the board and its functioning. The board of directors is supposed to act in
the interest of all owners. There is a possible problem that the interest of the minority
shareholders is not properly acknowledged. The Swedish code of corporate governance 6
5 In Anglo-Saxon firms dependent boards are characterized by having many insiders on the board i.e. directors closely related to the management of the firm. 6
The Swedish Code of Corporate Governance is a report based on the Swedish Companies Act (Aktiebolagslagen, 1975:1385). The code was implemented in 2005 and regulates the conduct of publicly traded firms in Sweden. For example companies traded on the Stockholm stock exchange (OMX) may only have one
5
highlights this dependency problem and rules regarding the composition of board of directors
have been introduced on the Stockholm stock exchange.
One way for the board to become more independent is to appoint foreign directors. By
reducing the ability of controlling owners to entrench the management foreign and
institutional owners can also play a monitoring role (Bjuggren et al. 2007). As shown by
Bilimora and Wheeler, (2000) one can assume a positive relationship between institutional
owners and board diversity. Based on this discussion we formulate hypothesis one and two:
Hypothesis 1: The presence of a controlling owner reduces board heterogeneity
Hypothesis 2: Institutional and foreign owners increase board heterogeneity
2.2 Board Size
A number of empirical studies investigate the link between board size and firm
performance (see Hermalin & Weisbach, (2003) for an excellent literature review). Jensen,
(1993) argues that there is a negative relationship between large boards of directors, (above
seven or eight members), and firm performance. Boards that exceed this number are much
more likely to be controlled by the CEO and function less effectively. The empirical literature
generally support the argument about “oversized boards” put forth by Jensen, (1993). For
example Yermack, (1996) reports a negative relation between board size and Tobin’s q. The
negative relation seems also to hold for Nordic firms, Randøy et al, (2006) for example, show
person from the senior management on the board; a majority of the board members that are elected at the annual shareholding meeting should be independent from the firm and at least two of these independent board members must also be independent from the largest shareholder (see Swedish Code of Corporate Governance for further details).
6
that larger boards have a negative impact on firm performance. Based on the above reasoning
we formulate hypothesis three:
Hypothesis 3: Board size has a negative impact on performance
2.3 Board Composition, Information Allocation and Decision Efficiency
In order to perform optimally the boards of directors must have access to accurate
information. There is an ongoing discussion (van der Walt and Ingley 2003) in the literature
regarding which type of directors or composition of directors that is optimally in this sense;
outside directors with greater knowledge about the surrounding business environment and
access to information from other firms (business partners, suppliers, competitors and external
sources of capital) or inside directors with superior knowledge about the firm. The resource
based view argues that increased diversification among board members is positive for the
firm and its financial performance (van der Walt and Ingley 2003). A diversified board
should be better at advising and counseling the management than a more homogenous board.
The resources based view tends to focus on advantages with board diversity in terms of
having access to a larger informational network and does not address the costs of decreased
efficiency with respect to decision making.
Board heterogeneity is associated with a trade-off between increased costs in terms of
longer decision time and lower external costs. That is, a trade-off between increased
information efficiency associated with heterogeneous boards and decision efficiency
associated with homogenous boards. Heterogeneous boards tend to be better informed
regarding issues outside the firm and thereby better equipped to question and discuss
7
corporate strategic decisions, whereas homogenous boards to a larger extent is based on trust,
co-operation, as well as shared experience and values (Söderström Tson et al. 2003).
Age and gender diversity among board members are important factors measuring
heterogeneity. Over the last years there has been an increase in board diversity in terms of
gender among European firms. Norway, Sweden and Finland are the top three countries in
this respect Groswold, et al., (2007). Bilimora and Wheeler (2000), report that female
directors are often younger than their male colleagues, whereby appointing female directors
would increase diversity both in terms of gender and age. The empirical results of gender
diversity are however mixed. Bøhren and Strøm (2005 ) report a negative influence of gender
diversity on firm performance whereas Smith et al., (2006) report a positive relationship
between female representatives in the top management and firm performance in small Danish
firms. The latter result is confirmed by Carter et al., (2003) in a study of U.S. based firms.
Rose (2007), evaluates the impact of having women on boards of directors in Danish public
firms. The results indicate no significant relation between the presence of women and firm
performance. One explanation, put forth by Rose (2007) is that, in order to be accepted, new
“unconventional” members need to adopt the behavior of the more conventional board
members and business leaders which removes any possible effects of women on the board.
This non-significant relation between gender diversity and board composition is confirmed
by Randøy et al., (2006). The discussion above results in the following hypothesis:
Hypothesis 4: There is no effect of board heterogeneity on firm investment
performance
8
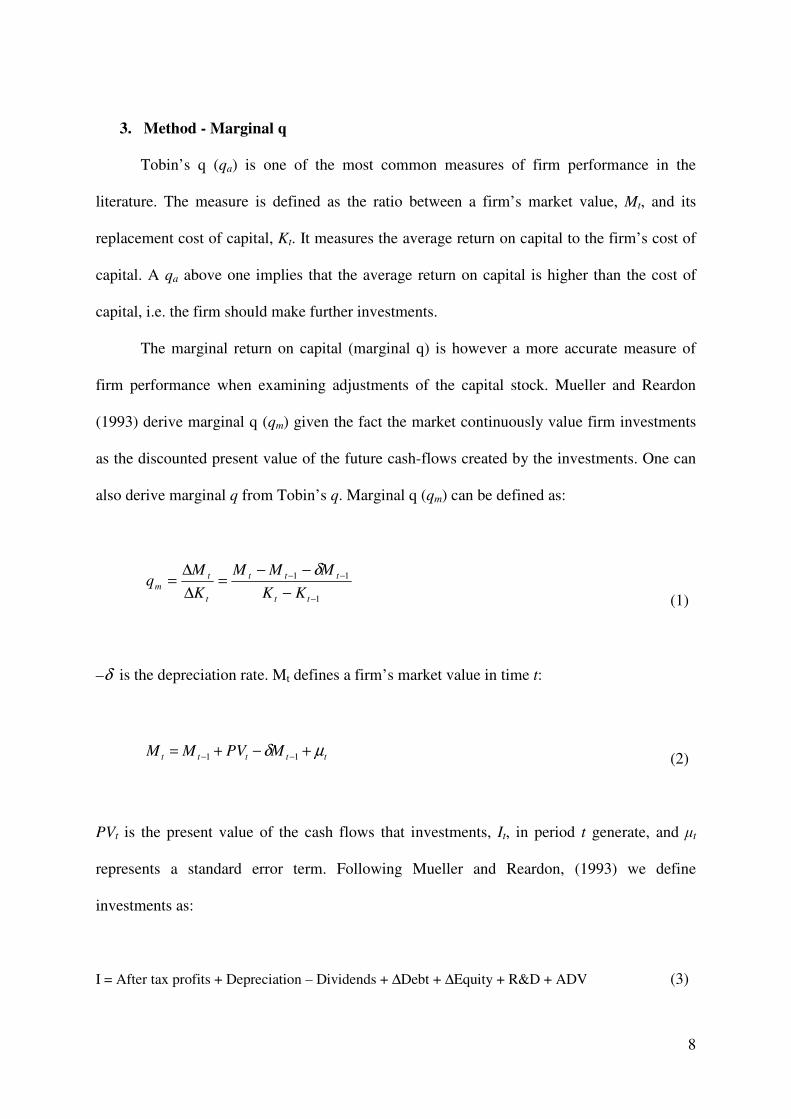
3. Method - Marginal q
Tobin’s q (qa) is one of the most common measures of firm performance in the
literature. The measure is defined as the ratio between a firm’s market value, Mt, and its
replacement cost of capital, Kt. It measures the average return on capital to the firm’s cost of
capital. A qa above one implies that the average return on capital is higher than the cost of
capital, i.e. the firm should make further investments.
The marginal return on capital (marginal q) is however a more accurate measure of
firm performance when examining adjustments of the capital stock. Mueller and Reardon
(1993) derive marginal q (qm) given the fact the market continuously value firm investments
as the discounted present value of the future cash-flows created by the investments. One can
also derive marginal q from Tobin’s q. Marginal q (qm) can be defined as:
1
11
−
−−
−
−−=
∆
∆=
tt
ttt
t
t
mKK
MMM
K
Mq
δ
(1)
–δ is the depreciation rate. Mt defines a firm’s market value in time t:
ttttt MPVMM µδ +−+= −− 11 (2)
PVt is the present value of the cash flows that investments, It, in period t generate, and µt
represents a standard error term. Following Mueller and Reardon, (1993) we define
investments as:
I = After tax profits + Depreciation – Dividends + ∆Debt + ∆Equity + R&D + ADV (3)

9
According to the standard net present value rule the firm should continue to investment until
PVt = It or equivalent PVt/It = 1. The latter expression can be rewritten as PVt / It = qm. To get
an empirically testable equation we divide equation (2) by Mt-1 and rearrange:
111
1
−−−
− ++−=−
t
t
t
t
m
t
tt
MM
Iq
M
MM µδ
(4)
Equation (4) assumes efficient capital market in the sense that future cash flows are
unbiased estimates. That is, 1−tt Mµ goes to zero when t gets larger.7 To study the effects of
board structure on marginal q we construct interaction terms with variables accounting for
board size, gender diversity, average age and a dummy for CEO participation on the board.
Operationally this is done by interacting 1−t
t
M
I from equation (4) with the explanatory
variable of interest. This generates the functional form: ZXY 21 ββα ++= , and an
empirically testable model of the form:
i
t
t
ii
t
t
t
t
t
tt
M
IZ
M
IZ
M
I
M
MMεβββδ +++++−=
−
−
+
−−−
−
1
1
1
12
1
1
1
1 ... (5)
Zi denotes the explanatory variables.
There are a number of advantages with using marginal q instead of Tobin’s average q.
(Mueller and Reardon, (1993); (Gugler and Yurtoglu 2003). The most important one is that
7 See Mueller and Reardon, (1993); Gugler, et al., (2004) for further discussion on derivation of marginal q.
10
marginal q does not (as can be the case with Tobin’s q) mix average and marginal returns on
investment. Moreover, marginal q is easy to interpret in an analysis of managerial discretion.
A qm<1 indicates that the manager is over-investing. That is, the capital return of the
investment project is less than cost of the investment. The shareholders would have been
better off if the firm had distributed these funds directly to them instead of making the
investment. Conversely, a qm > 1 indicates that the manager is under-investing. The marginal
investment generates a return that is higher than the cost of capital and the firm should have
invested more. A qm equal to one indicates that the management maximizes shareholder
value.
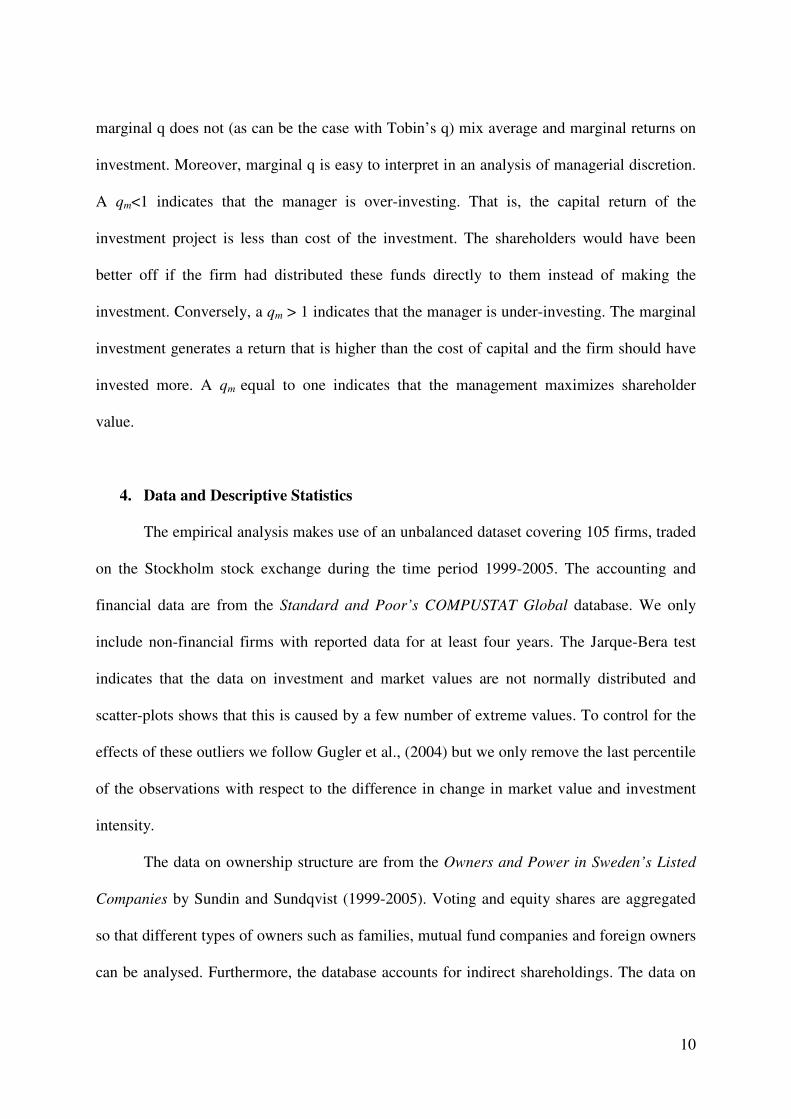
4. Data and Descriptive Statistics
The empirical analysis makes use of an unbalanced dataset covering 105 firms, traded
on the Stockholm stock exchange during the time period 1999-2005. The accounting and
financial data are from the Standard and Poor’s COMPUSTAT Global database. We only
include non-financial firms with reported data for at least four years. The Jarque-Bera test
indicates that the data on investment and market values are not normally distributed and
scatter-plots shows that this is caused by a few number of extreme values. To control for the
effects of these outliers we follow Gugler et al., (2004) but we only remove the last percentile
of the observations with respect to the difference in change in market value and investment
intensity.
The data on ownership structure are from the Owners and Power in Sweden’s Listed
Companies by Sundin and Sundqvist (1999-2005). Voting and equity shares are aggregated
so that different types of owners such as families, mutual fund companies and foreign owners
can be analysed. Furthermore, the database accounts for indirect shareholdings. The data on
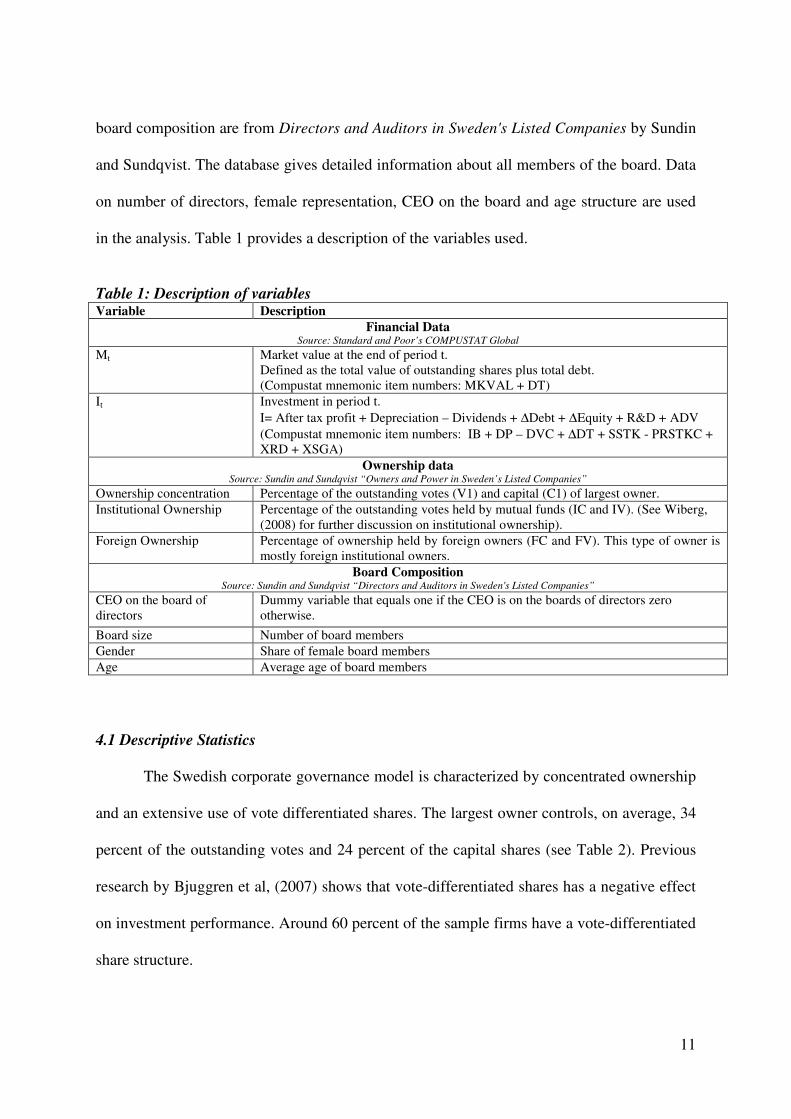
11
board composition are from Directors and Auditors in Sweden's Listed Companies by Sundin
and Sundqvist. The database gives detailed information about all members of the board. Data
on number of directors, female representation, CEO on the board and age structure are used
in the analysis. Table 1 provides a description of the variables used.
Table 1: Description of variables Variable Description
Financial Data Source: Standard and Poor’s COMPUSTAT Global
Mt Market value at the end of period t. Defined as the total value of outstanding shares plus total debt. (Compustat mnemonic item numbers: MKVAL + DT)
It Investment in period t. I= After tax profit + Depreciation – Dividends + ∆Debt + ∆Equity + R&D + ADV (Compustat mnemonic item numbers: IB + DP – DVC + ∆DT + SSTK - PRSTKC + XRD + XSGA)
Ownership data Source: Sundin and Sundqvist “Owners and Power in Sweden’s Listed Companies”
Ownership concentration Percentage of the outstanding votes (V1) and capital (C1) of largest owner. Institutional Ownership Percentage of the outstanding votes held by mutual funds (IC and IV). (See Wiberg,
(2008) for further discussion on institutional ownership). Foreign Ownership Percentage of ownership held by foreign owners (FC and FV). This type of owner is
mostly foreign institutional owners. Board Composition
Source: Sundin and Sundqvist “Directors and Auditors in Sweden's Listed Companies”
CEO on the board of directors
Dummy variable that equals one if the CEO is on the boards of directors zero otherwise.
Board size Number of board members Gender Share of female board members Age Average age of board members
4.1 Descriptive Statistics
The Swedish corporate governance model is characterized by concentrated ownership
and an extensive use of vote differentiated shares. The largest owner controls, on average, 34
percent of the outstanding votes and 24 percent of the capital shares (see Table 2). Previous
research by Bjuggren et al, (2007) shows that vote-differentiated shares has a negative effect
on investment performance. Around 60 percent of the sample firms have a vote-differentiated
share structure.
12
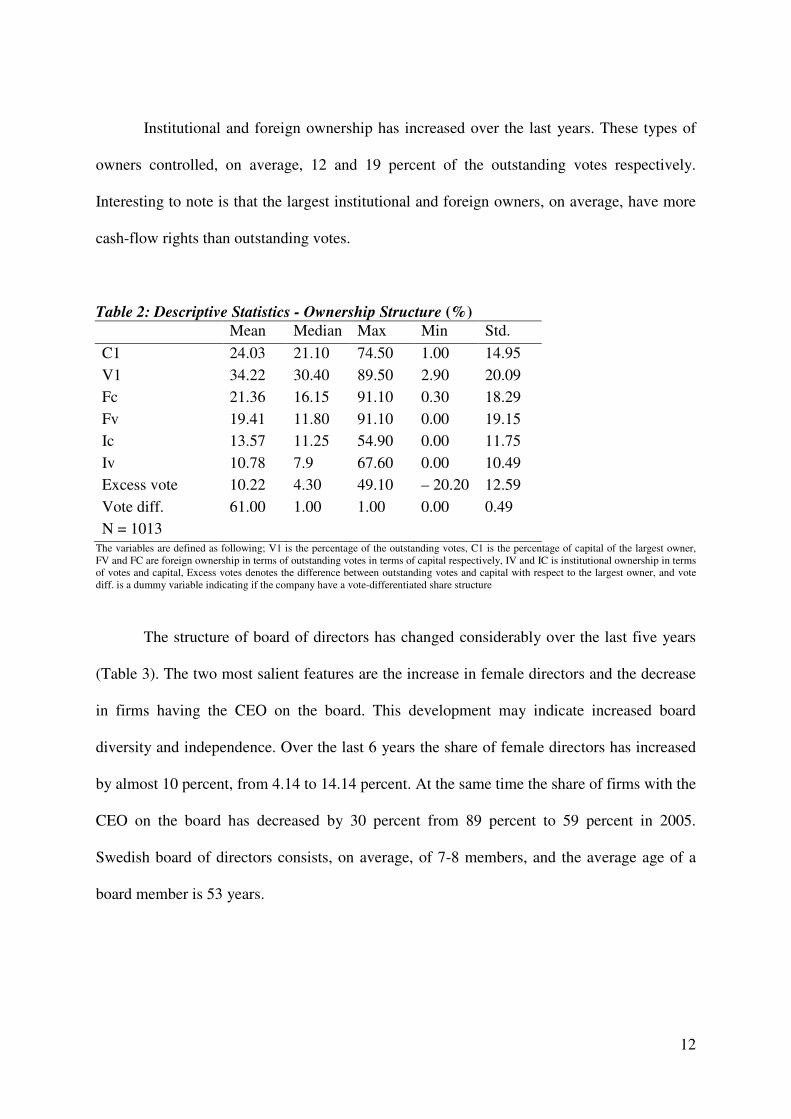
Institutional and foreign ownership has increased over the last years. These types of
owners controlled, on average, 12 and 19 percent of the outstanding votes respectively.
Interesting to note is that the largest institutional and foreign owners, on average, have more
cash-flow rights than outstanding votes.
Table 2: Descriptive Statistics - Ownership Structure (%) Mean Median Max Min Std.
C1 24.03 21.10 74.50 1.00 14.95
V1 34.22 30.40 89.50 2.90 20.09
Fc 21.36 16.15 91.10 0.30 18.29
Fv 19.41 11.80 91.10 0.00 19.15
Ic 13.57 11.25 54.90 0.00 11.75
Iv 10.78 7.9 67.60 0.00 10.49
Excess vote 10.22 4.30 49.10 – 20.20 12.59
Vote diff. 61.00 1.00 1.00 0.00 0.49
N = 1013 The variables are defined as following; V1 is the percentage of the outstanding votes, C1 is the percentage of capital of the largest owner, FV and FC are foreign ownership in terms of outstanding votes in terms of capital respectively, IV and IC is institutional ownership in terms of votes and capital, Excess votes denotes the difference between outstanding votes and capital with respect to the largest owner, and vote diff. is a dummy variable indicating if the company have a vote-differentiated share structure
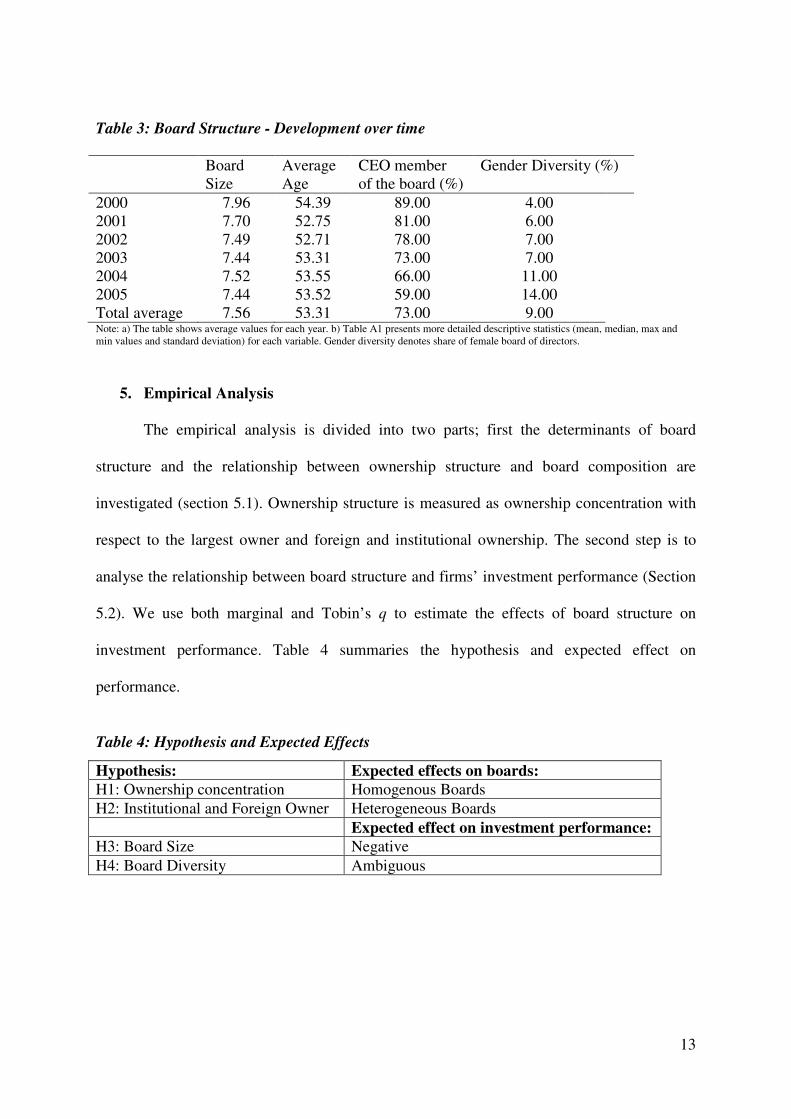
The structure of board of directors has changed considerably over the last five years
(Table 3). The two most salient features are the increase in female directors and the decrease
in firms having the CEO on the board. This development may indicate increased board
diversity and independence. Over the last 6 years the share of female directors has increased
by almost 10 percent, from 4.14 to 14.14 percent. At the same time the share of firms with the
CEO on the board has decreased by 30 percent from 89 percent to 59 percent in 2005.
Swedish board of directors consists, on average, of 7-8 members, and the average age of a
board member is 53 years.
13
Table 3: Board Structure - Development over time
Board Size
Average Age
CEO member of the board (%)
Gender Diversity (%)
2000 7.96 54.39 89.00 4.00 2001 7.70 52.75 81.00 6.00 2002 7.49 52.71 78.00 7.00 2003 7.44 53.31 73.00 7.00 2004 7.52 53.55 66.00 11.00 2005 7.44 53.52 59.00 14.00 Total average 7.56 53.31 73.00 9.00 Note: a) The table shows average values for each year. b) Table A1 presents more detailed descriptive statistics (mean, median, max and min values and standard deviation) for each variable. Gender diversity denotes share of female board of directors.
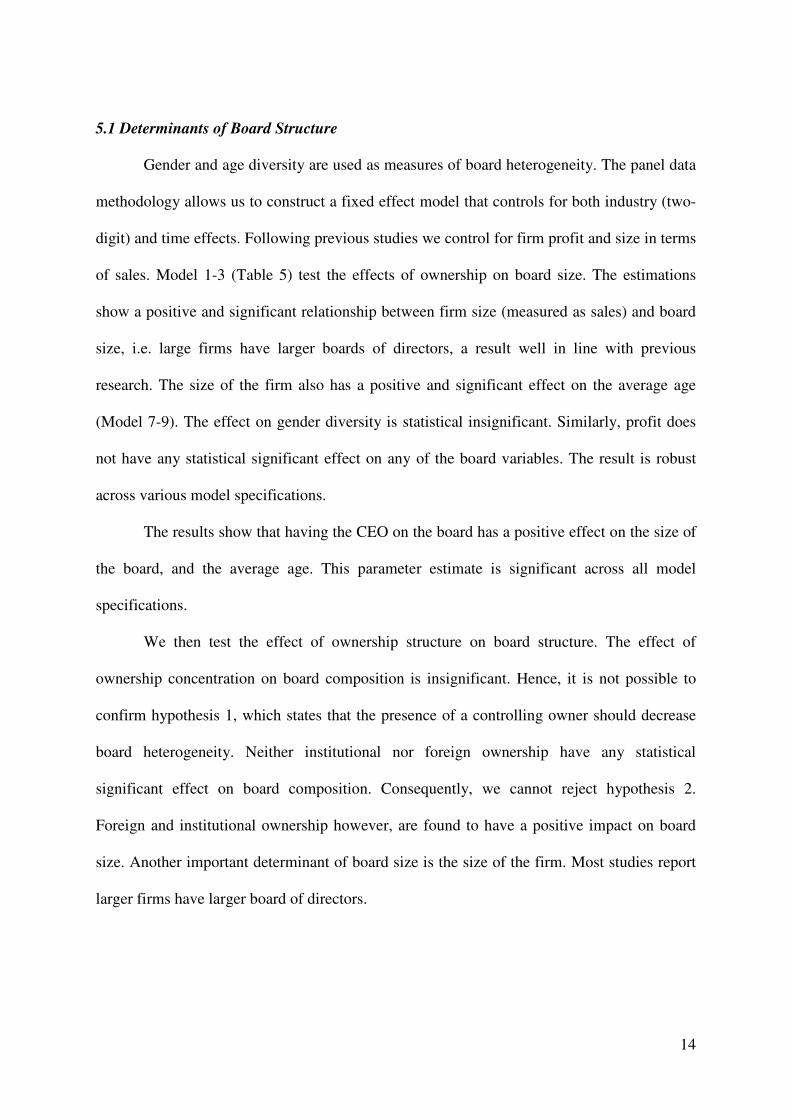
5. Empirical Analysis
The empirical analysis is divided into two parts; first the determinants of board
structure and the relationship between ownership structure and board composition are
investigated (section 5.1). Ownership structure is measured as ownership concentration with
respect to the largest owner and foreign and institutional ownership. The second step is to
analyse the relationship between board structure and firms’ investment performance (Section
5.2). We use both marginal and Tobin’s q to estimate the effects of board structure on
investment performance. Table 4 summaries the hypothesis and expected effect on
performance.
Table 4: Hypothesis and Expected Effects
Hypothesis: Expected effects on boards:
H1: Ownership concentration Homogenous Boards H2: Institutional and Foreign Owner Heterogeneous Boards Expected effect on investment performance: H3: Board Size Negative H4: Board Diversity Ambiguous
14
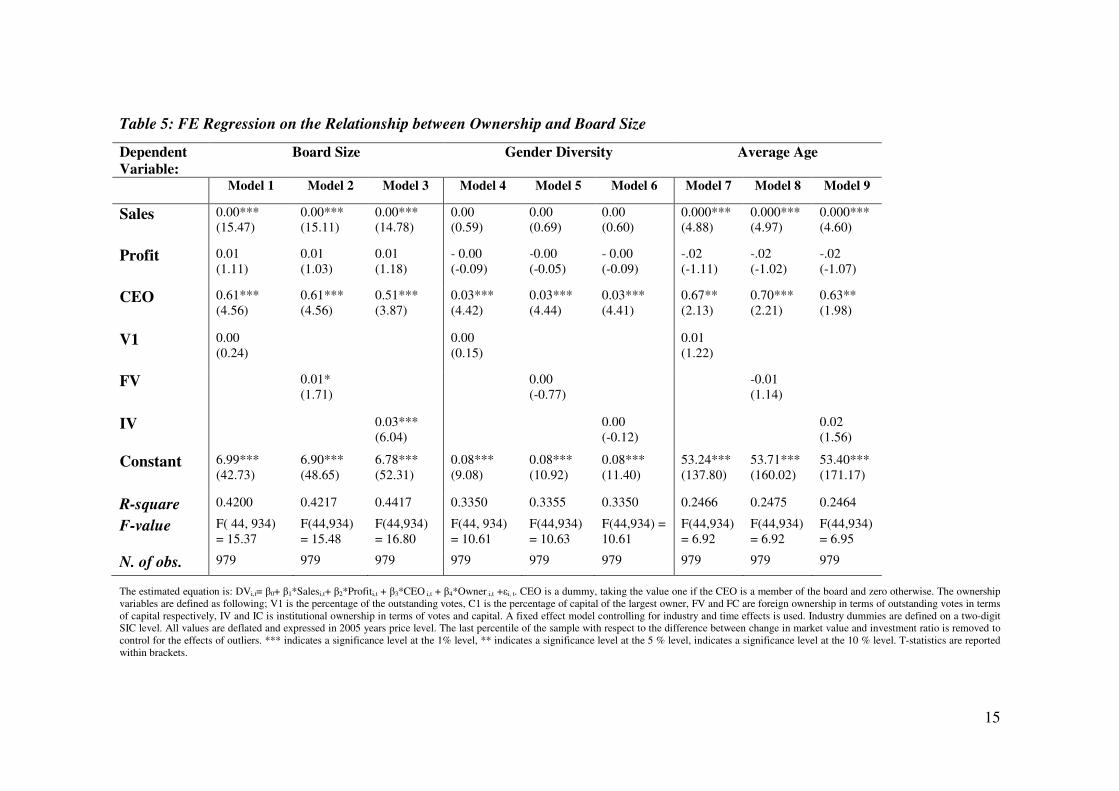
5.1 Determinants of Board Structure
Gender and age diversity are used as measures of board heterogeneity. The panel data
methodology allows us to construct a fixed effect model that controls for both industry (two-
digit) and time effects. Following previous studies we control for firm profit and size in terms
of sales. Model 1-3 (Table 5) test the effects of ownership on board size. The estimations
show a positive and significant relationship between firm size (measured as sales) and board
size, i.e. large firms have larger boards of directors, a result well in line with previous
research. The size of the firm also has a positive and significant effect on the average age
(Model 7-9). The effect on gender diversity is statistical insignificant. Similarly, profit does
not have any statistical significant effect on any of the board variables. The result is robust
across various model specifications.
The results show that having the CEO on the board has a positive effect on the size of
the board, and the average age. This parameter estimate is significant across all model
specifications.
We then test the effect of ownership structure on board structure. The effect of
ownership concentration on board composition is insignificant. Hence, it is not possible to
confirm hypothesis 1, which states that the presence of a controlling owner should decrease
board heterogeneity. Neither institutional nor foreign ownership have any statistical
significant effect on board composition. Consequently, we cannot reject hypothesis 2.
Foreign and institutional ownership however, are found to have a positive impact on board
size. Another important determinant of board size is the size of the firm. Most studies report
larger firms have larger board of directors.
15
Table 5: FE Regression on the Relationship between Ownership and Board Size
The estimated equation is: DVi,t= β0+ β1*Salesi,t+ β2*Profiti,t + β3*CEO i,t + β4*Owner i,t +εi, t. CEO is a dummy, taking the value one if the CEO is a member of the board and zero otherwise. The ownership variables are defined as following; V1 is the percentage of the outstanding votes, C1 is the percentage of capital of the largest owner, FV and FC are foreign ownership in terms of outstanding votes in terms of capital respectively, IV and IC is institutional ownership in terms of votes and capital. A fixed effect model controlling for industry and time effects is used. Industry dummies are defined on a two-digit SIC level. All values are deflated and expressed in 2005 years price level. The last percentile of the sample with respect to the difference between change in market value and investment ratio is removed to control for the effects of outliers. *** indicates a significance level at the 1% level, ** indicates a significance level at the 5 % level, indicates a significance level at the 10 % level. T-statistics are reported within brackets.
Dependent
Variable: Board Size Gender Diversity
Average Age
Model 1 Model 2 Model 3 Model 4 Model 5 Model 6 Model 7 Model 8 Model 9
Sales 0.00*** (15.47)
0.00*** (15.11)
0.00*** (14.78)
0.00 (0.59)
0.00 (0.69)
0.00 (0.60)
0.000*** (4.88)
0.000*** (4.97)
0.000*** (4.60)
Profit 0.01 (1.11)
0.01 (1.03)
0.01 (1.18)
- 0.00 (-0.09)
-0.00 (-0.05)
- 0.00 (-0.09)
-.02 (-1.11)
-.02 (-1.02)
-.02 (-1.07)
CEO 0.61*** (4.56)
0.61*** (4.56)
0.51*** (3.87)
0.03*** (4.42)
0.03*** (4.44)
0.03*** (4.41)
0.67** (2.13)
0.70*** (2.21)
0.63** (1.98)
V1 0.00 (0.24)
0.00 (0.15)
0.01 (1.22)
FV 0.01* (1.71)
0.00 (-0.77)
-0.01 (1.14)
IV 0.03*** (6.04)
0.00 (-0.12)
0.02 (1.56)
Constant 6.99*** (42.73)
6.90*** (48.65)
6.78*** (52.31)
0.08*** (9.08)
0.08*** (10.92)
0.08*** (11.40)
53.24*** (137.80)
53.71*** (160.02)
53.40*** (171.17)
R-square 0.4200 0.4217 0.4417 0.3350 0.3355 0.3350 0.2466 0.2475 0.2464
F-value F( 44, 934) = 15.37
F(44,934) = 15.48
F(44,934) = 16.80
F(44, 934) = 10.61
F(44,934) = 10.63
F(44,934) = 10.61
F(44,934) = 6.92
F(44,934) = 6.92
F(44,934) = 6.95
N. of obs. 979 979 979 979 979 979 979 979 979
16
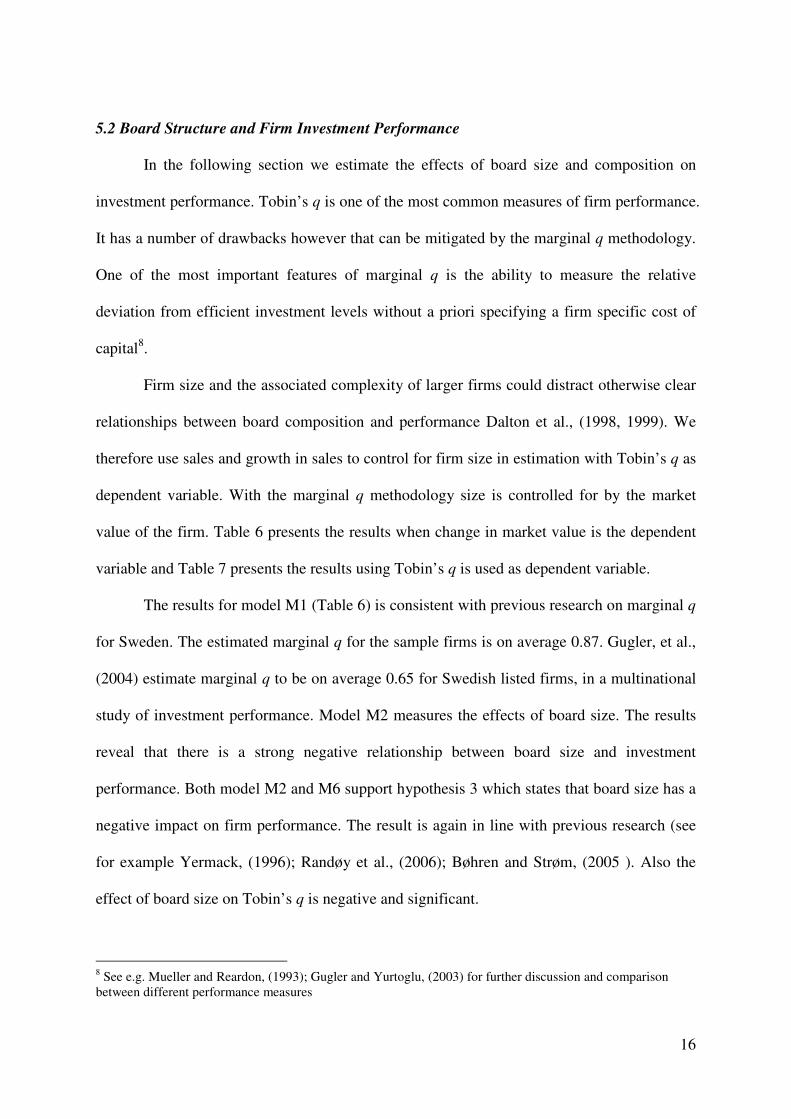
5.2 Board Structure and Firm Investment Performance
In the following section we estimate the effects of board size and composition on
investment performance. Tobin’s q is one of the most common measures of firm performance.
It has a number of drawbacks however that can be mitigated by the marginal q methodology.
One of the most important features of marginal q is the ability to measure the relative
deviation from efficient investment levels without a priori specifying a firm specific cost of
capital8.
Firm size and the associated complexity of larger firms could distract otherwise clear
relationships between board composition and performance Dalton et al., (1998, 1999). We
therefore use sales and growth in sales to control for firm size in estimation with Tobin’s q as
dependent variable. With the marginal q methodology size is controlled for by the market
value of the firm. Table 6 presents the results when change in market value is the dependent
variable and Table 7 presents the results using Tobin’s q is used as dependent variable.
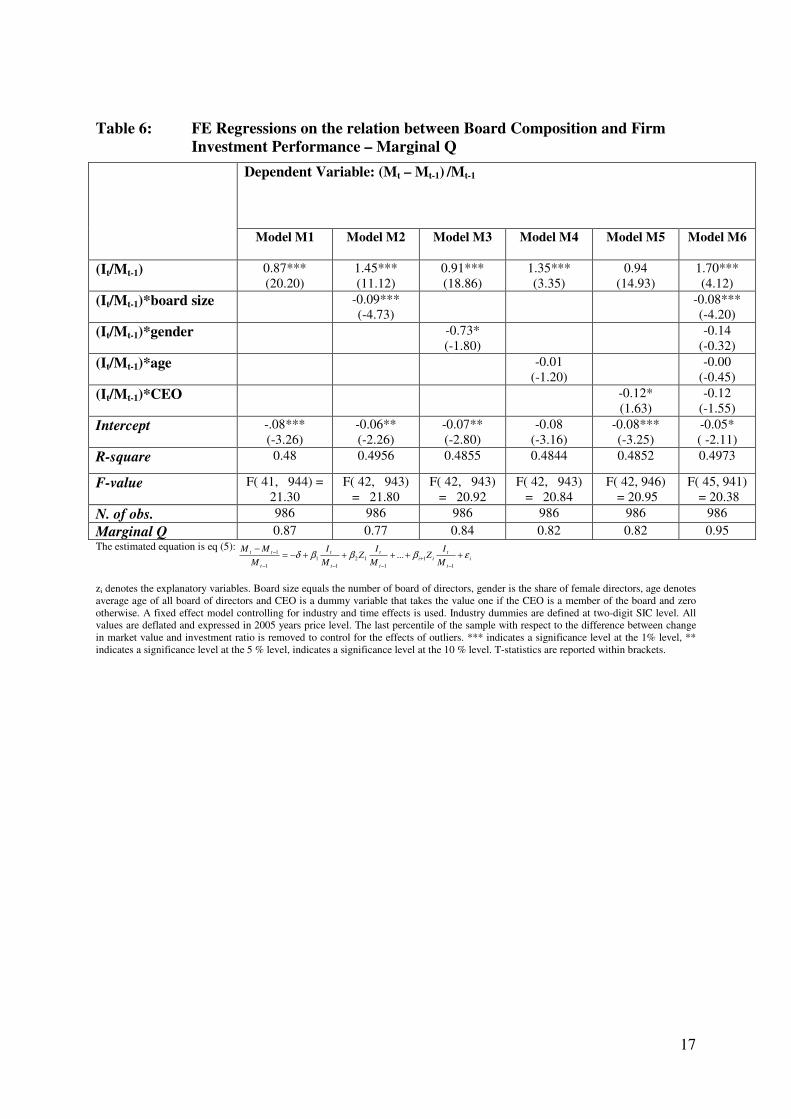
The results for model M1 (Table 6) is consistent with previous research on marginal q
for Sweden. The estimated marginal q for the sample firms is on average 0.87. Gugler, et al.,
(2004) estimate marginal q to be on average 0.65 for Swedish listed firms, in a multinational
study of investment performance. Model M2 measures the effects of board size. The results
reveal that there is a strong negative relationship between board size and investment
performance. Both model M2 and M6 support hypothesis 3 which states that board size has a
negative impact on firm performance. The result is again in line with previous research (see
for example Yermack, (1996); Randøy et al., (2006); Bøhren and Strøm, (2005 ). Also the
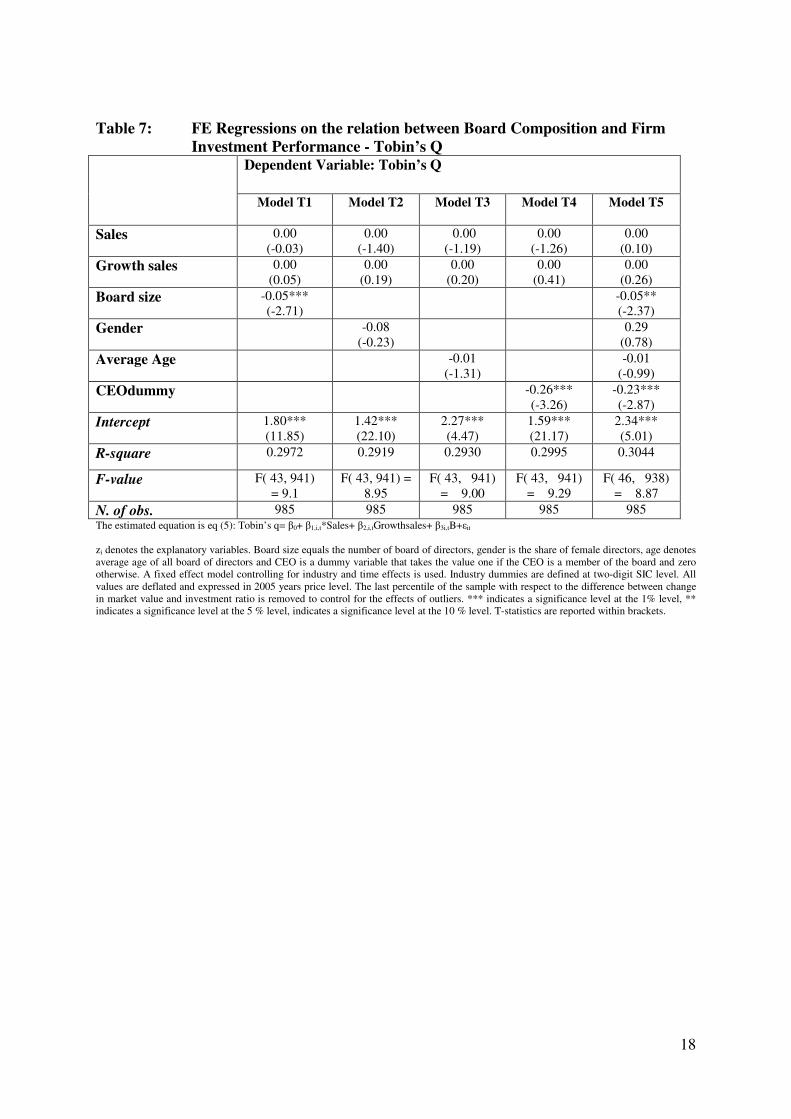
effect of board size on Tobin’s q is negative and significant.
8 See e.g. Mueller and Reardon, (1993); Gugler and Yurtoglu, (2003) for further discussion and comparison between different performance measures
17
Table 6: FE Regressions on the relation between Board Composition and Firm
Investment Performance – Marginal Q
The estimated equation is eq (5): i
t
t
ii
t
t
t
t
t
tt
M
IZ
M
IZ
M
I
M
MMεβββδ +++++−=
−
−
+
−−−
−
1
1
1
12
1
1
1
1 ...
zi denotes the explanatory variables. Board size equals the number of board of directors, gender is the share of female directors, age denotes average age of all board of directors and CEO is a dummy variable that takes the value one if the CEO is a member of the board and zero otherwise. A fixed effect model controlling for industry and time effects is used. Industry dummies are defined at two-digit SIC level. All values are deflated and expressed in 2005 years price level. The last percentile of the sample with respect to the difference between change in market value and investment ratio is removed to control for the effects of outliers. *** indicates a significance level at the 1% level, ** indicates a significance level at the 5 % level, indicates a significance level at the 10 % level. T-statistics are reported within brackets.
Dependent Variable: (Mt – Mt-1) /Mt-1
Model M1 Model M2 Model M3 Model M4 Model M5 Model M6
(It/Mt-1) 0.87*** (20.20)
1.45*** (11.12)
0.91*** (18.86)
1.35*** (3.35)
0.94 (14.93)
1.70*** (4.12)
(It/Mt-1)*board size -0.09*** (-4.73)
-0.08*** (-4.20)
(It/Mt-1)*gender -0.73* (-1.80)
-0.14 (-0.32)
(It/Mt-1)*age -0.01 (-1.20)
-0.00 (-0.45)
(It/Mt-1)*CEO -0.12* (1.63)
-0.12 (-1.55)
Intercept -.08*** (-3.26)
-0.06** (-2.26)
-0.07** (-2.80)
-0.08 (-3.16)
-0.08*** (-3.25)
-0.05* ( -2.11)
R-square 0.48 0.4956 0.4855 0.4844 0.4852 0.4973
F-value F( 41, 944) = 21.30
F( 42, 943) = 21.80
F( 42, 943) = 20.92
F( 42, 943) = 20.84
F( 42, 946) = 20.95
F( 45, 941) = 20.38
N. of obs. 986 986 986 986 986 986
Marginal Q 0.87 0.77 0.84 0.82 0.82 0.95
18
Table 7: FE Regressions on the relation between Board Composition and Firm
Investment Performance - Tobin’s Q
Dependent Variable: Tobin’s Q
Model T1 Model T2 Model T3 Model T4 Model T5
Sales 0.00 (-0.03)
0.00 (-1.40)
0.00 (-1.19)
0.00 (-1.26)
0.00 (0.10)
Growth sales 0.00 (0.05)
0.00 (0.19)
0.00 (0.20)
0.00 (0.41)
0.00 (0.26)
Board size -0.05*** (-2.71)
-0.05** (-2.37)
Gender -0.08 (-0.23)
0.29 (0.78)
Average Age -0.01 (-1.31)
-0.01 (-0.99)
CEOdummy -0.26*** (-3.26)
-0.23*** (-2.87)
Intercept 1.80*** (11.85)
1.42*** (22.10)
2.27*** (4.47)
1.59*** (21.17)
2.34*** (5.01)
R-square 0.2972 0.2919 0.2930 0.2995 0.3044
F-value F( 43, 941) = 9.1
F( 43, 941) = 8.95
F( 43, 941) = 9.00
F( 43, 941) = 9.29
F( 46, 938) = 8.87
N. of obs. 985 985 985 985 985 The estimated equation is eq (5): Tobin’s q= β0+ β1,i,t*Sales+ β2,i,tGrowthsales+ β3i,tB+εit
zi denotes the explanatory variables. Board size equals the number of board of directors, gender is the share of female directors, age denotes average age of all board of directors and CEO is a dummy variable that takes the value one if the CEO is a member of the board and zero otherwise. A fixed effect model controlling for industry and time effects is used. Industry dummies are defined at two-digit SIC level. All values are deflated and expressed in 2005 years price level. The last percentile of the sample with respect to the difference between change in market value and investment ratio is removed to control for the effects of outliers. *** indicates a significance level at the 1% level, ** indicates a significance level at the 5 % level, indicates a significance level at the 10 % level. T-statistics are reported within brackets.
19
To test hypothesis 4, we incorporate board diversity, age and gender diversity, into the
model. Model M3 shows that gender diversity has a negative and significant effect on firm
investment performance. The change in marginal q, from 0.87 to 0.84 is however negligible.
Also, the effect of gender diversity loses significance in the model including all board
characteristics (model M6). The effect of gender diversity on Tobin’s q is insignificant
(model T2 and T5; Table 7). Age diversity is also found to have no significant effect on firm
performance. This result is robust with respect to performance measure.
CEO as a member of the board of directors is negative and significant both in terms of
marginal q and Tobin’s q. Marginal q decreases from 0.87 to 0.82 for these firms. The effect
vanishes in the full model (M6) however. The negative and significant effect of CEO as a
director remains significant even when more variables are included in the model (model T4
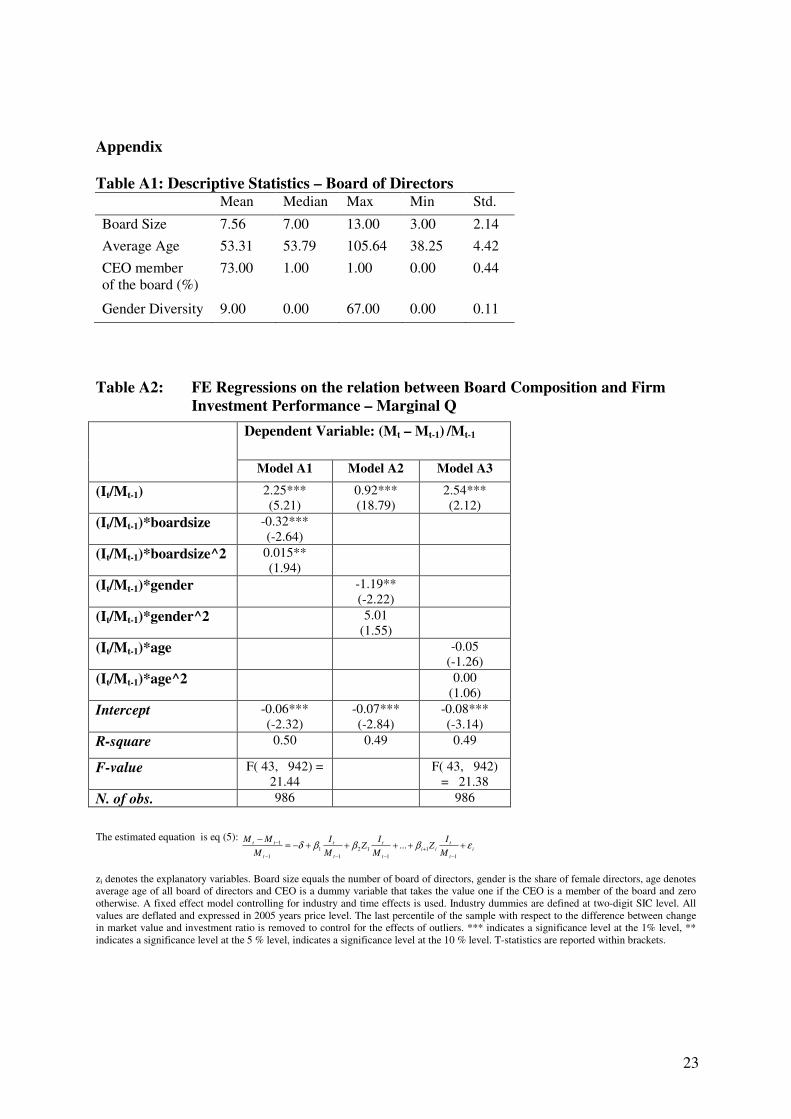
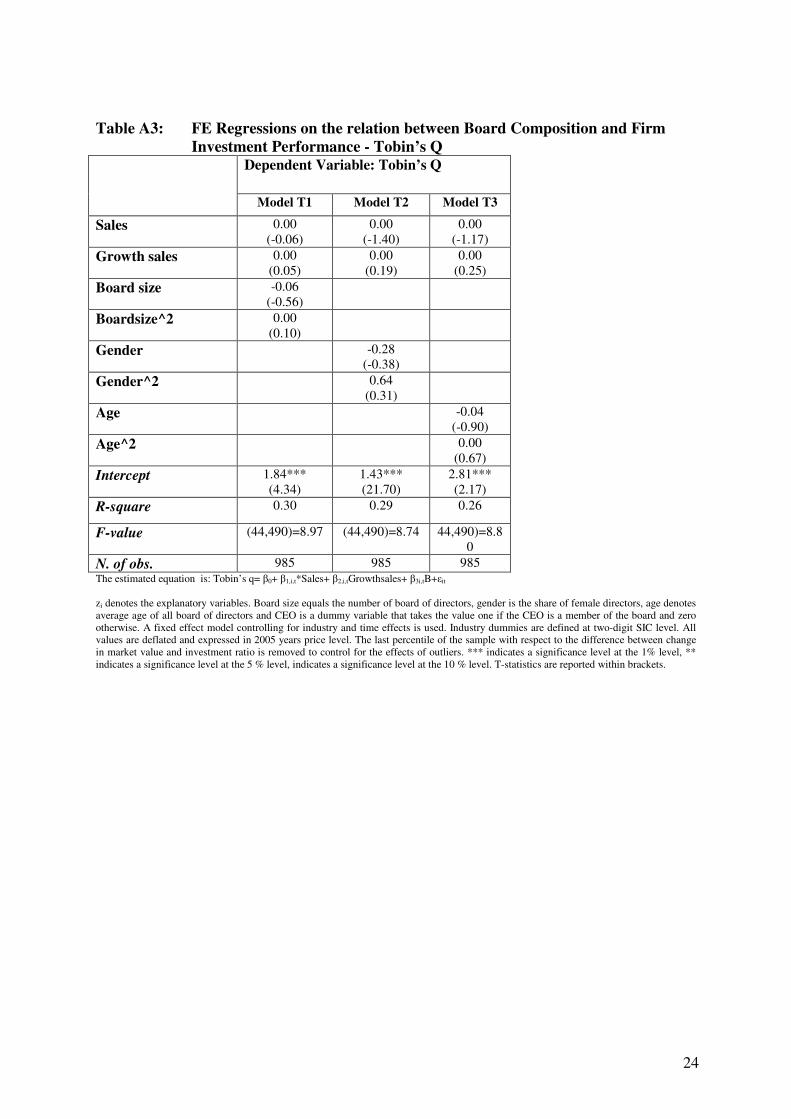
and T5, Table 7). We have also checked for non-linearity among the explanatory variables
(see appendix table A2 and A3). Only the variable board size in the marginal q model shows
a significant non-linear behavior.
To sum up, the analysis shows that, independently of choice of performance measure,
board size affect investment performance negatively. The estimated coefficient of gender
diversity is negative and significant, although the economic impact on marginal q is small.
Also, the effect of gender diversity loses significance when estimating the full model of
marginal q. The results are in line with Randøy et al., (2006) who show that board diversity
only affect firm performance if diversity leads to larger boards.
20
6. Conclusion
This paper examines the determinants of board structure as well as the effects of board
heterogeneity on investment performance. Due to the lack of a coherent theoretical
framework the majority of the research on board of directors is empirically driven. This study
adds to the literature by using a more accurate measure of firm performance, the marginal q.
Unlike most other studies on board of directors, we use a panel data approach which covers
188 firms during the time period 1999-2005.
The descriptive statistics show that over the last five years there has been a sharp
decrease in the number of firms having the CEO on the board of directors. This can be
interpreted as a sign of increased independency. Furthermore, the share of female directors
has, increased from 4 to 14 percent.
The empirical analysis shows that ownership concentration does not affect board size
or board composition. There is however, a positive relationship between institutional and
foreign ownership and board size. Furthermore, having the CEO as a member of the board
increases the size of the board as well as the gender diversity and average age.
In line with previous research we find that board size has a strong and negative effect
on firm performance. When estimated separately having the CEO as a member of the board
has a negative impact on the firm’s investment performance (both measured as change in
market value and with Tobin’s q). The estimate of gender diversity is also significant and
negative when estimated separately with the marginal q methodology. It is, however, not
robust to other specifications of the model or with respect to the Tobin’s q methodology.
21
References
BILIMORIA, D. and WHEELER, J. V. (2000). 'Women Corporate Directors: Current
Research and Future Directions', in DAVIDSON M J and BURKE R J (eds.), Women
in Management: Current Research Issues, . Paul Chapman Publishers, London, pp. 138-163.
BJUGGREN, P.-O., EKLUND, J. and WIBERG, D. (2007). 'Ownership structure, control and firm performance: the effects of vote differentiated shares', Applied Financial
Economics, Vol. 17, pp. 1323-1334. BØHREN, Ø. and STRØM, R. Ø. (2005 ). The value creating board: theory and evidence BI
Norwegian School of Management. Department of Financial Economics, Oslo. CARTER, D. A., SIMKINS, B. J. and SIMPSON, W. G. (2003). 'Corporate Governance,
Board Diversity and Firm Value', The Financial Review, Vol. 38, pp. 33-53. DALTON, D. R., DAILY, C. M., ELLSTRAND, A. E. and JOHNSON, J. L. (1998). 'Meta-
analytic reviews of board composition, leadership structure and financial performance ', Strategic Management Journal, Vol. 19, pp. 269-290.
DALTON, D. R., DAILY, C. M., JOHNSON, J. L. and ELLSTRAND, A. E. (1999). 'Number of directors and financial performance ', The Academy of Management
Journal, Vol. 42 pp. 674-686. FAMA, E. F. and JENSEN, M. (1983). 'Separation of ownership and control ', Journal of law
and economics, Vol. 26, pp. 301-326. GROSWOLD, J., BRAMMER, S. and RAYTON, B. A. (2007). 'Board Diversity in the
United Kingdom and Norway: An Exploratory Analysis ', Business Ethics: A
European Review, Vol. 16, pp. 344-357. GUGLER, K., MUELLER, D. C. and YURTOGLU, B. B. (2004). 'Corporate Governance
and the Returns on Investment', The Journal of Law and Economics, Vol. 47, pp. 589-633.
GUGLER, K. and YURTOGLU, B. B. (2003). 'Average q, marginal q, and the relation between ownership and performance', Economics Letters, Vol. 78, pp. 379-384.
HERMALIN, B. H. and WEISBACH, M. S. (2003). 'Boards of Directors as an Endogenously Determined Institution: A Survey of the Economic Literature', Economic Policy Review –Federal Reserve Bank of New York, Vol. 9, pp. 7-26.
JENSEN, M. (1993). 'Modern Industrial Revolution, Exit, and the Failure of Internal Control Systems', Journal of Finance, Vol. 48, pp. 831-865.
LINCK, J. S., NETTER, M. J. and YANG, T. (2008). 'The determinants of board structure ', Journal of Financial Economics, Vol. 87, pp. 308-328.
MUELLER, D. and REARDON (1993). 'Rates of Return on Corporate Investment', Southern Economic Journal, Vol. 60, pp. 430-453.
RAHEJA, C. G. (2005). 'Determinants for Board Size and Composition: A theory of corporate boards', Journal of Financial and Quantitative Analysis, Vol. 40, pp. 283-306.
RANDØY, T., THOMSEN, S. and OXELHEIM, L. (2006). A Nordic perspective on corporate board diversity. Report.
ROSE, C. (2007). 'Does Female Board Representation Influence Firm Performance? The Danish Evidence', Corporate Governance, Vol. 15, pp. 404-413.
22
SMITH, N., SMITH, V. and VERNER, M. (2006). 'Do Women in Top Management Affect Firm Performance? A Panel Study of 2500 Danish Firms', International Journal of Productivity and Performance Management, Vol. 55, pp. 569-593.
SÖDERSTRÖM TSON, H., BERGLÖF, E., HOLMSTRÖM, B., HÖGFELDT, P. and MEYERSSON, M., EVA M. (2003) Ägarmakt och Omvandling Den svenska modellen utmanad, SNS Förlag, Kristianstad.
VAN DER WALT, N. and INGLEY, C. (2003). 'Board dynamics and the influence of professional background, gender and ethnic diversity of directors', Corporate Governance, Vol. 11, pp. 218-234.
WIBERG, D. (2008). 'Institutional Ownership – The Anonymous Capital', JIBS Dissertation Series, No. 48. Jönköping International Business School
VILLALONGA, B. and AMIT, R. (2006). 'How do family ownership, control and management affect firm value?', Journal of Financial Economics, Vol. 80, pp. 385-417.
YERMACK, D. (1996). 'Higher Market Valuation of Companies with a Small Board of Directors', Journal of Financial Economics, Vol. 40, pp. 185-211.
23
Appendix
Table A1: Descriptive Statistics – Board of Directors Mean Median Max Min Std.
Board Size 7.56 7.00 13.00 3.00 2.14
Average Age 53.31 53.79 105.64 38.25 4.42
CEO member of the board (%)
73.00 1.00 1.00 0.00 0.44
Gender Diversity 9.00 0.00 67.00 0.00 0.11
Table A2: FE Regressions on the relation between Board Composition and Firm
Investment Performance – Marginal Q
The estimated equation is eq (5): i
t
t
ii
t
t
t
t
t
tt
M
IZ
M
IZ
M
I
M
MMεβββδ +++++−=
−
−
+
−−−
−
1
1
1
12
1
1
1
1 ...
zi denotes the explanatory variables. Board size equals the number of board of directors, gender is the share of female directors, age denotes average age of all board of directors and CEO is a dummy variable that takes the value one if the CEO is a member of the board and zero otherwise. A fixed effect model controlling for industry and time effects is used. Industry dummies are defined at two-digit SIC level. All values are deflated and expressed in 2005 years price level. The last percentile of the sample with respect to the difference between change in market value and investment ratio is removed to control for the effects of outliers. *** indicates a significance level at the 1% level, ** indicates a significance level at the 5 % level, indicates a significance level at the 10 % level. T-statistics are reported within brackets.
Dependent Variable: (Mt – Mt-1) /Mt-1
Model A1 Model A2 Model A3
(It/Mt-1) 2.25*** (5.21)
0.92*** (18.79)
2.54*** (2.12)
(It/Mt-1)*boardsize -0.32*** (-2.64)
(It/Mt-1)*boardsize^2 0.015** (1.94)
(It/Mt-1)*gender -1.19** (-2.22)
(It/Mt-1)*gender^2 5.01 (1.55)
(It/Mt-1)*age -0.05 (-1.26)
(It/Mt-1)*age^2 0.00 (1.06)
Intercept -0.06*** (-2.32)
-0.07*** (-2.84)
-0.08*** (-3.14)
R-square 0.50 0.49 0.49
F-value F( 43, 942) = 21.44
F( 43, 942) = 21.38
N. of obs. 986 986
24
Table A3: FE Regressions on the relation between Board Composition and Firm
Investment Performance - Tobin’s Q
Dependent Variable: Tobin’s Q
Model T1 Model T2 Model T3
Sales 0.00 (-0.06)
0.00 (-1.40)
0.00 (-1.17)
Growth sales 0.00 (0.05)
0.00 (0.19)
0.00 (0.25)
Board size -0.06 (-0.56)
Boardsize^2 0.00 (0.10)
Gender -0.28 (-0.38)
Gender^2 0.64 (0.31)
Age -0.04 (-0.90)
Age^2 0.00 (0.67)
Intercept 1.84*** (4.34)
1.43*** (21.70)
2.81*** (2.17)
R-square 0.30 0.29 0.26
F-value (44,490)=8.97 (44,490)=8.74 44,490)=8.80
N. of obs. 985 985 985 The estimated equation is: Tobin’s q= β0+ β1,i,t*Sales+ β2,i,tGrowthsales+ β3i,tB+εit
zi denotes the explanatory variables. Board size equals the number of board of directors, gender is the share of female directors, age denotes average age of all board of directors and CEO is a dummy variable that takes the value one if the CEO is a member of the board and zero otherwise. A fixed effect model controlling for industry and time effects is used. Industry dummies are defined at two-digit SIC level. All values are deflated and expressed in 2005 years price level. The last percentile of the sample with respect to the difference between change in market value and investment ratio is removed to control for the effects of outliers. *** indicates a significance level at the 1% level, ** indicates a significance level at the 5 % level, indicates a significance level at the 10 % level. T-statistics are reported within brackets.