Embed Size (px)
Citation preview
Permission to make digital or hard copies of all or part of this work for personal or classroom use is granted without fee provided that copies are not made or distributed for profit or commercial advantage and that copies bear this notice and the full citation on the first page. To copy otherwise, or republish, to post on servers or to redistribute to lists, requires prior specific permission and/or a fee.
Ownership Structure and Tax Avoidance: An empirical analysis
of listed Indonesian mining companies
Master Thesis
Author
Mandana Hohmann
Supervisors
Prof. Dr. R. Kabir
Dr. X. Huang
Faculty
Behavioural, Management, and Social
Sciences
Master
Business Administration
Financial Management
University of Twente
March, 2021
ABSTRACT
Indonesia's mining industry substantially contributes to the nation's GDP, revenue, export and
employment. However, the country experiences illicit financial flows partly caused by tax
avoidance of mining firms, leading to less available funds for other investments. Tax avoidance
does not occur without the knowledge of specific firm parties, such as controlling owners. The
thesis therefore empirically investigates the impact of ownership structure on tax avoidance of
listed Indonesian mining firms. The unit of analysis is 34 mining firms listed in the Indonesian
stock exchange (IDX) from 2004 to 2018. Since tax avoidance cannot be measured directly, this
thesis uses cash effective tax rate, effective tax rate and profit before tax as proxies for tax
avoidance. The independent variables are the following ownership types: family, state, domestic
corporate, domestic institutional, and foreign. Regression results, explaining the variation in tax
avoidance between firms and between years, show that ownership type has a significant effect on
the proxies regarding tax avoidance. By this, this thesis finds that ownership types domestic
institutional and foreign positively influence tax avoidance, while family, state and domestic
corporate ownership show a negative effect. Ownership structure is shown to be an important
tax-avoidance contributing factor. These findings could benefit government policies aiming to
reduce illicit financial flows and to improve the social welfare with tax revenue, especially in
emerging countries such as Indonesia.
Keywords: ownership structure, tax avoidance, profit before tax, effective tax rate, cash effective
tax rate, two-way error component model, first-difference, Indonesia

ACKNOWLEDGEMENTS
With the finalisation of my Master thesis I am also finalising my time and experiences as a student
at the University of Twente. Next to many new and amazing friends and colleagues, I also got to
know many different kind of teachers, professors and people. Some of those I really hope to see
soon again. To my wonderful study advisors Ms. Röring and Ms. Spuls, thank you for your help
and advices during my Bachelor and Master and the support you constantly give to so many
students. It was clear that this work is not just any kind of work to you. You do it with much
kindness and warmth and for that everyone.
I would also like to express my appreciation to my supervisors dr. Huang and Prof. dr. Kabir from
the department of Finance and Accounting. Thank you dr. Huang for your valuable feedback,
suggestions and time. It is not easy to be able to guide so many students with the current hard
working conditions caused by the COVID-19 pandemic. And yet you are available if needed and
gave me good guidance. Much credit and appreciation goes to Prof. dr. Kabir. I am very lucky that
I had him as my first supervisor. I appreciate his comments, suggestions and qualitative feedback.
I was able to fully work independently and direct my own study, while he emphasized the
important and critical aspects and made sure that the direction is going well. As a Chair Of
Corporate Finance And Risk Management not much time is left to be able to supervise students
and yet, one was able to contact or meet him whenever needed and to get good guidance. I learned
a lot about research and writing such a thesis. Also he gave me the opportunity to study abroad at
a partner University in Surakarta, Indonesia. Thank you.
Finally, I would like to show my gratitude towards my dearest family and friends. My mother,
who is always there for me. And of course my dear brothers, who make the day just so much more
meaningful and who motivated me during my thesis. To my dear friends, who always kept me
encouraged and gave me much energy to finish my studies. Positive and lovely people around you
make you push through anything and accomplish big things and I am grateful to have them in my
life. Especially I want to thank my dearest Oskar. Oskar you helped me out so much, not only
during my thesis but throughout those years. Without you, all that would have been much less fun
and exciting. I learned so much from you for my thesis, especially regarding research in general. I
am lucky to have you. I also thank your lovely family for just being there for me and their kindness.
Content
1 INTRODUCTION .................................................................................................................. 1
1.1 Background ...................................................................................................................... 1 1.2 Research Objective and Contribution .............................................................................. 3 1.3 Thesis Outline .................................................................................................................. 5
2 LITERATURE REVIEW AND HYPOTHESIS FORMULATION ....................................... 6
2.1 The Spectrum of Tax Avoidance ..................................................................................... 6
2.1.1 Tax Avoidance .......................................................................................................... 6
2.2 Ownership Structure of Firms ........................................................................................ 12
2.2.1 Theory on Ownership Structure - Tax Avoidance Relationship ............................. 13
2.3 Institutional Environment ............................................................................................... 18
2.3.1 Country ................................................................................................................... 18 2.3.2 Economy ................................................................................................................. 18
2.3.3 Poverty .................................................................................................................... 19 2.3.4 Environment ............................................................................................................ 19 2.3.5 Corruption ............................................................................................................... 20
2.3.6 Investments and Tax Regulation ............................................................................. 21 2.3.7 Mining Industry ...................................................................................................... 22
2.3.8 Illicit Financial Flows ............................................................................................. 24
2.4 Hypotheses Development ............................................................................................... 25
2.4.1 Family Ownership ................................................................................................... 25
2.4.2 State Ownership ...................................................................................................... 26 2.4.3 Domestic Ownership ............................................................................................... 29 2.4.4 Domestic Corporate Ownership .............................................................................. 29
2.4.5 Domestic Institutional Ownership .......................................................................... 31
2.4.6 Foreign Ownership.................................................................................................. 33
2.5 Conceptual Model .......................................................................................................... 35
3 RESEARCH METHODOLOGY .......................................................................................... 36
3.1 Methodology .................................................................................................................. 36
3.1.1 Methods Used in Prior Studies ............................................................................... 36 3.1.2 Method of Current Study ........................................................................................ 41
3.2 Variable Measurement and Definitions.......................................................................... 43
3.2.1 Dependent Variables ............................................................................................... 43 3.2.2 Independent Variables ............................................................................................ 45
4 DATA .................................................................................................................................... 53 5 REGRESSION RESULTS .................................................................................................... 56
5.1 Regression Diagnosis ..................................................................................................... 56 5.2 Descriptive Statistics ...................................................................................................... 58
5.3 Correlation ...................................................................................................................... 60
5.4 Results ............................................................................................................................ 65
5.4.1 Regression Results of Family Ownerships Effect on Tax Avoidance .................... 66 5.4.2 Regression Results of State Ownerships Effect on Tax Avoidance ....................... 67 5.4.3 Regression Results of Domestic Corporate Ownerships Effect on Tax Avoidance 67 5.4.4 Regression Results of Domestic Institutional Ownerships Effect on Tax Avoidance
68
5.4.5 Regression Results of Foreign Ownerships Effect on Tax Avoidance ................... 69 5.4.6 Regression Results of Public Ownerships Effect on Tax Avoidance ..................... 70 5.4.7 Regression Results of Control Variables Effect on Tax Avoidance ....................... 70 5.4.8 Regression Analysis with First-Difference ............................................................. 76
6 Conclusion ............................................................................................................................. 81
6.1 Conclusion and Discussion ............................................................................................ 81 6.2 Limitation and Further Research .................................................................................... 84
7 REFERENCES ...................................................................................................................... 86
8 APPENDICES ....................................................................................................................... 96
8.1 Appendix A: Shapiro-Wilk Test of Normal Distribution .............................................. 96 8.2 Appendix B: VIF Values ............................................................................................... 97
8.2.1 ....................................................................................................................................... 97
8.3 Appendix C: Regression Analysis with RE/ FE on ETR and PBT ................................ 99 8.4 Appendix D: Complete Tables First-Difference Regression Results........................... 107
8.5 Appendix E: Comparison between RE/ FE and FD ..................................................... 116
8.6 Appendix F: Thesis’s Journals and Impact Factors ..................................................... 118
1
1 INTRODUCTION
This research thesis studies the relationship between ownership structure and tax avoidance. In order to
gain an understanding of the imperative of this relationship, this chapter starts with background
information on the subject’s ownership structure and tax avoidance (Section 1.1). Next, the thesis’s
objectives and contribution are given (Section 1.2) followed by the thesis’s outline (Section 1.3).
1.1 Background
‘Taxes, after all, are dues that we pay for the privileges of membership in an organized society.’ – Franklin
D. Roosevelt
Roosevelt has a crucial point. Tax payments should be seen as not only the individuals’ duty to contribute
to the societal privileges, corporations as well should not be economic free riders and enjoy the society
and citizenship without the responsibility and costs individuals have to face. Also, they should consider
tax payments as a corporate social responsibility in order to enable an organized society and be part of it.
Whereas one might think that the director of the firm has most of the responsibilities and decision-
making power, decisions regarding the firm’s strategies such as tax management strategy and goals are
not only determined by them. Also the board, managers and controlling shareholders play a part in that.
While the manager is responsible for the firm’s resource allocation (Minnick & Noga, 2010) and financial
reporting, the board monitors the actions and has an oversight on the manager’s actions (Chan et al., 2013).
Controlling shareholders check and count on the financial reports, in order to make decisions1. Tax
reporting and decisions mentioned in the reports cannot be overlooked by them. Thus, tax management
and tax avoidance, which is the term for legally avoiding tax payments (Hope et al, 2013), do not happen
without the knowledge and engagement of those parties.
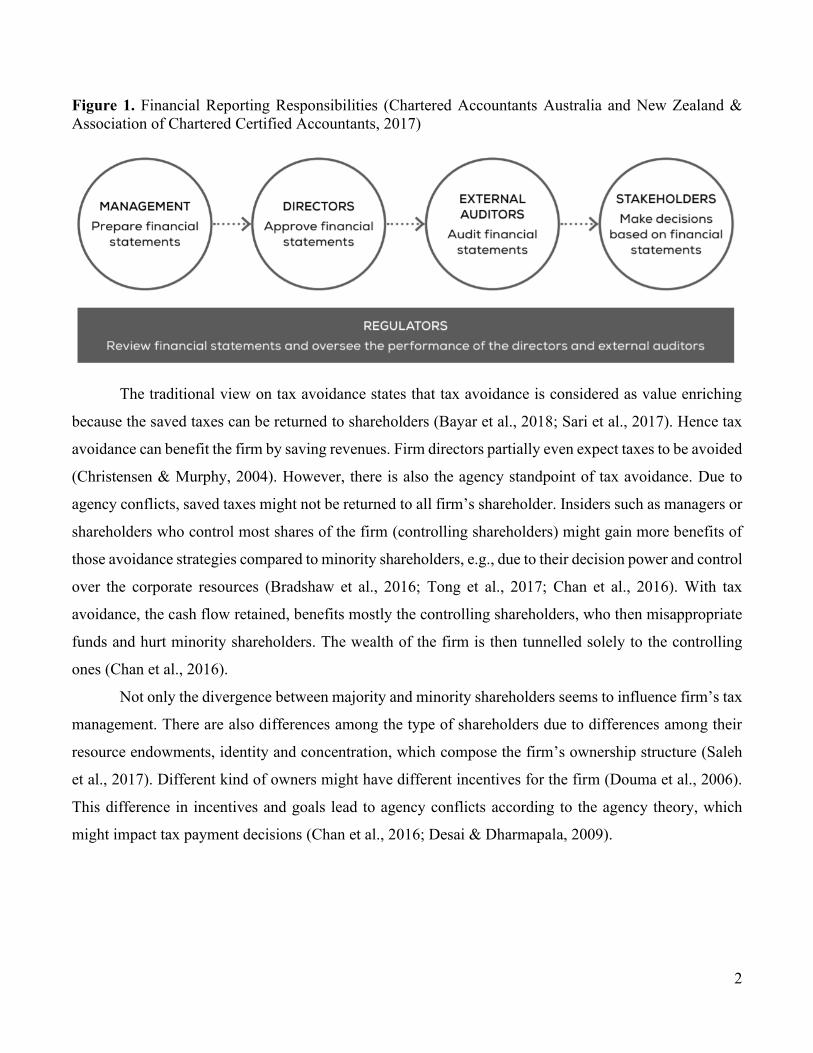
Figure 1 illustrates the responsibilities of different parties regarding the financial reports, showing that
many are aware of tax decisions and by this they can play a role in tax avoidance.
1 Chartered Accountants Australia and New Zealand & Association of Chartered Certified Accountants (2017). Directors’ responsibilities
for financial statements. In Finance and Management newsletter Retrieved from
http://www.accaglobal.com/content/dam/ACCA_Global/professional-insights/Directors-responsibilities-for-financial-reporting/pi-
Directors-Guide-to-Financial-Reporting.pdf
2
Figure 1. Financial Reporting Responsibilities (Chartered Accountants Australia and New Zealand &
Association of Chartered Certified Accountants, 2017)
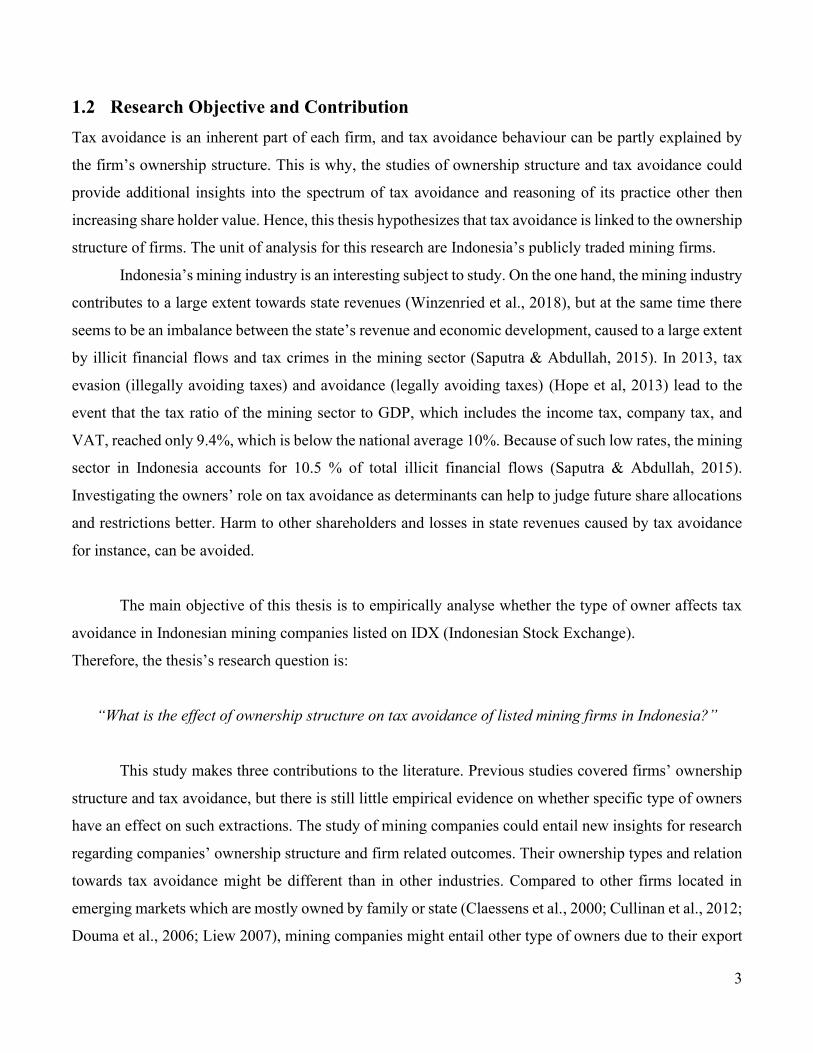
The traditional view on tax avoidance states that tax avoidance is considered as value enriching
because the saved taxes can be returned to shareholders (Bayar et al., 2018; Sari et al., 2017). Hence tax
avoidance can benefit the firm by saving revenues. Firm directors partially even expect taxes to be avoided
(Christensen & Murphy, 2004). However, there is also the agency standpoint of tax avoidance. Due to
agency conflicts, saved taxes might not be returned to all firm’s shareholder. Insiders such as managers or
shareholders who control most shares of the firm (controlling shareholders) might gain more benefits of
those avoidance strategies compared to minority shareholders, e.g., due to their decision power and control
over the corporate resources (Bradshaw et al., 2016; Tong et al., 2017; Chan et al., 2016). With tax
avoidance, the cash flow retained, benefits mostly the controlling shareholders, who then misappropriate
funds and hurt minority shareholders. The wealth of the firm is then tunnelled solely to the controlling
ones (Chan et al., 2016).
Not only the divergence between majority and minority shareholders seems to influence firm’s tax
management. There are also differences among the type of shareholders due to differences among their
resource endowments, identity and concentration, which compose the firm’s ownership structure (Saleh
et al., 2017). Different kind of owners might have different incentives for the firm (Douma et al., 2006).
This difference in incentives and goals lead to agency conflicts according to the agency theory, which
might impact tax payment decisions (Chan et al., 2016; Desai & Dharmapala, 2009).
3
1.2 Research Objective and Contribution
Tax avoidance is an inherent part of each firm, and tax avoidance behaviour can be partly explained by
the firm’s ownership structure. This is why, the studies of ownership structure and tax avoidance could
provide additional insights into the spectrum of tax avoidance and reasoning of its practice other then
increasing share holder value. Hence, this thesis hypothesizes that tax avoidance is linked to the ownership
structure of firms. The unit of analysis for this research are Indonesia’s publicly traded mining firms.
Indonesia’s mining industry is an interesting subject to study. On the one hand, the mining industry
contributes to a large extent towards state revenues (Winzenried et al., 2018), but at the same time there
seems to be an imbalance between the state’s revenue and economic development, caused to a large extent
by illicit financial flows and tax crimes in the mining sector (Saputra & Abdullah, 2015). In 2013, tax
evasion (illegally avoiding taxes) and avoidance (legally avoiding taxes) (Hope et al, 2013) lead to the
event that the tax ratio of the mining sector to GDP, which includes the income tax, company tax, and
VAT, reached only 9.4%, which is below the national average 10%. Because of such low rates, the mining
sector in Indonesia accounts for 10.5 % of total illicit financial flows (Saputra & Abdullah, 2015).
Investigating the owners’ role on tax avoidance as determinants can help to judge future share allocations
and restrictions better. Harm to other shareholders and losses in state revenues caused by tax avoidance
for instance, can be avoided.
The main objective of this thesis is to empirically analyse whether the type of owner affects tax
avoidance in Indonesian mining companies listed on IDX (Indonesian Stock Exchange).
Therefore, the thesis’s research question is:
“What is the effect of ownership structure on tax avoidance of listed mining firms in Indonesia?”
This study makes three contributions to the literature. Previous studies covered firms’ ownership
structure and tax avoidance, but there is still little empirical evidence on whether specific type of owners
have an effect on such extractions. The study of mining companies could entail new insights for research
regarding companies’ ownership structure and firm related outcomes. Their ownership types and relation
towards tax avoidance might be different than in other industries. Compared to other firms located in
emerging markets which are mostly owned by family or state (Claessens et al., 2000; Cullinan et al., 2012;
Douma et al., 2006; Liew 2007), mining companies might entail other type of owners due to their export
4
sales (Kang & Stulz, 1997). For example, Van Gelder et al. (2016), who investigated the role of tax
avoidance by mining firms and illicit financial flows in a research report, mining companies also have
owners such as foreign financial companies or holding companies. According to Reyes (2017), who
studied public mining companies and shareholder value, another, typical owner of mining companies is
the institutional owner. Hence, with the case of the mining sector in Indonesia, this thesis can contribute
and add several owners like foreign and institutional owners next to the studied owners such as family and
state owners.
This study investigates the effect of the ownership types family, state, domestic corporate and
domestic institutional and foreign. Regressions are also run with public ownership as a matter of data
completeness. Public Indonesian Mining companies also owned by minority owners and these are added
up. They are based on all other owners owning less or equal to 5%. Public ownership is considered as
controlling owner if the total amount of ownership equal 5% or more in this study.
The study of Indonesia’s mining industry and these different identities of owners might entail new
insights into the broad spectrum of tax avoidance and the country’s economic development.
Second, most of current literature, which investigated ownership structure’s effect on firm
characteristics, focused on either China (among others Cen et al., 2017; Chan et al., 2016; Cullinan et al.,
2012; Jian et al., 2012; Richard-son et al., 2016) or Anglo-Saxon countries (among others Ang et al., 2000;
Krivogorsky 2006; Maury 2006; Kiesewetter & Manthey 2017). This study, on the other hand, explores
the relationship between ownership structure and tax avoidance for Southeast Asian companies by taking
Indonesia as country of study. Therefore, this thesis extends the findings on tax avoidance and ownership
structure.
Third, a majority of the studies that consider ownership structure describe this structure over a
short period of time. Since the ownership structure of firms might also change over time, considering
several years of observation might entail different findings and or benefit as extra robustness of the study.
The benefit of this study is that it covers observations between 2004 and 2018, by this the change of
ownership. This approach allows as well to recognize possible trends among those years such as impacts
of nationwide regulations. Now, variations between the years are also covered.
The results of this research can provide new aspects and information to improve tax regulations,
in particular for emerging markets in order to avoid or mitigate illicit financial flows and tax crimes. Such
events not only lead to unfair compensations and inequitable resource distribution but also environmental
5
issues and poverty. In the case of Indonesia for instance, the communities still benefit less from the mining
firm’s operations and projects due to lack of state public funding caused by those tax avoidance activities
(Saputra & Abdullah, 2015).
To summarize, the contributions of this thesis are:
- With the study of the mining industry, it investigates several types of owners, hence extending
research on the relation between ownership structure and tax avoidance.
- Adds to scarce research regarding the ownership structure of Southeast Asian companies.
- Includes many years (2004-2018) and by this explicitly accounting for changes of ownership ,
including possible trends over the years.
1.3 Thesis Outline
The remainder of this thesis is organized as follows. The next chapter, Chapter 2, deals with the literature
review and the development of the hypotheses and a short analysis of Indonesia. In this chapter, case
examples and definitions are given in order to provide an understanding of the problem and to emphasize
the relevance of this study. It includes an elaboration on theory, which explains the motivation of the
hypothesized relations between ownership structure and tax avoidance. At the end of the chapter, a concept
model is provided to give the reader an overview of the hypotheses. Chapter 3 reports the research
methodology part of this study with a review on methods used by prior theses. Chapter 3 is followed by
Chapter 4, which covers the method of gathering the data used in this thesis and a description of it. The
regression results are provided in chapter 5 followed by the thesis’s conclusion (Chapter 6) and further
research and limitations (Chapter 7).
6
2 LITERATURE REVIEW AND HYPOTHESIS FORMULATION
This chapter provides a literature review on the relationship between ownership structure and tax
avoidance, in order to create an understanding of the topic and to support the reasoning of the study’s
assumption and developed research question (see Chapter 1). First the term tax avoidance is defined by
elaborating on other related factors in order provide insights into the topic. Next, a definition of ownership
structure is provided, which is followed by the theory used in this study explaining the effect of ownership
structure and tax avoidance. This part is supported by empirical evidence, which strengthens the link
between the two variables. The chapter finishes with the development of the hypotheses. Furthermore,
this chapter provides a short country analysis of Indonesia and information on the mining industry.
2.1 The Spectrum of Tax Avoidance
The tax world is tremendous and not easy to encompass, which is one of the main reasons why even with
regulations, events such as tax avoidance still take place. In order for the reader to gain a basic knowledge
of the term “tax avoidance”, which is the focus in this study, this section covers tax avoidance factors and
adds case examples.
2.1.1 Tax Avoidance
Tax avoidance is based on techniques, which are applied to lower the firm’s corporate tax obligations.
Such practices cause the transfer of value from the state to the firm’s shareholders (Desai & Dharmapala,
2009). However, it is not necessary questionable to enact on tax avoidance. Namely, one of the firm’s
directors main required action points is to minimize taxes and apply aggressive tax avoidance strategies
(Christensen & Murphy, 2004). Some of the tax codes even suggest firms to reduce their taxes. This is
because tax avoidance can benefit the firm in several ways.
First of all, decreasing tax payments ensure more cash return to the shareholders, increases
shareholder value (Bayar et al., 2018; Chan et al., 2016; Sari et al., 2017). Second, tax savings can be used
for reinvestments to the firm (Chan et al., 2016) and by this firm value can increase.
Nevertheless, since many corporations do not pay the fair amount of taxes due to tax avoidance
techniques, tax avoidance is rather been perceived as immoral (International Tax Review and PWC, 2007).
Namely it leads to a reduction in state revenue and by this to the reduction in state funding, investments,
7
etc. This effect is critical, since state revenue and funding are needed to ensure a stable and healthy
economy and contribute to the countries development.
Furthermore, the assumed shareholder value effect caused by tax avoidance techniques can be
mitigated due to agency conflicts. Tax avoidance can act as a tool to extract rents, which is only beneficial
to specific firm parties, not all shareholders. Either the manager can tunnel the tax savings for personal
benefit or controlling shareholders do so and exploit the minor shareholders (Chan et al., 2016). Due to
the misuse of power and decision-making rights by this insiders (managers) and controlling shareholders
and the immoral application of legal tax avoidance techniques firm value can decrease instead of increase,
as was intended at first.
Another negative aspect of tax avoidance is the damage of firm’s reputation and image. Tax
payments are a firm’s social responsibility since those payments belong to the state revenue, which can
be used for infrastructure or social programs and security (Huseynov & Klamm, 2012). Also, it is expected
that all citizens pay taxes. Corporations are not supposed to be excluded form their tax payment duties.
By this, hesistance of the firm to pay taxes creates mistrust towards the firm and harms the firm’s existence
and reputation. Also some shareholders like outside shareholders who do not benefit by the rent extraction
might discount the share prices (Desai & Dharmapala, 2006) and this leads to losses and a decrease in
firm value.
Tax Shelters
Tax shelters are vehicles or devices in order to shield one’s taxable income from tax obligations (Cordes
& Galper, 1985). These are arrangements made between, e.g., the government and the individual to protect
some or all income from taxation (Van Dijk et al., 2006). Tax shelters are legal and an example of such
activities are real estate investments or retirement plans. In other words, it means legally storing assets
with such tactics to mitigate tax liabilities (Kagan, 2019). Hence, the legal approach of using tax shelters
is called tax avoidance (Cordes & Galper, 1985)2. That is to say that with tax shelters government
regulations are applied with self-serving intentions and not with the actual intention of the legislation
(Binkmann (1999), as cited by Wilson (2009)).
2 Kagan, J. (2019, July 03). Tax Shelter. Retrieved from
https://www.investopedia.com/terms/t/taxshelter.asp#:~:text=Tax%20shelters%20are%20legal%2C%20and,retirement%20plans%20and%
20municipal%20bonds
8
Nevertheless, tax shelters can also be used to illegally avoid taxes (tax evasion) (Cordes & Galper,
1985; Hope et al., 2013).
Tax Planning
Tax avoidance is part of tax planning. Tax planning can for instance deal with the realisation of income
generated from services such as intellectual property, which are based in jurisdictions other than those in
which the operations of the firm are actually taking place. Tax planning is influenced by tax policies and
the firm’s investment choices (Hong & Smart, 2010). In other words, all activities by the firm to gain tax
benefits belong to tax planning (Shaipah et al., 2012), which is performed by tax management.
Tax Management
Tax management is typically done by the firm’s tax department, which ensures that tax information is
provided in the firm’s financial statements. It also has the mission to optimize the firm’s tax position with
tax planning strategies, hence it aims to improve financial positions and performance (International Tax
Review & PWC, 2007).
As pointed out earlier, many firms make use of the still unclear rules and regulations and gaps
within the tax law to a large extend and use their tax management to exploit such gaps. They behave in
ways which are not officially illegal but which are questionable and dubious and shift vast amounts of
profits. The real profit margins of the firms are not or only really difficult to track. Available approaches
and data to do that and to observe the profit shifting are challenging and differ from another (Fuest et al.,
2013). Tax avoidance techniques became especially a common business practice for multinational firms
like Enron (see Section ‘Tax Havens’ below).
Tax Avoidance Strategies
In the remainder of this subsection, some specific tax planning strategies are discussed. Tax planning
strategies lead to tax avoidance, hence less taxes paid by the corporation. Illustrative examples are
provided, starting with Enron, a company who due to tax avoidance was able to earn about $1.8 billion of
profits and at the same time was able to avoid paying $2 billion of federal income taxes over a period of
five years. Enron did not only reduce its net profit before tax tremendously by paying its advisors $88
9
million in fees to prevail paying $2 billion taxes. Like many other multinational companies, it used tax
havens to decrease or even diminish tax payments. 34
Tunnelling
Tunnelling covers the transfer of resources, which rather benefit the controlling shareholders instead of
the minority shareholders. Such transfers are for instance related party transactions, the sale of assets or
products to controlling shareholders or managers or also group firms cheaper than the intended market
price. Also loans with lower rates belong to such transfers (Chan et al. 2016; Sari et al. 2017).
With such methods earnings are manipulated and profits can be diverted away from other
shareholders. On the one hand, such related party transactions decrease the taxable income for the one
firm. On the other hand, the manipulated earnings can be used to meet requirements such as issuing an
IPO or avoid delisting for a group firm e.g. if such transactions increase their sales, hence earnings (Jian
& Wong, 2003).
Tax Havens
One of common strategies to avoid taxes is to set up divisions of the firm’s operations in a tax haven.
These are locations of whose jurisdictions require low or no taxes at all, making it lucrative to set up
divisions there and to shift profits. Most of such low tax locations are based in Europe, the Caribbean,
Africa, the Pacific and Middle East (Bennedsen & Zeume, 2015). According to Bennedsen and Zeume
(2015) the tax avoiders set up divisions, trademarks, or patents in those tax havens, charging the
operational costs in their higher-taxed countries for those divisions, and thereby decreasing their revenue
created in the higher-taxed countries. This leads to less tax payments since they lock their money in the
tax havens (Hanlon et al., 2015).
In Enron’s case, the company had about 692 of its 881 offshore subsidiaries set in the Cayman
Islands. This usage of tax havens enabled the company to shift its profits from higher tax jurisdictions to
lower ones. Whereas Enron should have paid large amount of taxes on their pre-tax revenue of $1.8 billion
3 Johnston, B., D. (2003). Tax Shelters Helped Enron Fabricate Profits, Senate Is Told. The New York Times. Retrieved from
https://www.nytimes.com/2003/02/13/business/tax-shelters-helped-enron-fabricate-profits-senate-is-told.html 4 Johnston, B., D. (2002). Enron's collapse: The Havens; Enron Avoided Income Taxes In 4 of 5 Years. The New York Times. Retrieved
from https://www.nytimes.com/2002/01/17/business/enron-s-collapse-the-havens-enron-avoided-income-taxes-in-4-of-5-
years.html#:~:text=Enron%20paid%20no%20income%20taxes,among%20businesses%20to%20avoid%20taxes.
10
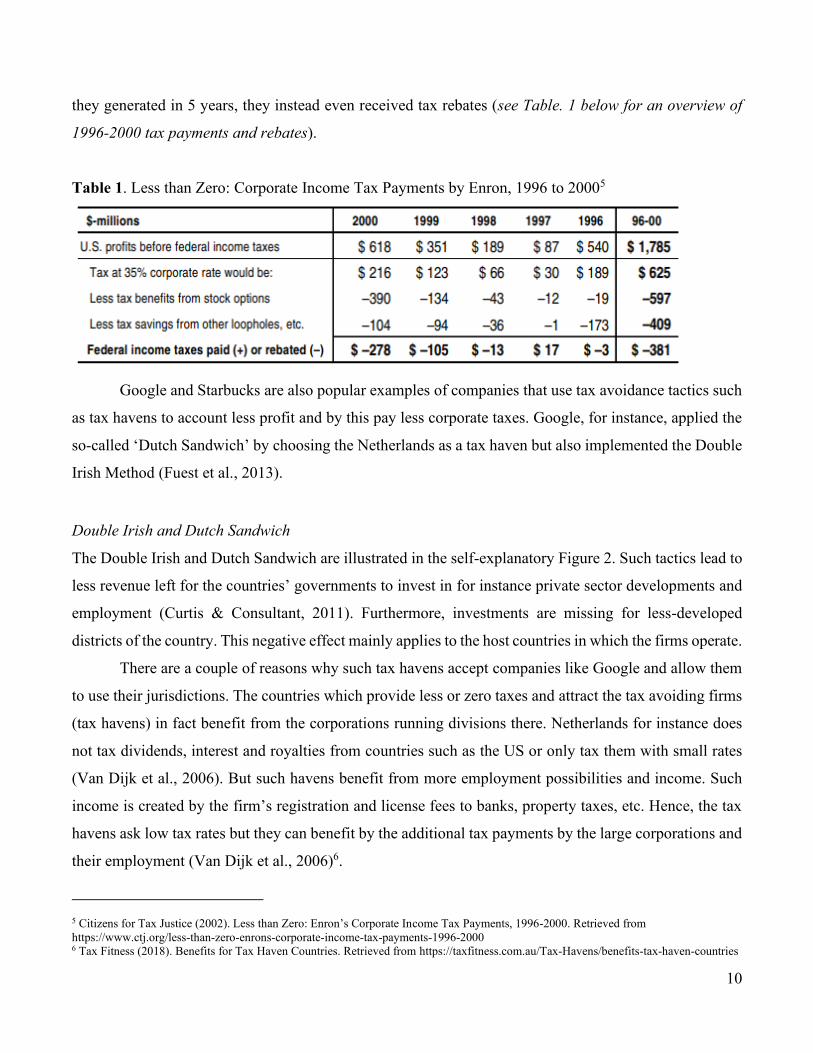
they generated in 5 years, they instead even received tax rebates (see Table. 1 below for an overview of
1996-2000 tax payments and rebates).
Table 1. Less than Zero: Corporate Income Tax Payments by Enron, 1996 to 20005
Google and Starbucks are also popular examples of companies that use tax avoidance tactics such
as tax havens to account less profit and by this pay less corporate taxes. Google, for instance, applied the
so-called ‘Dutch Sandwich’ by choosing the Netherlands as a tax haven but also implemented the Double
Irish Method (Fuest et al., 2013).
Double Irish and Dutch Sandwich
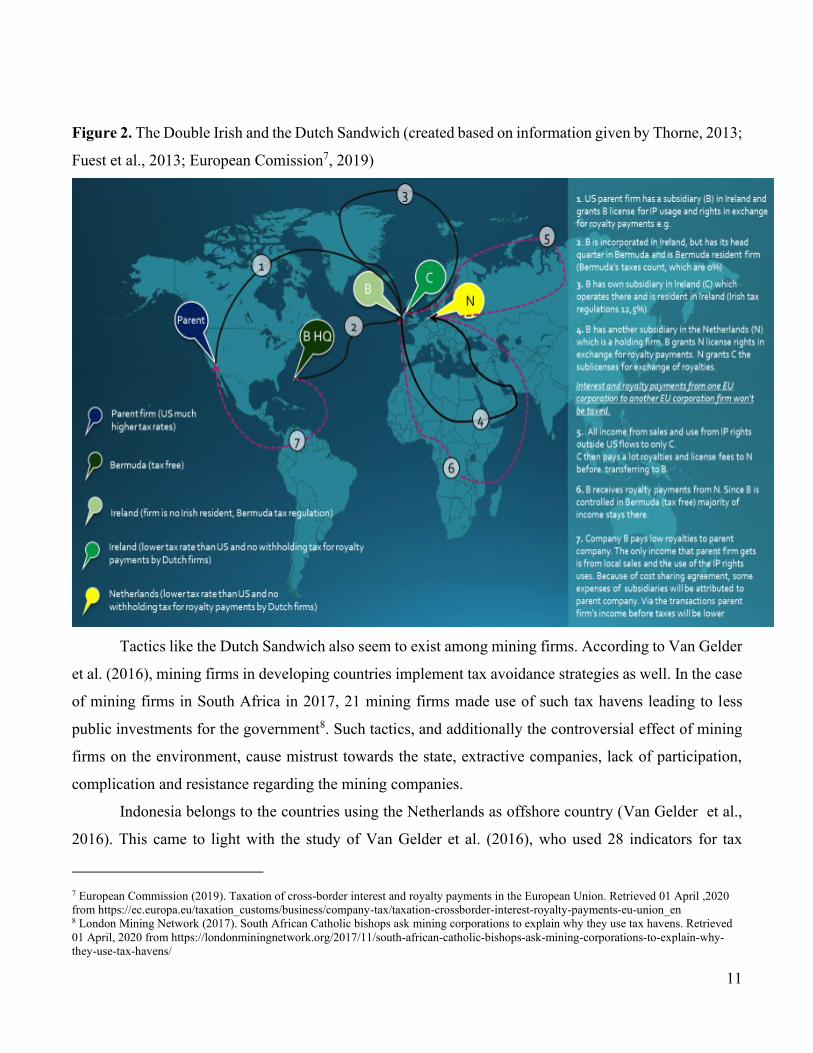
The Double Irish and Dutch Sandwich are illustrated in the self-explanatory Figure 2. Such tactics lead to
less revenue left for the countries’ governments to invest in for instance private sector developments and
employment (Curtis & Consultant, 2011). Furthermore, investments are missing for less-developed
districts of the country. This negative effect mainly applies to the host countries in which the firms operate.
There are a couple of reasons why such tax havens accept companies like Google and allow them
to use their jurisdictions. The countries which provide less or zero taxes and attract the tax avoiding firms
(tax havens) in fact benefit from the corporations running divisions there. Netherlands for instance does
not tax dividends, interest and royalties from countries such as the US or only tax them with small rates
(Van Dijk et al., 2006). But such havens benefit from more employment possibilities and income. Such
income is created by the firm’s registration and license fees to banks, property taxes, etc. Hence, the tax
havens ask low tax rates but they can benefit by the additional tax payments by the large corporations and
their employment (Van Dijk et al., 2006)6.
5 Citizens for Tax Justice (2002). Less than Zero: Enron’s Corporate Income Tax Payments, 1996-2000. Retrieved from
https://www.ctj.org/less-than-zero-enrons-corporate-income-tax-payments-1996-2000 6 Tax Fitness (2018). Benefits for Tax Haven Countries. Retrieved from https://taxfitness.com.au/Tax-Havens/benefits-tax-haven-countries
11
Figure 2. The Double Irish and the Dutch Sandwich (created based on information given by Thorne, 2013;
Fuest et al., 2013; European Comission7, 2019)
Tactics like the Dutch Sandwich also seem to exist among mining firms. According to Van Gelder
et al. (2016), mining firms in developing countries implement tax avoidance strategies as well. In the case
of mining firms in South Africa in 2017, 21 mining firms made use of such tax havens leading to less
public investments for the government8. Such tactics, and additionally the controversial effect of mining
firms on the environment, cause mistrust towards the state, extractive companies, lack of participation,
complication and resistance regarding the mining companies.
Indonesia belongs to the countries using the Netherlands as offshore country (Van Gelder et al.,
2016). This came to light with the study of Van Gelder et al. (2016), who used 28 indicators for tax
7 European Commission (2019). Taxation of cross-border interest and royalty payments in the European Union. Retrieved 01 April ,2020
from https://ec.europa.eu/taxation_customs/business/company-tax/taxation-crossborder-interest-royalty-payments-eu-union_en 8 London Mining Network (2017). South African Catholic bishops ask mining corporations to explain why they use tax havens. Retrieved
01 April, 2020 from https://londonminingnetwork.org/2017/11/south-african-catholic-bishops-ask-mining-corporations-to-explain-why-
they-use-tax-havens/
12
avoidance behaviour investigating 128 mining firms of 5 developing countries including Indonesia.
Their exploratory study focused on Dutch financing and holding firms as owners of the mining firms and
34% of the 128 firms were directly or indirectly controlled or financed by those Dutch companies. The
parent company (also called ultimate parent company) receives dividends by the holding firm of a business
segment and this firm receives dividends from the mining firm.
Most of the mining firms were not locally owned and were subsidiaries of foreign parent firms
located in a third country. Nearly all mining firms have a corporate structure based on three types of firms,
the Dutch firm, the mining firm and a parent company, being the Dutch firm mostly responsible for
finance, licensing and management. It seems that those parent firms indeed used techniques such as the
Dutch sandwich.
According to Van Gelder et al. (2016), indicators belonging to the firm’s financial statements, tax
arrangements and tax returns and miscellaneous were the most ones occurred within those mining firms.
Indicators within the financial statement are for instance payments of royalties for the use of patents in
lower tax rate. Indicators related to tax arrangements and tax returns are for instance differences between
reported and taxed income and indicators which belong to miscellaneous are for instance hiding beneficial
owners.
2.2 Ownership Structure of Firms
The ownership structure of a firm is typically based on the division of shares among the shareholders
(Claessens & Yurtoglu, 2013). Some shares provide control rights (also known as voting rights), while
others might give cash-flow rights. Control rights provide more power towards decision making of the
business while cash flow rights give the rights to more cash return and more direct equity stake of the firm
(Jin & Park, 2015). Hence, different owners of the firm might have different types of rights.
A firm’s ownership structure is furthermore based on ownership concentration and owners’
identity (Saleh et al., 2017). Ownership concentration is determined by the number of shareholders and
their distribution of shares (Horobet et al., 2019), dividing them typically into the group of majority
shareholder and minority shareholder (Saleh et al., 2017). According to Masripah et al. (2015) and Utama
et al. (2017), Indonesian firms have mostly concentrated ownership structures, meaning most of the shares
of the company are owned by only one or few shareholders (Cullinan et al., 2012).
There are also different identities controlling the firm. They influence the strategy of the firm and
decision makings according to their character (Claessens & Yurtoglu 2013; Douma et al., 2006; Saleh et
13
al., 2017; Thomsen & Pedersen 2000). According to Utama et al. (2017) in the case of Indonesia, most of
the ultimate owners of Indonesian public companies are Indonesians (domestic corporations and foreign
ones which are owned by Indonesians) followed by the state as ultimate owner.
2.2.1 Theory on Ownership Structure - Tax Avoidance Relationship
This study applies the agency theory to account for the assumed effects of ownership structure on tax
avoidance. This theory provides a framework linking the human behaviour ‘self-interest’ to firm’s
decision and business outcomes. As pointed out earlier, tax avoidance and other firm decisions do not
happen without the knowledge of decision makers such as managers or controlling shareholder and the
advantages do not benefit all parties. This why understanding the agency theory can help to explain the
variations in tax avoidance and to find possible determinants of it. Hence, this study uses its framework
to formulate the thesis’s hypotheses.
The next section provides a small introduction to the agency theory, which is followed by an
overview of prior research studying ownership structure and tax avoidance.
Agency Theory
The agency theory deals with the spectrum of conflict between managers and owners and between other
shareholders of a firm. This theory states that managers and owners intend to make decisions benefitting
their own interest instead that of the overall firm and all its shareholders (Douma et al., 2006; Platt & Platt,
2012) whereas their responsibility and duty should rather be to ensure shareholders wealth (Kabir et al.,
2013).
Managers can cause agency conflicts by going behind the back of the firm’s shareholders since the
manager has the capability to hide insider information, leading to an information asymmetry (Setiawan et
al., 2016). A tactic to hinder managers by ignoring shareholders needs is to out-seat the manager with the
power of the biggest shareholders (controlling) or by hostile takeovers (Douma et al., 2006).
The conflict between the manager and principals is type-I of the agency conflict. Also, other
conflicts can arise, namely between the principals themselves leading to type-II of the agency conflict
(Chan et al., 2016; Douma et al., 2006; Jian and Wong 2003; Jong & Ho, 2018; La Porta et al., 1999).
argue that the controlling shareholders could use the firm’s resources as they wish or perform related party
transactions. By this they neglect other shareholders. Also, while the one shareholder would like to
14
monitor the manager and prefers good corporate governance, the other shareholder hesitates to spend
resources on monitoring (Douma et al., 2006).
Agency conflicts seem to occur most notably in concentrated ownership environments (Claessens
& Yurtoglu, 2013). Hence, the ownership structure of the firm has an effect on the agency problem. Here
the board of directors can play a significant role since it has the power to decide on monitoring incentives
and to implement a better corporate governance, by this mitigating agency conflicts (Minnick & Noga,
2010).
As the agency theory states, different shareholders and the divergence between their rights within
the firm can cause agency conflicts. As mentioned before, tax avoidance might not per se benefit all
shareholders of the firm. In fact, decisions regarding tax avoidance might be directed because of the
different interests of individual owners.
One of the few studies linking ownership structure and tax avoidance is Khan et al. (2017). Their
results showed that concentrated ownership leads to higher tax avoidance. Also other studies investigated
the role of ownership and tax avoidance by resting upon the agency conflict. The traditional view of tax
avoidance states that decreasing tax payments increases shareholder value, by reinvesting and returning
the saved taxes (Bayar et al., 2018; Chan et al., 2016; Sari et al., 2017). Nonetheless, when considering
the emerging agency view, tax avoidance techniques can be exploited by parties such as managers to
extract wealth from shareholders and the firm, especially in countries with weak corporate governance
(Chan et al., 2016; Desai & Dharmapala, 2009). The non-tax costs such as penalties and reputational
damage due to tax avoidance would then reverse value enhancing effect of it (Chan et al., 2016; Desai &
Dharmapala, 2009; Tang, 2019).
Thus, the divergence between the dominant and small shareholders can create agency problems
due to exploitation (e.g. rent extractions) and that could play a role on the tax behaviour of the
shareholders. Consider, for instance, a firm controlled by family members. In the study of Chen et al.
(2010) those firms tend to avoid taxes less than non-family owned firms (Chen et al., 2010). Chen et al.
(2010) argue that the impact on tax avoidance behaviour is indeed affected by the type of owners. For
example, they find that the presence of other owners than family ones (managers/ institutions), can again
mitigate or even strengthen the effect on tax avoidance, indicating that ownership identity influences the
decision on tax avoidance.
15
Ownership plays a relevant role especially in developing countries’ mineral wealth and power.
According to Luong and Weinthal (as cited in Bayulgen, 2012) mineral-rich states are not cursed by their
wealth but rather by the structure of ownership.
Above mentioned prior studies and findings provide an indication that tax avoidance might be
related to the firm’s ownership structure, but more research should validate this hypothesis. This study
takes the principal to principal perspective (type-II agency conflict) during the research.
Previous Research
Literature regarding ownership structure and tax avoidance as well as studies covering the impact of
different type of owners regarding ownership structure are rather limited. Most studies focusing on the
role of ownership structure use either one or two type of owners such as family, state or institutions (for
instance Chan et al., 2013; Chen et al., 2010; Fernández-Rodríguez et al., 2019; Gaaya et al., 2017; Khan
et al., 2017; Lanis & Richardson 2011; Masripah et al., 2016; McGuire et al., 2014; Richardson et al.,
2016).
Additionally, previous studies did rarely distinguish between domestic type of owners and foreign
ones. This study aims at decreasing the gap in findings and studies related to the ownership structure and
tax avoidance by including various type of owners such as foreign ones.
Furthermore, during research it was notable that most research on ownership structure and/ or tax
avoidance cover the US market (among others Ang et al., 2000; Badertscher et al., 201); Bayar et al.,
2018; Boone & White 2015; Chen et al., 2010; (Demsetz & Kenneth 1985; Huseynov & Klamm 2012)
and European market (among others Fernández-Rodríguez et al., 2019; García et al., 2008; Kiesewetter
& Manthey 2017; Krivogorsky 2006; Mafrolla 2019; Maury 2006; Sacristán-Navarro et al., 2011; Shaipah
et al., 2012). Findings on emerging markets other than China is scarce. China belongs next to the U.S. to
the market which is studied the most in research regarding ownership structure and/ or tax avoidance
(among others Cen et al., 2017; Chan et al., 2013; Chan et al., 2016; Cullinan et al., 2012; Jian et al., 2012;
Richardson et al., 2016). Only a few covered other developing countries. One of the few ones elaborating
on Indonesia and especially ownership structure and tax avoidance are Handayani and Ibrani (2019),
Masripah et al. (2016) and Sudibyo and Jianfu (2016). They studied either a few types of owners namely
family, controlling holders in general or state and address that it is crucial to make changes within the
firm’s corporate governance, hence behaviours of firm parties need to be controlled to avoid self-interest
based decisions, which harm other shareholders.

16
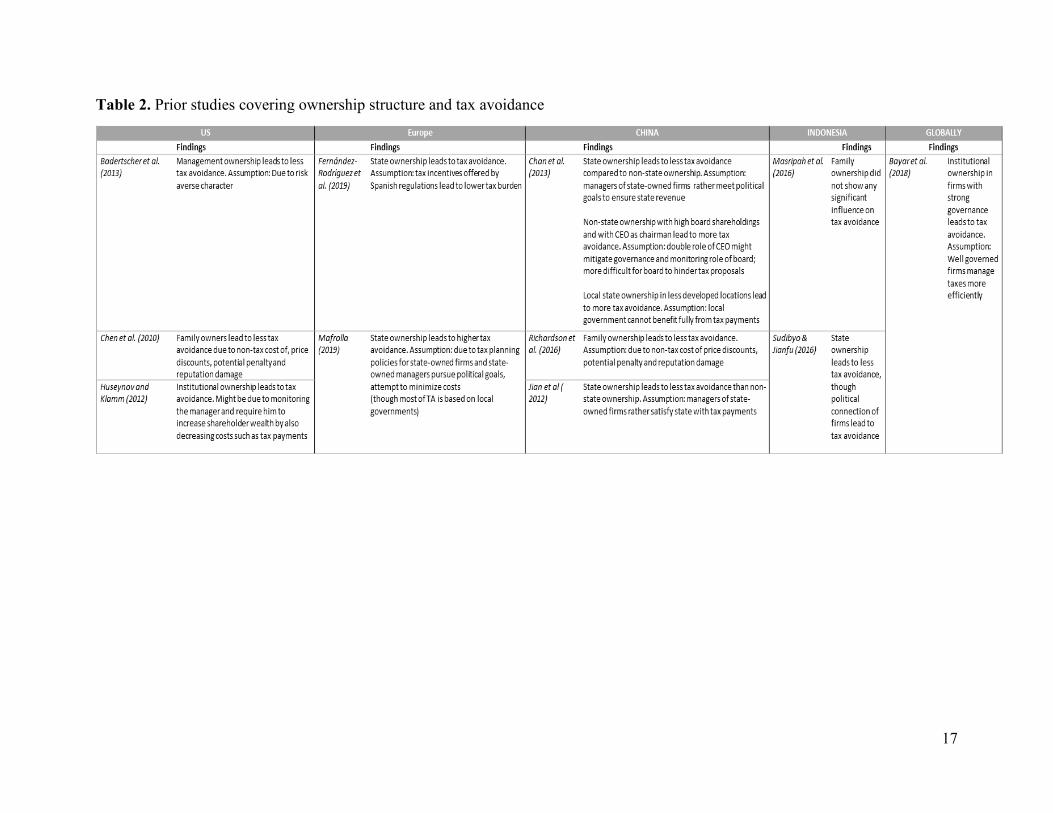
Of the above mentioned prior studies, only those which focus on the relationship between
ownership structure and tax avoidance, are provided in Table 2. Table 2 gives an overview of the countries
they studied as well as the authors’ results on the direction of their examined relationships. As can be seen,
studies concentrating on Indonesia are limited.
17
Table 2. Prior studies covering ownership structure and tax avoidance
2.3 Institutional Environment
2.3.1 Country
Indonesia is a former colony of the Netherlands and achieved independence in 1945. Now the
country has a democratic government with a presidential system and applies the civil law (Tran,
2017). With about 34 provinces9 and more than 17,000 islands, Indonesia is the fourth largest
country concerning population10. The country has more than 300 ethnic groups11 and about 87%
of its population are Muslims making Indonesia the largest Muslim-majority country12. Other
religions followed are among others Buddhism and Catholicism (Tran, 2017). The population in
Indonesia is divided into 2 major groups. The one being the western region with mostly Malaysian
ethnicity and the east region with a majority of Papuan ethnicity13. Being the second largest
exporter of natural gas, the country is also a net importer of oil due to the increased domestic
demand14. Agriculture products of Indonesia include rice, tea, coffee, rubber and spices15.
2.3.2 Economy
In the last couple of years, Indonesia became Southeast Asia’s largest economy. It is especially
rich in resources such as copper, gold and coal1617. In 2019, the United States took Indonesia off
the list of developing countries1819. Today, Indonesia is one of the 10 countries with the largest
9OECD (2016, May 12 2020). Indonesia: Unitary Country. Retrieved from https://www.oecd.org/regional/regional-
policy/profile-Indonesia.pdf 10 Mohamad, S. G., McDivitt F. J., Adam, W. A., Legge, D. J., Leinbach, R. T., Wolters, W. O. (2020). Indonesia.
Britannica.com Retrieved 13 May, 2020 from https://www.britannica.com/place/Indonesia 11 The Worldbank (2020, April 02). The World Bank In Indonesia: Having maintained political stability, Indonesia is one of East
Asia Pacific’s most vibrant democracies, emerging as a confident mid-dle-income country. Retrieved from
https://www.worldbank.org/en/country/indonesia/overview 12 World Population Review (2020, May 14). Muslim Population By Country 2020. Retrieved from
https://worldpopulationreview.com/countries/muslim-population-by-country/ 13 The Embassy of Indonesia Prague (2020, May 14). The Government of The Republic of Indonesia. Retrieved from
http://www.indonesia.cz/the-government-of-the-republic-of-indonesia 14 Extractive Industries Transparency Initiative (2020 May 2014). Indonesia. Retrieved
https://eiti.org/es/implementing_country/53 15 The Embassy of Indonesia Prague (2020, May 14). The Government of The Republic of Indonesia. Retrieved from
http://www.indonesia.cz/the-government-of-the-republic-of-indonesia 16 Developmentaid (2019). Indonesia launches an International Development Aid Fund. A look back at Indonesia’s aid history.
Retrieved 15 March, 2020 from https://www.developmentaid.org/#!/news-stream/post/55554/indonesia-launches-an-
international-development-aid-fund-a-look-back-at-indonesias-aid-history 17 The Worldbank (2019, May 14 2020). Indonesia Maintains Steady Economic Growth in 2019. Retrieved from
https://www.worldbank.org/en/news/press-release/2019/07/01/indonesia-maintains-steady-economic-growth-in-2019 18 The Insider Stories (2020, April 02). US Removes Indonesia from Developing Countries Lists. Retrieved from
https://theinsiderstories.com/us-removes-indonesia-from-developing-countries-lists 19 The Jakarta Post (2020, April 02). Indonesia still deserves special treatment in global trade: Economists. Retrieved from
https://www.thejakartapost.com/news/2020/03/02/indonesia-still-deserves-special-treatment-in-global-trade-economists.html
19
purchasing power parity and a G-20 member with a 20-year development plan (2005-2025) based
on different priorities for the economy such as social assistance programs and infrastructure
development20.
Over the past 3,5 years, Indonesia’s economy has grown consistently with a GDP quarterly growth
between 4,9 and 5,3 %. New infrastructure projects and reconstruction efforts in Lombok and Palu,
where natural catastrophes were experienced, enable also more government investing. Indonesian
labour markets are strong and the country has a strong consumer spending boom and low
inflation21.
2.3.3 Poverty
Whereas Indonesia’s development stage improved substantially, many aspects are still
controversial. The change in title switching from developing country to developed one2223, should
not give the impression that Indonesia overcame much or all of its problems, which are distinctive
in developing countries. According to The Worldbank (2020), about 25,1 of the 264 million
Indonesians are considered to live below the poverty line and there are still many poor local
communities. Despite efforts to improve public services, particularly in health, the quality in life
is unbalanced by middle-income standards24.
2.3.4 Environment
Critical is also Indonesia’s impact on the environment. The country experiences peatlands
degradation and slash-and-burn farming. They are the biggest contributors towards Indonesia’s
20 The Worldbank (2020, April 02). The World Bank In Indonesia: Having maintained political stability, Indonesia is one of East
Asia Pacific’s most vibrant democracies, emerging as a confident mid-dle-income country. Retrieved from
https://www.worldbank.org/en/country/indonesia/overview 21 The Worldbank (2019, May 14 2020). Indonesia Maintains Steady Economic Growth in 2019. Retrieved from
https://www.worldbank.org/en/news/press-release/2019/07/01/indonesia-maintains-steady-economic-growth-in-2019 22 The Insider Stories (2020, April 02). US Removes Indonesia from Developing Countries Lists. Retrieved from
https://theinsiderstories.com/us-removes-indonesia-from-developing-countries-lists 23 The Jakarta Post (2020, April 02). Indonesia still deserves special treatment in global trade: Economists. Retrieved from
https://www.thejakartapost.com/news/2020/03/02/indonesia-still-deserves-special-treatment-in-global-trade-economists.html 24 The Worldbank (2020, April 02). The World Bank In Indonesia: Having maintained political stability, Indonesia is one of East
Asia Pacific’s most vibrant democracies, emerging as a confident mid-dle-income country. Retrieved from
https://www.worldbank.org/en/country/indonesia/overview
20
large carbon dioxide emissions, creating a carbon bomb according to Greenpeace25 26.
Consequently, Indonesia belongs to the fifth largest greenhouse gas emitter world wide27 (The
Jakarta Post, 2019). Moreover, residents and animals suffer from water pollution from industrial
wastes, sewage, air pollution in urban areas, smoke and haze from the forest fires as reported by
the Embassy of the Republic of Indonesia in The Hague28.
2.3.5 Corruption
Indonesia is ranked 85 out of 180 countries in the corruption perception index in 2019, which
means a high perceived level of public sector corruption29. The main drivers for the high corruption
level seem to be legal uncertainties, complex regulatory frameworks and strong domestic vested
interests and decentralized decision-making processes. They enable for example bribes by
companies in the processes of registering businesses, filing tax reports and receiving permits and
licenses (Merkle, 2018). Decentralization in Indonesia seems to not have reduced the corruption.
There might be greater responsibility by the cities/villages but transparency, strong institutions and
accountability are missing (Merkle, 2018). Also, central authority to monitor and issues natural
resource development licenses is missing. This for instance empowers officials to exchange land
rights, which financially benefit their campaigns30.
25 United Nations Environment Programme (n.d.). Working as one: how Indonesia came together for its peatlands and forests.
Retrieved 20 May, 2020 from https://www.unenvironment.org/news-and-stories/story/working-one-how-indonesia-came-
together-its-peatlands-and-forests 26 The Carbon Brief (2019). The Carbon Brief Profile: Indonesia. Retrieved 20 May, 2020 from https://www.carbonbrief.org/the-
carbon-brief-profile-indonesia 27 The Jakarta Post (2019, May 20 2020). Indonesia must address climate change in more concrete terms: UN. Retrieved from
https://www.thejakartapost.com/news/2019/06/21/indonesia-must-address-climate-change-in-more-concrete-terms-un.html 28 The Embassy of the Republic of Indonesia in the Hague (n.d.). Indonesia. Retrieved 20 May, 2020 from
https://www.en.indonesia.nl/indonesia/profile/geography 29 Transparency International (2020). Transparency International Indonesia. Transparency International: The global coalition
against corruption. Retrieved 15 May, 2020 from https://www.transparency.org/en/countries/indonesia 30 Mathiesen, K. (2016). Greenpeace reveals Indonesia's forests at risk as multiple companies claim rights to same land. The
Guardian. Retrieved 08 May 2020. From https://www.theguardian.com/sustainable-business/2016/apr/02/greenpeace-palm-oil-
logging-indonesia-overlapping-land-claims-greenpeace-forest-fires
21
2.3.6 Investments and Tax Regulation
Asian conglomerates are among the top foreign investors, but American and European companies
are more and more entering the Indonesian market too31. However, Indonesia is still ranked 73 of
190 economies regarding the ease of doing business32.
Indonesia’s audit board evaluates the management of state finances and monitors
transactions from state-owned firms (SOE), government, local governments and other state finance
involved parties (Merkle, 2018). Senior government officials and other bodies working in specific
agencies are required to report all assets held by them and or families before, during and after
taking office to the KPK (Corruption eradication commission). Unfortunately, the KPK has limited
resources and by this cannot entirely and fully detect wrongful behaviours (Merkle, 2018).
The current tax rate for Indonesia’s corporate income tax is 25%. Resident corporate payers
with earning gross revenues up to Rp 50 billion receive 50% tax reduction. If they manage to not
exceed a gross revenue of Rp 4.8 billion in a tax year, they get a final income tax of only 0.5%.
For non-resident corporations, there is a branch profit tax of 20% (Deloitte, 2019). Thus, the
foreign firms are taxed additionally, if they to not reinvest their after tax gross revenue in
Indonesia. The underlying assumption is that they otherwise probably channel the revenue back to
shareholders as dividends or to their own country33.
Law in Indonesia states that every company wanting a tax refund, needs to undergo a 1
year long tax audit but there is no threshold; $100 and $1000000 tax refund will both be audited
then. In Indonesia, the estimated tax payment for current year is based on last year taxable income.
So, if your current years income is less than last year, you would have a higher estimated tax
payment than you should have paid.
One of the group of firms which has a high chance of being audited, are Indonesian firms
who are doing business with partners in lower tax places like havens. Audits in Indonesia do not
go through records, they go and ask for a good explanation about the firm’s supply chain. After
two days, they are going to start to look at the numbers to see if the story with the supply chain
explanation makes sense with the provided numbers. They look at all type of taxes like VAT
31 Cochrane, J. (2013). Multinationals Hasten to Invest in Indonesia. The New York Times. Retrieved 13 May, 2020 from
https://www.nytimes.com/2013/04/24/business/global/indonesia-sees-foreign-investment-surge.html 32 The Worldbank (2020, May 15). Ease of doing business index. Retrieved from
https://data.worldbank.org/indicator/IC.BUS.EASE.XQ 33 Klasing, D (2019). What is the Branch Profits Tax? Retrieved 15 May, 2020 from https://klasing-
associates.com/question/branch-profits-tax/
22
employment tax34. This approach could raise the probability of corruption, since firm records are
not monitored well and looked at in detail.
Regarding individual taxes Indonesian tax residents pay taxes on their worldwide income,
thus income derived from Indonesia as well as abroad, while under certain circumstances they can
gain foreign tax credits on foreign income due to tax treaty between the countries for instance. The
personal tax rate is 5% for income up to Rp 50 million, 15% for Rp 50 million-Rp 250 million,
25% for Rp 250 million-Rp 500 million and 30% for more than Rp 500 million. Non-residents
only have to pay 20% of personal income taxes on income derived from Indonesia. Also here the
tax rate depends on circumstances such as treaties between the residence they are taxed in and
Indonesia (Deloitte, 2019). Indonesia has no local tax rates for individual income35
2.3.7 Mining Industry
For decades, energy resources have been crucial to Indonesia’s economy. The country is especially
known for its coal generation, and belongs to one of the top coal exporters globally36.
The mining industry belongs to one of the sectors mainly leading to Indonesia’s economic growth.
It contributes to a large extend to Indonesia’s GDP, state revenue, exports, employment and
especially the development of many remote areas (Institute Indonesian Mining, 2018). The country
plans to further commit to coal-fired electricity generation (Winzenried et al., 2018). In 2017, the
mining sector was not only the second largest contributor to national exports, but also contributed
tremendously to the state revenue.
Nevertheless in 2018 the Worldbank reported that mining does not belong to the country’s
largest contributors towards exports, GDP, state revenue and employment like it did in the past.
The reason is that other non-mining sectors grow. Still, mining is seen as a strategic national
importance and especially of relevance to specific areas like Kalimantan and Papua. The mining
industry employs annually up to 1,6 million jobs and by this enhances job creation. It plays a
relevant part in the regional economies (Institute Indonesian Mining, 2018).
34 Siregar, N. [YouTube]. (2014, August 13). Tax Audits in Indonesia. Interview by Deloitte [Video file]. Retrieved from
https://www.youtube.com/watch?v=TWRLarkA_mQ 35 PWC (2020). Indonesia: Individual - Taxes on personal income. Retrieved 05 November, 2020 from
https://taxsummaries.pwc.com/indonesia/individual/taxes-on-personal-income 36 Indonesia Investments (2018). Coal. Retrieved 16 May, 2020 from https://www.indonesia-
investments.com/business/commodities/coal/item236
23
With the support of the Worldbank, the government seeks to improve the mining sector,
its policies, mitigate challenges and to make informed policy choices. One of the key areas for
improvement in the mining sector seems to be the management of local impacts of mining. This
would be done by including local communities, public disclosures, monitoring of environmental
and societal impacts etc.
Still, much improvement is needed towards the political environment and investment
conditions (corruption, expropriation risk, political instability, mining an tax policies) (Institute
Indonesian Mining, 2018).
Investments in mining industry
Whereas Indonesia’s wealth in natural resources attracts foreign investments, foreign investors are
rather discouraged to invest due to government regulations and high degree of corruption in the
country37. Regarding investments in mining, in 2019 Indonesia ranked among the 13 least favoured
jurisdictions to invest in due to its mining policies and by this shows high barriers to invest38.
Indonesian mining SOEs need to comply with the International Financial Reporting
Standards IFS and publish the annual financial audits. Whereas in the previous mining law, 100%
foreign owned firms might have had to face divestment regulations later on, the new law replaced
prior contracts with the mining business licenses IPU and special mining business license IUPK.
Those can be granted to Indonesian individuals, corporations or business entities (Institute
Indonesian Mining, 2018).
Since 2012, mining firms had to develop the refining and processing facilities in Indonesia.
Also, unprocessed ore exports were banned in 2014. With the licenses, some low-grade minerals
can be exported for up to 5 years. The agreement ends in 2022. Critical for investments here is the
obligation of paying export duties and the minimum requirements for processing and refining
domestically, creating legal uncertainties in the mining business (Institute Indonesian Mining,
2018).
Surprisingly, regulations regarding oversight of the administrations and tax authorities is
limited. Government officials, who oversee the mining sector are not required to provide
37 U.S. Department of State (2019). Investment Climate Statements: Indonesia. Report. Retrieved 20 May, 2020 from
https://www.state.gov/reports/2019-investment-climate-statements/indonesia/
38 Stedman, A., Yunis, J. & Aliakbari, E. (2019). Survey of Mining Companies 2019. Fraser Institute Annual. Retrieved 15 May,
2020 from https://www.fraserinstitute.org/sites/default/files/annual-survey-of-mining-companies-2019.pdf
24
information on their financial interests in the activities and projects. Also, public investment
projects are not really checked regarding their costs and benefits nor do they need to undergo
independent audits (Institute Indonesian Mining, 2018). The lack of binding provisions and lack
of transparency regarding government officials and their power, cause mistrust towards the fair
monetary channels of the mining sectors and actual contribution to the economy and state revenue.
These factors support the impression that there seems to be an unbalance between state revenue
and mining tax obligations, leading to illicit financial flows.
2.3.8 Illicit Financial Flows
According to the global coalition of civil society organizations (COS) which includes 40 countries,
it is a fact that there is an imbalance between the revenues of the mineral resources (state revenues)
and economic development in Indonesia and the reason lies in illicit financial flows and tax crimes
in the mining sector (Saputra & Abdullah, 2015). Flowler (2017) argues that the reason for the
imbalance between Indonesia’s state revenue, despite its rich resources, seems to a bigger extend
lie in the tax avoidance of the mining firms in Indonesia, which leads to less funding available for
public spending39. In 2016, Indonesia’s tax revenue realization only increased by 4.2% even
though the mining sector seems to have grown tremendously in the last couple of years. This
implies that Indonesia’s tax revenue collections do not grow accordingly40.
These so-called tax gaps do not only affect Indonesia. Globally, tax avoidance causes about
$600 billion of revenue losses worldwide of which $200 billion losses stem from developing
countries.
In Consequence, countries such as Indonesia suffer from (tax) revenue losses and a poor
economy (which is by a large extend caused by lack of tax payments by corporations).
Controversially, they receive official development assistance (ODA), which is financial aid from
39 Fowler, N. (2017). Dear mining companies, why do you use tax havens? Tax Justice Network. Retrieved 01 July, 2019. From
https://www.taxjustice.net/2017/12/04/dear-mining-companies-use-tax-havens 40 Indonesia Investments (2017). Tax Buoyancy Indonesia: GDP Growth & Tax Revenue are Asynchronous. Retrieved 22 June,
2019. From https://www.indonesia-investments.com/news/todays-headlines/tax-buoyancy-indonesia-gdp-growth-tax-revenue-
are-asynchronous/item7613
25
other countries (OECD, 2020)4142. Governments are one of the providers, hence taxes provided by
individual tax payers are used for such an aid. This increases the mistrust towards the state.
2.4 Hypotheses Development
As addressed earlier, the agency perspective on tax avoidance indicates that ownership structure
affects the firm’s decision making and might by this influence their likelihood of saving taxes.
This chapter covers the thesis’s hypotheses regarding the type of owners and the firm’s tax
avoidance in order to provide and stress the reasoning of the thesis’s assumption and developed
research question. To note here is that no hypothesis is provided for public ownership. The
inclusion of public ownership is merely for the sake of data completeness (explanation in the
variable measurements and definitions section).
2.4.1 Family Ownership
According to Claessens and Yurtoglu (2013) and Handayani and Ibrani (2019), families are the
largest direct shareholders and by this the controlling ones in Indonesia. They are typically
involved in the management of the firms too. La Porta et al. (1999) even found that in 69% of the
family controlled firms, the family also manages the firm. By this they are insider owners
(Claessens & Yurtoglu, 2013; Masripah et al., 2016). Considering the agency theory here, one
would assume type 1 and 2 of agency conflict, since the controlling shareholder (the family) could
expropriate minority shareholders, whereas as managers they might make selfish business
decisions such as extract rent from the tax savings.
Liew (2007) found that family owners tend to avoid taxes, which is supported by Gaaya,
Lakhal and Lakhal (2017) who argue that they do so by extracting rents from tax saving positions.
The positive relationship between family ownership leading and tax avoidance in research might
be explained by the fact that the family in this case is probably also the entrepreneur. As an
entrepreneur, it wants to maintain control, especially when investor protection is poor. By this the
family can act selfish by ensuring private benefits from take overs, for instance (Bebchuk (1999)
41 OECD. (2020). DAC List of ODA Recipients. Retrieved 15 November, 2020. From https://www.oecd.org/dac/financing-
sustainable-development/development-finance-standards/DAC_List_ODA_Recipients2018to2020_flows_En.pdf 42 OECD. (2020). Official development assistance – definition and coverage. Retrieved 15 November, 2020. From
https://www.oecd.org/dac/financing-sustainable-development/development-finance-
standards/officialdevelopmentassistancedefinitionandcoverage.htm
26
as cited by La Porta et al. (2007); La Porta et al., 1999). Also Annuar et al. (2014) found in their
study of Malaysian firms that family ownership has a positive effect on tax avoidance. They argue
that this effect is related to the concentrated ownership environment in Malaysia. As their
shareholders are based on few major ones (of which the family would belong to), their reputation
would not be affected as much by e.g. share discounts from minority shareholders.
In contrast, Chen et al. (2010) and Richardson et al. (2016) state that family ownership
leads to less tax avoidance. As argued by Chen et al. (2010), family owners fear harm in their
reputation and penalties that could happen due to tax avoidance tactics. Their results reveal that
family owners show less tax-aggressive behaviour than non-family owners. This is also supported
by Landry et al. (2013), who concentrated on Canadian firms. They discovered in their study that
family-owned firms show less tax aggressive behaviours. Initially, they assumed this effect is
caused by the corporate social responsibility factor. Families would not prefer tax avoidance
benefits more than the possible reputational damage and other tax avoidance costs in order to
protect the family’s name and image. The assumption is that this kind of firms would be also more
corporate social responsible due to that. They would ensure good CSR status to sustain a good
image. In their study, they added family ownership as moderating effect between corporate social
responsibility and tax aggressiveness (researchers term, which encompasses tax avoidance,
evasion and planning). Contrary to their hypothesized effect, family-owned firms show lower
corporate social responsibility scores than non-family owned firm. Still, whether corporate social
responsible or not, family ownership has a negative effect on tax avoidance according to their
results.
There seems to be disagreements in research regarding family ownership of firms.
Nevertheless, as mentioned earlier Indonesia has a rather concentrated ownership environment
(Masripah et al., 2015; Utama et al., 2017), hence we follow the argumentation of Annuar et al.
(2014) about Maylasian family-owned firms and chose the following hypothesis:
H1: Family ownership of Indonesian mining firms has a positive effect on tax avoidance.
2.4.2 State Ownership
Shleifer and Vishny (1994) mention a conventional view, which states that the aim of governments
as owners of public firms is to maximize social welfare as well as avoiding the monopoly power
27
of private firms. They also state that SOEs ensure prices, which reflect social marginal costs, hence
fair prices. Moreover they perform well.
In the case of Azerbaijan, Iraq and Yemen for instance, the state-owned mining firms next
to petroleum ones contribute to more than two third of the governments revenues43. Those revenues
then can be invested in public funds and development (Sudibyo & Jianfu, 2016). Intuitively, tax
avoidance would be naive, since it would reduce the government revenues again.
Indonesia belongs to the top countries enhancing state owned corporation’s accountability.
This means they provide regulations regarding publishing reports, disclosing audits and
transparency and compliance with international accounting standards for example44. Thus, one
could argue that these regulations decrease the possibility and easiness of tax avoidance
mechanisms for state-owned firms. Furthermore, the country’s development is key to the
government and by this the state would seek to tackle development issues, which could be caused
by tax avoidance45.
These assumptions are supported by the study of Chan et al. (2013), who found that SOEs
show a less tax-aggressive behaviour compared to the ones not controlled by state. They argue that
the reason could be that executives of the SOEs might benefit from promotions or career
opportunities offered by the state and want to satisfy the state by not harming the states revenues.
Important to note is that in contrast, the results of Chan et al. (2013) conveyed that the negative
relationship between state-ownership and tax avoidance diminishes in less-developed countries
with weak corporate governances. Similar findings are reported by La Porta et al. (2007). They
found that firms located in countries with poor investor protection regulations are largely owned
by a family or the state, indicating that state ownership does not necessarily lead to better investor
protection. Hence agency conflicts can arise and decisions regarding tax payments can be biased
and aimed to benefit the major shareholders.
The state’s role regarding business regulations, hence investor protection, is different in
civil law countries, which seems to derive from history (La Porta et al., 1999). Whereas in common
law countries such as England, the crown partially lost control of the court to the parliament and
43 Natural Resource Governance Institute State-Owned Companies. Retrieved from https://resourcegovernance.org/resource-
governance-index/report/state-owned-companies
44 Natural Resource Governance Institute State-Owned Companies. Retrieved from https://resourcegovernance.org/resource-
governance-index/report/state-owned-companies 45 Parliamentary Monitoring Group (2006). Tax Avoidance Discussion Thesis: briefing by SARS and National Treasur .
Retrieved from https://pmg.org.za/committee-meeting/6500/
28
property owners in the 17th century, in civil law countries such as Germany, parliament power was
weaker with the adoption of commercial codes in the 19th century (La Porta et al., 1999). The state
maintained control over firms, not the property owners nor parliament. This could indicate that in
order to maintain the position, the state does not have an agenda in protecting other investors than
itself. This is a possible argument for the fact that civil law countries have weak private property/
investor protection than common law countries (La Porta et al., 1999).
These developments additionally support rather the assumption that state ownership in firms
located in civil law countries leads to tax avoidance due to weak shareholder protection. Hence,
since Indonesia follows the civil law (Tran, 2017), state ownership in Indonesian firms would lead
to the firm’s tax avoidance.
Moreover, Shleifer and Vishny (1994) contradict the conventional view that the state as
owner would enact on best interest for the country’s development. They argue that politicians of
such SOEs use their control for selfish goals. Such goals could be hiring political allies and control
prices for political aims. This argument is supported by the findings of Mafrolla (2019), who
studied tax avoidance of SOEs in Italy. Their results showed that by affecting the corporate
accounting policies, the state-owned firm avoided corporate taxes. Here, they distinguish national
and local government, the latter having a significant positive effect on tax avoidance, whereas the
results of national government as owner were as well positive but not statistical significant. Their
argumentation for this is that local government owned firms might be less interested in tax revenue
since they are not the direct tax collector. Furthermore, the owners exercise their political power
over their owned local companies. They prefer the tax savings for cost minimization and profit
maximization.
According to the study of Sudibyo and Jianfu (2016) on manufacturing firms, political
connected firms had to pay less corporate income taxes. The assumption is that SOEs have political
connections and better network with tax authority, by this they can manage taxes well compared
to other firms. If this is the case, then state ownership in Indonesia would lead to tax avoidance
since there it is tradition that current or former politicians have board positions in SOEs (Sudibyo
and Jianfu, 2016). Taking the principal to principal perceptive here, controlling state owners seem
to use insider information and powerful networks for personal benefits, hence expropriating
minority shareholders.
29
Based on above-mentioned theoretical arguments the study’s assumption is that in the case
of Indonesia, state ownership and tax avoidance have a positive relationship. Indonesia is a
developing country with civil law. Having weaker corporate governances, while being known to
have current or former politicians as board members, convinces to formulate the following
hypothesis:
H2: State ownership of Indonesian mining firms has a positive effect on tax avoidance.
2.4.3 Domestic Ownership
Indonesian mining firms have institutional owners as well (Reyes, 2017). Nevertheless, whereas
ownership types are addressed, not much was found on the distinction between domestic corporate
and institutional owners. Such a distinction is necessary, since these types have difference
resources capacities and probable different goals. In order to indicate a possible effect on tax
avoidance, this thesis relied on only few papers mainly investigating their role on other firm factors
such as performance. This way, this thesis can make assumptions regarding the probable effect of
domestic ownership on tax avoidance and also perhaps provide foundations for further research
on domestic ownership and tax avoidance.
2.4.4 Domestic Corporate Ownership
Douma et al. (2006) conducted research on firm’s ownership structure including domestic
ownership on firm performance in emerging markets and found that domestic owners lead to
increased firm performance. In their study, they also included the aspects of the institutional
context and firms’ resource capacities. According to the authors, domestic corporate shareholders
in India represent the largest shareholders there with the perspective of long-term investments.
Compared to domestic financial holders, domestic corporate ones would rather like to encourage
competition and have non-financial goals. They have strategic goals such as acquiring and being
acquired in order to sustain their core competences and find it important to monitor the firms well.
The likelihood of being taken over increases with the number of large corporate shareholders
(Douma et al., 2006).
The good firm performance by domestic corporate owners is also argued by other
researchers, who argue that the positive relationship can be explained by the home equity bias.
What it means is that investors seem to rather invest in firms based in their home country instead
30
in foreign firms (Solnik & Zuo, 2017; Van Nieuwerburgh & Veldkamp 2010). They can benefit
by information asymmetry on their equity markets (Amadi, 2011). An underlying assumption is
that the domestic investors are specialized in their home assets (Van Nieuwerburgh & Veldkamp,
2010). One can assume that due those home asset specializations and knowledge, home investors
seek to compete suiting the information advantage theory (Fedenia et al., 2017).
Corporate shareholders do not entail much resources, except when they belong to business
groups (Douma et al., 2006). If the domestic corporation as owner is not an institutional one with
large amount of resources such as financial ones, it might be counterproductive for a domestic
corporation to control another domestic corporation, which operates in a totally different industry.
Lack in industry experience and knowledge might lead to business failure and loss of profit, hence
low return on investment. Taking this into consideration one might argue that in case the firm is
owned by a domestic corporation, it is owned by one which has similar industry experience and
knowledge to add in order to increase firm value. Thus, the objective is long-term value. Extensive
tax avoidance tactics and their costs would by this not be beneficial and desired by the domestic
corporate owners, since they would decrease the firm value due to the discount risk, reputational
damage and agency conflict as mentioned before. In addition, the strategic view and goal of the
domestic corporate owner to acquire other firms or be acquired by larger ones, also entails that
domestic ownership seeks to have better monitoring approaches compared to domestic financial
ones (Douma et al., 2006). Their intend to monitor the firm suggests lower agency conflicts. To
note here is that this effect would be mitigated when the corporation belongs to a business group.
Firms, who aim at being taken over and put emphasize in monitoring, such as domestic
corporations as owners do, would not seek private benefits (Mishra, 2013) such as tax avoidance
benefits.
Compared to domestic institutional owners, domestic corporate owners do not have the
required (financial) resources and network to be able to find loopholes in tax regulations and to
avoid taxes legally. This study postulates they would not solely have interest in avoiding taxes and
rather aim at strategic goals like entering new markets and provide good performance as argued
by above mentioned researchers.
The strategic approach of domestic corporations and its positive effect on firm value,
shown by Douma et al., (2006) and Sivathaasan (2013), would indicate that the tendency to avoid
31
taxes and harm the firm’s reputation in the market is rather unlikely in the case of domestic
corporate ownership.
By this the next hypothesis is:
H3: Domestic corporate ownership of Indonesian mining firms has a negative effect on tax
avoidance.
2.4.5 Domestic Institutional Ownership
As emphasized before, one should differentiate between the effects of domestic corporate and
domestic institutional ownership on the firm due to their different resource abilities and views. In
this section, this study refers also to literature regarding domestic institutional ownership and firm
performance as well as governance in order to be able to link domestic institutional ownership’s
probable effect on tax avoidance and to indicate the direction of their relationship.
In the case of the Malaysia, after the Asian Financial Crisis of 1997, institutional investors
seem to have contributed highly to Malaysia’s shareholder protection (Wahab & Rahman, 2009).
Additionally, Aggarwal et al. (2011) found in their research that international institutional
investors contributed significant positively to firm-level governance. They were more likely to
terminate CEOs, who performed poorly and increased valuation over time.
Graham et al. (2014) claimed that firms with high institutional ownership tend to care more
about the financial reporting consequences of tax planning approaches and regard the negative
impact of financial accounting risk as important. Other papers (e.g., Boone & White, 2015) found
that institutional investors additionally monitor management disclosures, which also benefits other
shareholders, and this leads to lower agency costs. Furthermore, institutional investors like
financial ones are typically monitored themselves by public authorities. Krivogorsky (2006)
investigates the role of institutional owners on firm profitability of 87 firms and found a positive
relationship.
According to Thomsen and Pedersen (2000) institutional owners are known for their arm’s
length relationships with the firms and are specialized as owners, by this they contribute to
shareholder value and performance. Though they seem to not necessarily have large ownership in
the firms, other study results as well have supported Thomsen and Pedersen’s (2000) hypothesis
as quoted by themselves (McConnell and Servaes 1990; Levin and Levin 1982; Nickel et al.,
1997).
32
Douma et al. (2006) emphasize that in emerging and transition economies such as
Indonesia external mechanisms are less well-developed, so the effects of institutional owners on
firms’ performance might be different. According to their study, the results between domestic
corporate owners and domestic institutional owners differ, being the domestic corporate owners
the only ones significantly affecting firm performance positively. The same is argued by Aggarwal
(2017) stating that the level of domestic institutional role on firm’s governance or performance
depends not only on the firm but also countries legal environment. Furthermore, Aggarwal’s
(2017) results show that rather foreign instead of domestic institutional investors lead to an
independent board of directors and that domestic institutional investors are the main contributors
towards improved governance in common law counties, whereas in civil law countries rather
foreign institutional investors provide a positive effect on firm’s governance improvement.
When taking the agency perspective, if the firm performance and value seems not to be a
goal (Douma et al., 2006; Giannetti & Laeven 2009), one can assume that rather personal benefits
such as tax avoidance benefits are more relevant for this type of owner.
Bayar et al. (2018) and Huseynov and Klamm (2012) investigated the relation between
institutional ownership and tax avoidance. Both study findings show that institutional ownership
leads to tax avoidance. Huseynov and Klamm (2012) include the aspects of institutional owners
on firms CSR and find that they are negatively correlated with firm’s CSR strength and community
concerns. First, they argue that the positive relationship could be due to the institutional owners
greater monitoring of managers and requirements of them to reduce taxes, in order to increase
shareholder value. Nevertheless, since their results showed that institutional ownership does not
contribute to CSR aspects (support for charities via e.g. tax savings, ownership transparency, tax
audits, limited compensations) and to community concerns, one can assume that institutional
owners would reduce taxes for own benefits.
Bayar et al. (2018) found a positive effect of institutional ownership on tax avoidance,
which is stronger for firms with strong governance. Those have significant higher shelter scores,
meaning they take advantage of tax shelters. This effect seems to be based on the fact that
institutional ownership in firms with strong governance are able to manage taxes well such as
using tax shelters and this leads to the reduction of the firm’s financial distress. If the firm has bad
corporate governance, tax avoidance would then only benefit specific parties such as managers
and this would be overlooked in such environments with weak monitoring. But in a good corporate
33
governance environment, the interests of the firm’s parties are aligned and shareholder value can
be created with tax avoidance (Bayar et al., 2018)
Considering above findings leads to the assumption that institutional ownership in
Indonesia would rather lead to tax avoidance, since the country deploys the civil law46 with weak
shareholder protection. Prior research also indicates that domestic institutional ownership does not
lead to firm performance, hence the owners might not intent to achieve long horizon goals for the
firm. Rather tax avoidance could be on the agenda to ensure short-term goals such as tax savings
or refunds. Second, domestic institutional owners also tend to have more resources than domestic
corporate ones. Thus, they would be able to afford good tax management and experts in order to
avoid taxes efficiently.
The above-mentioned findings lead to the following hypothesis:
H4: Domestic institutional ownership of Indonesian mining firms has a positive effect on tax
avoidance.
2.4.6 Foreign Ownership
The other group of large shareholders are foreign investors. Foreign owners tend to have large
shareholdings in emerging countries (Douma et al., 2006). Moreover, Kang and Stulz (1997) found
that foreign holdings in firms with large export sales was substantial. Taking these findings into
consideration one could assume that mining firms in Indonesia, due to the export sales and the
emerging market, would by this be largely owned by foreign owners. On the other hand, other
studies state that in countries with poor shareholder protection, firms seem to be largely owned by
officers, directors or families (Dahlquist & Robertsson, 2001). More research is required to provide
a better overview regarding the ownership in emerging countries.
Douma et al. (2006) observed that foreign owners show a significant positive relation
towards firm’s performances, which is supported by Dharwadkar et al. (2000). They observed that
foreign investors (outsiders) could solve expropriation conflicts and reduce expropriation
problems, especially because they tend to be watched by the government and by this are more
46 Silitonga, G., I., L., Candra, S., Hamzah, H., Roosdiono & Partners (2018). Legal systems in Indonesia: overview. Thomson
Reuters Practical Law. Retrieved from https://uk.practicallaw.thomsonreuters.com/w-010-
7310?transitionType=Default&contextData=(sc.Default)&firstPage=true&bhcp=1
34
constrained compared to domestic investors. Hence, due to the higher monitoring by the
government, they might not be keen to apply aggressive tax avoidance techniques
According to Love et al. (2009) foreign owners can provide competitive advantage, which is
knowledge based. They argue that foreign owned firms perform better than domestic owned firms.
Nevertheless, the findings of Dahlquist and Robertsson (2001) showed that there was no
significant effect of foreign investments on firms’ ROA and beta. According to the study results
of Douma et al. (2006), foreign shareholders have a positive effect on firm performance,
nevertheless this could also be explained by the fact that foreign firms might choose well
performing corporations. Another advantage according to them is that foreign shareholders are
capable of using the institutional environments for their advantage with their resources and skills.
The findings, which state that foreign ownership adds to firm specific variables such as
performance, could indicate that those firms on the other hand might not require tax avoidance
techniques in order to retain revenue. They would be able to increase their revenues by their
performance and resources like knowledge. On the other hand, firms with high net profit before
tax might not want to lose much money on corporate taxes. One of the few studies addressing
foreign holders and tax avoidance is Demirgüç-Kunt and Huizinga (2001). They found that foreign
shareholders have a positive relationship towards tax avoidance. Due to simplified international
portfolio investments and regulations as well as foreign branches, they are able to make use of
foreign tax credits and profit shifting opportunities. The positive relationship is also supported by
Van Gelder et al. (2016), who observed that the mining firms in their study have a Dutch company
as ultimate foreign holding company. They found that foreign holders rather lead to tax avoidance
by e.g. paying dividend to Dutch holding firms. Via the holding firms it is not easy to follow the
transactions and with the benefit of foreign tax credits, they aim at reducing earnings. They seek
to benefit by the tax savings. Positive association between foreign shareholders and tax avoidance
is also supported by Annuar et al. (2014). In their research on ownership structure and tax
avoidance in Malaysia, they found a positive relationship supporting the findings of Van Gelder
et al. (2016) and Demirgüç-Kunt and Huizinga (2001).
By this, our hypothesis is:
H5: Foreign ownership of Indonesia mining firms has a positive effect on tax avoidance.
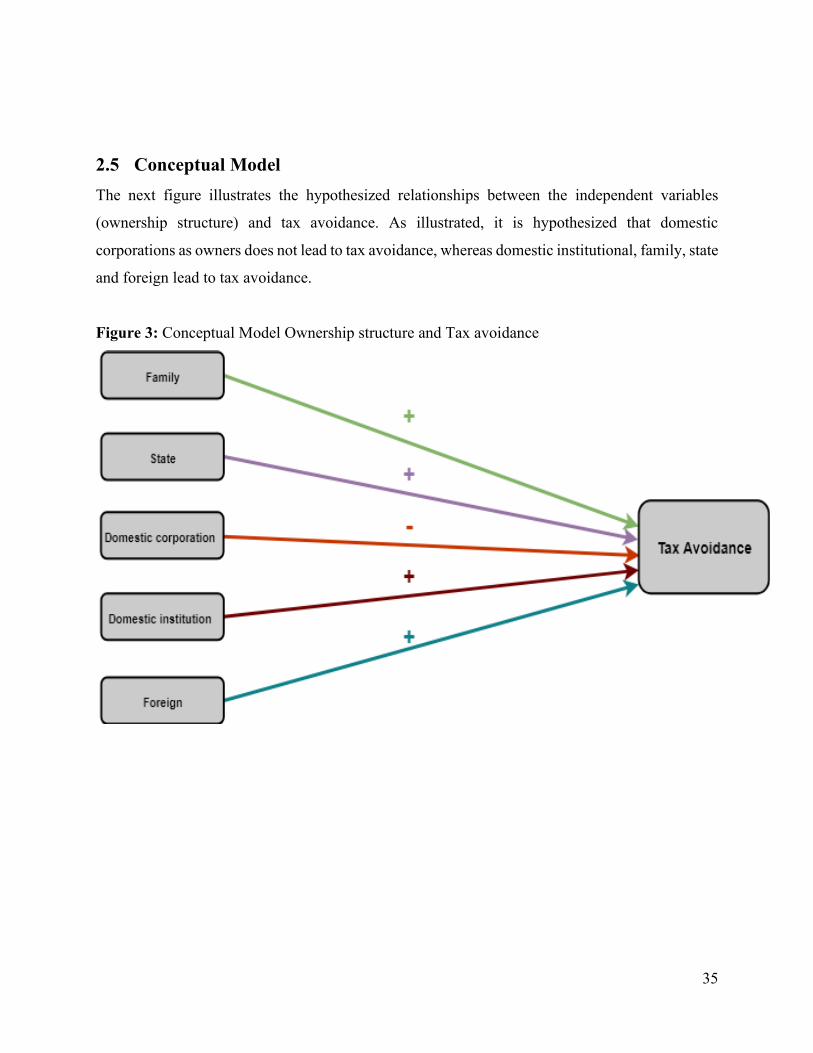
35
2.5 Conceptual Model
The next figure illustrates the hypothesized relationships between the independent variables
(ownership structure) and tax avoidance. As illustrated, it is hypothesized that domestic
corporations as owners does not lead to tax avoidance, whereas domestic institutional, family, state
and foreign lead to tax avoidance.
Figure 3: Conceptual Model Ownership structure and Tax avoidance
36
3 RESEARCH METHODOLOGY
This section provides the research method of this study, the strategy in acquiring the data and the
selection of the dependent, independent and control variables used in this study.
3.1 Methodology
3.1.1 Methods Used in Prior Studies
Thus far, most prior research studying ownership structure of firms applied regression analysis.
There are different methods to apply regression analysis.
Ordinary Least Squares Regression (OLS)
The ordinary least square method (OLS) is applied in linear regression and aims at determining
the line of best fit, i.e., minimizing the squared residuals determined by the deviation from this line
(Singh, 2015). This method studies the relationship between one dependent variable and several
independent variables. In case one wants to study the relationship between several independent
and dependent variables, the Multiple OLS regression is suitable. The goal is to calculate the
lowest sum of squared variances in order to find the linear relationship, i.e., the plane of best fit.
This process is also called the least square estimation (Singh, 2015). Regarding the least square
method in general, it is required that the independent variables need to be uncorrelated and perfect
correlation or multicollinearity (case of linear relationship between independent variables) make
the method impractical (Singh, 2015).
Badertscher et al. (2013), Jian et al. (2012), Richardson et al. (2016) and Sudibyo and Jianfu
(2016) applied OLS regression during their analysis of the relationship between ownership
structure and tax avoidance. The authors used panel data. Panel data is a set of data that examines
a sample over time enabling multiple observations on each unit of study (Hsiao, 2003). This
approach enables to produce more precise predictions for individual outcomes than only time
series. One can learn about one units behaviour when examining the others, in case the individual
units behaviours are similar conditional on certain variables (Hsiao, 2003).
Baderstscher (2013) added the Heckmann method to the OLS and used a two-stage
estimation procedure with the probit regression to correct for selection biases. Baderstscher’s
(2013) data on ownership structure and tax avoidance is based on firms which are owned by private
37
equity firms or management teams. Although they argue that private equity firms’ choices for
acquiring firms are not random (e.g., might be related to target firms’ tax planning), hence selection
bias might occur. In the first stage, they control for variables such as the firm’s age as predictors
for private equity ownership. They add the estimated coefficients of the first equation to the second
equation in order to observe the relationship of ownership structure and tax avoidance.
Other literature use the fixed-effects/random-effects model (Fernández-Rodríguez et al.,
2019) to study the relationship between ownership structure and tax avoidance. In other studies,
the logistic regression is chosen or added to the OLS to observe for the likelihood of tax avoidance
using other factors such as usage of tax shelters or proportion of outside board members
(Bennedsen & Zeume, 2015; Desai & Dharmapala, 2009; Richardson & Lanis, 2011).
A problem with linear regression such as OLS that this method assumes that the relation
of the dependent variable is linear. Generalized Linear Model methods like probit and logit
regression are able to capture the nonlinearities better than the linear approach (Singh, 2015). In
addition, the theory assumes that the error term has constant variance across all observations. The
errors are assumed to be homoscedastic. But not in all cases are all lines straight. If there is no case
of homoscedasticity than heteroscedasticity exists, which assumes that the variability in the error
is different across observations. Heteroscedasticity is typically accounted for by assuming that the
error variance depends on an underlying (in)dependent variable..
Generalized Linear Models (GLM)
The generalized linear model is an extension of OLS. The difference is that GLM incorporates
also non-normal and non-interval outcome variables. The error component is independently
distributed with a mean of zero and constant variance (Gill, 2011). Compared to standard linear
regression, the generalized linear regression uses a function of the mean of Y (link function)
instead of using Y as the outcome. GLM helps to predict categorical variables (Gill, 2011)47. The
next type of regressions Logistic and Probit belong to the GLM.
47 Martin, G. (nd). The Difference Between Logistic and Probit Regression. Retrieved from
https://www.theanalysisfactor.com/the-difference-between-logistic-and-probit-regression/
38
Logistic Regression
This approach is different than standard regression. Here the maximum likelihood method is
applied instead of the least squares method. Logistic regression is used for classification, providing
classifications of observations in order to figure out whether observed and predicted events match.
This method is about predicting odds. The odd ratio gives the frequencies, which indicate to which
category the dependent variable belongs to (Singh, 2015). In other words, with logistic regression
the aim is not to find a specific numerical value of the dependent variable but the probability that
it is rather 1 than 0. Logit transformation is used to predict values within these units and here p
then can range between – ∞ to + ∞ to find out whether the log (odd) is a linearly related
independent variable (Singh, 2015). Since logistic regression deals with probability of events
occurring (occurring or not occurring) the relationship of the variables is S-shaped instead of linear
(Cramer & Howitt, 2011). The coefficient in the logistic regression displays the change in the logit
based on every change of one unit in the predictor variable. Then the coefficient is transformed
into estimated odds ratio in order to estimate the likelihood of occurrence (Cramer & Howitt,
2011).
In theory, one should use logistic regression if one assumes that the categorical/
dichotomous variable reflects an underlying qualitative variable, hence logistic regression uses
binomial distribution (Singh, 2015). In the study of Richardson and Lanis (2011), the authors
applied both techniques, OLS and logistic regression, to study the effect of board of directors on
tax avoidance. Both methods yield the same conclusion that having outside directors reduces the
chances of tax avoidance. Nevertheless, studies covering ownership structure and tax avoidance
did not apply logistic regression, rather OLS or the fixed and or random-effects method.
Probit Regression
Probit regression is related and thus similar to logistic regression. This method transforms the
original variable to predict the categorical dependent variable. Also here, the maximum likelihood
estimation is applied. The difference between logistic model and probit model is that in the probit
model normal distribution is assumed and it uses cumulative distribution function of the standard
normal distribution, whereas the logistic regression uses cumulative distribution function of the
logistic regression. Simply put, probit regression assumes normal distribution and logistic
regression a binominal distribution (Singh, 2015). Another difference between probit and logistic
39
regression is that probit applies an inverse normal link function and the logistic one uses natural
log of the odds ratio for the transformation48.
Both the logistic and probit regression use the binary distribution of 1 or 0 and both provide
similar results, hence decision which method to use is based on own interpretation (Singh, 2015).
Bradshaw et al. (2016) and (McGuir e et al., 2014) applied the probit regression when studying
ownership structure and tax avoidance, although they did not apply the method directly to study
the effect of ownership structure on tax avoidance. They apply it to other variables’ relationship
effects and their probability, which are related to the hypotheses about ownership type and tax
avoidance. By this they want to avoid biases in their results. For instance, they applied the probit
model to investigate whether the state-owned firm’s tax decisions influence the likelihood that the
firm’s manager is promoted (Bradshaw et al. 2016) or whether factors such as belonging to a media
industry on an IPO date or the state taking over laws during incorporation affect the probability of
establishing a dual class ownership structure on the IPO date (McGuire et al., 2014).
Fixed-Effects and Random-Effects Method
The fixed-effects method (FE) or random-effects method (RE) are used to account for group-level
variations. In many cases, the dependent variable’s variations might not only be explained by the
independent variables. Ignoring the nature of other observations might lead to poor and unfit
results of the regression (Clark & Drew, 2015). Here, FE and RE methods can be applied in order
to control not only for additionally individual influences but also the influence of the difference
between them. Changes of the variables over time can be assessed as well (Cooper et al., 2013).
According to Clark and Drew (2015) the random-effects models could reduce the variance
of estimates of coefficient but at the same time they can introduce bias under certain conditions.
Fixed-effects estimates are not biased, but may be subject to high sample dependence. With the
absence of a fixed-effects method it is assumed that the study is gathered from a random sample
and not a common population. In the RE method, the variance in effect size does not only reflect
the sampling error (which is the case with the FE method), but also includes the study-level random
influences. Hence, if it is assumed that there are additional random error sources, then one should
decide for the RE model. If one seeks to observe effects about units which are not in the dataset,
48 Martin, G. (nd). The Difference Between Logistic and Probit Regression. Retrieved from
https://www.theanalysisfactor.com/the-difference-between-logistic-and-probit-regression/
40
FE method is not applicable, since the effects of unobserved units are unknown. In the RE on the
other hand this is possible (Cooper et al., 2013).
There is another difference between both methods. In the case of the FE, the assumption is
that the true effect size of all studies is equal. If the size varies then it is so because of the error in
estimating the effect size (within-studies estimation error). Therefore smaller studies information
can be ignored because larger studies with the same effect size provide better information
(Borenstein et al., 2010). In other words, larger studies are given more weights.
On the contrary, the RE model does not provide one true effect estimate, but estimates the
mean of the effects distribution. It is assumed that all studies have a different effect size, hence
between studies is incorporated and the study results are not highly effected by specific studies
with high weights. Additionally to base the weights on within-study variance, the RE adds a
constant T2 for between-study variance and mitigates the relative differences among the weights
(Borenstein et al., 2010).
Given that the FE method assumes that every study has a common true effect size, it
assumes homogeneity. Nowadays researchers contradict each other and argue that this specific
assumption should not necessarily imply the validity of the FE, so the method can be applied
without making this assumption (Borenstein et al., 2010).
There is still little consistent guidance in research regarding deciding which model to use
(Clark & Drew, 2015). One indication is if one expects additional random effects influences on
the regression variances, then the RE is more appropriate (Cooper et al., 2013). It is also possible
to apply both methods simultaneously in order to address differences among the methods results
and the research findings and interpretation (Cooper et al., 2013). Nevertheless, deciding for FE
or RE seems to be subject to interpretation in research (Lai & Teo, 2008).
One way to help deciding which method to use, is applying the Hausman test. The Hausman test
investigates whether there is correlation between the variables and the unit specific effects. In case
the independent variables are correlated with the unit specific effects, the null hypothesis of the
test can be rejected and the FE should be applied instead of the RE method (Cooper et al., 2013).
If there is correlation than bi-directional causality exists. This is known as the endogeneity problem
(Kendall, 2015). In our case for instance there would be endogeneity if ownership structure is also
determined by tax avoidance.
41
Nevertheless, one needs to consider that there might always be some correlation between
explanatory variables and unit effects. No rejection of the null hypothesis does not necessarily
mean correlation is zero but that there might be weak statistical power to differentiate between
small and zero correlation (Clark & Drew, 2015).
Fernández-Rodríguez et al. (2019) applied the Hausman test in order to determine whether
individual effects are correlated with the independent variables. Although the test suggested the
usage of the FE method in their study, they chose for random RE because the FE approach does
not allow for estimating the beta of the constant variables over time.
3.1.2 Method of Current Study
This study starts with a univariate analysis of the descriptive statistics. Afterwards a multiple
regression analysis is applied with a panel data method. The technique for the panel data analysis
here can be once the FE method and once the RE method. Applying pooled OLS model would not
be appropriate since that method would ignore the time and individual aspects of the data49 (Hsiao,
2003). OLS would fail in this case to explicitly account for the distinctive characteristics of the
panel data set (Cooper et al., 2013).50 Also, OLS does not control for unknown variables (Pilos,
2017). Nevertheless, to allow for comparison and additional robustness this study applies another
model called first-difference. This method consists of OLS applied to the data, which is generated
with the differences in variable values among the consecutive years.
Model 1.
For the first model, this study applies the Durbin Wu Hausman test to find out which model
specification (RE or FE) to choose, similar to Fernández-Rodríguez et al. (2019).
For both, either RE or FE, a two-way error component model is applied. This model inspects the
unobservable individual-specific effect as well as the unobservable time-specific effect (Baltagi,
2008; Fitrianto & Musakkal, 2016; Wallace & Hussain, 1969) and can be applied for both the
fixed-effects and the random-effects (Baltagi, 2008; Fitrianto & Musakkal, 2016).
49 Alam, M. (2020). Panel data regression: a powerful time series modeling technique. Retrieved 02 July, 2020 from
https://towardsdatascience.com/panel-data-regression-a-powerful-time-series-modeling-technique-7509ce043fa8 50 Alam, M. (2020). Panel data regression: a powerful time series modeling technique. Retrieved 02 July, 2020 from
https://towardsdatascience.com/panel-data-regression-a-powerful-time-series-modeling-technique-7509ce043fa8
42
The following model equation for panel data models with several independent variables is applied
(Fitrianto & Musakkal, 2016):
𝑌𝑖𝑡 = 𝛽0 + 𝛽1𝑥1,𝑖𝑡+ . . . +𝛽𝑘𝑥𝑘,𝑖𝑡 + 𝜇𝑖 + 𝜆𝑡 + 𝜈𝑖𝑡
where
𝑌= dependent variable
𝑖= denoting cross-sectional dimension (firm)
𝑡= denoting time
𝑥𝑖𝑡= vector of explanatory variable observations
𝛽𝑘= regression coefficients of the independent variables
𝜇𝑖 = unobserved individual specific effect
𝜆𝑡 = unobserved time specific effect
𝜈𝑖𝑡 = zero mean random disturbance with variance 𝜎𝑣2
The first panel data regression model contains the relationship between tax avoidance, and the
ownership structure and control variables.
Each of these variables for company 𝑖 over year 𝑡 are defined in the upcoming section variable
measurement and definitions.
Model 2.
Since this panel data covers 15 years, it is beneficial to examine the yearly changes in the tax
avoidance proxies as function of the yearly changes in the ownership structure and control
variables. This can be done by the first-difference method, which is based on the OLS equation
(Harvey, 1980).
Thus, the second model runs with the first-difference method. The aim is to examine how
the variables and the relationship towards the dependent variables change in average over time. So
instead of explaining the level of the dependent variable, this model explains the changes of it
(Harvey, 1980; Wooldridge, 2010). This transformation takes first differences: variable at time 𝑡
𝑇𝐴𝑋𝐴𝑉𝑂𝐼𝐷𝑖𝑡 = 𝛽0 + 𝛽1𝐷𝑂𝑀𝐶𝑖𝑡 + 𝛽2𝐷𝑂𝑀𝐼𝑖𝑡 + 𝛽3𝐹𝑂𝑅𝑖𝑡 + 𝛽4𝐺𝑂𝑉𝑖𝑡
+𝛽5𝐹𝐴𝑀𝑖𝑡+𝛽6𝑆𝑖𝑧𝑒𝑖𝑡 + 𝛽7𝐷𝐸𝐵𝑇 𝑅𝐴𝑇𝐼𝑂𝑖𝑡 + 𝛽8𝑅𝑂𝐴𝑖𝑡 + 𝜇𝑖 + 𝜆𝑡 + 𝜈𝑖𝑡
43
minus value of the same variable at time 𝑡 − 1 (Harvey, 1980; Longhi & Nandi, 2019; Wooldridge,
2010).
The drawback is that some observations are dropped out because of the differencing (T-1),
meaning first year value would be missing (Wooldridge, 2010). In this model, also the individual-
specific effect cancels out because they are the same over the years and coefficient of time invariant
variables cannot be identified here (Longhi & Nandi, 2019). In this study for instance, the changes
of the dependent variable cannot be driven by the individual-specific effect firm id, because id is
time invariant and cannot change over time and. Hence, firm id cannot change the dependent
variable. Because of that the first-difference method could provide a better estimate for the causal
effect measurement. A comparison between the two-way error component model and this model,
hence a comparison between the effect of the explanatory variables on the dependent variable itself
and once on its change, can provide more insights and robustness.
The following formula is followed (Harvey, 1980; Longhi & Nandi, 2019; Wooldridge, 2010)
(Harvey, 1980; Longhi & Nandi, 2019):
The analyses are performed with the statistics software Stata. The thesis’s panel data is unbalanced,
since we miss data from some companies for given years.
3.2 Variable Measurement and Definitions
In this section, all variable measurements and definitions are provided as well as justification of
selection. The section is followed by an overview of the measurements and definitions presented
by Table 3.
3.2.1 Dependent Variables
Tax Avoidance
For this study, several proxies to study tax avoidance behaviour of the mining firms are used,
which improves the robustness of the studys results.
Δ𝑇𝐴𝑋𝐴𝑉𝑂𝐼𝐷𝑖𝑡 = 𝛽0 + 𝛽1Δ𝐷𝑂𝑀𝐶𝑖𝑡 + 𝛽2Δ𝐷𝑂𝑀𝐼𝑖𝑡 + 𝛽3Δ𝐹𝑂𝑅𝑖𝑡 + 𝛽4Δ𝐺𝑂𝑉𝑖𝑡
+𝛽5Δ𝐹𝐴𝑀𝑖𝑡+𝛽6Δ𝑆𝑖𝑧𝑒𝑖𝑡 + 𝛽7Δ𝐷𝐸𝐵𝑇 𝑅𝐴𝑇𝐼𝑂𝑖𝑡 + 𝛽8Δ𝑅𝑂𝐴𝑖𝑡+ 𝜈𝑖𝑡
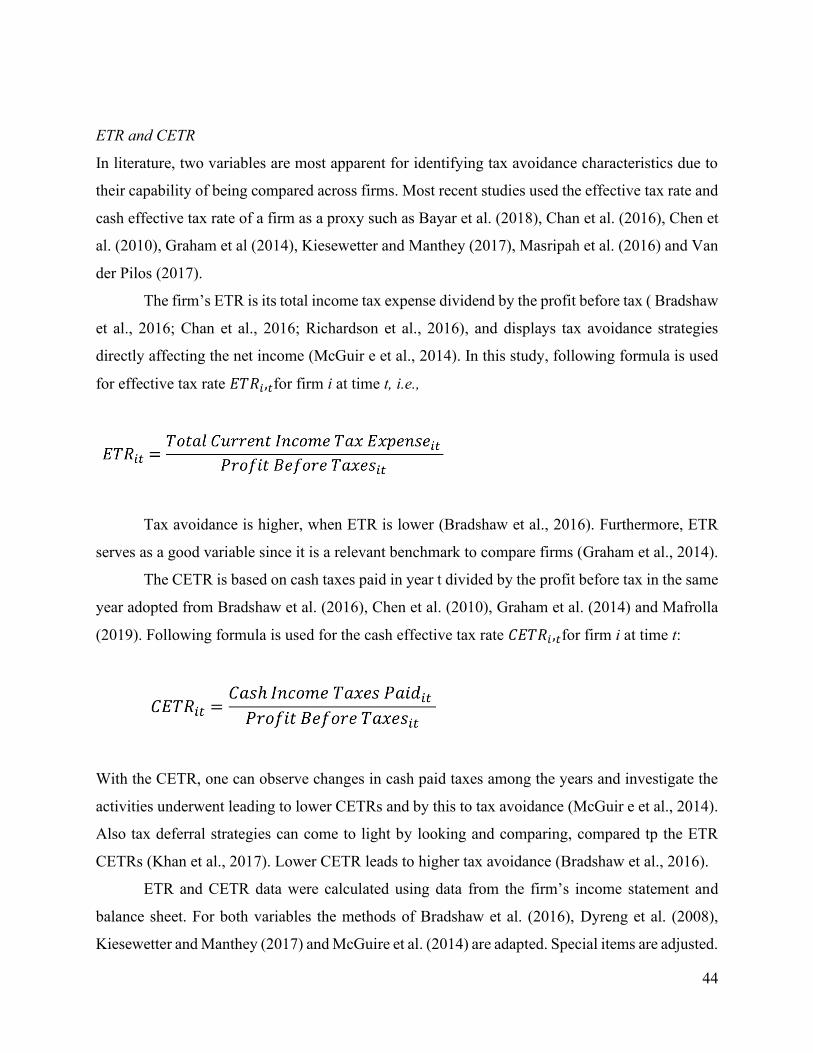
44
ETR and CETR
In literature, two variables are most apparent for identifying tax avoidance characteristics due to
their capability of being compared across firms. Most recent studies used the effective tax rate and
cash effective tax rate of a firm as a proxy such as Bayar et al. (2018), Chan et al. (2016), Chen et
al. (2010), Graham et al (2014), Kiesewetter and Manthey (2017), Masripah et al. (2016) and Van
der Pilos (2017).
The firm’s ETR is its total income tax expense dividend by the profit before tax ( Bradshaw
et al., 2016; Chan et al., 2016; Richardson et al., 2016), and displays tax avoidance strategies
directly affecting the net income (McGuir e et al., 2014). In this study, following formula is used
for effective tax rate 𝐸𝑇𝑅𝑖,𝑡for firm i at time t, i.e.,
Tax avoidance is higher, when ETR is lower (Bradshaw et al., 2016). Furthermore, ETR
serves as a good variable since it is a relevant benchmark to compare firms (Graham et al., 2014).
The CETR is based on cash taxes paid in year t divided by the profit before tax in the same
year adopted from Bradshaw et al. (2016), Chen et al. (2010), Graham et al. (2014) and Mafrolla
(2019). Following formula is used for the cash effective tax rate 𝐶𝐸𝑇𝑅𝑖 ,𝑡for firm i at time t:
With the CETR, one can observe changes in cash paid taxes among the years and investigate the
activities underwent leading to lower CETRs and by this to tax avoidance (McGuir e et al., 2014).
Also tax deferral strategies can come to light by looking and comparing, compared tp the ETR
CETRs (Khan et al., 2017). Lower CETR leads to higher tax avoidance (Bradshaw et al., 2016).
ETR and CETR data were calculated using data from the firm’s income statement and
balance sheet. For both variables the methods of Bradshaw et al. (2016), Dyreng et al. (2008),
Kiesewetter and Manthey (2017) and McGuire et al. (2014) are adapted. Special items are adjusted.
45
In case firm’s ETR or CETR is below zero or above one, they are set equal to zero (one) and the
measures of tax avoidance (ETR and CETR) are winsorized to be between 0 and 1.
Profit Before Tax
Although profit before tax (PBT) is not considered as a proxy variable or indicator for tax
avoidance in literature, except in the report of Van Gelder et al. (2016), this study considers this
variable as a relevant proxy. This study argues the following. It is questionable and dubious if a
firm mentions negative PBT on its financial statement for many years, especially a mining
company, which apparently contributes to a large extend to Indonesia’s GDP and export earnings
due to its operations. PBT could be an indicator that the firm tends to decrease its profit before tax
continuously on purpose in order to avoid paying income taxes. Hence, the firm might shift/ tunnel
the profit like Enron did for instance51, in order to reduce the amount and to probably even receive
tax refunds. For instance, mining companies could misreport volumes and values of assets or prices
of commodities to shift the profits. Profit could also be shifted via reports of patent and royal
payments to jurisdictions with lower tax rates as elaborated before, or interest payments (Van
Gelder et al., 2016).
Thus, another indirect variable for tax avoidance is the continuous variable firm’s profit
before tax. Therefore, the yearly profit before tax (PBT) of the firms is gathered and it is
investigated whether specific type of owners lead to lower PBT.
3.2.2 Independent Variables
This section covers the measurement methods of the independent variables, control variables and
dummy variables (individual-specific and time-specific).
Ownership Structure
A major share of literature concerning ownership structure applies dummy variables instead of
percentages of shares of the controlling owner (among others Chan et al., 2016; Cullinan et al.,
2012; Mafrolla 2019; Maury 2006; Peljhan et al., 2020; Pindado et al., 2008; Prabowo et al., 2014;
51 Johnston, B., D. (2003). Tax Shelters Helped Enron Fabricate Profits, Senate Is Told. The New York Times. Retrieved from
https://www.nytimes.com/2003/02/13/business/tax-shelters-helped-enron-fabricate-profits-senate-is-told.html
46
Sacristán-Navarro et al., 2011; Sudibyo & Jianfu 2016). Nevertheless, the authors did not provide
justifications for the selection of dummy variables. Other literature uses percentages of shares (Al-
Fayoumi and Abuzayed 2009; Gaaya et al., 2017; Saleh et al., 2017; Unite & Sullivan 2003).
For the sake of robustness, this study uses percentages of shares hold by the controlling owners as
well as dummy variables for all type of owners. Thereby, this study can compare the results with
different studies. For all type of owner variables this study follows Al-Fayoumi and Abuzayed
(2009), Chen et al. (2010), Kim and Ouimet (2014), Maury (2006) and Sudibyo and Jianfu (2016)
and considers a controlling holder if the holder owns 5 % or more shares of the firm (note: firms
might have several controlling owners in the considered period).
The database of Orbis helps to identify the firms’ owners. In Orbis, following abbreviation are
used for type of owners 52:
F = Financial company
B = Bank
Z = Public S = Public authority, state, government
I = One or more named individuals or families E = Mutual and pension fund, nominee, trust, trustee
C = Corporate A = Insurance company
In order to avoid misinformation, the types given by Orbis were compared with financial reports
and other internet sources before using the ownership data in the analysis. Nevertheless, on a
number of occasions during the data collection, some given type of owners were not accurate. For
instance, whereas Orbis indicated corporate ownership, the owner was an institutional owner
instead. Also, unfortunately Orbis does only have ownership data for couple of past years. Hence,
financial reports and other internet sources were used in order to find the type of owner in a given
year.
Family Ownership
Since family ownership is not directly measurable, indirect variables are used. This study codes
one if family members control more than 5 % of the firm and zero otherwise. Nevertheless, finding
ownership information regarding family members is difficult and due to lack of sufficient data,
this study counts an individual owner owning 5 % or more also as family owner (similar to the
study of Masripah et al., 2016; Maury & Pajuste, 2005; Pindado et al., 2008; Thomsen & Pedersen,
52 Orbis Database
47
2000). Other papers defined firms as family owners if they are not owned by other ownership types
such as state and companies (Lee et al., 2018).
State Ownership
Regarding the ownership by the state, the measurement method as suggested by Chan et al. (2016),
Mafrolla (2019), Prabowo et al. (2014) and Sudibyo and Jianfu (2016) is applied. The firm is state-
owned if the state holds more than or equal to 5% of the firm’s shares.
Domestic corporate, domestic institutional and foreign investor ownership
For the selection of the independent variables, the explanatory variables used by Douma et al.
(2006) are adopted. Their study covered the effect of different types of owners on firm performance
in emerging markets including the impact of domestic and foreign shareholders. They distinguish
the domestic owners into corporations and institutional ones and add the business group affiliation
of the firms. This study’s indication regarding domestic and foreign owners is based on their
variable indications.
For the domestic ownership, they choose the abbreviations DOM for domestic owners, and
FOR for foreign owners. Assuming there is a difference between corporate and institutional
holders, they divide it further into foreign institutional owners (FORI) and foreign corporate
owners (FORC) as well as domestic institutional (DOMI) and domestic corporate owners
(DOMC). In contrast, in this thesis the focus lies on foreign owners in general, i.e., it distinguishes
FOR with domestic institutional (DOMI) and domestic corporate owners (DOMC). FOR, DOMC
and DOMI are controlling holders if they own more or equal to 5% of the firms’ shares.
By institutional owners this thesis defines banks, insurance firms, pension funds and
mutual funds as also suggested by Aggarwal et al (2011), Aguilera and Jackson (2011), Douma et
al. (2006), Saghi-Zedek and Tarazi (2015). Although Saghi-Zedek and Tarazi (2015) excluded
banks in its definition and added it as separate independent variable.
Public Ownership
This study covers public Indonesian Mining companies trading in the IDX stock exchange, hence
the firms are also owned by minority owners. The listed companies add the ownership hold by all
minority shareholders, who own less or equal to 5%, together and provide the number in their
48
annual reports. In case the total amount of public ownership is 5% or more, it is as well considered
as controlling ownership in this study. In this dataset, public ownership seems to be a controlling
owner in 97% of the cases. Reporting the effects of public ownership might as well reveal
noteworthy findings as well, since public ownership of the Indonesian mining companies stands
for the total of all minority shareholders. As stated earlier, minority and majority shareholders
interest might differ and as the agency theory argues, majority (controlling) shareholders might
make decisions serving personal interests and exploit minority shareholders. Therefore, the
findings on public ownerships effects on tax avoidance might be different. Nevertheless, no
direction of public ownership is hypothesized in this study. The inclusion of this variable is solely
for the sake of completeness of the data since all ownerships having 5% or more shares are
accounted for in this study. Notable is that no prior research referred to in this study about
ownership structure, covered the aspects of public ownership.
Public ownership is reported as percentages as well as dummy variable just like the other
ownership types. For this variable the abbreviation PUB is used.
Control Variables and Dummy Variables
Other variables that might have an effect on the relationship between the firm’s ownership
structure and tax avoidance, are tested in order to check for the robustness of the empirical results.
These are the firm-level factors size, leverage and ROA.
Size
Large firms might be keener to benefit from economic of scale by tax avoidance. Also there is the
assumption that larger firms might have more resources than smaller firms in order to have good
tax planning mechanisms and by this are able to reduce taxes (Shevlin & Porter (1992) as cited by
Chan et al. 2013). Although due to larger size, firms might also fear reputational damage, which
might prevent tax avoidance (Chan et al., 2013).
Prior papers apply different methods for size. They use natural log of sales. Some use
natural log of totals assets (Aggarwal et al., 2011; Al-Fayoumi & Abuzayed 2009; Huseynov &
Klamm 2012; Richardson et al., 2016), whereas some other studies used natural log of sales, such
as Douma et al. (2006) and Maury (2006). Others apply the log of the market value of equity as
49
proxy for size (Suk & Zhao, 2017). This study follows Douma et al. (2006) and Maury (2006) and
use natural log of sales as indicator for firm size.
Leverage
Due to the tax deduction benefit of debt the firm might not engage in additional tax savings by
lowering ETR and CETR. In case of lower ETR and CETR, one could argue that the firm does not
prefer debt financing and uses other tax deduction mechanism such as tax shelters, which is
supported by the study of Lim (2011). They found a negative impact of tax avoidance on the cost
of debt of Korean firms. Also Graham and Tucker (2006) report that firms engaging in tax shelters
use less debt. Thus tax avoidance might replace the need of tax deductions by debt. Hence, firms
with high debt ratio probable have higher ETR and CETR.
Firms leverage can be assessed by using the ratio long-term liabilities divided by total
assets (Badertscher et al., 2013; Bayar et al., 2018; Gaaya et al., 2017; Landry et al., 2013;
Masripah et al., 2016; Richardson et al., 2016; Tang, 2019). Other studies, which covered
ownership structure and specific firm characteristics applied the debt to equity ratio total debt to
equity (Saleh et al., 2017) or total debt divided by total asset (Annuar et al., 2014; Fernández-
Rodríguez et al., 2019; Gaaya et al., 2017; Peljhan et al., 2020; Ruiz-mallorquí & Santana-martín
2011; Sacristán-Navarro et al., 2011; Sivathaasan 2013). This study applies the measurement
method long-term liabilities by total assets to control for firm’s leverage.
ROA
Profitable firms with high returns might prefer locking their revenue by tax avoidance tactics. The
study of Huseynov & Klamm (2012) found a negative relation between ROA and ETR, though the
effect of ROA on CETR was positive. Another view here would be that profitable firms also would
fear losses due to e.g. reputation and bad branding when linked to tax avoidance behaviours
indicating a positive effect on CETR and ETR. Firm’s profitability can be measured by using
different methods. The most common ones are the firm’s ROE, ROA and Tobin’s Q.
This study uses ROA as firm’s profitability similar to Douma et al. (2006), Gaaya et al. (2017),
Huseynov & Klamm (2012), Maury (2006) and Thomsen and Pedersen (2000) and uses the ratio
profit before tax by total assets (Brown & Caylor 2006; Gaaya et al., 2017; Richardson et al.,
2016). To note is that ROA is not used as controlling variable in the regression analysis with the
50
independent variable profit before taxes. ROA is based on PBT, hence a high correlation would
exist and this would cause biases in the regression results..
Dummy Variables
Since we have a panel data analysis time-specific as well as individual-specific dummies will be
added. This dataset does not cover different industries but the firm id could as well affect the
analysis. For instance, one firm might be older or larger or affect the analysis in some other way.
Hence, this study choses firm (id) to account for individual-specific effects (Bennedsen & Zeume,
2015; Lim, 2011). A dummy variable for each firm (as other do for industry effects) and for each
year are used in the analysis to control for their effects (Chen et al., 2010; Fernández-Rodríguez et
al., 2019; Richardson et al., 2016; Sacristán-Navarro et al., 2011).
The specifications of the all variables and their measurement can be gathered from Table 3.
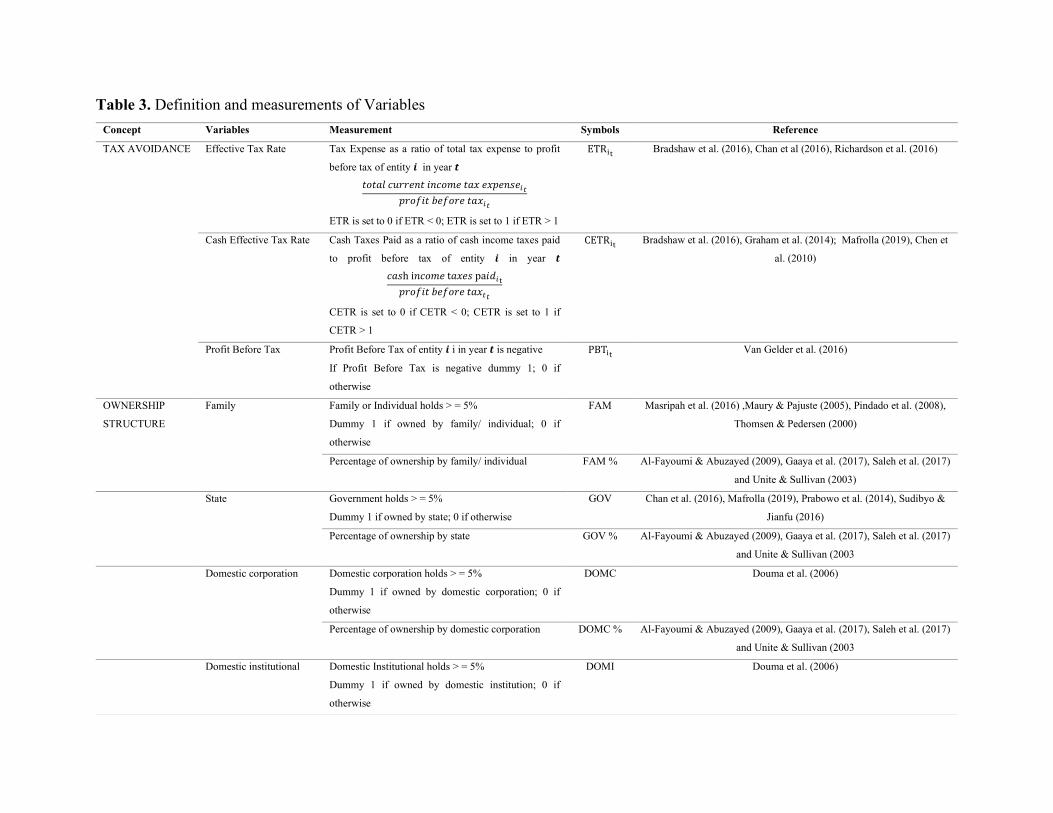
Table 3. Definition and measurements of Variables
Concept Variables Measurement Symbols Reference
TAX AVOIDANCE Effective Tax Rate Tax Expense as a ratio of total tax expense to profit
before tax of entity 𝒊 in year 𝒕
𝑡𝑜𝑡𝑎𝑙 𝑐𝑢𝑟𝑟𝑒𝑛𝑡 𝑖𝑛𝑐𝑜𝑚𝑒 𝑡𝑎𝑥 𝑒𝑥𝑝𝑒𝑛𝑠𝑒𝑖𝑡
𝑝𝑟𝑜𝑓𝑖𝑡 𝑏𝑒𝑓𝑜𝑟𝑒 𝑡𝑎𝑥𝑖𝑡
ETR is set to 0 if ETR < 0; ETR is set to 1 if ETR > 1
ETRit Bradshaw et al. (2016), Chan et al (2016), Richardson et al. (2016)
Cash Effective Tax Rate Cash Taxes Paid as a ratio of cash income taxes paid
to profit before tax of entity 𝒊 in year 𝒕
𝑐𝑎𝑠h i𝑛𝑐𝑜𝑚𝑒 t𝑎𝑥𝑒𝑠 pa𝑖𝑑𝑖t
𝑝𝑟𝑜𝑓𝑖𝑡 𝑏𝑒𝑓𝑜𝑟𝑒 𝑡𝑎𝑥𝑡𝑡
CETR is set to 0 if CETR < 0; CETR is set to 1 if
CETR > 1
CETRit Bradshaw et al. (2016), Graham et al. (2014); Mafrolla (2019), Chen et
al. (2010)
Profit Before Tax Profit Before Tax of entity 𝒊 i in year 𝒕 is negative
If Profit Before Tax is negative dummy 1; 0 if
otherwise
PBTit Van Gelder et al. (2016)
OWNERSHIP
STRUCTURE
Family Family or Individual holds > = 5%
Dummy 1 if owned by family/ individual; 0 if
otherwise
FAM Masripah et al. (2016) ,Maury & Pajuste (2005), Pindado et al. (2008),
Thomsen & Pedersen (2000)
Percentage of ownership by family/ individual FAM % Al-Fayoumi & Abuzayed (2009), Gaaya et al. (2017), Saleh et al. (2017)
and Unite & Sullivan (2003)
State Government holds > = 5%
Dummy 1 if owned by state; 0 if otherwise
GOV Chan et al. (2016), Mafrolla (2019), Prabowo et al. (2014), Sudibyo &
Jianfu (2016)
Percentage of ownership by state GOV % Al-Fayoumi & Abuzayed (2009), Gaaya et al. (2017), Saleh et al. (2017)
and Unite & Sullivan (2003
Domestic corporation Domestic corporation holds > = 5%
Dummy 1 if owned by domestic corporation; 0 if
otherwise
DOMC Douma et al. (2006)
Percentage of ownership by domestic corporation DOMC % Al-Fayoumi & Abuzayed (2009), Gaaya et al. (2017), Saleh et al. (2017)
and Unite & Sullivan (2003
Domestic institutional Domestic Institutional holds > = 5%
Dummy 1 if owned by domestic institution; 0 if
otherwise
DOMI Douma et al. (2006)
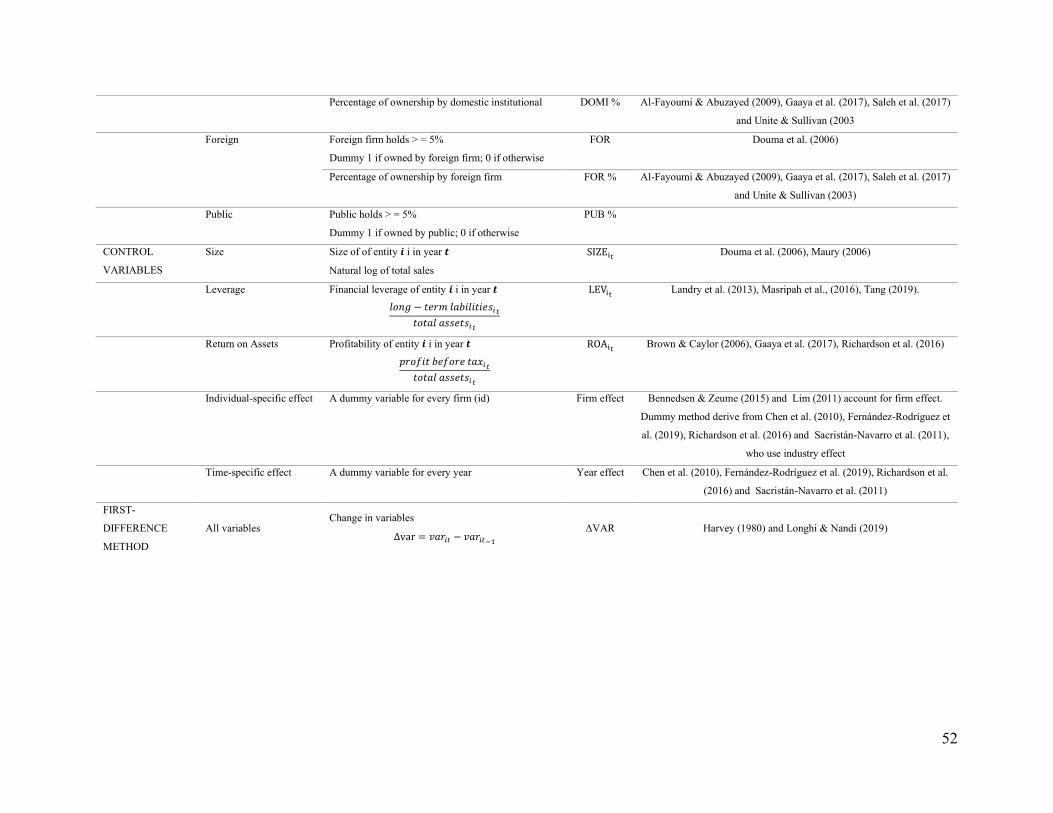
52
Percentage of ownership by domestic institutional DOMI % Al-Fayoumi & Abuzayed (2009), Gaaya et al. (2017), Saleh et al. (2017)
and Unite & Sullivan (2003
Foreign Foreign firm holds > = 5%
Dummy 1 if owned by foreign firm; 0 if otherwise
FOR Douma et al. (2006)
Percentage of ownership by foreign firm FOR % Al-Fayoumi & Abuzayed (2009), Gaaya et al. (2017), Saleh et al. (2017)
and Unite & Sullivan (2003)
Public Public holds > = 5%
Dummy 1 if owned by public; 0 if otherwise
PUB %
CONTROL
VARIABLES
Size Size of of entity 𝒊 i in year 𝒕
Natural log of total sales
SIZEit Douma et al. (2006), Maury (2006)
Leverage Financial leverage of entity 𝒊 i in year 𝒕
𝑙𝑜𝑛𝑔 − 𝑡𝑒𝑟𝑚 𝑙𝑎𝑏𝑖𝑙𝑖𝑡𝑖𝑒𝑠𝑖𝑡
𝑡𝑜𝑡𝑎𝑙 𝑎𝑠𝑠𝑒𝑡𝑠𝑖𝑡
LEVit Landry et al. (2013), Masripah et al., (2016), Tang (2019).
Return on Assets Profitability of entity 𝒊 i in year 𝒕
𝑝𝑟𝑜𝑓𝑖𝑡 𝑏𝑒𝑓𝑜𝑟𝑒 𝑡𝑎𝑥𝑖𝑡
𝑡𝑜𝑡𝑎𝑙 𝑎𝑠𝑠𝑒𝑡𝑠𝑖𝑡
ROAit Brown & Caylor (2006), Gaaya et al. (2017), Richardson et al. (2016)
Individual-specific effect A dummy variable for every firm (id) Firm effect Bennedsen & Zeume (2015) and Lim (2011) account for firm effect.
Dummy method derive from Chen et al. (2010), Fernández-Rodríguez et
al. (2019), Richardson et al. (2016) and Sacristán-Navarro et al. (2011),
who use industry effect
Time-specific effect A dummy variable for every year Year effect Chen et al. (2010), Fernández-Rodríguez et al. (2019), Richardson et al.
(2016) and Sacristán-Navarro et al. (2011)
FIRST-
DIFFERENCE
METHOD
All variables Change in variables
Δvar = 𝑣𝑎𝑟𝑖𝑡 − 𝑣𝑎𝑟𝑖𝑡−1
ΔVAR Harvey (1980) and Longhi & Nandi (2019)
4 DATA
In order to address the research question: What is the effect of ownership structure on tax avoidance
of publicly listed mining firms in Indonesia? we use data on the owners of Indonesia’s listed mining
companies. Thereby controlling shareholders can be found, which then can be divided into the
different types. During this research, it was noticeable that apparently there are no transparent
databases regarding companies listed in the IDX, whereas there are platforms for western country
based firms in order to obtain ownership information such as Thomson (US market) used by Khan
et al. (2017) and AMADEUS (East and West EU market) used by Pindado et al. (2008). In 2020,
a database called UBO-register, which entails information on the ultimate owners of firms based
in the Netherlands, is provided by the Dutch national government53.
Thus, no databases were found containing ultimate owners of the listed mining companies in
Indonesia. Existing databases that might entail such information require financial contribution in
exchange for the access. This was not possible due to limitation in resources and doubt whether
they actually provide ultimate owner information after registering. The prior study covering
ownership in Indonesia, Masripah et al. (2015), used the Data Center Business Indonesia and the
Ministry of Law and Justice database but it seems that these databases are not provided by or
cannot be found via the web.
Due to the database limitation, this study relied on public secondary data gathered from the
database Orbis, the information given by the Indonesian Stock Exchange (IDX), and from financial
statements of the listed Indonesian mining firms provided by their websites. Initially, a dataset was
given by the University of Sebelas Maret in Indonesia, which includes the names and numbers of
listed mining companies in the IDX. Nevertheless, we filtered some firms after studying the firms
and comparing information with the ones from the IDX, Orbis and the financial statements in order
to validate the database provided by the UNS. Not all of them are active in the mining sector. In
addition, many other listed mining companies were found.
In order to ensure that data obtained from Orbis are reliable, all ownership variables were
compared with the data given by the individual annual reports. Unfortunately, for some instances,
it occurred that the data from Orbis did not correspond to the data given by the annual reports. In
53 Rijksoverheid (2020). UBO-register. Retrieved 15 May, 2020 from https://www.rijksoverheid.nl/onderwerpen/financiele-
sector/ubo-register
54
those cases, the information given by the annual reports was used. Annual report information as
preferred because in Indonesia firms need to comply to the financial accounting standards (SAK),
which are set by the Financial Accounting Standards Board (DSAK IAI) and the Indonesian Sharia
Accounting Standards Board (DSAS IAI) (for sharia-based companies) and undergo audits54. The
DSAK IAI also coincides with the International Financial Reporting Standards (IFRS). In addition,
Indonesia’s public firms are required to have internal audit committees and internal audit units55.
But in situations of inconsistency, also web search engines were used as source to compare again.
It seems that in general Orbis does not necessarily provide consistent ownership data of firms. This
is as well reported by other researchers covering ownership structure (see, e.g., Cuervo-Cazurra,
2018; Ruiter, 2017).
Apparently, even for public firms it is not possible or rather complicated to gather the
ultimate owners. One has to follow several levels of the ownership pyramid in order to find
information regarding the ultimate owner, which is not possible for most of the firms. Even if
ultimate owner was found, one was not able to find any information regarding the ultimate owner
in order to categorize it among the ownership types. If all firms, which did not have ultimate owner
information were excluded, then the sample size of this research would have been too small to
being conducted. Hence, providing comprehensive data regarding direct shareholding and its effect
on tax avoidance would be not possible. Similar problems were encountered by recent studies of
Utama et al. (2017), who studied corporate governance and ownership structure in Indonesia. They
found that more than 70 % of the public companies in Indonesia were largely owned by limited
liability corporations whose ultimate owner are not provided. While Utama et al. (2017) were able
to gather missing ultimate owner information for domestic corporations from the Ministry of
Justice and Human, this study was limited by missing database. Even after accessing more data,
Utama et al. (2017) still was missing about 15 % of ultimate owner data.
Next to ownership data, this research also has to access firm’s financial data. Also here
Orbis, firm’s websites and their annual reports were used to obtain the control variables SIZE,
DEBT RATIO and ROA as well as the dependent variables ETR, CETR and PBT. Regarding the
financial data, Orbis seem to correspond to the data provided by the firms’ annual reports.
54 Medina, F., A. (2020). Audit and Compliance in Indonesia: A Guide for Foreign Investors. Asean Briefing. Retrieved 15
March, 2020 from https://www.aseanbriefing.com/news/audit-compliance-indonesia-guide-foreign-investors/ 55 Medina, F., A. (2020). Audit and Compliance in Indonesia: A Guide for Foreign Investors. Asean Briefing. Retrieved 15
March, 2020 from https://www.aseanbriefing.com/news/audit-compliance-indonesia-guide-foreign-investors/
55
Nevertheless, some cases the currency had to be converted. Orbis only provides the financial data
for a couple of consecutive years. Prior years’ data needed to be gathered from the financial reports,
which were given in Rupiah and/ or not were always transparent (readable).
In this study, we examine 34 public mining firms in Indonesia. Their participation in the
Indonesian Stock Exchange varies starting with the earliest firms having their IPO date in 2004.
This sample contains unbalanced firm data ranging from 2004-2018.
5 REGRESSION RESULTS
This chapter provides the results of this thesis’s study. First, an outline of robustness checks
conducted in this study is provided followed by a univariate analysis, namely the descriptive
statistics. Next, a bivariate analysis including the correlation matrix is given. Afterwards, the
regression results are presented with a multivariate analysis and undergo the robustness tests.
5.1 Regression Diagnosis
To ensure robust results of this study, this thesis applied various approaches. First of all, several
proxies of tax avoidance are used in this study namely PBT, ETR and CETR. Second, in order to
avoid biased parameter estimates, this thesis corrects for extreme outliers with the winsorizing
method. Following percentiles values are used: PBT at 2%-95%, Size at 2,5%-99%, Debt Ratio at
0,1%-97,5%, ROA at 1,5%-99%. ETR and CETR are winsorized with the values 0 and 1 in order
to increase the robustness towards the outliers. Furthermore, due to the inclusion of outliers and
the fact of having a small sample size, normal distribution is not likely present (De Veaux,
Velleman & Bock, 2005). As confirmed by the Sahpiro-Wilk test results of the tables in Appendix
A, the majority of data is not normally distributed.
This study also tested all hypotheses with two proxies. The explanatory factors, specifically
the ownership types, are provided as continuous variables (percentages) as well as dummy
variables. This way differences in outcomes among the models can be accounted for and hence
strengthen the argumentation of the study results.
This study includes panel data and covers up to 15 years for 34 firms. For that time-specific
and firm-specific (individual-specific) effects are accounted for during the regression. In case the
year and firm dummies have significant effect on the regression results, those dummies are
included in the final output. This information is provided in the upcoming regression tables.
After applying the Hausman test to choose between the RE model or FE model the
appropriate methods are applied to test for heteroskedasticity. For the FE model the modified Wald
test for groupwise heteroskedasticity is applied. For the RE models, this study applied the White
Test for Heteroskedasticity (White, 1980). To note here is no general consensus how to test for
heteroskedasticity in RE models. Another choice could be the Breusch-Pagan test. Yet, this test
57
seems to be best-suited for normally distributed data (Waldman, 1983; Wooldridge, 2010), which
is not the case in this study (Appendix A). In case the null hypothesis is rejected in the tests, there
is evidence for heteroskedastic errors. For those cases, the regression analyses were performed
again but this time with robust standard errors, also called Ecker, Huber, and White-estimator in
order to correct for heteroskedasticity (Richardson et al., 2016; Wooldridge, 2010).
Noticeable is that in some cases of the RE and FE regression models, the robust standard
errors lead to missing Wald Chi-squared and F-test statistics results. Hence, information on
whether the regression analysis of the corresponding model is significant or not is missing. This is
because with the robust standard errors, the number of parameters are higher or equal to the number
of clusters. Not all coefficients can be tested simultaneously. 56 Nevertheless, these tests were also
run without robust standard errors, which report the test statistics results. They are significant at
the 0.01 level. Furthermore, there are no major differences between the model outcomes.
Therefore, the missing power of the test is not an incremental problem and the tests and tables are
interpretable, even without the Wald Chi-squared test and F-test p-values. On account of that it is
decided to hold on to the versions with robust standard errors in order to correct for
heteroskedasticity. The Hausman, White and modified Wald test results are provided in the
regression tables.
To check whether independent variables are highly linearly related and correlated, which
would cause unreliable and imprecise effects on the dependent variable (Alin, 2010), this study
applies the Pearson correlation matrix. The resulting matrix is presented in Table 5. In case there
is a high correlation coefficient between the explanatory variables, we can assume
multicollinearity (Alin, 2010).
Additionally this study calculates the variance inflation factors (VIF) to check for
multicollinearity. Even though there is no evidence of high correlation, the ownership types are
significantly correlated with each other. This occurrence might be plausible, since the companies
are publicly traded and doe have more than one type of owner. Hence due to the agency conflict
aspects, the one owner might influence the likelihood of the other type of owner. Nevertheless, as
a robustness test, all regression models are also run with the ownership types individually to test
for individual effects.
56 StataCorp. 2013. Stata Statistical Software: Release 13. College Station, TX: StataCorp LP
58
5.2 Descriptive Statistics
The variables used in this study and their descriptive statistics are provided in Table 4.
Panel A displays the tax avoidances proxies PBT, ETR and CETR. Panel B displays the ownership
types as the independent variables. In this panel, the type of owners are displayed as percentages.
The descriptive statistics of the dummy versions of the ownership types are provided in Panel C.
Panel D then presents the sample characteristics of the control variables SIZE, DEBT RATIO and
the firm’s ROA.
The big variations within PBT, SIZE, DEBT RATIO and ROA and can be explained by
the fact that some companies are older and bigger than others, hence their numbers are distinctive
larger compared to other firms. Regarding the ownership of the firms, it seems that foreign
ownership has the highest mean followed by domestic corporation as owners. This means that
foreign firms and corporations had the highest amount of ownership in firms, indicating there is a
high ownership concentration within the owned firm, since less percentages are left for other
controlling owners or the public. The opposite goes for family ownership, which shows low
ownership average of only 5,1 % in Panel B as well as state ownership with 7,3% average of
ownership. One could argue that apparently if the Indonesian coal mining company is owned by a
family/ individual, institutional or the state, it is only controlled at most by up to 8 % by them;
meaning the rest of controlled ownership is owned by another type or the public. This finding
supports the hypothesized second contribution of the thesis. Prior findings stated that in Indonesia
and other emerging countries families or the state are the largest shareholders (Claessens et al.,
2000; Claessens & Yurtoglu 2013; Cullinan et al., 2012; Douma et al., 2006; Handayani & Ibrani
2019; Liew 2007). This study shows that this is different with the mining industry. Panel C shows
that on average about 62,2% of the Indonesian mining companies in this dataset have foreign
owners as controlling owners among the 15 years and only 11,6% have the government as
controlling owner. The high percentage of 96,6% of public ownership is plausible since this dataset
is based on public companies, hence most firms have public owners as controlling owners. One
should note here that as dummy version of ownership types (Panel C) the firm can have several
controlling owners in the same accounting year.
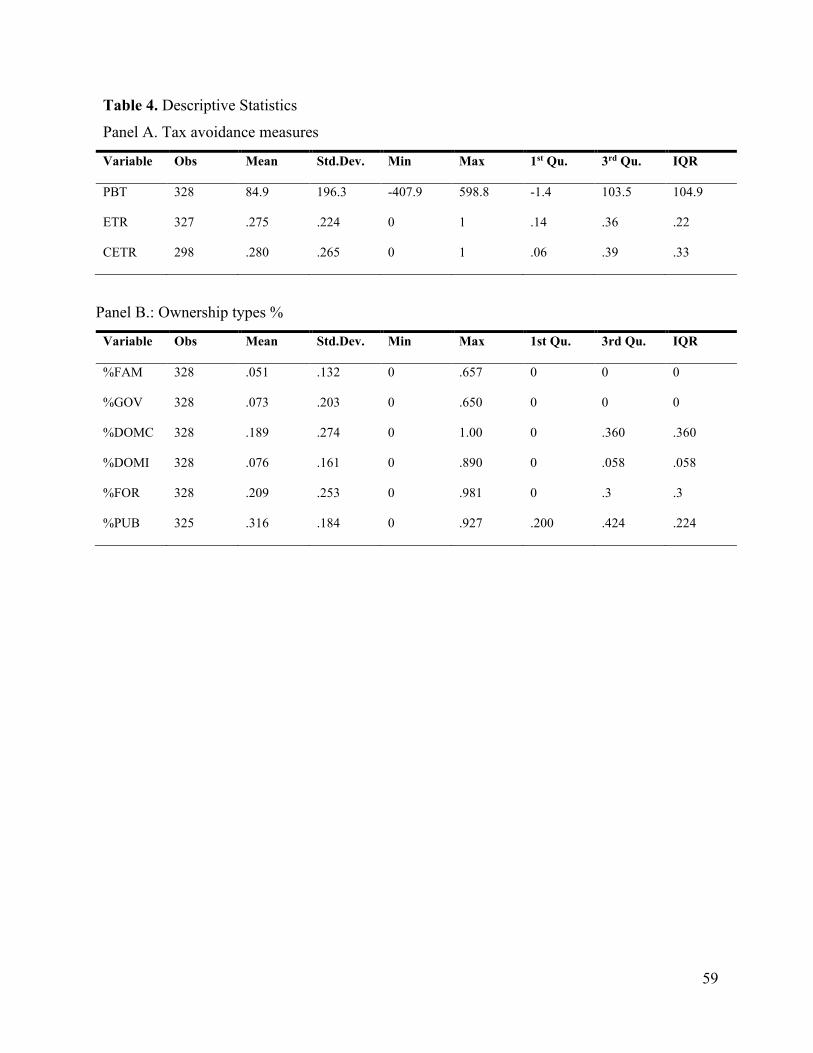
59
Table 4. Descriptive Statistics
Panel A. Tax avoidance measures
Variable Obs Mean Std.Dev. Min Max 1st Qu. 3rd Qu. IQR
PBT 328 84.9 196.3 -407.9 598.8 -1.4 103.5 104.9
ETR 327 .275 .224 0 1 .14 .36 .22
CETR 298 .280 .265 0 1 .06 .39 .33
Panel B.: Ownership types %
Variable Obs Mean Std.Dev. Min Max 1st Qu. 3rd Qu. IQR
%FAM 328 .051 .132 0 .657 0 0 0
%GOV 328 .073 .203 0 .650 0 0 0
%DOMC 328 .189 .274 0 1.00 0 .360 .360
%DOMI 328 .076 .161 0 .890 0 .058 .058
%FOR 328 .209 .253 0 .981 0 .3 .3
%PUB 325 .316 .184 0 .927 .200 .424 .224
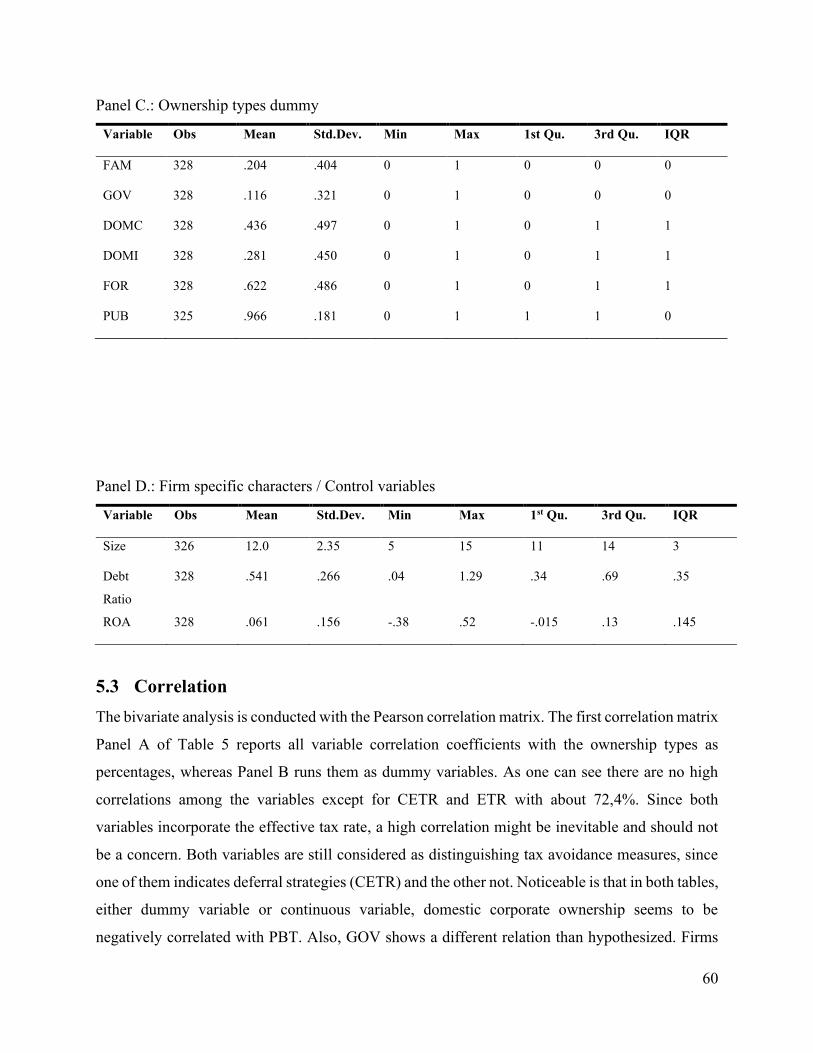
60
Panel C.: Ownership types dummy
Variable Obs Mean Std.Dev. Min Max 1st Qu. 3rd Qu. IQR
FAM 328 .204 .404 0 1 0 0 0
GOV 328 .116 .321 0 1 0 0 0
DOMC 328 .436 .497 0 1 0 1 1
DOMI 328 .281 .450 0 1 0 1 1
FOR 328 .622 .486 0 1 0 1 1
PUB 325 .966 .181 0 1 1 1 0
Panel D.: Firm specific characters / Control variables
Variable Obs Mean Std.Dev. Min Max 1st Qu. 3rd Qu. IQR
Size 326 12.0 2.35 5 15 11 14 3
Debt
Ratio
328 .541 .266 .04 1.29 .34 .69 .35
ROA 328 .061 .156 -.38 .52 -.015 .13 .145
5.3 Correlation
The bivariate analysis is conducted with the Pearson correlation matrix. The first correlation matrix
Panel A of Table 5 reports all variable correlation coefficients with the ownership types as
percentages, whereas Panel B runs them as dummy variables. As one can see there are no high
correlations among the variables except for CETR and ETR with about 72,4%. Since both
variables incorporate the effective tax rate, a high correlation might be inevitable and should not
be a concern. Both variables are still considered as distinguishing tax avoidance measures, since
one of them indicates deferral strategies (CETR) and the other not. Noticeable is that in both tables,
either dummy variable or continuous variable, domestic corporate ownership seems to be
negatively correlated with PBT. Also, GOV shows a different relation than hypothesized. Firms
61
which are owned by the state seem to report 29,3% higher profits before tax. The significance level
for both ownership types are high at 1%. In both models, GOV seems to positively be correlated
to SIZE and ROA and negative towards DEBT RATIO indicating state owned firms have better
firm performance and are less debt dependent. The opposite holds for firms with domestic
institutional owners. As argued in the theory, institutional ownership might rather have short term
financial goals in mind leading to rather negative ROA and positive debt ratio in Panel B.
Another interesting result is that all ownership types are negatively correlated with each
other, in particular in Panel A. The one owner seems to hinder or decrease the ownership of the
other. The reason could be probable agency conflicts regarding the firm’s goals and owners’
intends as discussed in the theoretical part. Whereas the state, for instance, might have the
companies long-term goal in mind and its CSRs towards society, the other owners might prefer
personal benefits like short time financial goals. Missions between a government and companies
might differ substantially.
The correlation matrix also shows significant correlation between PBT and the other
dependent variables. This finding is reasonable since ETR and CETR ratio calculations have profit
before tax as denominator. Also their correlation is not strong, hence their correlation is not
problematic.
According to Panel B, when considering dummy variables, it seems that foreign ownership
is significantly negatively correlated to PBT, ETR and CETR being the only ownership type
showing a significant negative relationship with all tax avoidance proxies.
At first sight, both panels indicate that there is no problem of high collinearity, since they
do not even achieve 0.5. Hence, one would argue there is no multicollinearity. Nevertheless, in
research there is no real threshold for deciding whether the correlation is too high to consider the
effect of the independent variable as problematic (Hair et al., 2014). Hair et al. (2014) argues that
0.9 or higher indicate high correlation but they also argue that 0.7 can already be problematic.
Minnick and Noga (2019) for instance used 0.5 as threshold in their paper. Deciding for the
threshold depends on the researchers interpretation and other factors. For example if the dataset
has a small sample size like this study does, unique variance might be weak or non existent even
if one independent variable is only partially explained by the other independent variable (Hair et
al., 2014). In this study, the significant negative correlation of -34,2% between the ownership types
FOR and DOMC in Panel A could still be a sign of multicollinearity. Moreover according to Hair
62
et al. (2014), if the correlation between these two variables is higher than the correlation between
them and the dependent variables individually, the regression result estimations can also be
problematic. Indeed this occurs with FOR and DOMC, which individually are not or only to a
small degree correlated with the dependent variables as can be gathered from both panels.
In order to be sure about the independence between the independent variables, this study
also looks at the variance inflation factors (VIF) to test for multicollinearity as is also done by
Badertscher et al. (2013), Bradshaw et al. (2016), Gaaya et al. (2017, Lanis and Richardson
(2011), Mafrolla (2019) Minnick and Noga (2010) and Richardson et al. (2016). The VIF tables
can be found in the appendances. The threshold for indicating multicollinearity with VIF values
is 10 indicating multicollinearity (Hair et al., 2014). Again also here, lower values might also
indicate multicollinearity, though it is on the researcher to decide and interpretate the accepted
threshold.
This study follows the above mentioned papers and choses the value 10 as threshold to
indicate the existence of multicollinearity. As can be gathered from the tables in Appendix B.,
most of VIF values are smaller then 10, even smaller than 5. Only for the control variable SIZE
the values exceed the threshold of 10. Nevertheless this problem is accounted for already since all
regression models in this thesis run the tests once with the control variables such as SIZE and once
without.
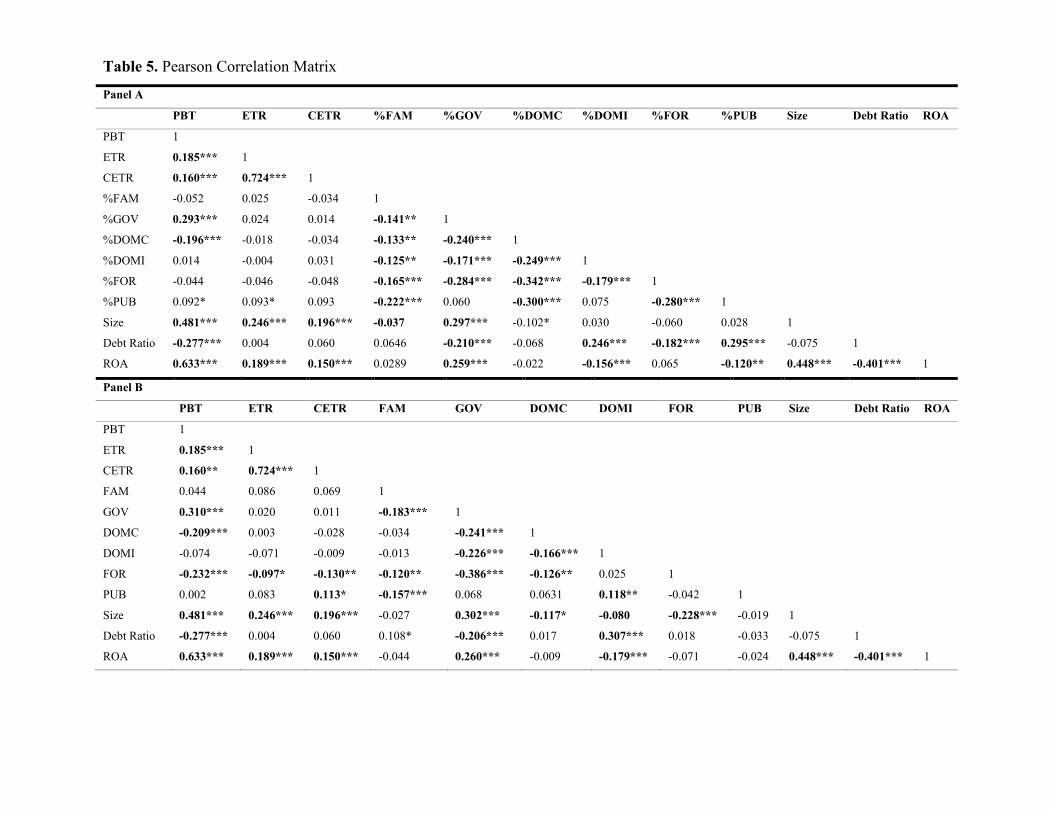
Panel B
PBT ETR CETR FAM GOV DOMC DOMI FOR PUB Size Debt Ratio ROA
PBT 1
ETR 0.185*** 1
CETR 0.160** 0.724*** 1
FAM 0.044 0.086 0.069 1
GOV 0.310*** 0.020 0.011 -0.183*** 1
DOMC -0.209*** 0.003 -0.028 -0.034 -0.241*** 1
DOMI -0.074 -0.071 -0.009 -0.013 -0.226*** -0.166*** 1
FOR -0.232*** -0.097* -0.130** -0.120** -0.386*** -0.126** 0.025 1
PUB 0.002 0.083 0.113* -0.157*** 0.068 0.0631 0.118** -0.042 1
Size 0.481*** 0.246*** 0.196*** -0.027 0.302*** -0.117* -0.080 -0.228*** -0.019 1
Debt Ratio -0.277*** 0.004 0.060 0.108* -0.206*** 0.017 0.307*** 0.018 -0.033 -0.075 1
ROA 0.633*** 0.189*** 0.150*** -0.044 0.260*** -0.009 -0.179*** -0.071 -0.024 0.448*** -0.401*** 1
Table 5. Pearson Correlation Matrix
Panel A
PBT ETR CETR %FAM %GOV %DOMC %DOMI %FOR %PUB Size Debt Ratio ROA
PBT 1
ETR 0.185*** 1
CETR 0.160*** 0.724*** 1
%FAM -0.052 0.025 -0.034 1
%GOV 0.293*** 0.024 0.014 -0.141** 1
%DOMC -0.196*** -0.018 -0.034 -0.133** -0.240*** 1
%DOMI 0.014 -0.004 0.031 -0.125** -0.171*** -0.249*** 1
%FOR -0.044 -0.046 -0.048 -0.165*** -0.284*** -0.342*** -0.179*** 1
%PUB 0.092* 0.093* 0.093 -0.222*** 0.060 -0.300*** 0.075 -0.280*** 1
Size 0.481*** 0.246*** 0.196*** -0.037 0.297*** -0.102* 0.030 -0.060 0.028 1
Debt Ratio -0.277*** 0.004 0.060 0.0646 -0.210*** -0.068 0.246*** -0.182*** 0.295*** -0.075 1
ROA 0.633*** 0.189*** 0.150*** 0.0289 0.259*** -0.022 -0.156*** 0.065 -0.120** 0.448*** -0.401*** 1

64
Notes: This table reports the Pearson Correlation coefficients with their statistical significance. Panel A reports the ownership types as percentages, whereas Panel B reports them as
dummy variables. Bold values are significant at the levels 10% (denoted by*), 5% (denoted by **) and 1% (denoted by ***).
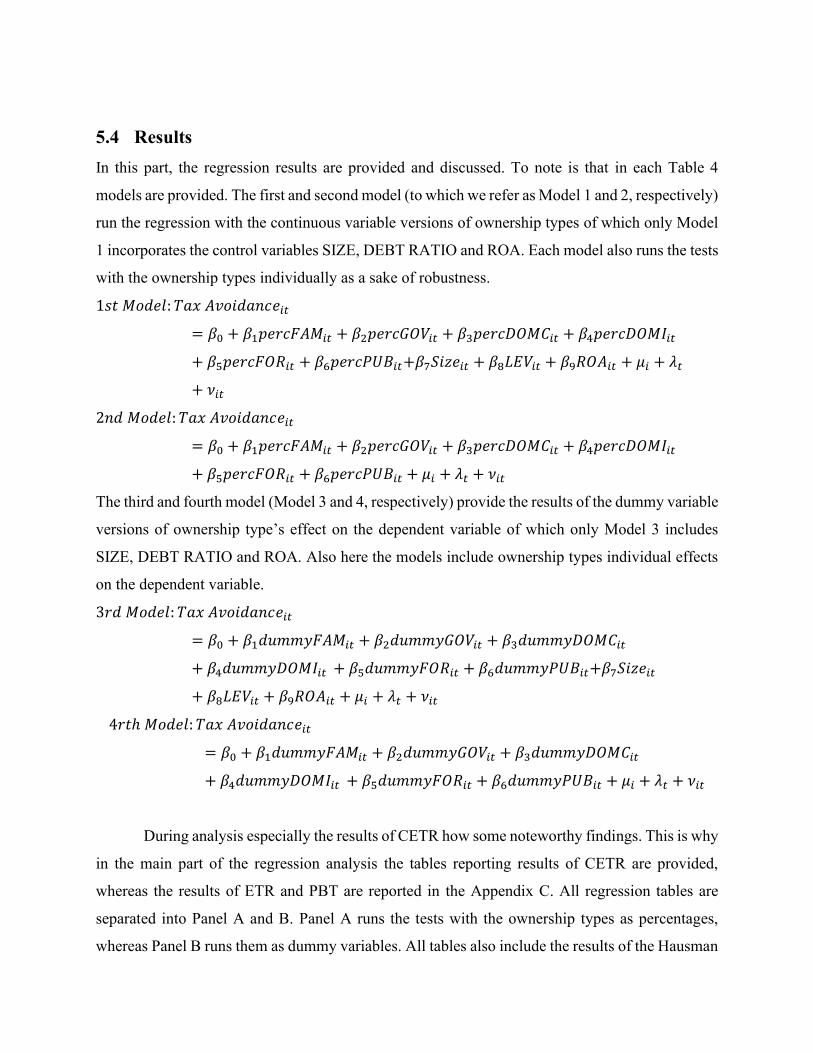
5.4 Results
In this part, the regression results are provided and discussed. To note is that in each Table 4
models are provided. The first and second model (to which we refer as Model 1 and 2, respectively)
run the regression with the continuous variable versions of ownership types of which only Model
1 incorporates the control variables SIZE, DEBT RATIO and ROA. Each model also runs the tests
with the ownership types individually as a sake of robustness.
1𝑠𝑡 𝑀𝑜𝑑𝑒𝑙: 𝑇𝑎𝑥 𝐴𝑣𝑜𝑖𝑑𝑎𝑛𝑐𝑒𝑖𝑡
= 𝛽0 + 𝛽1𝑝𝑒𝑟𝑐𝐹𝐴𝑀𝑖𝑡 + 𝛽2𝑝𝑒𝑟𝑐𝐺𝑂𝑉𝑖𝑡 + 𝛽3𝑝𝑒𝑟𝑐𝐷𝑂𝑀𝐶𝑖𝑡 + 𝛽4𝑝𝑒𝑟𝑐𝐷𝑂𝑀𝐼𝑖𝑡
+ 𝛽5𝑝𝑒𝑟𝑐𝐹𝑂𝑅𝑖𝑡 + 𝛽6𝑝𝑒𝑟𝑐𝑃𝑈𝐵𝑖𝑡+𝛽7𝑆𝑖𝑧𝑒𝑖𝑡 + 𝛽8𝐿𝐸𝑉𝑖𝑡 + 𝛽9𝑅𝑂𝐴𝑖𝑡 + 𝜇𝑖 + 𝜆𝑡
+ 𝜈𝑖𝑡
2𝑛𝑑 𝑀𝑜𝑑𝑒𝑙: 𝑇𝑎𝑥 𝐴𝑣𝑜𝑖𝑑𝑎𝑛𝑐𝑒𝑖𝑡
= 𝛽0 + 𝛽1𝑝𝑒𝑟𝑐𝐹𝐴𝑀𝑖𝑡 + 𝛽2𝑝𝑒𝑟𝑐𝐺𝑂𝑉𝑖𝑡 + 𝛽3𝑝𝑒𝑟𝑐𝐷𝑂𝑀𝐶𝑖𝑡 + 𝛽4𝑝𝑒𝑟𝑐𝐷𝑂𝑀𝐼𝑖𝑡
+ 𝛽5𝑝𝑒𝑟𝑐𝐹𝑂𝑅𝑖𝑡 + 𝛽6𝑝𝑒𝑟𝑐𝑃𝑈𝐵𝑖𝑡 + 𝜇𝑖 + 𝜆𝑡 + 𝜈𝑖𝑡
The third and fourth model (Model 3 and 4, respectively) provide the results of the dummy variable
versions of ownership type’s effect on the dependent variable of which only Model 3 includes
SIZE, DEBT RATIO and ROA. Also here the models include ownership types individual effects
on the dependent variable.
3𝑟𝑑 𝑀𝑜𝑑𝑒𝑙: 𝑇𝑎𝑥 𝐴𝑣𝑜𝑖𝑑𝑎𝑛𝑐𝑒𝑖𝑡
= 𝛽0 + 𝛽1𝑑𝑢𝑚𝑚𝑦𝐹𝐴𝑀𝑖𝑡 + 𝛽2𝑑𝑢𝑚𝑚𝑦𝐺𝑂𝑉𝑖𝑡 + 𝛽3𝑑𝑢𝑚𝑚𝑦𝐷𝑂𝑀𝐶𝑖𝑡
+ 𝛽4𝑑𝑢𝑚𝑚𝑦𝐷𝑂𝑀𝐼𝑖𝑡 + 𝛽5𝑑𝑢𝑚𝑚𝑦𝐹𝑂𝑅𝑖𝑡 + 𝛽6𝑑𝑢𝑚𝑚𝑦𝑃𝑈𝐵𝑖𝑡+𝛽7𝑆𝑖𝑧𝑒𝑖𝑡
+ 𝛽8𝐿𝐸𝑉𝑖𝑡 + 𝛽9𝑅𝑂𝐴𝑖𝑡 + 𝜇𝑖 + 𝜆𝑡 + 𝜈𝑖𝑡
4𝑟𝑡ℎ 𝑀𝑜𝑑𝑒𝑙: 𝑇𝑎𝑥 𝐴𝑣𝑜𝑖𝑑𝑎𝑛𝑐𝑒𝑖𝑡
= 𝛽0 + 𝛽1𝑑𝑢𝑚𝑚𝑦𝐹𝐴𝑀𝑖𝑡 + 𝛽2𝑑𝑢𝑚𝑚𝑦𝐺𝑂𝑉𝑖𝑡 + 𝛽3𝑑𝑢𝑚𝑚𝑦𝐷𝑂𝑀𝐶𝑖𝑡
+ 𝛽4𝑑𝑢𝑚𝑚𝑦𝐷𝑂𝑀𝐼𝑖𝑡 + 𝛽5𝑑𝑢𝑚𝑚𝑦𝐹𝑂𝑅𝑖𝑡 + 𝛽6𝑑𝑢𝑚𝑚𝑦𝑃𝑈𝐵𝑖𝑡 + 𝜇𝑖 + 𝜆𝑡 + 𝜈𝑖𝑡
During analysis especially the results of CETR how some noteworthy findings. This is why
in the main part of the regression analysis the tables reporting results of CETR are provided,
whereas the results of ETR and PBT are reported in the Appendix C. All regression tables are
separated into Panel A and B. Panel A runs the tests with the ownership types as percentages,
whereas Panel B runs them as dummy variables. All tables also include the results of the Hausman
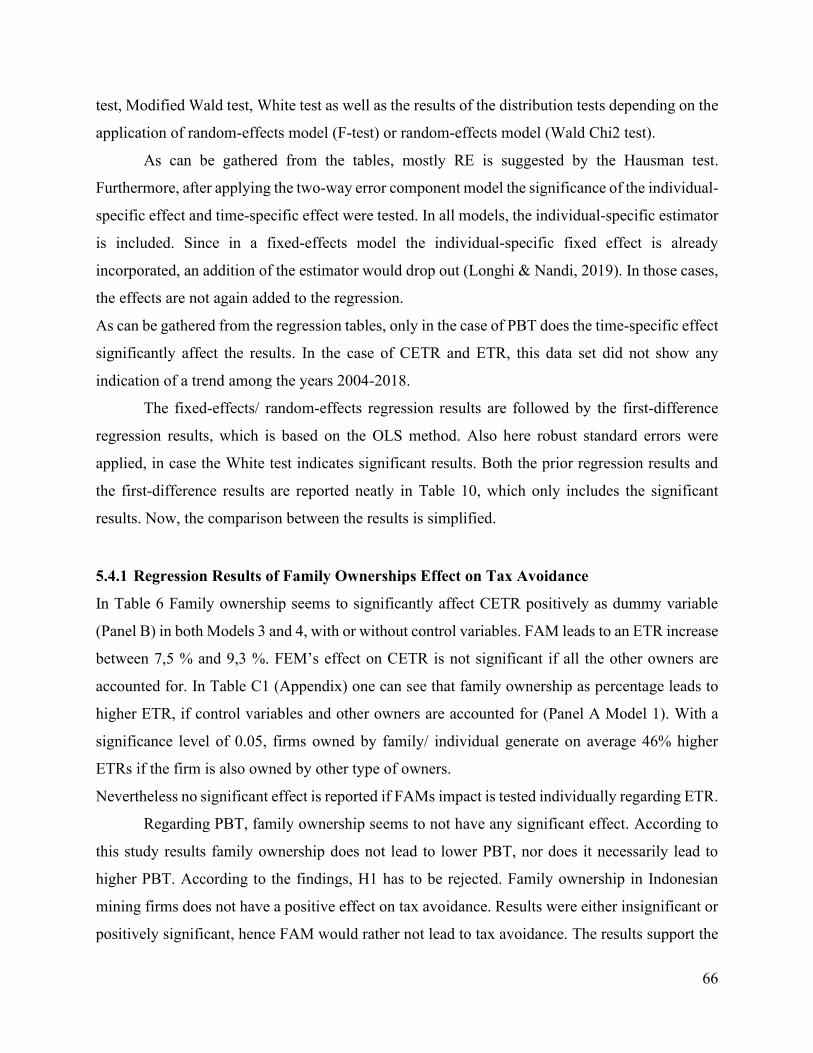
66
test, Modified Wald test, White test as well as the results of the distribution tests depending on the
application of random-effects model (F-test) or random-effects model (Wald Chi2 test).
As can be gathered from the tables, mostly RE is suggested by the Hausman test.
Furthermore, after applying the two-way error component model the significance of the individual-
specific effect and time-specific effect were tested. In all models, the individual-specific estimator
is included. Since in a fixed-effects model the individual-specific fixed effect is already
incorporated, an addition of the estimator would drop out (Longhi & Nandi, 2019). In those cases,
the effects are not again added to the regression.
As can be gathered from the regression tables, only in the case of PBT does the time-specific effect
significantly affect the results. In the case of CETR and ETR, this data set did not show any
indication of a trend among the years 2004-2018.
The fixed-effects/ random-effects regression results are followed by the first-difference
regression results, which is based on the OLS method. Also here robust standard errors were
applied, in case the White test indicates significant results. Both the prior regression results and
the first-difference results are reported neatly in Table 10, which only includes the significant
results. Now, the comparison between the results is simplified.
5.4.1 Regression Results of Family Ownerships Effect on Tax Avoidance
In Table 6 Family ownership seems to significantly affect CETR positively as dummy variable
(Panel B) in both Models 3 and 4, with or without control variables. FAM leads to an ETR increase
between 7,5 % and 9,3 %. FEM’s effect on CETR is not significant if all the other owners are
accounted for. In Table C1 (Appendix) one can see that family ownership as percentage leads to
higher ETR, if control variables and other owners are accounted for (Panel A Model 1). With a
significance level of 0.05, firms owned by family/ individual generate on average 46% higher
ETRs if the firm is also owned by other type of owners.
Nevertheless no significant effect is reported if FAMs impact is tested individually regarding ETR.
Regarding PBT, family ownership seems to not have any significant effect. According to
this study results family ownership does not lead to lower PBT, nor does it necessarily lead to
higher PBT. According to the findings, H1 has to be rejected. Family ownership in Indonesian
mining firms does not have a positive effect on tax avoidance. Results were either insignificant or
positively significant, hence FAM would rather not lead to tax avoidance. The results support the
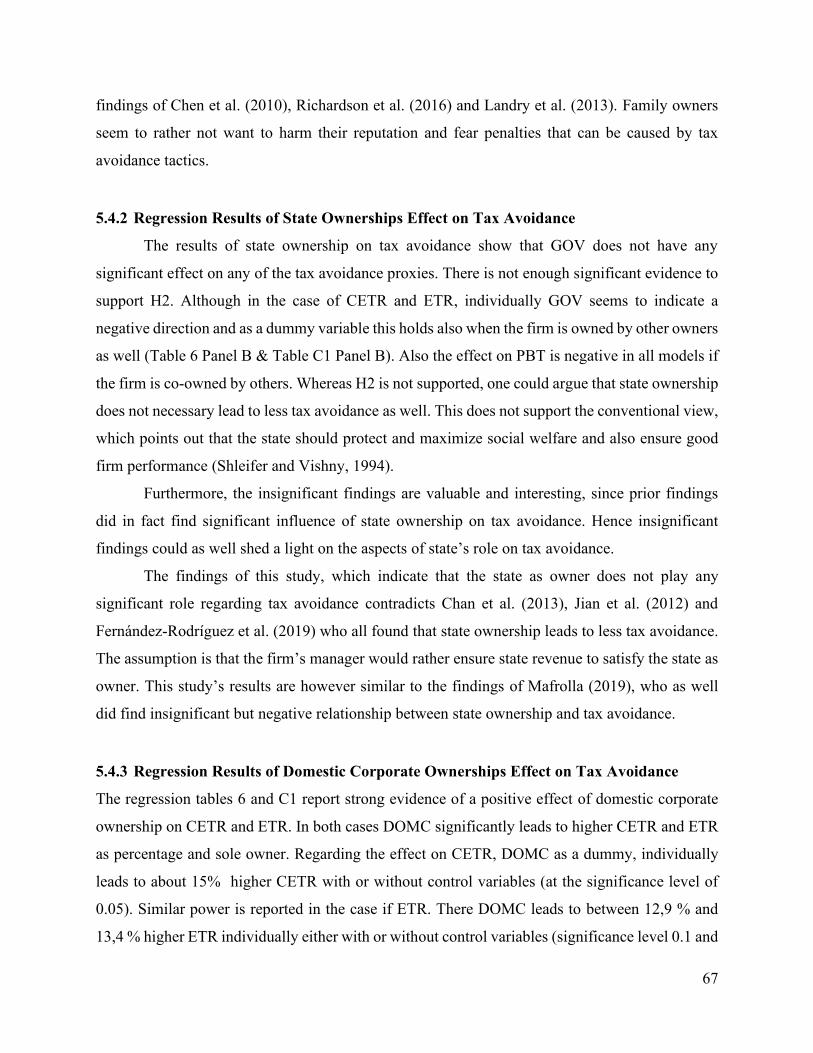
67
findings of Chen et al. (2010), Richardson et al. (2016) and Landry et al. (2013). Family owners
seem to rather not want to harm their reputation and fear penalties that can be caused by tax
avoidance tactics.
5.4.2 Regression Results of State Ownerships Effect on Tax Avoidance
The results of state ownership on tax avoidance show that GOV does not have any
significant effect on any of the tax avoidance proxies. There is not enough significant evidence to
support H2. Although in the case of CETR and ETR, individually GOV seems to indicate a
negative direction and as a dummy variable this holds also when the firm is owned by other owners
as well (Table 6 Panel B & Table C1 Panel B). Also the effect on PBT is negative in all models if
the firm is co-owned by others. Whereas H2 is not supported, one could argue that state ownership
does not necessary lead to less tax avoidance as well. This does not support the conventional view,
which points out that the state should protect and maximize social welfare and also ensure good
firm performance (Shleifer and Vishny, 1994).
Furthermore, the insignificant findings are valuable and interesting, since prior findings
did in fact find significant influence of state ownership on tax avoidance. Hence insignificant
findings could as well shed a light on the aspects of state’s role on tax avoidance.
The findings of this study, which indicate that the state as owner does not play any
significant role regarding tax avoidance contradicts Chan et al. (2013), Jian et al. (2012) and
Fernández-Rodríguez et al. (2019) who all found that state ownership leads to less tax avoidance.
The assumption is that the firm’s manager would rather ensure state revenue to satisfy the state as
owner. This study’s results are however similar to the findings of Mafrolla (2019), who as well
did find insignificant but negative relationship between state ownership and tax avoidance.
5.4.3 Regression Results of Domestic Corporate Ownerships Effect on Tax Avoidance
The regression tables 6 and C1 report strong evidence of a positive effect of domestic corporate
ownership on CETR and ETR. In both cases DOMC significantly leads to higher CETR and ETR
as percentage and sole owner. Regarding the effect on CETR, DOMC as a dummy, individually
leads to about 15% higher CETR with or without control variables (at the significance level of
0.05). Similar power is reported in the case if ETR. There DOMC leads to between 12,9 % and
13,4 % higher ETR individually either with or without control variables (significance level 0.1 and
68
0.05). DOMC also significantly affects ETR positively if the regression includes all other owners
for both Models 1 and 2. When other owners are also accounted for, DOMC leads to about 33,1
% - 35,2% higher ETR (significance level 0.10).
Regarding PBT, DOMC does not show any significant effect.
The findings on CETR and ETR support H3 and add to the findings of Douma et al. (2006)
and Mishra (2013), who state that domestic corporate owners rather seek to acquire other firms or
be acquired, hence the do not seek private benefits, which would be tax avoidance in this case.
They rather pay attention towards better monitoring and long-term value. Also since they have
lower resource capacity (Douma et al., 2006), tax avoidance tactics would be too costly to be
considered.
5.4.4 Regression Results of Domestic Institutional Ownerships Effect on Tax Avoidance
DOMI does significantly lead to lower CETR (Table 6 Panel B Model 3) and ETR (Table C1
Panel B Model 3 & 4) as a dummy variable. In both cases CETR and ETR, DOMI negativeley
affects the dependent variables either as sole owner or co-owner.
The negative effect on ETR remains even with or without control variables. The significant levels
are at the 0.01 and 0.05, hence there is strong evidence of the negative effect.
DOMI does not affect PBT significantly.
All in all, most results support H4. Firms owned by domestic institutions have on average
14,8% to 17,8% lower ETR and 15,6% to 18,9% lower CETR. Hence, domestic institutional
ownershop in Indonesian mining companies leads to teax avodiance.
These findings comply with the findings of Bayar et al. (2018) and Huseynov and Klamm
(2012). According to Bayar et al. (2018) the effect is stronger for firms with good governance.
Reason for the positive effect on tax avoidance could lie on the ability and resources to manage
taxes well, which also leads to less financial distress. Meaning tax avoidance by them would not
necessarily harm the firm value. But considering the results and argumentation of others, they
probably do not have the firm value in mind when avoiding taxes. This is also supported by the
correlation matrix in Table 5, in which one can see that DEBT RATIO is positively correlated with
DOMI, whereas ROA is negatively correlated with DOMI.
Furthermore the study results support Douma et al. (2006), who found that DOMI in
transition economies do not have solely the firm value and performance in mind and do not affect
69
the firm performance significantly positively. Also Giannetti and Laeven (2009) are supported
stating that domestic institutional ownership do not contribute towards firm value. Besides, the
results also fit the argumentation of Aggarwal (2017), who states that institutional owners in civil
law countries do not necessarily improve firm’s governance and are probable biased towards the
firm’s management. Hence firm performance and governance are not priority for domestic
institutional owners. It seems domestic institutional owners indeed rather prefer short term goals,
in this case tax avoidance tactics and by this risk the firm reputation.
5.4.5 Regression Results of Foreign Ownerships Effect on Tax Avoidance
When separated from the other ownership types, FOR as percentage and without control variables,
significantly affect CETR negatively (Table 6 Panel A Model 2). In Panel B however, the
significant negative effect of FOR on CETR holds either with or without control variables and co-
owners. If the firm is owned or co-owned by foreign ownership, CETR is reduced by about 14,0%
to 16,7%. There is no significant effect on ETR. However FOR seems to lead to less PBT in Table
C2 Panel B Model 3 and 4 (significant at level 0.01 and 0.05).
On average foreign ownership leads to a decrease of about $78.5 - $92.3 million (USD) compared
to the other firms.
Overall, the findings support H5 indicating that foreign ownership in Indonesian mining
companies leads to tax avoidance. The study results correspond to the findings of Annuar et al.
(2014), Demirgüç-Kunt and Huizinga (2001) and Van Gelder et al. (2016). The fact that foreign
holders not only decrease CETR, hence lead to tax avoidance, but also lead to lower PBT sheds a
new light in the findings of foreign ownership on the firm’s value and performance. Love et al.
(2009) and Douma et al. (2006) found that foreign ownership led to firm performance. This seems
to not be the case for Indonesian mining companies, since lower profit before taxes means that the
firm probably does not perform well. Also Dahlquist and Robertsson (2001) found similar results
stating foreign ownership did not significantly affect firm’s ROA and beta (also supported by
Table 5). The reason could be that foreign investors often seem to be foreign institutional owners
(Dahlquist and Robertsson, 2001), which also supports the studys results on institutional
ownership and its positive effect on tax avoidance.
70
5.4.6 Regression Results of Public Ownerships Effect on Tax Avoidance
As explained earlier, public ownership’s effect is not focus of this studys research, hence no
relationship between this type and tax avoidance is hypothesized and investigated. Nevertheless,
the inclusion of public ownership provides interesting results. The regression results show that all
dependent variables PBT, ETR and CETR are significant and positively affected by PUB as can
be seen in Table 6 (Panel B Model 3 & 4), Table C1 (Panel A Model 2) and Table C2 (Panel B
Model 2). It does so also as sole owner in the case of CETR and PBT.
The results of PUB indicate that if firms would allocate more shares to the public (to minority
shareholders with less or equal to 5% shares) tax avoidance would probably not occur. The results
show that the variable public ownership might be a critical and contributable aspect for further
research regarding the studies of ownership structures.
5.4.7 Regression Results of Control Variables Effect on Tax Avoidance
SIZE does not have any significant effect on CETR. It does however affect ETR significantly
positive but only if the firm is owned by domestic corporation. Also, in Table C3 Model 1 and 3,
SIZE significantly leads to higher PBT. Whereas Shevlin and Porter (1992) argue that larger firms
are capable to apply good tax planning methods due to their resources (cited by Chan et al. (2013),
the results show that they would not necessarily do so, otherwise SIZE would affect PBT
negatively here. Also, the fact that there is no significant negative effect on CETR and in most
cases not on ETR, indicates that larger firms might avoid reputational damages caused by tax
avoidance (Chan et al., 2013). Nevertheless, it seems that results regarding firm’s size on firm’s
effective tax rates are mixed and weak as also argued by Dyreng et al. (2008).
Debt Ratio affects CETR positive at the significance levels 0.01 and 0.05 (Table 6 Model
1 & 3). Regarding ETR there seems to be no significant effect of DEBT RATIO. The reason for
the positive effect on CETR could be the tax deduction benefit of debt. The results supports the
findings of Lim (2011) and Graham and Tucker (2006). Firms who avoid taxes do not need to
issue more debt for tax deductions, hence the higher the debt ratio, the lower the probability that
these firms additionally adopt tax avoidance practices. By this CETR is not decreased by the debt
ratio.
DEBT RATIO significantly affects PBT negatively at the 0.05 level (C3 Model 1 & 3).
The negative effect on PBT is probable due to the fact that PBT includes interest expenses, hence
71
the more debt, the higher the interest expenses and lower the PBT. Another explanation could be
that firms with high debt ratios, hence financial distress, are in such a situation because there is not
enough internal generated funds. This means firm performance and sales are weak and by this
profits are low. Such firms would have to rely on other funding options such as debts. One theory
explaining that effect is the Pecking Order Theory, which states that a firm prefers to first use
internal generated funds instead of debt. Issuing equity would be the last choice for financing
(Myers & Majluf, 1984).
ROA seems to have a significant positive relationship towards CETR and ETR. As argued
before, the reason could be that firms with high ROAs, would rather not want to harm their good
performance and reputation with avoiding taxes by lowering PBT. The results of ROA on ETR
partially contradict the results of Huseynov & Klamm (2012), who found a negative relation
between ROA and ETR. Though it supports their findings on ROAs positive affect on CETR. Also
the finding of Chan et al. (2013) are supported.
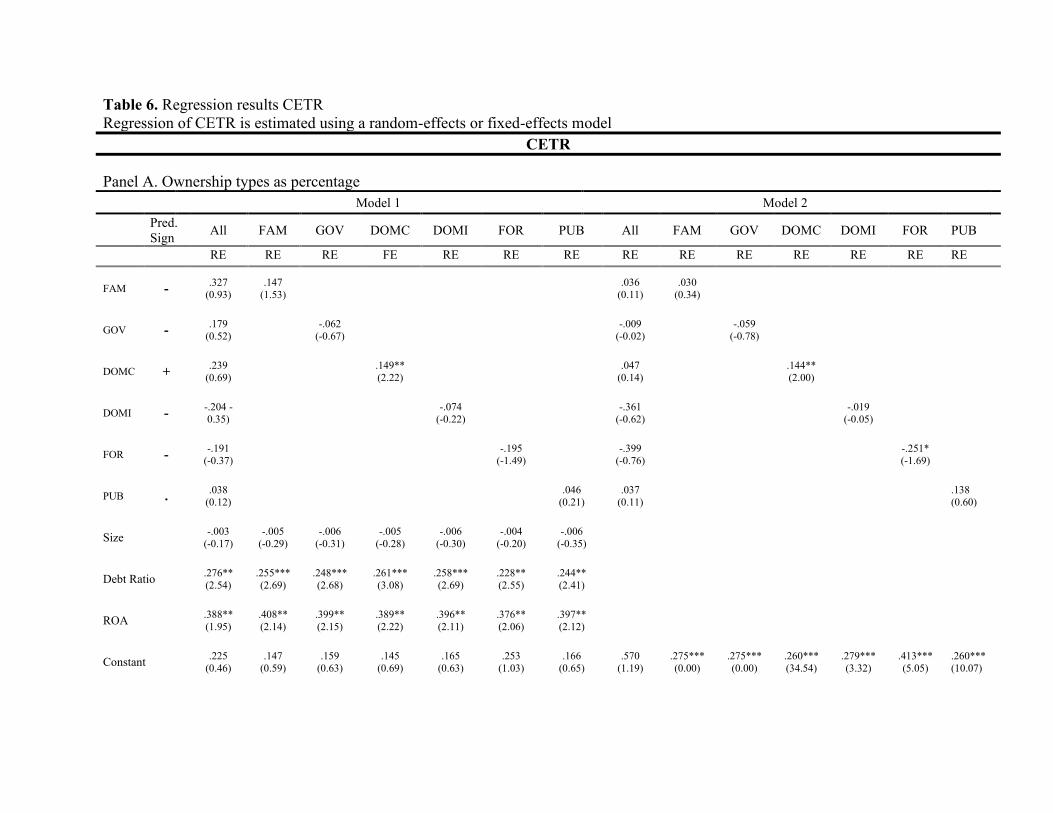
Table 6. Regression results CETR
Regression of CETR is estimated using a random-effects or fixed-effects model
CETR
Panel A. Ownership types as percentage
Model 1 Model 2
Pred.
Sign All FAM GOV DOMC DOMI FOR PUB All FAM GOV DOMC DOMI FOR PUB
RE RE RE FE RE RE RE RE RE RE RE RE RE RE
FAM - .327
(0.93)
.147
(1.53) .036
(0.11)
.030
(0.34)
GOV - .179
(0.52)
-.062
(-0.67) -.009
(-0.02) -.059
(-0.78)
DOMC + .239
(0.69) .149**
(2.22) .047
(0.14) .144**
(2.00)
DOMI - -.204 -
0.35) -.074
(-0.22) -.361
(-0.62) -.019
(-0.05)
FOR - -.191
(-0.37) -.195
(-1.49) -.399
(-0.76) -.251*
(-1.69)
PUB . .038
(0.12) .046
(0.21)
.037
(0.11) .138
(0.60)
Size -.003
(-0.17)
-.005
(-0.29)
-.006
(-0.31)
-.005
(-0.28)
-.006
(-0.30)
-.004
(-0.20)
-.006
(-0.35)
Debt Ratio .276**
(2.54)
.255***
(2.69)
.248***
(2.68)
.261***
(3.08)
.258***
(2.69)
.228**
(2.55)
.244**
(2.41)
ROA .388**
(1.95)
.408**
(2.14)
.399**
(2.15)
.389**
(2.22)
.396**
(2.11)
.376**
(2.06)
.397**
(2.12)
Constant .225
(0.46)
.147
(0.59)
.159
(0.63)
.145
(0.69)
.165
(0.63)
.253
(1.03)
.166
(0.65)
.570
(1.19)
.275***
(0.00)
.275***
(0.00)
.260***
(34.54)
.279***
(3.32)
.413***
(5.05)
.260***
(10.07)
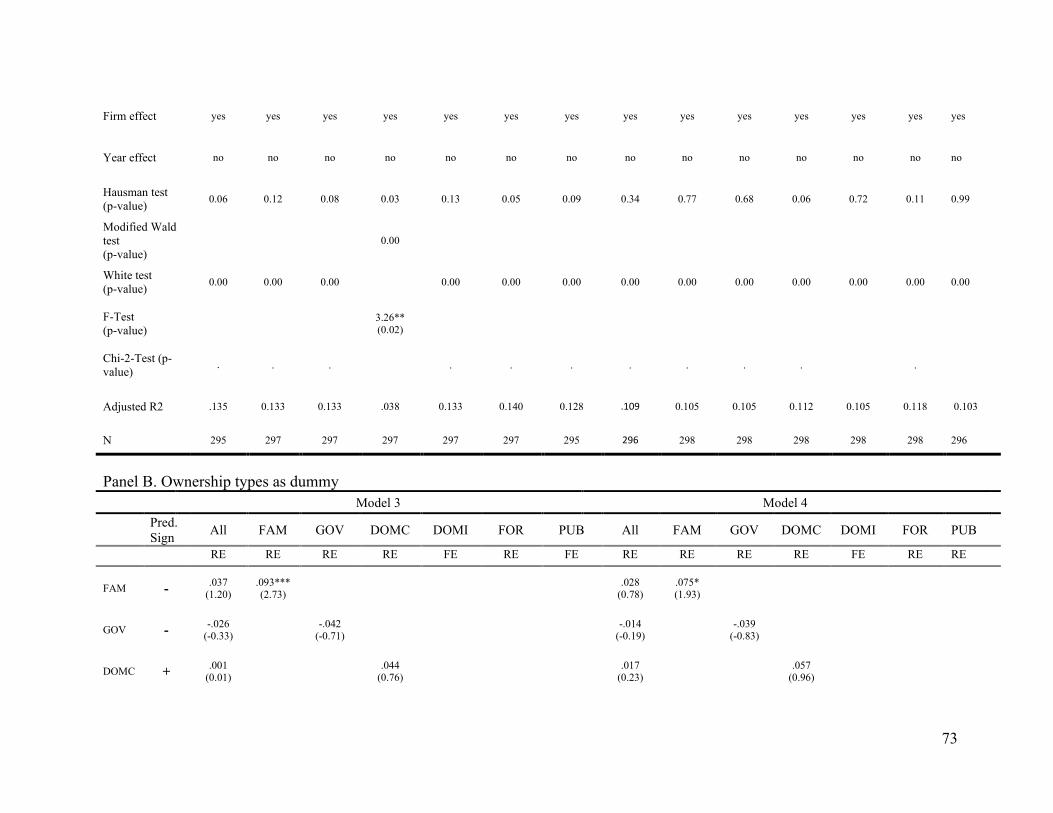
73
Firm effect yes yes yes yes yes yes yes yes yes yes yes yes yes yes
Year effect no no no no no no no no no no no no no no
Hausman test
(p-value) 0.06 0.12 0.08 0.03 0.13 0.05 0.09 0.34 0.77 0.68 0.06 0.72 0.11 0.99
Modified Wald
test
(p-value)
0.00
White test
(p-value) 0.00 0.00 0.00 0.00 0.00 0.00 0.00 0.00 0.00 0.00 0.00 0.00 0.00
F-Test
(p-value) 3.26**
(0.02)
Chi-2-Test (p-
value) . . . . . . . . . . .
Adjusted R2 .135 0.133 0.133 .038 0.133 0.140 0.128 .109 0.105 0.105 0.112 0.105 0.118 0.103
N 295 297 297 297 297 297 295 296 298 298 298 298 298 296
Panel B. Ownership types as dummy
Model 3 Model 4
Pred.
Sign All FAM GOV DOMC DOMI FOR PUB All FAM GOV DOMC DOMI FOR PUB
RE RE RE RE FE RE FE RE RE RE RE FE RE RE
FAM - .037
(1.20) .093*** (2.73)
.028 (0.78)
.075* (1.93)
GOV - -.026
(-0.33) -.042
(-0.71) -.014
(-0.19) -.039
(-0.83)
DOMC + .001
(0.01) .044
(0.76) .017
(0.23) .057
(0.96)
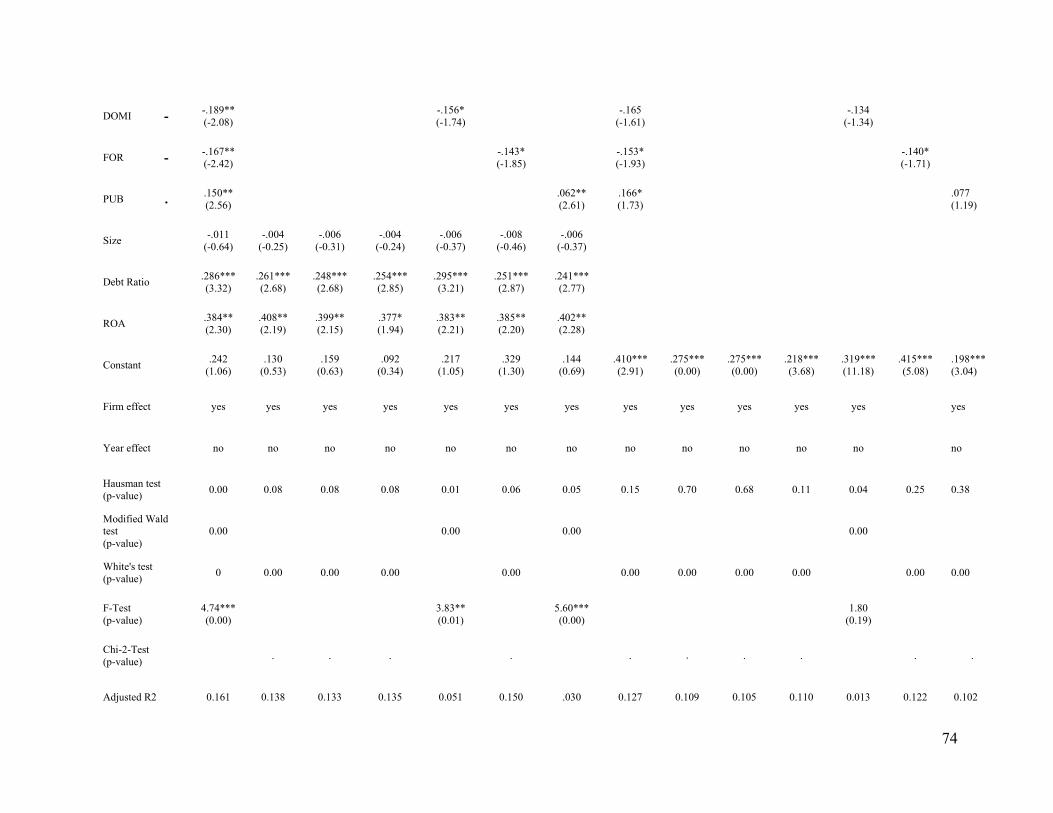
74
DOMI - -.189**
(-2.08) -.156*
(-1.74) -.165
(-1.61) -.134
(-1.34)
FOR - -.167**
(-2.42) -.143*
(-1.85) -.153*
(-1.93) -.140*
(-1.71)
PUB . .150**
(2.56) .062**
(2.61)
.166*
(1.73) .077
(1.19)
Size -.011
(-0.64)
-.004
(-0.25)
-.006
(-0.31)
-.004
(-0.24)
-.006
(-0.37)
-.008
(-0.46)
-.006
(-0.37)
Debt Ratio .286***
(3.32)
.261***
(2.68)
.248***
(2.68)
.254***
(2.85)
.295***
(3.21)
.251***
(2.87)
.241***
(2.77)
ROA .384**
(2.30)
.408**
(2.19)
.399**
(2.15)
.377*
(1.94)
.383**
(2.21)
.385**
(2.20)
.402**
(2.28)
Constant .242
(1.06)
.130
(0.53)
.159
(0.63)
.092
(0.34)
.217
(1.05)
.329
(1.30)
.144
(0.69)
.410***
(2.91)
.275***
(0.00)
.275***
(0.00)
.218***
(3.68)
.319***
(11.18)
.415***
(5.08)
.198***
(3.04)
Firm effect yes yes yes yes yes yes yes yes yes yes yes yes yes
Year effect no no no no no no no no no no no no no
Hausman test
(p-value) 0.00 0.08 0.08 0.08 0.01 0.06 0.05 0.15 0.70 0.68 0.11 0.04 0.25 0.38
Modified Wald test
(p-value)
0.00 0.00 0.00 0.00
White's test
(p-value) 0 0.00 0.00 0.00 0.00 0.00 0.00 0.00 0.00 0.00 0.00
F-Test
(p-value)
4.74***
(0.00) 3.83**
(0.01) 5.60***
(0.00) 1.80
(0.19)
Chi-2-Test
(p-value) . . . . . . . . . .
Adjusted R2 0.161 0.138 0.133 0.135 0.051 0.150 .030 0.127 0.109 0.105 0.110 0.013 0.122 0.102
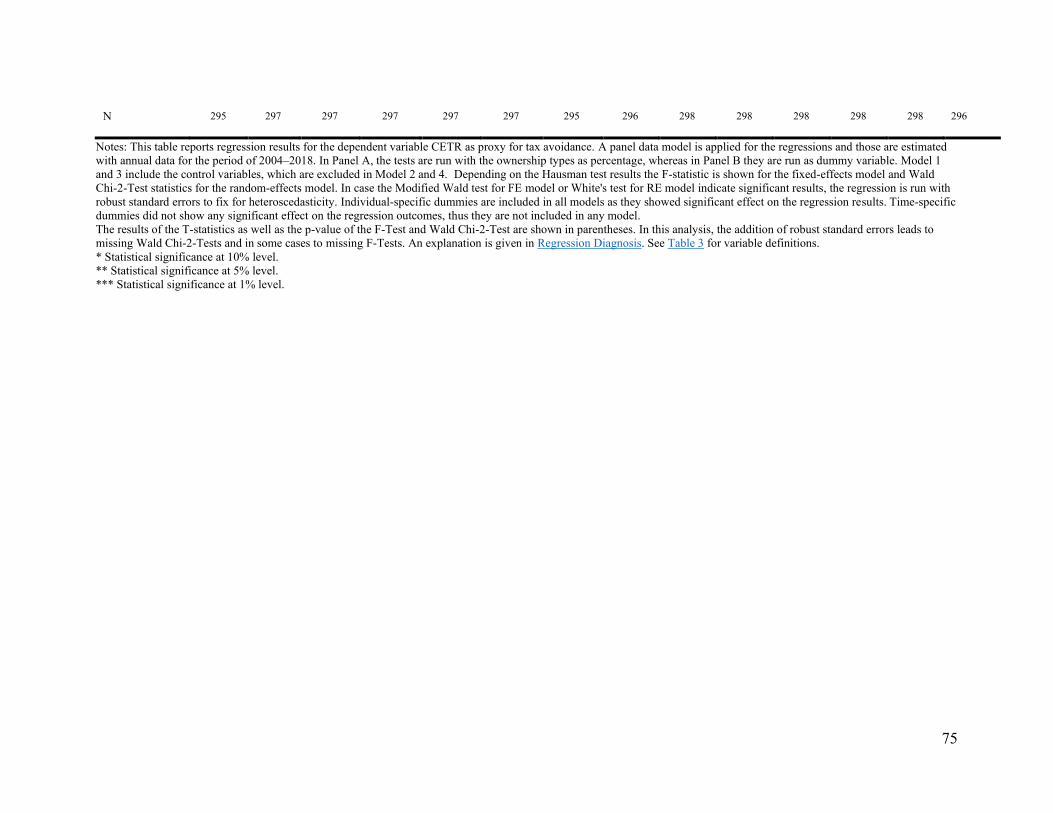
75
N 295 297 297 297 297 297 295 296 298 298 298 298 298 296
Notes: This table reports regression results for the dependent variable CETR as proxy for tax avoidance. A panel data model is applied for the regressions and those are estimated
with annual data for the period of 2004–2018. In Panel A, the tests are run with the ownership types as percentage, whereas in Panel B they are run as dummy variable. Model 1
and 3 include the control variables, which are excluded in Model 2 and 4. Depending on the Hausman test results the F-statistic is shown for the fixed-effects model and Wald
Chi-2-Test statistics for the random-effects model. In case the Modified Wald test for FE model or White's test for RE model indicate significant results, the regression is run with
robust standard errors to fix for heteroscedasticity. Individual-specific dummies are included in all models as they showed significant effect on the regression results. Time-specific
dummies did not show any significant effect on the regression outcomes, thus they are not included in any model.
The results of the T-statistics as well as the p-value of the F-Test and Wald Chi-2-Test are shown in parentheses. In this analysis, the addition of robust standard errors leads to
missing Wald Chi-2-Tests and in some cases to missing F-Tests. An explanation is given in Regression Diagnosis. See Table 3 for variable definitions.
* Statistical significance at 10% level.
** Statistical significance at 5% level.
*** Statistical significance at 1% level.
5.4.8 Regression Analysis with First-Difference
Table 7 provides an overview of the first-difference regression analysis of CETR showing solely
the significant results. The complete tables are reported in Appendix D. Also the overview of the
results on ETR and PBT can be found in Appendix E.
Table 7 starts with the interesting findings on the effect of a changing FAM on shifts in CETR and
ETR over the consecutive years. As one can see, family ownership as dummy variable (Model 3
& 4) has a significant positive effect on CETR with the two-way error component model as well
as the first-difference method. Average changes in FAM as dummy variable and sole owner, leads
to about 24.9%-2.79% higher ETR, with or without control variables. Regarding ETR, FAM
ownership affects ETR as percentage and co-owner in Model 1 and 2 of the first-difference
regression table. Model 1 shows the same significant effect in both regression methods
(significance level 0.05).
No significant results regarding FAM and PBT are found. This supports the earlier findings
regarding FAM and PBT. All in all, FAM significantly affects changes in firm’s CETR and ETR
positively over the years. All other results remain non-significant regarding FAM. The addition of
the first-difference supports the conclusion that H1 has to be rejected. Rather family ownership
leads to less tax avoidance.
A highly interesting result is that of GOV and tax avoidance in this model. Whereas with
the two-way error component model no significant effect was found regarding GOV and any tax
avoidance proxy, the first-difference method reports that ΔGOV leads to higher ΔCETR and ΔETR
and lower ΔPBT. And
Table 7 Model 1 shows that with an increase in GOV (as continuous variable) between the
consecutive years, CETR is expected to increase by 87% . The same direction is true in the case
of ETR, which increases by 72,9% – 87,8% (Table E1). In both cases GOV does so as sole owner.
It seems, that ΔGOV lead to lower PBT as reported in Table E2 (Model 1, 3 & 4). As sole as well
as co-oner, state ownership seems to decrease PBT.
Nevertheless, with the strong evidence on both tax avoidance proxies CETR and ETR, one can
conclude that the effect of changes in state ownership on changes on tax avoidance contradict H2.
Rather the traditional view of state ownerships role is supported.
ΔDOMC effects on ΔPBT are the same as earlier results indicated (E2). No significant
effect is reported. Nevertheless, when accounting for the effect of ΔDOMC in ΔETR and ΔCETR
77
(Table 7 and E1) the results are significant and positive. In Table 7 one can see that additionally,
changes in DOMC as dummy variable significantly lead to higher ETR. When controlling for
ΔSIZE, ΔDEBT ΔRATIO and ΔROA, ΔDOMC as sole owner, leads to a CETR increase of 38,6%
(significance level 0.05) and as co-owner to an ETR increase of 81,3% (significance level 0.01).
With this results, H3 is not rejected. In this database, DOMC does not lead to tax avoidance.
The first-difference method did not report significant effects of ΔDOMI on ΔCETR. It does
however strongly support the earlier results of DOMI and ETR. As can be gathered from Table
E1, on average ΔDOMI leads to negative changes in ETR with the significance levels 0.01 and
0.05 in Model 3 and 4, hence as dummy variables. Meaning that a change from 0 to 1 domestic
institutional owner leads to a decrease in ETR by e.g. 15,3% (Model 3) after controlling for ΔSIZE,
ΔDEBT ΔRATIO and ΔROA. DOMI still does not significantly affect PBT in any case. The results
support H4, meaning DOMI leads to tax avoidance.
All results of the two-way error component analysis regarding FOR and the dependent
variables are supported by the FD method. In all cases FOR significantly leads to lower CETR,
ETR and PBT, hence to tax avoidance most of the time at the significance level 0.01. This means,
there is a strong evidence that FOR leads to tax avoidance as hypothesized (H5). For instance, as
shown in Table 7 Model 3, ΔFOR as dummy variable and sole owner, leads to 34,1% % decrease
in ETR, after controlling for SIZE, DEBT RATIO and ROA. Regarding ETR, ΔFOR as sole owner
and dummy variable, leads to an increase in ΔETR of 15,3% (Table E1 Model 3). Moreover as
Table E2 Model 4 report, a change from 0 to 1 FOR decreases PBT by $78.5 million (USD) when
accounting for the control variables.
The FD method reports no significant results on PUB and the dependent variables, except for
ΔETR.
To sum it up, the first-difference method results mostly confirm earlier regression findings.
The first-difference method did not provide results indicating the opposite direction of prior
reported relationships. In the case of ΔDOMI effect on ΔCETR and ΔPUB on ΔCETR and ΔPBT,
it showed no significant effect, which were significant in earlier regression results. But mostly, the
FD method supported the two-way error component regression results. Additionally it did provide
new and interesting findings on the role of family ownership and state ownership in this study.
Whereas earlier no significant results have been found on GOV regarding ETR and CETR and
PBT, when accounting for the effect of changes one can find significant positive effects on CETR

78
and ETR and negative effect on PBT. FAMs positive effect on ETR is also strengthened by the
first-difference method. An overview of the hypothesized and actual effects of both equation
methods are reported in Table 8.
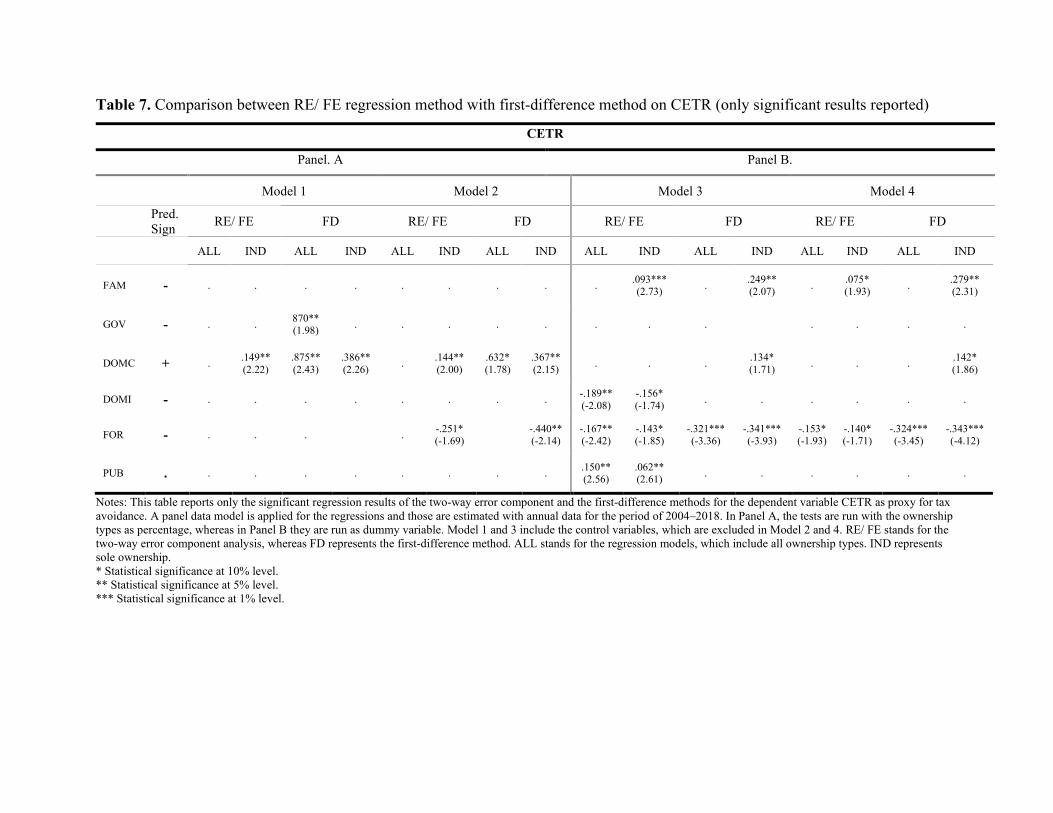
Table 7. Comparison between RE/ FE regression method with first-difference method on CETR (only significant results reported)
CETR
Panel. A Panel B.
Model 1 Model 2 Model 3 Model 4
Pred.
Sign RE/ FE FD RE/ FE FD RE/ FE FD RE/ FE FD
ALL IND ALL IND ALL IND ALL IND ALL IND ALL IND ALL IND ALL IND
FAM - . . . . . . . . . .093*** (2.73)
. .249** (2.07)
. .075* (1.93)
. .279** (2.31)
GOV - . . 870** (1.98)
. . . . . . . . . . . .
DOMC + . .149**
(2.22)
.875**
(2.43)
.386**
(2.26) .
.144**
(2.00)
.632*
(1.78)
.367**
(2.15) . . .
.134*
(1.71) . . .
.142*
(1.86)
DOMI - . . . . . . . . -.189**
(-2.08)
-.156*
(-1.74) . . . . . .
FOR - . . . . -.251* (-1.69)
-.440** (-2.14)
-.167** (-2.42)
-.143* (-1.85)
-.321*** (-3.36)
-.341*** (-3.93)
-.153* (-1.93)
-.140* (-1.71)
-.324*** (-3.45)
-.343*** (-4.12)
PUB . . . . . . . . . .150** (2.56)
.062** (2.61)
. . . . . .
Notes: This table reports only the significant regression results of the two-way error component and the first-difference methods for the dependent variable CETR as proxy for tax
avoidance. A panel data model is applied for the regressions and those are estimated with annual data for the period of 2004–2018. In Panel A, the tests are run with the ownership
types as percentage, whereas in Panel B they are run as dummy variable. Model 1 and 3 include the control variables, which are excluded in Model 2 and 4. RE/ FE stands for the
two-way error component analysis, whereas FD represents the first-difference method. ALL stands for the regression models, which include all ownership types. IND represents
sole ownership.
* Statistical significance at 10% level.
** Statistical significance at 5% level.
*** Statistical significance at 1% level.
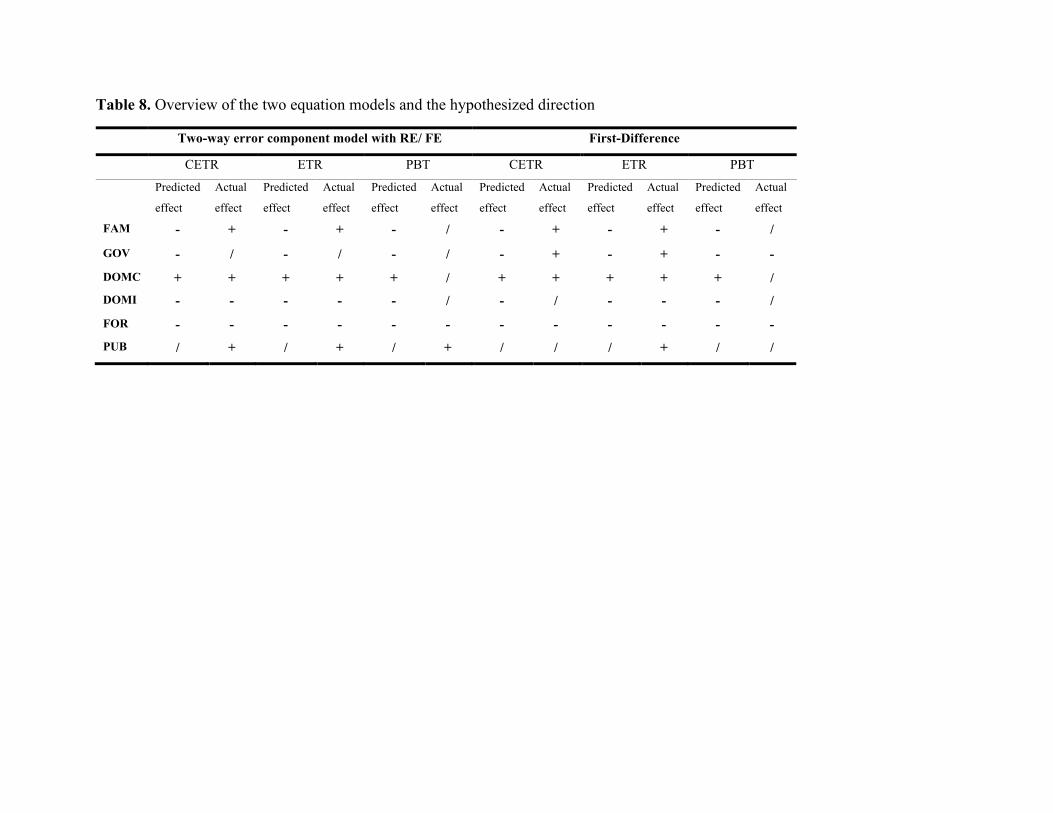
Table 8. Overview of the two equation models and the hypothesized direction
Two-way error component model with RE/ FE First-Difference
CETR ETR PBT CETR ETR PBT
Predicted
effect
Actual
effect
Predicted
effect
Actual
effect
Predicted
effect
Actual
effect
Predicted
effect
Actual
effect
Predicted
effect
Actual
effect
Predicted
effect
Actual
effect
FAM - + - + - / - + - + - /
GOV - / - / - / - + - + - -
DOMC + + + + + / + + + + + /
DOMI - - - - - / - / - - - /
FOR - - - - - - - - - - - -
PUB / + / + / + / / / + / /
6 Conclusion
6.1 Conclusion and Discussion
On the one hand, there are the sicnere people, who pay taxes accordingly and face the costs. On
the other hand, there are companies, who act as economic free riders. They enjoy the societal
privileges and society without the responsibility and costs of contributing with tax payment. Such
corporations apply tax avoidance techniques in order to decrease tax payments, hence not fully
meet their tax duties. This behaviour particularly affects developing countries like Indonesia and
causes illicit financial flows, leading to state revenue gaps. Here starts a circle: gaps in state
revenue lead to less funds for health care, education, poverty, environmental issues and
development. With these gaps, host countries are in need of financial support - typically provided
by other countries. Hence, illicit financial flows lead to the event that individual tax payers of the
one country actually also pay for the gaps in the country in which the tax avoiding company is
located.
Whereas the traditional view of tax avoidance implies that it leads to shareholder value,
aspects of the agency theory and the damage it can cause, as mentioned earlier, imply another
direction. The agency theory states that conflicts between firm parties such as managers and
shareholders or minority and majority shareholders, can arise if the intends are different. The one
uses its influence above the other and exploits it for selfish goals. Hence different kind of identities
and diversions of shareholding power can cause conflicts and unrightful decisions. Here is where
this study draws the link between the firm parties and the effect on tax avoidance. Specifically, the
focus lies on ownership type, which is based on ownership concentration and identity, and its
effects on firm’s decision making, in this case tax avoidance. Namely tax avoidance practices do
not happen without the knowledge of controlling owners, since those due to their majority of
shares, have decision making privileges. To tackle and research the issue of the roll of the firm’s
ownership type on tax avoidance, this thesis studies public Indonesian mining companies between
2004 and 2018.
Indonesian mining companies are a valuable unit of study. The mining industry contributes
to a large extend to state revenue, countries GDP, exports, employment and development of remote
areas. Nevertheless, the industry seems to experience tax crimes that account for 10.5% of the total
82
illicit financial flows, whereas its contribution to makes Indonesia to one of the top coal exporters
globally should rather strengthen its contribution towards the country. Tax avoidance is measured
with the proxies profit before tax (PBT), effective tax rate (ETR) and cash effective tax rate
(CETR). The independent variables are the ownership types family (FAM), state (GOV), domestic
corporations (DOMC), domestic institutions (DOMI), foreign (FOR) and public (PUB). Control
variables are size, debt ratio and return on assets. After reviewing prior literature regarding
ownership structure and/ or tax avoidance, this paper draws the following hypothesises. H1 and
H2 state that family and state ownership, respectively, of Indonesian mining firms have a positive
effect on tax avoidance. H3 assumes a negative effect between domestic corporate ownership of
Indonesian mining companies and tax avoidance, whereas H4 and H5 (domestic institutional and
foreign ownership) assume a positive effect. No hypothesis is given for public ownership. The
inclusion of this type is merely for the purpose of data completion, since the firms are trading the
in the IDX stock exchange and public ownership also accounts for at least 5% (controlling owner)
in 96,6% of the cases. Nevertheless, regression results indicate that public ownership leads to
higher PBT, ETR and CETR, meaning a negative effect on tax avoidance.
To test the thesis’s hypotheses, this study applied the two-way error component model:
with either the fixed-effects or random-effects model (depending on the Hausman test result) and
the first-difference method, which accounts for the changes in the dependent variable by changes
in the independent variables.
The regression results show that firm’s ownership structure has an effect on tax avoidance.
As hypothesized, domestic institutional and foreign ownership (H4 and H5) do lead to tax
avoidance, as supported by the results of both methods, the two-way error component model and
the first-difference model. Also, the results of domestic corporate ownership support the
hypothesized direction (H3). Both regression methods report a significant positive relationship
between DOMC and ETR. That said, domestic corporate ownership is negatively associated with
tax avoidance. Nevertheless, the other two hypotheses H1 and H2 have to be rejected. Whereas
the study’s assumption was that family and state ownership lead to tax avoidance, the regression
results report a significant positive relationship between these two variables and CETR and ETR .
Namely, FAM seems to lead to higher CETR and ETR as reported in both regression models,
whereas GOV leads to higher ETR and CETR as reported in the first-difference model. This
indicates less tax avoidance by these type of owners.
83
When applying the first-difference method, results show either the same direction
(sometimes with stronger significance) or provide new information. In no case opposite directions
are reported.
Regarding H1, it seems that prior research was discordant in their results. This thesis’s
results of family ownership on tax avoidance supports prior findings, which indicated a negative
effect. The results of H2 in this thesis contradict the views of prior findings and rather supports the
conventional view, which states that state owners enact on their responsibilities and rather want to
maximize social welfare and ensure fair prices (Shleifer and Vishny, 1994). It seems that the state
also enacts on its responsibilities in developing countries with weak corporate governance.
Nevertheless state seems to lead to less profit before taxes to some degree, hence more research
on the role of the state as owner might be useful to gain a clearer direction.
As explained earlier, not much was found on the role of domestic corporate and institutional
ownership on tax avoidance. Nevertheless, as this study’s results have shown, the approach to rely
on research papers investigating the role of domestic corporate owners on other firm factors like
performance was helpful and the hypothesises of these two owners are not rejected. This and the
few prior theses, which included these owners during their ownership structure studies, exhibit a
relevant and significant research area.
In conclusion, the research question can be successfully answered. All types of owners
investigated in this study, have either a positive or negative effect on tax avoidance.
This thesis provides contributable insights into the study of ownership structure in general
and its link to tax avoidance, in particular for emerging markets. Clearly the type of owners of
Indonesian mining companies play a relevant role regarding the countries illicit financial flows
and gaps in state revenue. As mentioned before, the mining industry in Indonesia would contribute
even much more to the countries development and state revenue, if it would not be exploited by
specific type of owners and other insiders. Clearly, the money generated by the firm is not allocated
rightfully. Instead of losing state revenue due to tax avoidance, the money could be used to
decrease poverty and improve the environment. For instance the country would be able to invest
in the health care, education and technology regarding the refineries or more sustainable methods
of energy production. As long as selfish owners control the companies and receive their steady
benefits by the current firm operations and regulation systems, no change is within site. This and
similar studies should act as helpful and valuable tools for increasing awareness regarding such
84
practices and their determinants. Also tax authorities can include such findings for further
adjustments.
6.2 Limitation and Further Research
As the results show, this study was able to identify a relationship between ownership types and tax
avoidance and by this can contribute to research regarding ownership structure and also
determinants of tax avoidance. Nevertheless, this study experienced some limitations. The first
challenge came across during the search for prior research providing information on the role of
ownership types and tax avoidance. It was not possible to find the ultimate owners in many cases.
Databases were either not found or required financial resources. Whereas Orbis and the financial
reports provided some information, often the ultimate owners aggravated the problem again
through tactics they used in order to hide their identity. They did so by for instance by mentioning
names, which were not traceable by the web or they owned the firm via another firm at which at
some point the information regarding the owners stopped. Namely, those were located in the virgin
islands e.g. and belong again to a network of firms. Also, ownership information in Orbis did not
always comply with that of the financial reports, in which the reports were chosen since these have
to undergo audits.
Other limitations were the transparency of the firms’ financial reports. Many firms
provided financial reports only in Bahasa (Indonesian language). Also, some pages like those
containing their shareholder information were scanned poorly making them impossible to read.
Next, Orbis, which provided financial data in United States dollar (USD), reported the data
only for a couple of years. Thus, prior years financial data had to be gathered completely from the
firms’ reports. Therefore additionally, in some occasions the currency needed to be converted from
Rupiah to USD.
These limitations can be reference points for further research. Researchers who plan to
investigate ownership structure should look at different kind of industries since they might differ
regarding their owners’ identities. Furthermore, it might be interesting to study public mining
companies in other emerging areas in order to compare them and to find possible similarities. The
findings then can be compared with developed countries’s findings. Investigating private firms
might entail different results.
85
More research and alignment of them regarding the effect of ownership types and
companies, could possibly influence and improve law regulations within the firm but also
nationwide regarding taxes in order to prevent scandals. If there is enough scientific proof and
information, one might achieve huge impact on the injustice brought by the tunnelling of money
within such companies.
The effects of other firm insiders could also be an interesting subject to look at such as
managers and board of directors connection towards tax avoidance. Some prior studied their role,
but further research might investigate them additionally together with other types of owners, hence
take type-I as well as type-II agency perspectives. Further research might also consider another
interesting proxy for tax avoidance, namely related party transactions, as these are also available
in the financial reports and seem to belong to the tunnelling activities.
One more suggestion for further research is the time aspects of the study. Most of the prior
research referred to in this study used couple of years in their dataset, whereas including more
years might provide other interesting observations like trends.
Studies like this rely and depend much on the availability of data and trustworthy information,
which seems to be lacking due to purposely hiding or other manipulations. An idea could be to
cooperate with other institutions like governments or federal agencies. In the example of
Netherlands further research could cooperate with the Fiscal Information and Investigation Service
(FIOD), which investigates financial crimes. Such institutions might have valuable knowledge and
tools for this kind of research.
7 REFERENCES
Aggarwal, R., Erel, I., Ferreira, M., & Matos, P. (2011). Does governance travel around the
world? Evidence from institutional investors. In Journal of Financial Economics (Vol. 100,
Issue 1, pp. 154–181). https://doi.org/10.1016/j.jfineco.2010.10.018
Al-Fayoumi, N. A., & Abuzayed, B. M. (2009). Ownership structure and corporate financing.
Applied Financial Economics, 19(24), 1975–1986.
https://doi.org/10.1080/09603100903266807
Alin, A. (2010). Multicollinearity. Wiley Interdisciplinary Reviews: Computational Statistics,
2(3), 370–374. https://doi.org/10.1002/wics.84
Ang, J. S., Cole, R., & Lin, J. W. (2000). Agency costs and ownership structure. The Journal Of
Finance, Lv(1), 111–131. https://doi.org/10.4324/9780203940136
Annuar, H. A., Salihu, I. A., & Obid, S. N. S. (2014). Corporate Ownership, Governance and
Tax Avoidance: An Interactive Effects. Procedia - Social and Behavioral Sciences,
164(August), 150–160. https://doi.org/10.1016/j.sbspro.2014.11.063
Badertscher, B. A., Katz, S. P., & Rego, S. O. (2013). The separation of ownership and control
and corporate tax avoidance. Journal of Accounting and Economics, 56(2–3), 228–250.
https://doi.org/10.1016/j.jacceco.2013.08.005
Baltagi, B. H. (2008). Econometrics (4rth ed.). Springer-Verlag Berlin Heidelberg.
http://library1.nida.ac.th/termthesis6/sd/2554/19755.pdf
Bayar, O., Huseynov, F., & Sardarli, S. (2018). Corporate Governance, Tax Avoidance, and
Financial Constraints. Financial Management, 47(3), 651–677.
https://doi.org/10.1111/fima.12208
Bennedsen, M., & Zeume, S. (2015). Corporate Tax Havens and Shareholder Value. National
Tax Association, 108. https://doi.org/10.2139/ssrn.2586318
Boone, A. L., & White, J. T. (2015). The effect of institutional ownership on firm transparency
and information production. Journal of Financial Economics, 117(3), 508–533.
https://doi.org/10.1016/j.jfineco.2015.05.008
Borenstein, M., Hedges, L. V, Higgins, J. P. T., & Rothstein, H. R. (2010). A basic introduction
to fixed-effect and random-effects models for meta-analysis. Research Synthesis Methods,
1(2)(December 2009), 97–111. https://doi.org/10.1002/jrsm.12
87
Bradshaw, M., Guanmin, L., & Ma, M. S. (2016). Ownership Structure and Tax Avoidance:
Evidence from Agency Costs of State Ownership in China. SSRN Electronic Journal.
https://doi.org/10.2139/ssrn.2239837
Brown, L. D., & Caylor, M. L. (2006). Corporate governance and firm valuation. Journal of
Accounting and Public Policy, 25(4), 409–434.
https://doi.org/10.1016/j.jaccpubpol.2006.05.005
Cen, W., Tong, N., & Sun, Y. (2017). Tax avoidance and cost of debt: evidence from a natural
experiment in China. Accounting and Finance, 57(5), 1517–1556.
https://doi.org/10.1111/acfi.12328
Chan, K. H., Mo, P. L. L., & Tang, T. (2016). Tax avoidance and tunneling: Empirical analysis
from an agency perspective. Journal of International Accounting Research, 15(3), 49–66.
https://doi.org/10.2308/jiar-51345
Chan, K. H., Mo, P. L. L., & Zhou, A. Y. (2013). Government ownership, corporate governance
and tax aggressiveness: Evidence from China. Accounting and Finance, 53(4), 1029–1051.
https://doi.org/10.1111/acfi.12043
Chen, S., Chen, X., Cheng, Q., & Shevlin, T. (2010). Are family firms more tax aggressive than
non-family firms? Journal of Financial Economics, 95(1), 41–61.
https://doi.org/10.1016/j.jfineco.2009.02.003
Christensen, J., & Murphy, R. (2004). The Social Irresponsibility of Corporate Tax Avoidance :
Taking CSR to the bottom line. Development, 47(December 2001), 37–44.
https://doi.org/10.1057/palgrave.development.1100066
Claessens, S., & Yurtoglu, B. B. (2013). Corporate governance in emerging markets: A survey.
Emerging Markets Review, 15, 1–33. https://doi.org/10.1016/j.ememar.2012.03.002
Clark, S. T., & Drew, A. L. (2015). Should I Use Fixed or Random Effects? Political Science
Research and Methods, 3(2), 399–408. https://doi.org/10.1017/psrm.2014.32
Cooper, B. H. M., Patall, E. A., Lindsay, J. J., Bickman, L., & Rog, D. J. (2013). Research
Synthesis and Meta-Analysis In : The SAGE Handbook of Applied Social Research
Methods. SAGE Publications, 344–370.
Cordes, J. J., & Galper, H. (1985). Tax shelter activity: lessons from twenty years of evidence.
National Tax Journal, 305–325.
Cramer, D., & Howitt, D. (2011). The SAGE Dictionary of Statistics. SAGE Publications, Ltd.
88
Cuervo-Cazurra, A. (2018). Thanks but no thanks: State-owned multinationals from emerging
markets and host-country policies. Journal of International Business Policy, 128–156.
Cullinan, C. P., Wang, F., Wang, P., & Zhang, J. (2012). Ownership structure and accounting
conservatism in China. Journal of International Accounting, Auditing and Taxation, 21(1),
1–16. https://doi.org/10.1016/j.intaccaudtax.2012.01.001
Curtis, B. M., & Consultant, I. (2011). The role of transparent and fair taxation in converting
Africa ’ s mineral wealth into development. Proparco Magazine, 8, 1–4.
Dahlquist, M., & Robertsson, G. (2001). Direct foreign ownership, institutional investors, and
firm characteristics. Journal of Financial Economics, 59(3), 413–440.
https://doi.org/10.1016/S0304-405X(00)00092-1
Deloitte. (2019). Indonesia Tax Guide 2019-2020.
Demirgüç-Kunt, A., & Huizinga, H. (2001). The taxation of domestic and foreign banking.
Journal of Public Economics, 79(3), 429–453. https://doi.org/10.1016/S0047-
2727(00)00071-2
Demsetz, H., & Kenneth, L. (1985). The Structure of Corporate Ownership : Causes and
Consequences. Journal of Political Economy, 93(6), 1155–1177.
Desai, A. M., & Dharmapala, D. (2009). Corporate Tax Avoidance And Firm Value. The Review
of Economics and Statistics, 91(3), 537–546.
Dharwadkar, R., George, G., & Brandes, P. (2000). Privatization in Emerging Economies : An
Agency Theory Perspective. The Academy of Management Review, 25(3), 650–669.
Dijk van, M., Weyzig, F., & Murphy, R. (2006). The Netherlands: A tax haven? In Stichting
Onderzoek Multinationale Ondernemingen (SOMO) Centre for Research on Multinational
Corporations (Vol. 47, Issue November). https://doi.org/10.1007/978-94-6265-207-1_15
Douma, S., George, R., & Kabir, R. (2006). Foreign and domestic ownership, business groups,
and firm performance: Evidence from a large emerging market. Strategic Management
Journal, 27(7), 637–657. https://doi.org/10.1002/smj.535
Dyreng, S. D., Hanlon, M., & Maydew, E. L. (2008). Long-Run Corporate Tax Avoidance. The
Accounting Review, 83(1), 61–82.
Fernández-Rodríguez, E., García-Fernández, R., & Martínez-Arias, A. (2019). Influence of
ownership structure on the determinants of effective tax rates of Spanish Companies.
Sustainability, 11(5). https://doi.org/10.3390/su11051441
89
Fitrianto, A., & Musakkal, K. F. N. (2016). Panel Data Analysis for Sabah Construction
Industries : Choosing the Best Model. Procedia Economics and Finance, 35(October 2015),
241–248. https://doi.org/10.1016/S2212-5671(16)00030-7
Fuest, C., Spengel, C., Finke, K., Heckemeyer, J., & Nusser, H. (2013). Profit Shifting and
“Aggressive” Tax Planning by Multinational Firms: Issues and Options for Reform. SSRN
Electronic Journal, 13. https://doi.org/10.2139/ssrn.2343124
Gaaya, S., Lakhal, N., & Lakhal, F. (2017). Does family ownership reduce corporate tax
avoidance? The moderating effect of audit quality. Managerial Auditing Journal, 32(7),
731–744. https://doi.org/10.1108/MAJ-02-2017-1530
García, J. P., Familiar, C. D. E., & Salamanca, U. De. (2008). Does Family Ownership Impact
Positively on Firm Value ? Establecimiento de Puentes En Una Economía Global,
1(January), 1–15. http://dialnet.unirioja.es/servlet/articulo?codigo=2723600
Gelder, J. W van, Koningsveld, T. J. J. van, Ferwerda, J. J., & Wilde de, J. (2016). Tax
avoidance by mining companies in developing countries An analysis of potential Dutch
policy initiatives (Issue December). Profundo Report.
Giannetti, M., & Laeven, L. (2009). Pension reform, ownership structure, and corporate
governance: Evidence from a natural experiment. Review of Financial Studies, 22(10),
4091–4127. https://doi.org/10.1093/rfs/hhn091
Gill, J. (2011). Generalized Linear Models. SAGE Publications, Inc., 1–7.
Graham, J. R., Hanlon, M., Shevlin, T., & Shroff, N. (2014). Incentives for Tax Planning and
Avoidance: Evidence from the field. Accounting Review, 89(3), 991–1023.
https://doi.org/10.2308/accr-50678
Graham, J. R., & Tucker, A. L. (2006). Tax shelters and corporate debt policy. Journal of
Financial Economics, 81, 563–594. https://doi.org/10.1016/j.jfineco.2005.09.002
Hair, J. F., Black, W. C., Babin, B. J., & Anderson, R. E. (2014). Multivariate data analysis.
Pearson New International Edition.
Handayani, Y. D., & Ibrani, E. Y. (2019). Corporate Governance , Share Ownership Structure
And Tax Avoidance , International International of Commerce of Commerce and and
Finance Finance. International Journal of Commerce and Finance, 5(2), 120–127.
Harvey, A. C. (1980). On Comparing Regression Models in Levels and First Differences.
International Economic Review, 21(3), 707–720.
90
Hong, Q., & Smart, M. (2010). In praise of tax havens : International tax planning and foreign
direct investment. European Economic Review, 54(1), 82–95.
https://doi.org/10.1016/j.euroecorev.2009.06.006
Hope, O. K., Ma, M. S., & Thomas, W. B. (2013). Tax avoidance and geographic earnings
disclosure. Journal of Accounting and Economics, 56(2–3), 170–189.
https://doi.org/10.1016/j.jacceco.2013.06.001
Horobet, A., Belascu, L., Curea, C. S., & Pentescu, A. (2019). Ownership Concentration and
Performance Recovery Patterns in the European Union. Sustainability, 11.
https://doi.org/10.3390/su11040953
Hsiao, C. (2003). Analysis of Panel Data. Cambridge University Press.
Huseynov, F., & Klamm, B. K. (2012). Tax avoidance, tax management and corporate social
responsibility. Journal of Corporate Finance, 18(4), 804–827.
https://doi.org/10.1016/j.jcorpfin.2012.06.005
Institute Indonesian Mining. (2018). Report on Indonesia Mining Sector Diagnostic (Issue
November).
International Tax Review and PWC. (2007). Tax management in companies. In Euromoney
Institutional Investor PLC (Issue 29).
Jian, M., Li, W., & Zhang, H. (2012). How does state ownership affect tax avoidance? Evidence
from China. In School of Accountancy.
Jian, M., & Wong, T. J. (2003). Earnings Management and Tunneling through Related Party
Transactions: Evidence from Chinese Corporate Groups. SSRN Electronic Journal.
https://doi.org/10.2139/ssrn.424888
Jin, K., & Park, C. (2015). Separation of Cash Flow and Voting Rights and Firm Performance in
Large Family Business Groups in Korea. Corporate Governance: An International Review,
23(5), 434–451. https://doi.org/10.1111/corg.12102
Jong, L., & Ho, P. L. (2018). Inside the family firms: The impact of family and institutional
ownership on executive remuneration. Cogent Economics and Finance, 6(1).
https://doi.org/10.1080/23322039.2018.1432095
Kabir, R., Li, H., & Veld-Merkoulova, Y. V. (2013). Executive compensation and the cost of
debt. Journal of Banking and Finance, 37(8), 2893–2907.
https://doi.org/10.1016/j.jbankfin.2013.04.020
91
Kang, J., & Stulz, M. S. (1997). Is Bank-Centered Corporate Governance Worth It? A Cross-
Sectional Analysis of the Performance of Japanese Firms during the Asset Price Deflation.
National Bureau of Economic Research.
Kendall, B. E. (2015). A statistical symphony : Instrumental variables reveal causality and
control measurement error. Oxford University Press.
Khan, M., Srinivasan, S., & Tan, L. (2017). Institutional ownership and corporate tax avoidance:
New evidence. Accounting Review, 92(2), 101–122. https://doi.org/10.2308/accr-51529
Kiesewetter, D., & Manthey, J. (2017). Tax avoidance , value creation and CSR – a European
perspective. Corporate Governance, 17(5), 803–821. https://doi.org/10.1108/CG-08-2016-
0166
Krivogorsky, V. (2006). Ownership, board structure, and performance in continental Europe.
International Journal of Accounting, 41(2), 176–197.
https://doi.org/10.1016/j.intacc.2006.04.002
La Porta, R., Lopez-de-Silanes, F., & Shleifer, A. (1999). Corporate ownership around the world.
Journal of Finance, 54(2), 471–517. https://doi.org/10.1111/0022-1082.00115
La Porta, R., Lopez-de-Silanes, F., Shleifer, A., & Vishny, R. W. (2007). Investor protection and
corporate governance. Journal of Financial Economics, 58, 91–110.
https://doi.org/10.4324/9780203940136
Lai, S., & Teo, M. (2008). Home-Biased Analysts in Emerging Markets. The Journal of
Financial and Quantitative Analysis, 43(3), 685–716.
Landry, S., Deslandes, M., & Fortin, A. (2013). Tax aggressiveness, corporate social
responsibility, and ownership structure. Journal of Accounting, Ethics and Public Policy,
14(3), 611–645. https://doi.org/10.2139/ssrn.2304653
Lanis, R., & Richardson, G. (2011). The effect of board of director composition on corporate tax
aggressiveness. Journal of Accounting and Public Policy, 30(1), 50–70.
https://doi.org/10.1016/j.jaccpubpol.2010.09.003
Lee, E. J., Chae, J., & Lee, Y. K. (2018). Family ownership and risk taking. Finance Research
Letters, 25(July 2017), 69–75. https://doi.org/10.1016/j.frl.2017.10.010
Liew, P. K. (2007). Corporate governance reforms in Malaysia: The key leading players’
perspectives. Corporate Governance: An International Review, 15(5), 724–740.
https://doi.org/10.1111/j.1467-8683.2007.00618.x
92
Lim, Y. (2011). Tax avoidance, cost of debt and shareholder activism: Evidence from Korea.
Journal of Banking and Finance, 35(2), 456–470.
https://doi.org/10.1016/j.jbankfin.2010.08.021
Longhi, B. S., & Nandi, A. (2019). Analysis of Panel Data for Continuous Dependent Variables.
SAGE Publications, Inc.
Love, J. H., Roper, S., & Du, J. (2009). Innovation, ownership and profitability. In International
Journal of Industrial Organization (Vol. 27, Issue 3, pp. 424–434).
https://doi.org/10.1016/j.ijindorg.2008.11.001
Mafrolla, E. (2019). Tax avoidance in government-owned firms: Evidence from Italy. Public
Money and Management, 39(3), 186–192. https://doi.org/10.1080/09540962.2018.1516955
Masripah, Diyanty, V., & Fitriasari, D. (2015). Controlling Shareholder and Tax Avoidance:
Governance, Family Ownership and Corporate. International Research Journal of Business
Studies, VIII(3), 167–180.
Masripah, M., Diyanty, V., & Fitriasar, D. (2016). Controlling Shareholder and Tax Avoidance:
Family Ownership and Corporate Governance. International Research Journal of Business
Studies, 8(3), 167–180. https://doi.org/10.21632/irjbs.8.3.167-180
Maury, B. (2006). Family ownership and firm performance: Empirical evidence from Western
European corporations. Journal of Corporate Finance, 12(2), 321–341.
https://doi.org/10.1016/j.jcorpfin.2005.02.002
Maury, B., & Pajuste, A. (2005). Multiple large shareholders and firm value. Journal of Banking
and Finance, 29(7), 1813–1834. https://doi.org/10.1016/j.jbankfin.2004.07.002
McGuir e, S. T., Wang, D., & Wilson, R. J. (2014). Dual class ownership and tax avoidance.
Accounting Review, 89(4), 1487–1516. https://doi.org/10.2308/accr-50718
Merkle, O. (2018). Overview of corruption and anti-corruption. Transparency International Anti-
Corruption Center.
Minnick, K., & Noga, T. (2010). Do corporate governance characteristics in fl uence tax
management ? Journal of Corporate Finance, 16(5), 703–718.
https://doi.org/10.1016/j.jcorpfin.2010.08.005
Mishra, A. V. (2013). Foreign ownership in Australian firms. Research in International Business
and Finance, 28(1), 1–18. https://doi.org/10.1016/j.ribaf.2012.09.002
Myers, S. C., & Majluf, N. S. (1984). Corporate financing and investment decisions when firms
93
have information that investors do not have. Journal of Financial Economics, 13(2), 187–
221. https://doi.org/10.1016/0304-405X(84)90023-0
Peljhan, D., Zajc Kejžar, K., & Ponikvar, N. (2020). Ownership Structure and Firm Exit Routes.
Applied Economics, 52(15), 1671–1686. https://doi.org/10.1080/00036846.2019.1677850
Pilos, N. Van Der. (2017). Tax Avoidance and Corporate Governance (Issue August 2017).
Erasmus School of Economics Rotterdam.
Pindado, J., Requejo, I., & de la Torre, C. (2008). Does family ownership impact positively on
firm value? Empirical evidence from Western Europe. Documento de Trabajo, 2, 1–34.
http://dialnet.unirioja.es/servlet/articulo?codigo=2723600
Platt, H., & Platt, M. (2012). Corporate board attributes and bankruptcy. Journal of Business
Research, 65(8), 1139–1143. https://doi.org/10.1016/j.jbusres.2011.08.003
Prabowo, M. A., Untoro, W., Trinugroho, I., & Angriawanb, A. (2014). State-owned enterprises,
efficiency and performance: The case of Indonesia. In International Business Management
(Vol. 8, Issue 2, pp. 153–158).
Richardson, G., Wang, B., & Zhang, X. (2016). Ownership structure and corporate tax
avoidance: Evidence from publicly listed private firms in China. Journal of Contemporary
Accounting and Economics, 12(2), 141–158. https://doi.org/10.1016/j.jcae.2016.06.003
Ruiter, R. (2017). Separation of ownership and control. Erasmus Univerity Rotterdam School of
Economics. https://doi.org/10.1086/467037
Ruiz-mallorquí, M. V., & Santana-martín, D. J. (2011). Dominant institutional owners and firm
value. Journal of Banking and Finance, 35, 118–129.
https://doi.org/10.1016/j.jbankfin.2010.07.020
Sacristán-Navarro, M., Gómez-Ansón, S., & Cabeza-García, L. (2011). Family ownership and
control, the presence of other large shareholders, and firm performance: Further evidence.
Family Business Review, 24(1), 71–93. https://doi.org/10.1177/0894486510396705
Saleh, M., Zahirdin, G., & Octaviani, E. (2017). Ownership structure and corporate performance:
Evidence from property and real estate public companies in Indonesia. Investment
Management and Financial Innovations, 14(2), 252–263.
https://doi.org/10.21511/imfi.14(2-1).2017.10
Saputra, W., & Abdullah, M. (2015). Tax, Crime and Illicit Financial Flows. In Publish what you
pay Indonesia.
94
Sari, D. K., Utama, S., & Rossieta, H. (2017). Tax Avoidance, Related Party Transactions,
Corporate Governance and the Corporate Cash Dividend Policy. Journal of Indonesian
Economy and Business, 32(3), 190. https://doi.org/10.22146/jieb.28658
Setiawan, D., Bandi, B., Phua, L. K., & Trinugroho, I. (2016). Ownership structure and dividend
policy in Indonesia. Journal of Asia Business Studies, 10(3), 230–252.
https://doi.org/10.1108/JABS-05-2015-0053
Shaipah, N., Wahab, A., & Holland, K. (2012). Tax planning , corporate governance and equity
value. The British Accounting Review, 44(2), 111–124.
https://doi.org/10.1016/j.bar.2012.03.005
Shleifer, A., & Vishny, R. W. (1994). Politicians and Firms. The Quarterly Journal of
Economics, 109(4), 995–1025.
Singh, K. (2015). Multivariate Analysis. Quantitative Social Research Methods, 177–227.
Sivathaasan, N. (2013). Foreign Ownership , Domestic Ownership and Capital Structure :
Special reference to Manufacturing Companies Quoted on Colombo Stock Exchange in Sri
Lanka . European Journal of Business and Management, 5(20), 35–42.
Sudibyo, Y. A., & Jianfu, S. (2016). Political connections, state owned enterprises and tax
avoidance: An evidence from Indonesia. Corporate Ownership and Control,
13(3continued2), 279–283. https://doi.org/10.22495/cocv13i3c2p2
Suk, I., & Zhao, Y. (2017). Does Financial Statement Comparability Deter Aggressive Tax
Avoidance? SSRN Electronic Journal, 1–50. https://doi.org/10.2139/ssrn.3065250
Tang, T. Y. H. (2019). The Value Implications of Tax Avoidance Across Countries. Journal of
Accounting, Auditing & Finance, 34(4), 615–638.
https://doi.org/10.1177/0148558x17742821
Thomsen, S., & Pedersen, T. (2000). Ownership structure and economic performance in the
largest European companies. Strategic Management Journal, 21(6), 689–705.
https://doi.org/10.1002/(SICI)1097-0266(200006)21:6<689::AID-SMJ115>3.0.CO;2-Y
Thorne, D. (2013). The double irish and dutch sandwich tax strategies : could a general anti-
avoidance rule counteract the problems caused by utilisation of these structures ? LLM
Master Research Thesis. Victoria University of Wellington
Tran, T. T. M. (2017). Institutional environment, corporate governance and corporate social
responsibility disclosure : a comparative study of southeast asian countries (Issue July).
95
Foreign Trade University, Vietnam and University of Huddersfield, UK.
Unite, A. A., & Sullivan, M. J. (2003). The effect of foreign entry and ownership structure on the
Philippine domestic banking market. Journal of Banking and Finance, 27(12), 2323–2345.
https://doi.org/10.1016/S0378-4266(02)00330-8
Utama, C. A., Utama, S., & Amarullah, F. (2017). Corporate governance and ownership
structure: Indonesia evidence. Corporate Governance (Bingley), 17(2), 165–191.
https://doi.org/10.1108/CG-12-2015-0171
Wahab, E. A. A., & Rahman, R. A. (2009). Institutional investors and director remuneration: Do
political connections matter? In Advances in Financial Economics (Vol. 13, Issue 2009).
Elsevier. https://doi.org/10.1108/S1569-3732(2009)0000013008
Waldman, M. D. (1983). A Note On Algebraic Equivalence Of White’s Test And A Variation Of
The Godfrey/Breusch-Pagan Test For Heteroscedasticity. Economic Letters, 13, 197–200.
Wallace, T. D., & Hussain, A. (1969). The Use of Error Components Models in Combining
Cross Section with Time Series Data. Econometrica, 37(1), 55.
https://doi.org/10.2307/1909205
White, H. (1980). A Heteroskedasticity-Consistent Covariance Matrix Estimator and a Direct
Test for Heteroskedasticity. Econometrica, 48(4), 817–838.
Wilson J, R. (2009). An Examination of Corporate Tax Shelter Participants. The Accounting
Review, 84(3), 969–999. https://doi.org/10.2308/accr.2009.84.3.969
Winzenried, S., Kamarudin, Y., Pratikto, A., Watson, T., Setyorini, N., Lesmana, D., Jau, V.,
Krisnamukti, N., Baskoro, G., Sutanto, H., Budiman, F., Hanif, L., Pranajaya, J., & 168.
(2018). Mining in Indonesia Investment and Taxation Guide. PwC Indonesia, 10, 1–172.
Wooldridge, J. M. (2010). Econometric analysis of cross section and panel data. In MIT press
(Vol. 10, Issue 4). https://doi.org/10.1007/s12053-016-9491-2
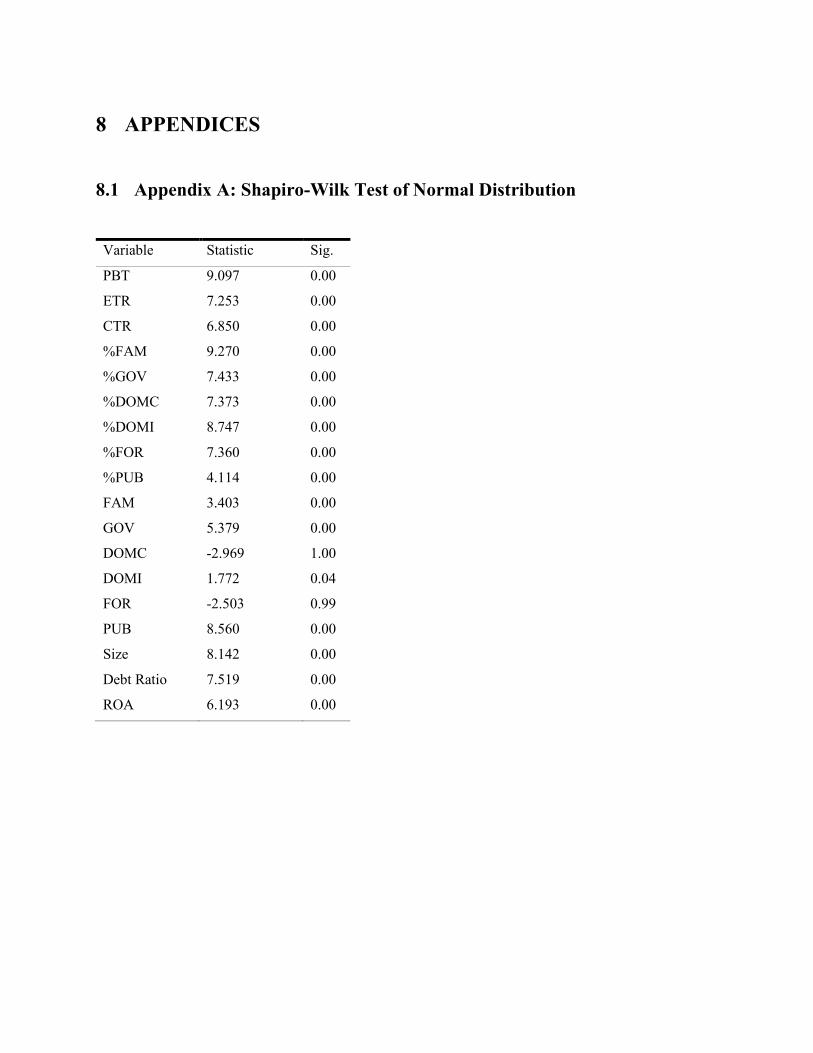
8 APPENDICES
8.1 Appendix A: Shapiro-Wilk Test of Normal Distribution
Variable Statistic Sig.
PBT 9.097 0.00
ETR 7.253 0.00
CTR 6.850 0.00
%FAM 9.270 0.00
%GOV 7.433 0.00
%DOMC 7.373 0.00
%DOMI 8.747 0.00
%FOR 7.360 0.00
%PUB 4.114 0.00
FAM 3.403 0.00
GOV 5.379 0.00
DOMC -2.969 1.00
DOMI 1.772 0.04
FOR -2.503 0.99
PUB 8.560 0.00
Size 8.142 0.00
Debt Ratio 7.519 0.00
ROA 6.193 0.00
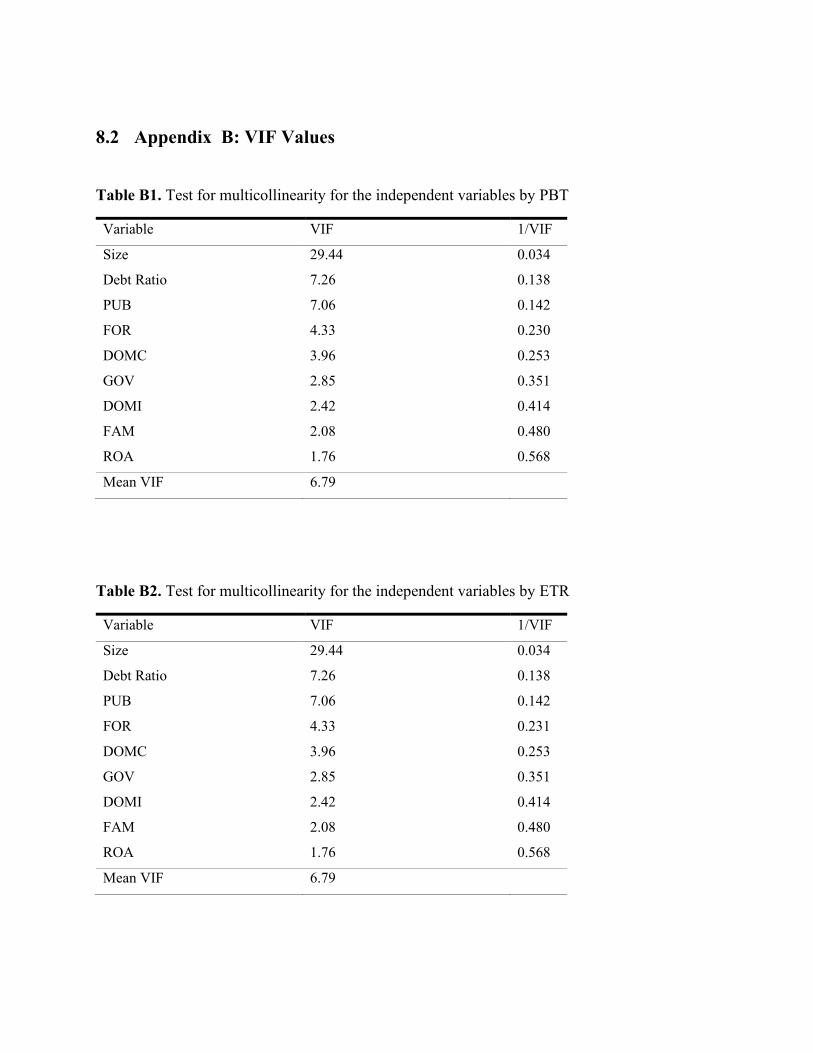
8.2 Appendix B: VIF Values
Table B1. Test for multicollinearity for the independent variables by PBT
Variable VIF 1/VIF
Size 29.44 0.034
Debt Ratio 7.26 0.138
PUB 7.06 0.142
FOR 4.33 0.230
DOMC 3.96 0.253
GOV 2.85 0.351
DOMI 2.42 0.414
FAM 2.08 0.480
ROA 1.76 0.568
Mean VIF 6.79
Table B2. Test for multicollinearity for the independent variables by ETR
Variable VIF 1/VIF
Size 29.44 0.034
Debt Ratio 7.26 0.138
PUB 7.06 0.142
FOR 4.33 0.231
DOMC 3.96 0.253
GOV 2.85 0.351
DOMI 2.42 0.414
FAM 2.08 0.480
ROA 1.76 0.568
Mean VIF 6.79
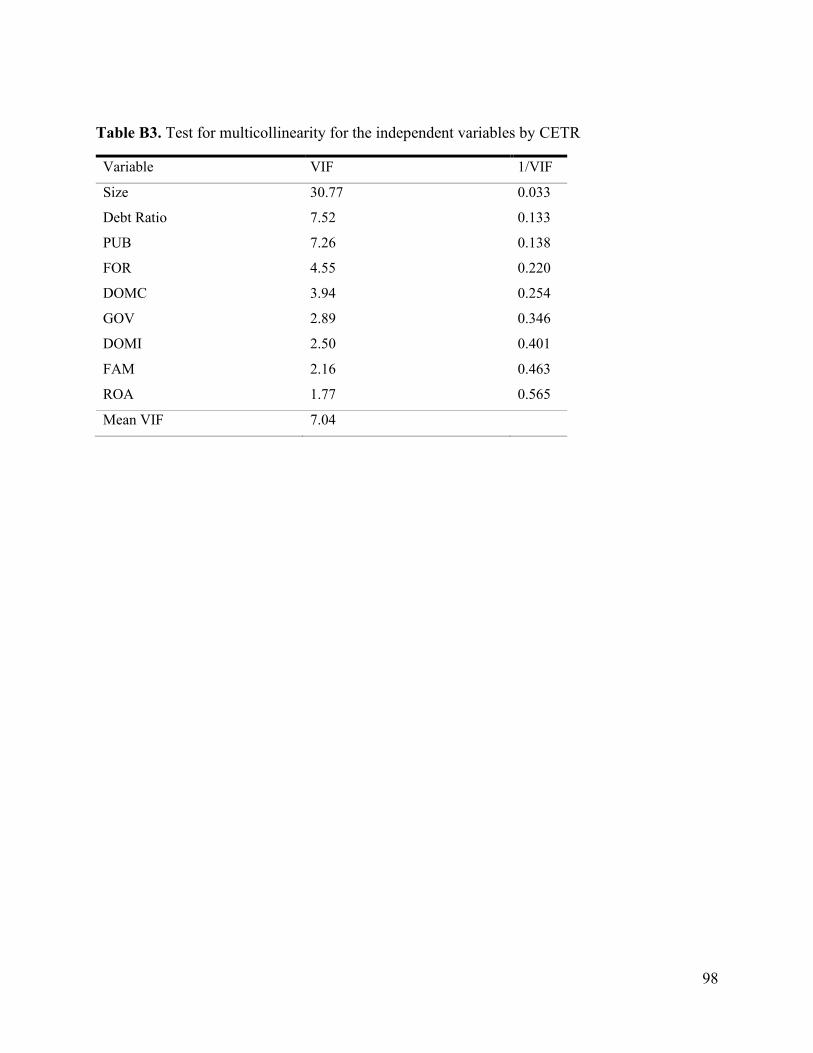
98
Table B3. Test for multicollinearity for the independent variables by CETR
Variable VIF 1/VIF
Size 30.77 0.033
Debt Ratio 7.52 0.133
PUB 7.26 0.138
FOR 4.55 0.220
DOMC 3.94 0.254
GOV 2.89 0.346
DOMI 2.50 0.401
FAM 2.16 0.463
ROA 1.77 0.565
Mean VIF 7.04
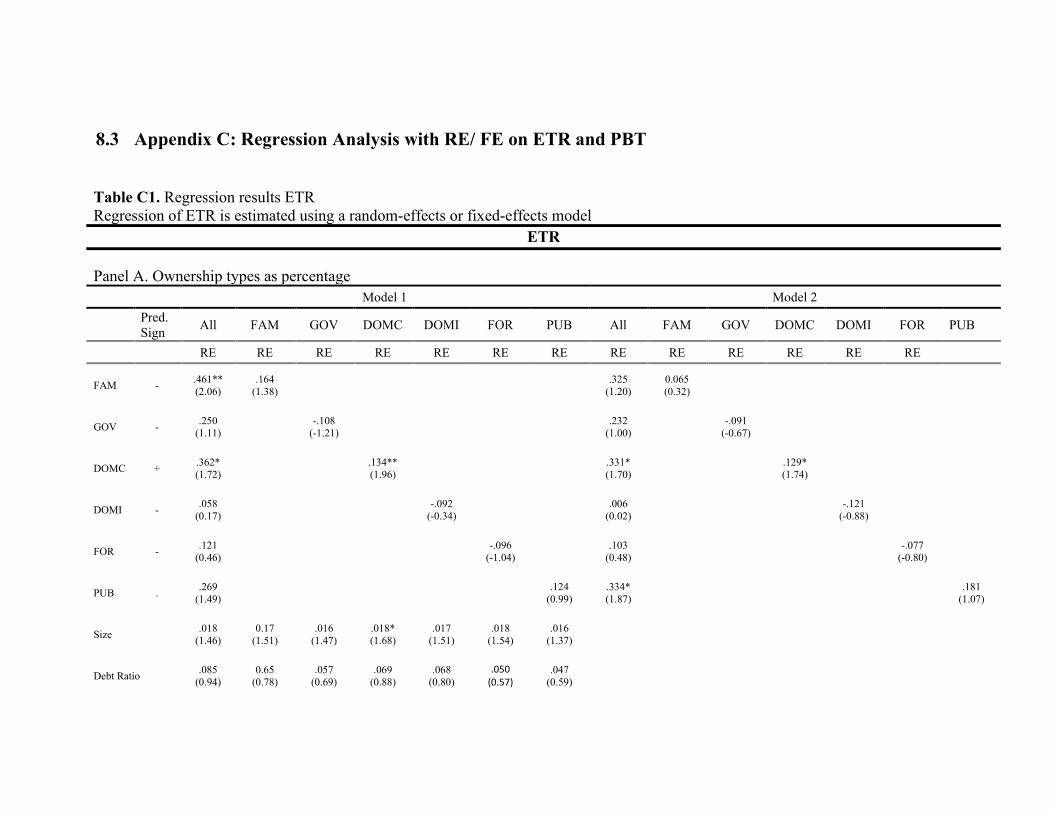
8.3 Appendix C: Regression Analysis with RE/ FE on ETR and PBT
Table C1. Regression results ETR
Regression of ETR is estimated using a random-effects or fixed-effects model
ETR
Panel A. Ownership types as percentage
Model 1 Model 2
Pred.
Sign All FAM GOV DOMC DOMI FOR PUB All FAM GOV DOMC DOMI FOR PUB
RE RE RE RE RE RE RE RE RE RE RE RE RE
FAM - .461**
(2.06)
.164
(1.38) .325
(1.20)
0.065
(0.32)
GOV - .250
(1.11) -.108
(-1.21) .232
(1.00) -.091
(-0.67)
DOMC + .362*
(1.72) .134**
(1.96) .331*
(1.70) .129*
(1.74)
DOMI - .058
(0.17) -.092
(-0.34) .006
(0.02) -.121
(-0.88)
FOR - .121
(0.46) -.096
(-1.04) .103
(0.48) -.077
(-0.80)
PUB . .269
(1.49) .124
(0.99)
.334*
(1.87) .181
(1.07)
Size .018
(1.46)
0.17
(1.51)
.016
(1.47)
.018*
(1.68)
.017
(1.51)
.018
(1.54)
.016
(1.37)
Debt Ratio .085
(0.94)
0.65
(0.78)
.057
(0.69)
.069
(0.88)
.068
(0.80)
.050 (0.57)
.047
(0.59)
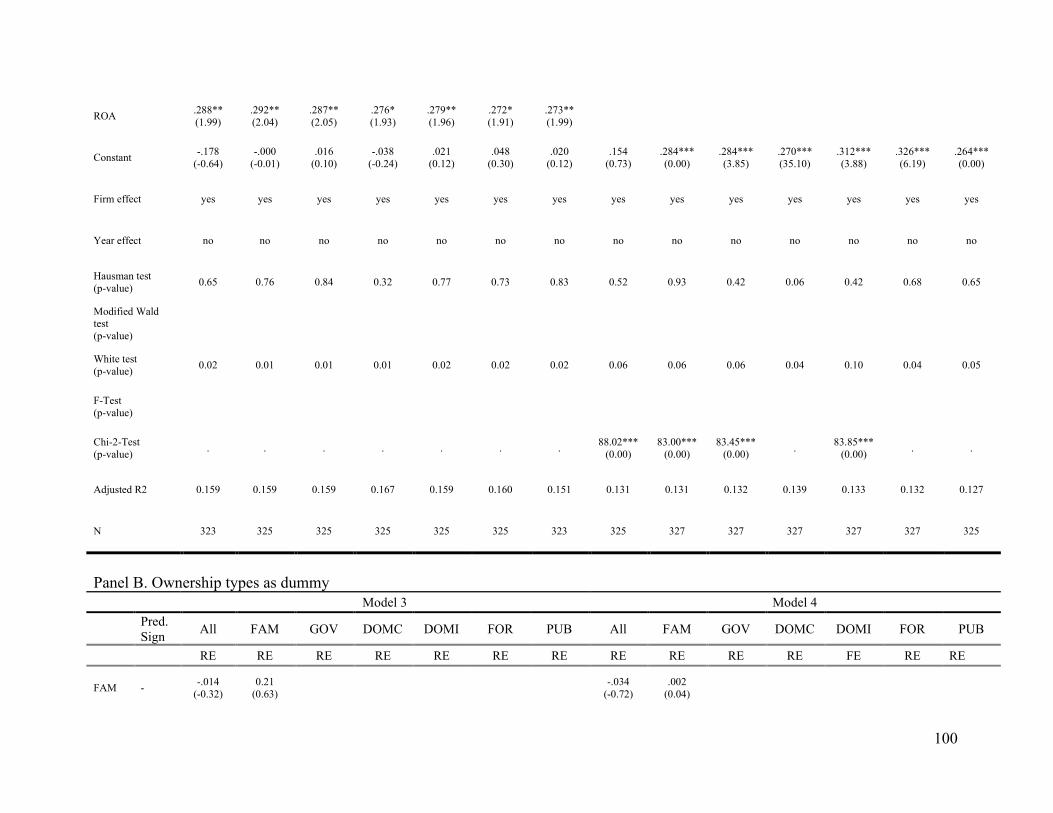
100
ROA .288**
(1.99)
.292**
(2.04)
.287**
(2.05)
.276*
(1.93)
.279**
(1.96)
.272*
(1.91)
.273**
(1.99)
Constant -.178
(-0.64)
-.000
(-0.01)
.016
(0.10)
-.038
(-0.24)
.021
(0.12)
.048
(0.30)
.020
(0.12)
.154
(0.73)
.284***
(0.00)
.284***
(3.85)
.270***
(35.10)
.312***
(3.88)
.326***
(6.19)
.264***
(0.00)
Firm effect yes yes yes yes yes yes yes yes yes yes yes yes yes yes
Year effect no no no no no no no no no no no no no no
Hausman test
(p-value) 0.65 0.76 0.84 0.32 0.77 0.73 0.83 0.52 0.93 0.42 0.06 0.42 0.68 0.65
Modified Wald test
(p-value)
White test
(p-value) 0.02 0.01 0.01 0.01 0.02 0.02 0.02 0.06 0.06 0.06 0.04 0.10 0.04 0.05
F-Test
(p-value)
Chi-2-Test
(p-value) . . . . . . .
88.02***
(0.00)
83.00***
(0.00)
83.45***
(0.00) .
83.85***
(0.00) . .
Adjusted R2 0.159 0.159 0.159 0.167 0.159 0.160 0.151 0.131 0.131 0.132 0.139 0.133 0.132 0.127
N 323 325 325 325 325 325 323 325 327 327 327 327 327 325
Panel B. Ownership types as dummy
Model 3 Model 4
Pred.
Sign All FAM GOV DOMC DOMI FOR PUB All FAM GOV DOMC DOMI FOR PUB
RE RE RE RE RE RE RE RE RE RE RE FE RE RE
FAM - -.014
(-0.32)
0.21
(0.63) -.034
(-0.72)
.002
(0.04)
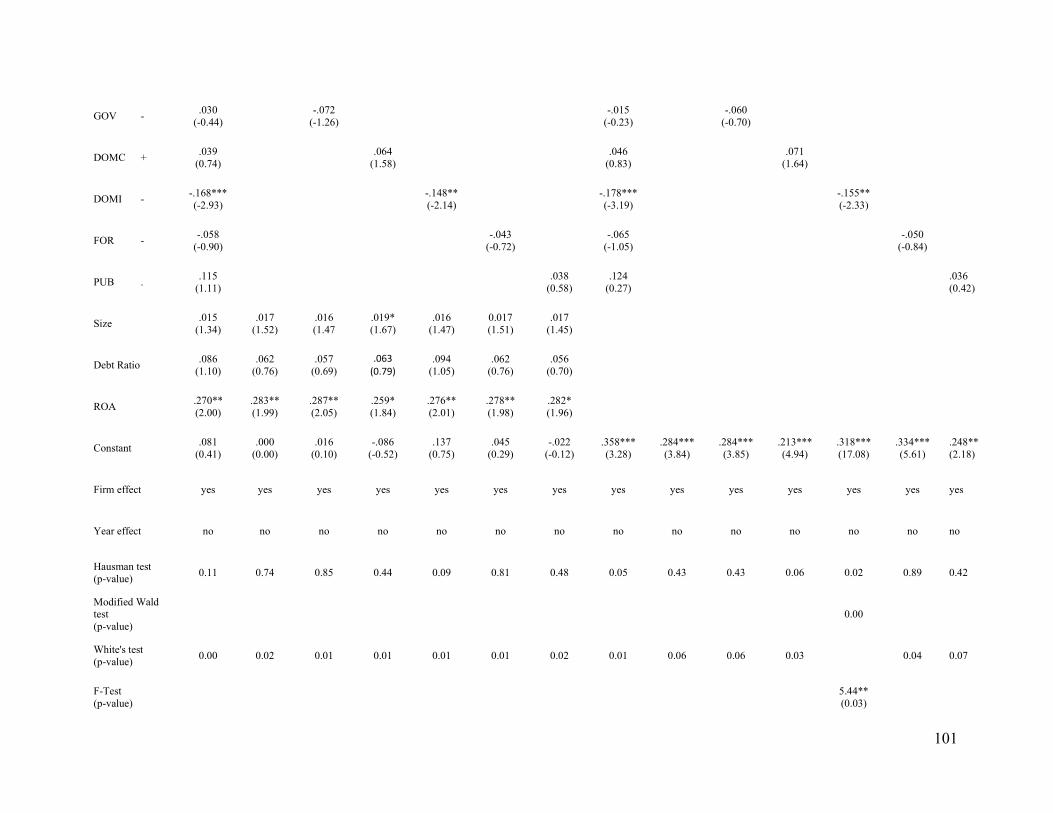
101
GOV - .030
(-0.44) -.072
(-1.26) -.015
(-0.23) -.060
(-0.70)
DOMC + .039
(0.74) .064
(1.58) .046
(0.83) .071
(1.64)
DOMI - -.168***
(-2.93) -.148**
(-2.14) -.178***
(-3.19) -.155**
(-2.33)
FOR - -.058
(-0.90) -.043
(-0.72) -.065
(-1.05) -.050
(-0.84)
PUB . .115
(1.11) .038
(0.58)
.124
(0.27) .036
(0.42)
Size .015
(1.34)
.017
(1.52)
.016
(1.47
.019*
(1.67)
.016
(1.47)
0.017
(1.51)
.017
(1.45)
Debt Ratio .086
(1.10)
.062
(0.76)
.057
(0.69)
.063 (0.79)
.094
(1.05)
.062
(0.76)
.056
(0.70)
ROA .270**
(2.00)
.283**
(1.99)
.287**
(2.05)
.259*
(1.84)
.276**
(2.01)
.278**
(1.98)
.282*
(1.96)
Constant .081
(0.41)
.000
(0.00)
.016
(0.10)
-.086
(-0.52)
.137
(0.75)
.045
(0.29)
-.022
(-0.12)
.358***
(3.28)
.284***
(3.84)
.284***
(3.85)
.213***
(4.94)
.318***
(17.08)
.334***
(5.61)
.248**
(2.18)
Firm effect yes yes yes yes yes yes yes yes yes yes yes yes yes yes
Year effect no no no no no no no no no no no no no no
Hausman test
(p-value) 0.11 0.74 0.85 0.44 0.09 0.81 0.48 0.05 0.43 0.43 0.06 0.02 0.89 0.42
Modified Wald test
(p-value)
0.00
White's test
(p-value) 0.00 0.02 0.01 0.01 0.01 0.01 0.02 0.01 0.06 0.06 0.03 0.04 0.07
F-Test
(p-value) 5.44**
(0.03)
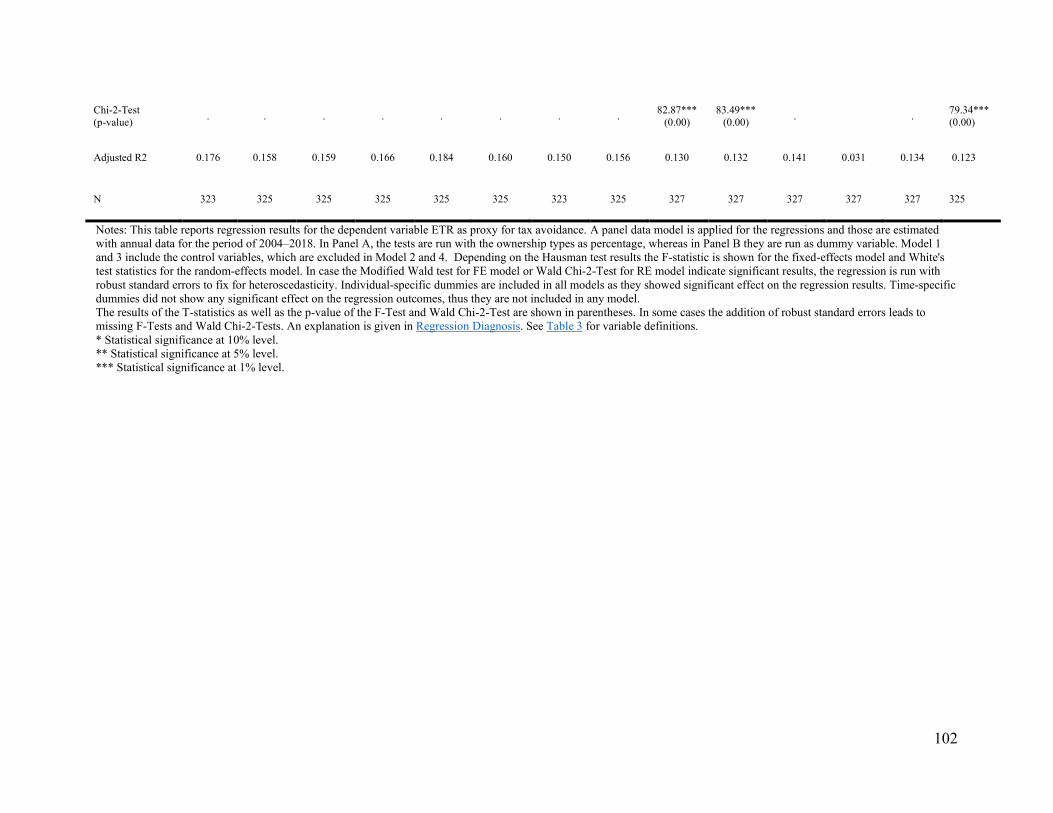
102
Chi-2-Test
(p-value) . . . . . . . .
82.87***
(0.00)
83.49***
(0.00) . .
79.34***
(0.00)
Adjusted R2 0.176 0.158 0.159 0.166 0.184 0.160 0.150 0.156 0.130 0.132 0.141 0.031 0.134 0.123
N 323 325 325 325 325 325 323 325 327 327 327 327 327 325
Notes: This table reports regression results for the dependent variable ETR as proxy for tax avoidance. A panel data model is applied for the regressions and those are estimated
with annual data for the period of 2004–2018. In Panel A, the tests are run with the ownership types as percentage, whereas in Panel B they are run as dummy variable. Model 1
and 3 include the control variables, which are excluded in Model 2 and 4. Depending on the Hausman test results the F-statistic is shown for the fixed-effects model and White's
test statistics for the random-effects model. In case the Modified Wald test for FE model or Wald Chi-2-Test for RE model indicate significant results, the regression is run with
robust standard errors to fix for heteroscedasticity. Individual-specific dummies are included in all models as they showed significant effect on the regression results. Time-specific
dummies did not show any significant effect on the regression outcomes, thus they are not included in any model.
The results of the T-statistics as well as the p-value of the F-Test and Wald Chi-2-Test are shown in parentheses. In some cases the addition of robust standard errors leads to
missing F-Tests and Wald Chi-2-Tests. An explanation is given in Regression Diagnosis. See Table 3 for variable definitions.
* Statistical significance at 10% level.
** Statistical significance at 5% level.
*** Statistical significance at 1% level.
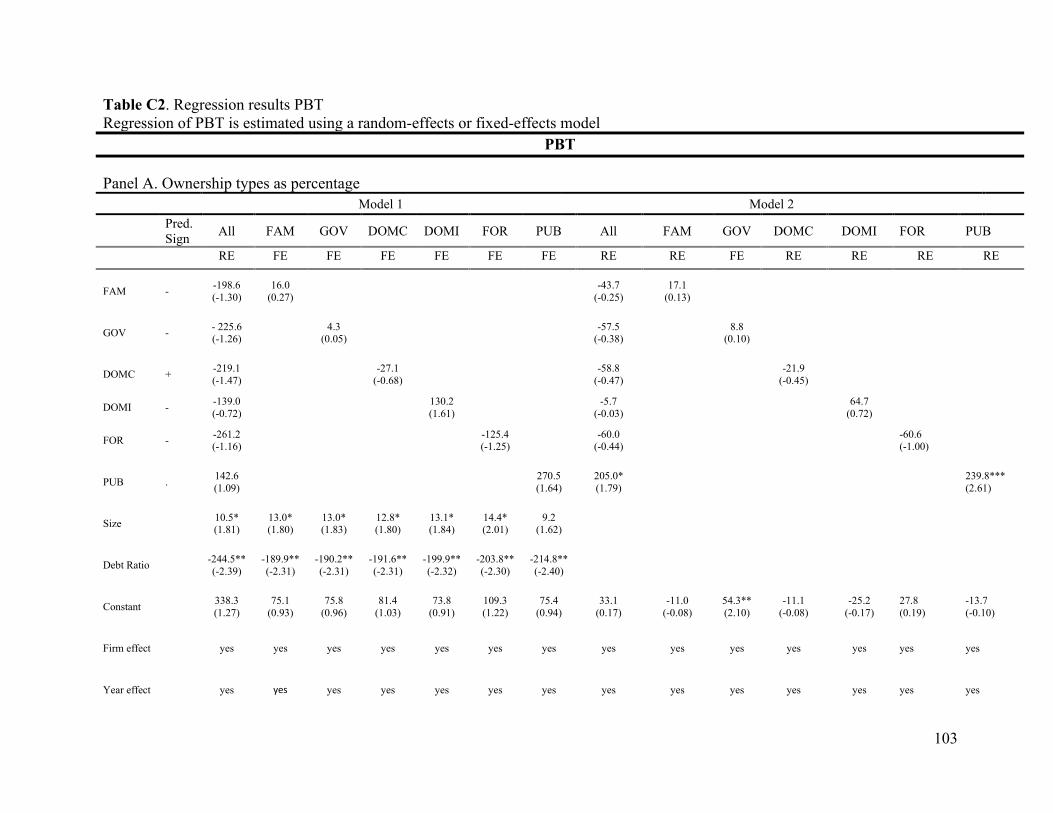
103
Table C2. Regression results PBT
Regression of PBT is estimated using a random-effects or fixed-effects model
PBT
Panel A. Ownership types as percentage
Model 1 Model 2
Pred.
Sign All FAM GOV DOMC DOMI FOR PUB All FAM GOV DOMC DOMI FOR PUB
RE FE FE FE FE FE FE RE RE FE RE RE RE RE
FAM - -198.6
(-1.30)
16.0
(0.27) -43.7
(-0.25)
17.1
(0.13)
GOV - - 225.6 (-1.26)
4.3 (0.05)
-57.5 (-0.38)
8.8 (0.10)
DOMC + -219.1
(-1.47) -27.1
(-0.68) -58.8
(-0.47) -21.9
(-0.45)
DOMI - -139.0
(-0.72) 130.2
(1.61) -5.7
(-0.03) 64.7
(0.72)
FOR - -261.2 (-1.16)
-125.4 (-1.25)
-60.0 (-0.44)
-60.6 (-1.00)
PUB . 142.6
(1.09) 270.5
(1.64)
205.0*
(1.79)
239.8***
(2.61)
Size 10.5* (1.81)
13.0* (1.80)
13.0* (1.83)
12.8* (1.80)
13.1* (1.84)
14.4* (2.01)
9.2 (1.62)
Debt Ratio -244.5**
(-2.39)
-189.9**
(-2.31)
-190.2**
(-2.31)
-191.6**
(-2.31)
-199.9**
(-2.32)
-203.8**
(-2.30)
-214.8**
(-2.40)
Constant 338.3
(1.27)
75.1
(0.93)
75.8
(0.96)
81.4
(1.03)
73.8
(0.91)
109.3
(1.22)
75.4
(0.94)
33.1
(0.17)
-11.0
(-0.08)
54.3**
(2.10)
-11.1
(-0.08)
-25.2
(-0.17)
27.8
(0.19)
-13.7
(-0.10)
Firm effect yes yes yes yes yes yes yes yes yes yes yes yes yes yes
Year effect yes yes yes yes yes yes yes yes yes yes yes yes yes yes
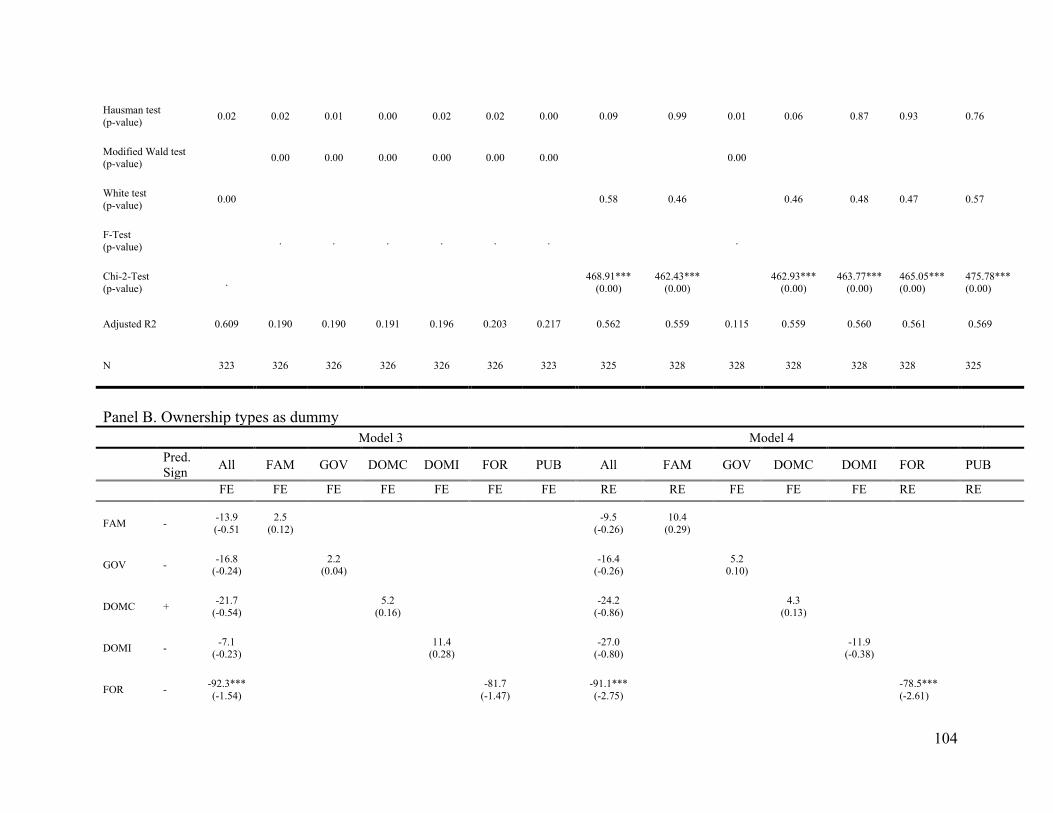
104
Hausman test
(p-value) 0.02 0.02 0.01 0.00 0.02 0.02 0.00 0.09 0.99 0.01 0.06 0.87 0.93 0.76
Modified Wald test (p-value)
0.00 0.00 0.00 0.00 0.00 0.00 0.00
White test
(p-value) 0.00 0.58 0.46 0.46 0.48 0.47 0.57
F-Test
(p-value) . . . . . . .
Chi-2-Test
(p-value) . 468.91***
(0.00)
462.43***
(0.00) 462.93***
(0.00)
463.77***
(0.00)
465.05***
(0.00)
475.78***
(0.00)
Adjusted R2 0.609 0.190 0.190 0.191 0.196 0.203 0.217 0.562 0.559 0.115 0.559 0.560 0.561 0.569
N 323 326 326 326 326 326 323 325 328 328 328 328 328 325
Panel B. Ownership types as dummy
Model 3 Model 4
Pred.
Sign All FAM GOV DOMC DOMI FOR PUB All FAM GOV DOMC DOMI FOR PUB
FE FE FE FE FE FE FE RE RE FE FE FE RE RE
FAM - -13.9
(-0.51
2.5
(0.12) -9.5
(-0.26)
10.4
(0.29)
GOV - -16.8
(-0.24) 2.2
(0.04) -16.4
(-0.26) 5.2
0.10)
DOMC + -21.7
(-0.54)
5.2
(0.16) -24.2
(-0.86) 4.3
(0.13)
DOMI - -7.1
(-0.23) 11.4
(0.28) -27.0
(-0.80) -11.9
(-0.38)
FOR - -92.3***
(-1.54) -81.7
(-1.47) -91.1***
(-2.75) -78.5***
(-2.61)
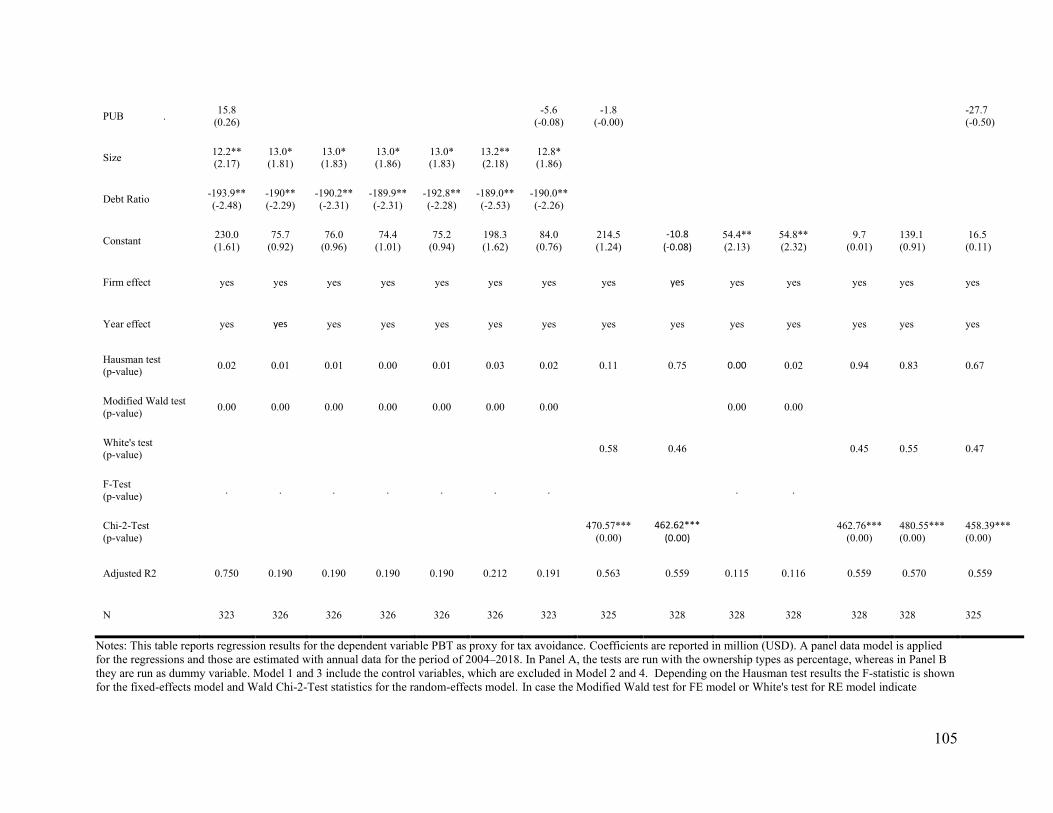
105
PUB . 15.8
(0.26) -5.6
(-0.08)
-1.8
(-0.00)
-27.7
(-0.50)
Size 12.2** (2.17)
13.0* (1.81)
13.0* (1.83)
13.0* (1.86)
13.0* (1.83)
13.2** (2.18)
12.8* (1.86)
Debt Ratio -193.9**
(-2.48)
-190**
(-2.29)
-190.2**
(-2.31)
-189.9**
(-2.31)
-192.8**
(-2.28)
-189.0**
(-2.53)
-190.0**
(-2.26)
Constant 230.0
(1.61)
75.7
(0.92)
76.0
(0.96)
74.4
(1.01)
75.2
(0.94)
198.3
(1.62)
84.0
(0.76)
214.5
(1.24)
-10.8 (-0.08)
54.4**
(2.13)
54.8**
(2.32)
9.7
(0.01)
139.1
(0.91)
16.5
(0.11)
Firm effect yes yes yes yes yes yes yes yes yes yes yes yes yes yes
Year effect yes yes yes yes yes yes yes yes yes yes yes yes yes yes
Hausman test (p-value)
0.02 0.01 0.01 0.00 0.01 0.03 0.02 0.11 0.75 0.00 0.02 0.94 0.83 0.67
Modified Wald test
(p-value) 0.00 0.00 0.00 0.00 0.00 0.00 0.00 0.00 0.00
White's test (p-value)
0.58 0.46 0.45 0.55 0.47
F-Test
(p-value) . . . . . . . . .
Chi-2-Test
(p-value) 470.57***
(0.00)
462.62*** (0.00)
462.76***
(0.00)
480.55***
(0.00)
458.39***
(0.00)
Adjusted R2 0.750 0.190 0.190 0.190 0.190 0.212 0.191 0.563 0.559 0.115 0.116 0.559 0.570 0.559
N 323 326 326 326 326 326 323 325 328 328 328 328 328 325
Notes: This table reports regression results for the dependent variable PBT as proxy for tax avoidance. Coefficients are reported in million (USD). A panel data model is applied
for the regressions and those are estimated with annual data for the period of 2004–2018. In Panel A, the tests are run with the ownership types as percentage, whereas in Panel B
they are run as dummy variable. Model 1 and 3 include the control variables, which are excluded in Model 2 and 4. Depending on the Hausman test results the F-statistic is shown
for the fixed-effects model and Wald Chi-2-Test statistics for the random-effects model. In case the Modified Wald test for FE model or White's test for RE model indicate
106
significant results, the regression is run with robust standard errors to fix for heteroscedasticity. Individual-specific dummies and time-specific dummies are included in all models
as they showed a significant effect on the regression outcomes in all of them.
The results of the T-statistics as well as the p-value of the F-Test and Wald Chi-2-Test are shown in parentheses. In this analysis, the addition of robust standard errors leads to
missing F-Tests and in some cases to missing Wald Chi-2-Tests. An explanation is given in Regression Diagnosis. See Table 3 for variable definitions.
* Statistical significance at 10% level.
** Statistical significance at 5% level.
*** Statistical significance at 1% level.
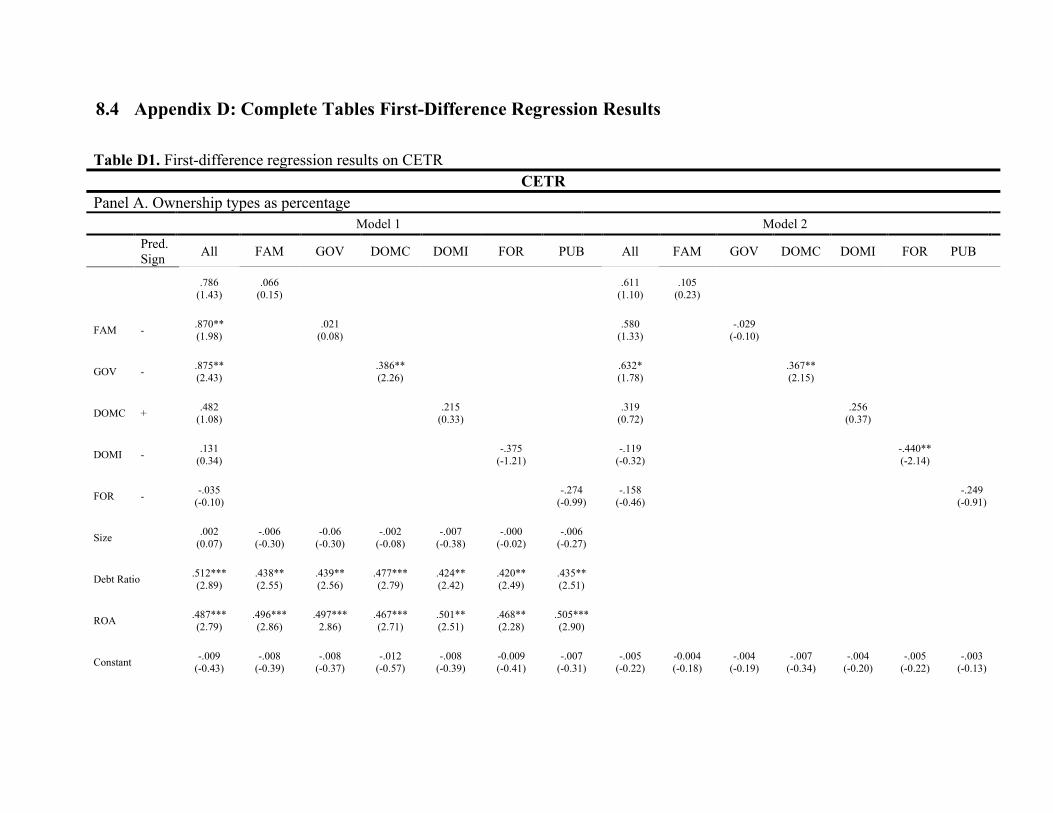
8.4 Appendix D: Complete Tables First-Difference Regression Results
Table D1. First-difference regression results on CETR
CETR
Panel A. Ownership types as percentage
Model 1 Model 2
Pred.
Sign All FAM GOV DOMC DOMI FOR PUB All FAM GOV DOMC DOMI FOR PUB
.786
(1.43)
.066
(0.15)
.611
(1.10)
.105
(0.23)
FAM - .870**
(1.98)
.021
(0.08)
.580
(1.33)
-.029
(-0.10)
GOV - .875**
(2.43)
.386**
(2.26)
.632*
(1.78)
.367**
(2.15)
DOMC + .482
(1.08)
.215
(0.33)
.319
(0.72)
.256
(0.37)
DOMI - .131
(0.34)
-.375
(-1.21)
-.119
(-0.32)
-.440**
(-2.14)
FOR - -.035
(-0.10)
-.274
(-0.99)
-.158
(-0.46)
-.249
(-0.91)
Size .002
(0.07)
-.006
(-0.30)
-0.06
(-0.30)
-.002
(-0.08)
-.007
(-0.38)
-.000
(-0.02)
-.006
(-0.27)
Debt Ratio .512***
(2.89)
.438**
(2.55)
.439**
(2.56)
.477***
(2.79)
.424**
(2.42)
.420**
(2.49)
.435**
(2.51)
ROA .487***
(2.79)
.496***
(2.86)
.497***
2.86)
.467***
(2.71)
.501**
(2.51)
.468**
(2.28)
.505***
(2.90)
Constant -.009
(-0.43)
-.008
(-0.39)
-.008
(-0.37)
-.012
(-0.57)
-.008
(-0.39)
-0.009
(-0.41)
-.007
(-0.31)
-.005
(-0.22)
-0.004
(-0.18)
-.004
(-0.19)
-.007
(-0.34)
-.004
(-0.20)
-.005
(-0.22)
-.003
(-0.13)
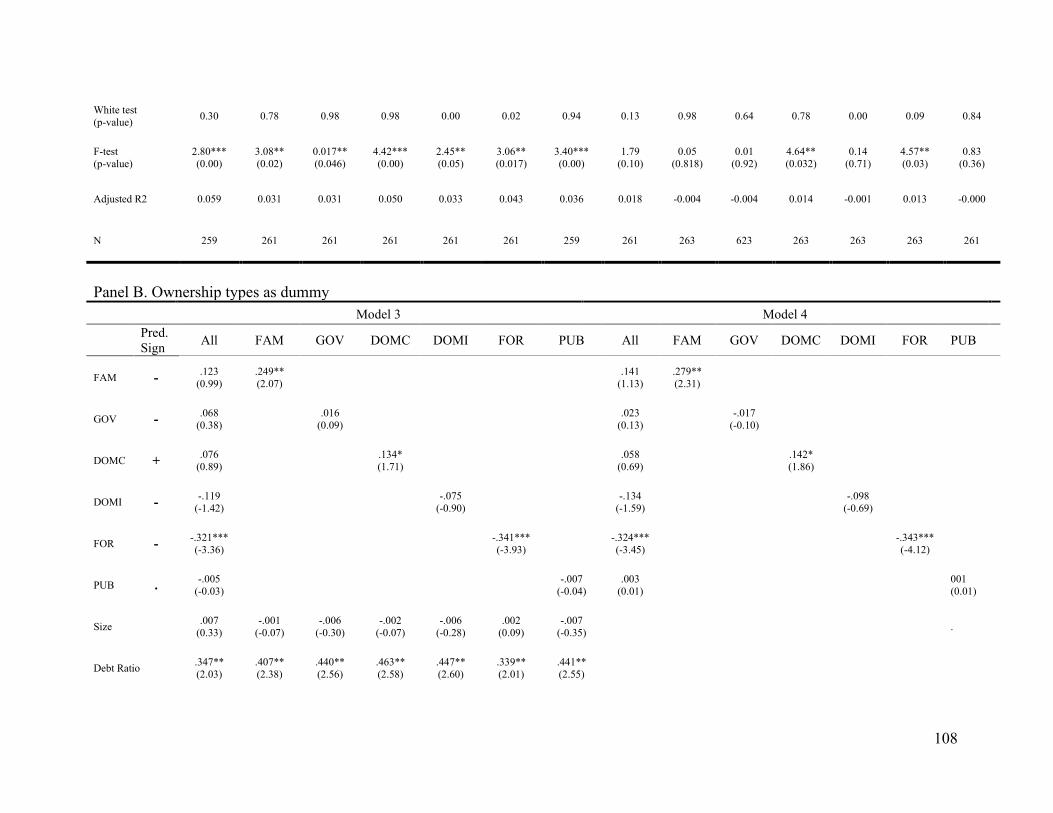
108
White test
(p-value) 0.30 0.78 0.98 0.98 0.00 0.02 0.94 0.13 0.98 0.64 0.78 0.00 0.09 0.84
F-test
(p-value)
2.80***
(0.00) 3.08**
(0.02)
0.017**
(0.046)
4.42***
(0.00)
2.45**
(0.05)
3.06**
(0.017)
3.40***
(0.00)
1.79
(0.10)
0.05
(0.818)
0.01
(0.92)
4.64**
(0.032)
0.14
(0.71)
4.57**
(0.03)
0.83
(0.36)
Adjusted R2 0.059 0.031 0.031 0.050 0.033 0.043 0.036 0.018 -0.004 -0.004 0.014 -0.001 0.013 -0.000
N 259 261 261 261 261 261 259 261 263 623 263 263 263 261
Panel B. Ownership types as dummy
Model 3 Model 4
Pred.
Sign All FAM GOV DOMC DOMI FOR PUB All FAM GOV DOMC DOMI FOR PUB
FAM - .123
(0.99)
.249**
(2.07)
.141
(1.13)
.279**
(2.31)
GOV - .068
(0.38)
.016
(0.09)
.023
(0.13)
-.017
(-0.10)
DOMC + .076
(0.89)
.134*
(1.71)
.058
(0.69)
.142*
(1.86)
DOMI - -.119
(-1.42)
-.075
(-0.90)
-.134
(-1.59)
-.098
(-0.69)
FOR - -.321***
(-3.36)
-.341***
(-3.93)
-.324***
(-3.45)
-.343***
(-4.12)
PUB . -.005
(-0.03)
-.007
(-0.04)
.003
(0.01)
001
(0.01)
Size .007
(0.33)
-.001
(-0.07)
-.006
(-0.30)
-.002
(-0.07)
-.006
(-0.28)
.002
(0.09)
-.007
(-0.35) .
Debt Ratio .347**
(2.03)
.407**
(2.38)
.440**
(2.56)
.463**
(2.58)
.447**
(2.60)
.339**
(2.01)
.441**
(2.55)
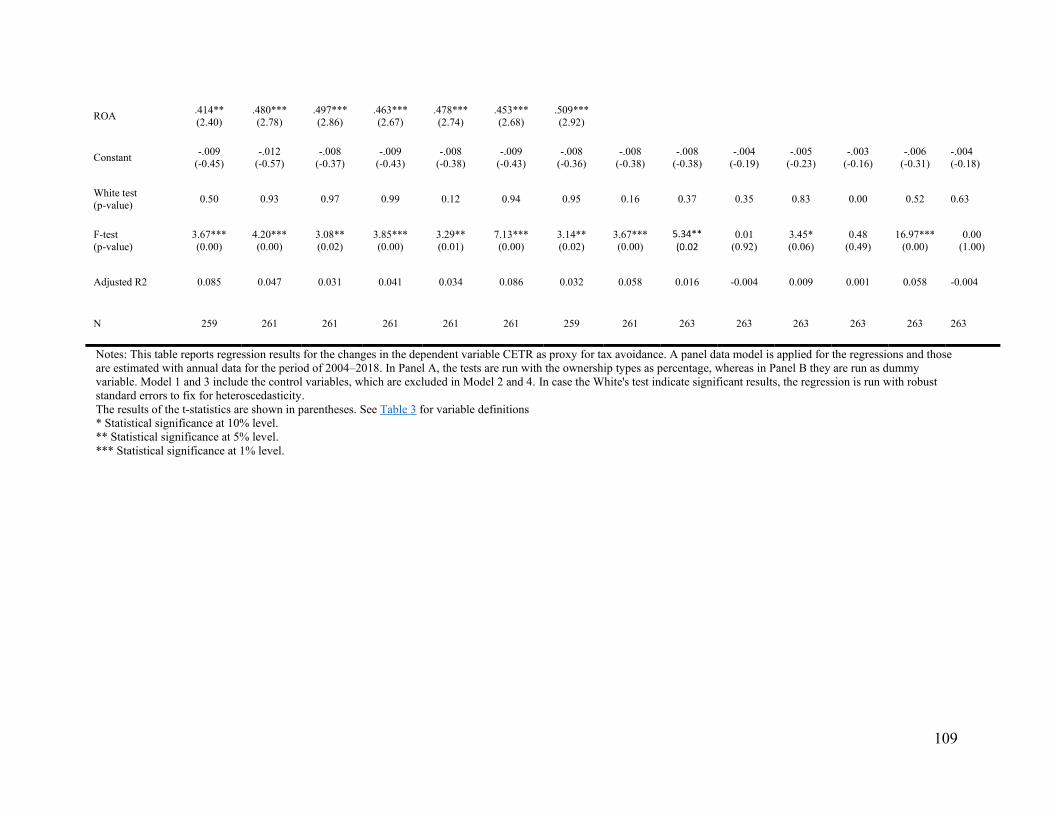
109
ROA .414**
(2.40)
.480***
(2.78)
.497***
(2.86)
.463***
(2.67)
.478***
(2.74)
.453***
(2.68)
.509***
(2.92)
Constant -.009
(-0.45)
-.012
(-0.57)
-.008
(-0.37)
-.009
(-0.43)
-.008
(-0.38)
-.009
(-0.43)
-.008
(-0.36)
-.008
(-0.38)
-.008
(-0.38)
-.004
(-0.19)
-.005
(-0.23)
-.003
(-0.16)
-.006
(-0.31)
-.004
(-0.18)
White test
(p-value) 0.50 0.93 0.97 0.99 0.12 0.94 0.95 0.16 0.37 0.35 0.83 0.00 0.52 0.63
F-test
(p-value)
3.67***
(0.00)
4.20***
(0.00)
3.08**
(0.02)
3.85***
(0.00)
3.29**
(0.01)
7.13***
(0.00)
3.14**
(0.02)
3.67***
(0.00)
5.34** (0.02
0.01
(0.92)
3.45*
(0.06)
0.48
(0.49)
16.97***
(0.00)
0.00
(1.00)
Adjusted R2 0.085 0.047 0.031 0.041 0.034 0.086 0.032 0.058 0.016 -0.004 0.009 0.001 0.058 -0.004
N 259 261 261 261 261 261 259 261 263 263 263 263 263 263
Notes: This table reports regression results for the changes in the dependent variable CETR as proxy for tax avoidance. A panel data model is applied for the regressions and those
are estimated with annual data for the period of 2004–2018. In Panel A, the tests are run with the ownership types as percentage, whereas in Panel B they are run as dummy
variable. Model 1 and 3 include the control variables, which are excluded in Model 2 and 4. In case the White's test indicate significant results, the regression is run with robust
standard errors to fix for heteroscedasticity.
The results of the t-statistics are shown in parentheses. See Table 3 for variable definitions
* Statistical significance at 10% level.
** Statistical significance at 5% level.
*** Statistical significance at 1% level.
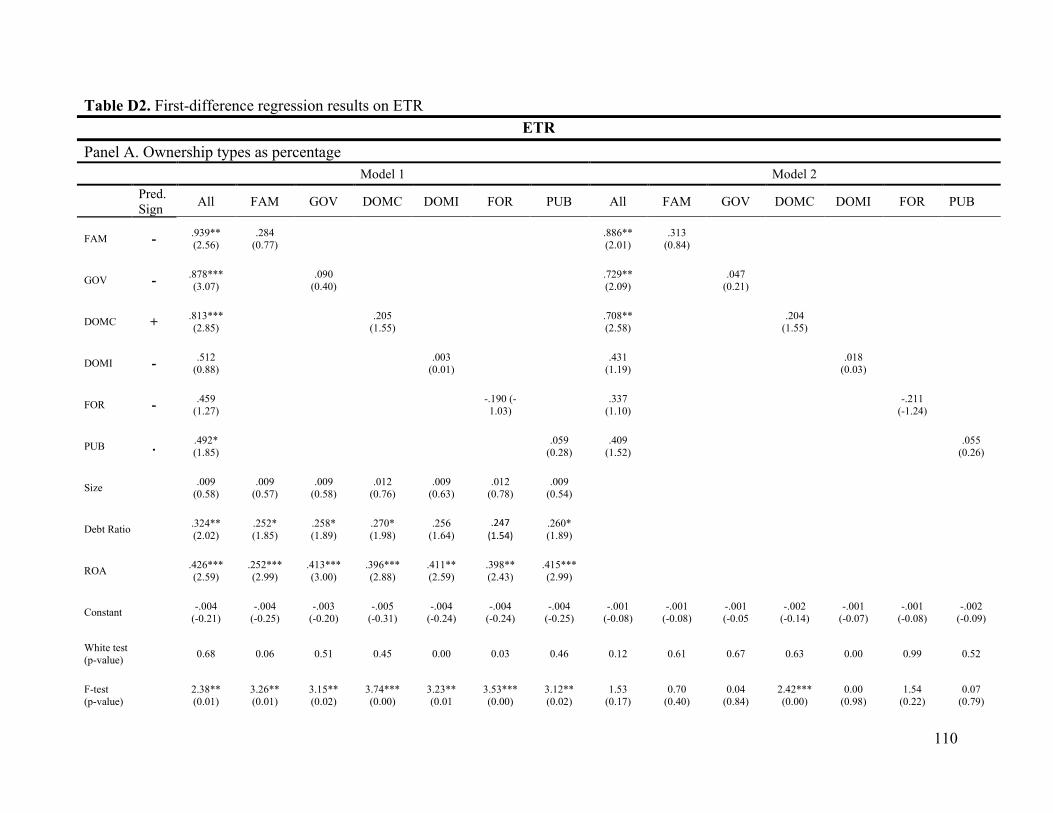
110
Table D2. First-difference regression results on ETR
ETR
Panel A. Ownership types as percentage
Model 1 Model 2
Pred.
Sign All FAM GOV DOMC DOMI FOR PUB All FAM GOV DOMC DOMI FOR PUB
FAM - .939**
(2.56)
.284
(0.77)
.886**
(2.01)
.313
(0.84)
GOV - .878***
(3.07)
.090
(0.40)
.729**
(2.09)
.047
(0.21)
DOMC + .813***
(2.85)
.205
(1.55)
.708**
(2.58)
.204
(1.55)
DOMI - .512
(0.88)
.003
(0.01)
.431
(1.19)
.018
(0.03)
FOR - .459
(1.27)
-.190 (-
1.03)
.337
(1.10)
-.211
(-1.24)
PUB . .492*
(1.85)
.059
(0.28)
.409
(1.52)
.055
(0.26)
Size .009
(0.58)
.009
(0.57)
.009
(0.58)
.012
(0.76)
.009
(0.63)
.012
(0.78)
.009
(0.54)
Debt Ratio .324**
(2.02)
.252*
(1.85)
.258*
(1.89)
.270*
(1.98)
.256
(1.64)
.247 (1.54)
.260*
(1.89)
ROA .426***
(2.59)
.252***
(2.99)
.413***
(3.00)
.396***
(2.88)
.411**
(2.59)
.398**
(2.43)
.415***
(2.99)
Constant -.004
(-0.21)
-.004
(-0.25)
-.003
(-0.20)
-.005
(-0.31)
-.004
(-0.24)
-.004
(-0.24)
-.004
(-0.25)
-.001
(-0.08)
-.001
(-0.08)
-.001
(-0.05
-.002
(-0.14)
-.001
(-0.07)
-.001
(-0.08)
-.002
(-0.09)
White test
(p-value) 0.68 0.06 0.51 0.45 0.00 0.03 0.46 0.12 0.61 0.67 0.63 0.00 0.99 0.52
F-test
(p-value)
2.38**
(0.01)
3.26**
(0.01)
3.15**
(0.02)
3.74***
(0.00)
3.23**
(0.01
3.53***
(0.00)
3.12**
(0.02)
1.53
(0.17)
0.70
(0.40)
0.04
(0.84)
2.42***
(0.00)
0.00
(0.98)
1.54
(0.22)
0.07
(0.79)
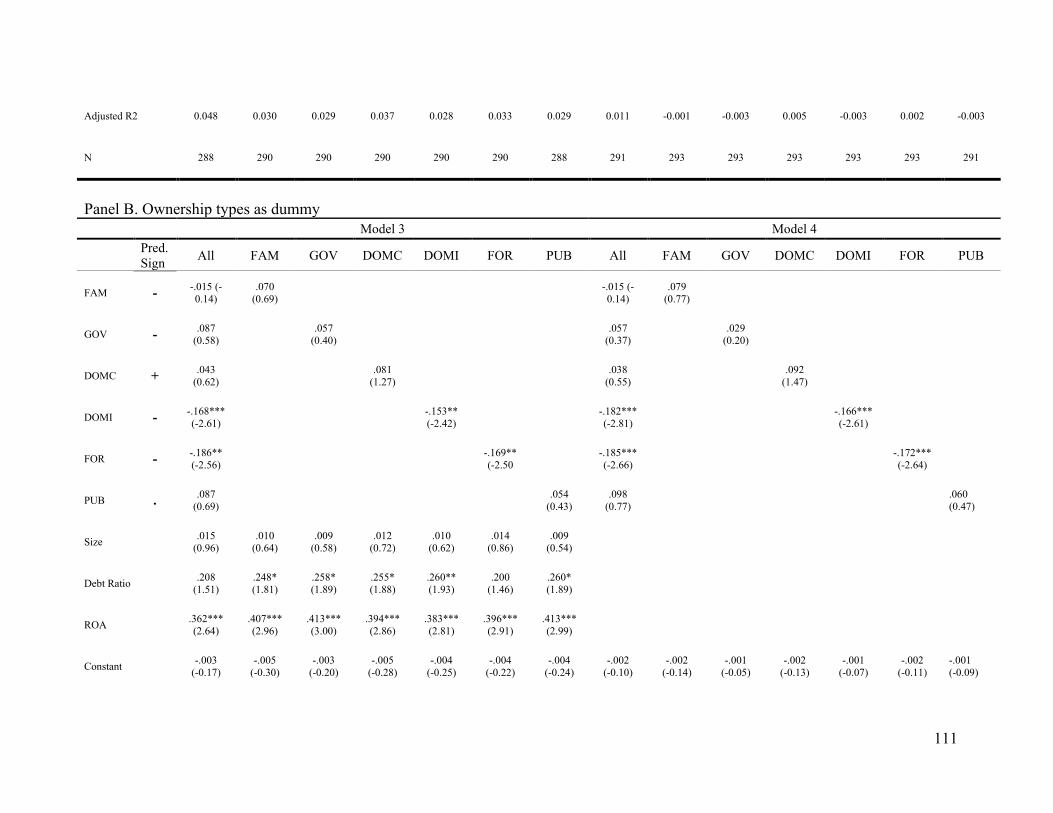
111
Adjusted R2 0.048 0.030 0.029 0.037 0.028 0.033 0.029 0.011 -0.001 -0.003 0.005 -0.003 0.002 -0.003
N 288 290 290 290 290 290 288 291 293 293 293 293 293 291
Panel B. Ownership types as dummy
Model 3 Model 4
Pred.
Sign All FAM GOV DOMC DOMI FOR PUB All FAM GOV DOMC DOMI FOR PUB
FAM - -.015 (-
0.14)
.070
(0.69)
-.015 (-
0.14)
.079
(0.77)
GOV - .087
(0.58)
.057
(0.40)
.057
(0.37)
.029
(0.20)
DOMC + .043
(0.62)
.081
(1.27)
.038
(0.55)
.092
(1.47)
DOMI - -.168***
(-2.61)
-.153**
(-2.42)
-.182***
(-2.81)
-.166***
(-2.61)
FOR - -.186**
(-2.56)
-.169**
(-2.50
-.185***
(-2.66)
-.172***
(-2.64)
PUB . .087
(0.69)
.054
(0.43)
.098
(0.77)
.060
(0.47)
Size .015
(0.96)
.010
(0.64)
.009
(0.58)
.012
(0.72)
.010
(0.62)
.014
(0.86)
.009
(0.54)
Debt Ratio .208
(1.51)
.248*
(1.81)
.258*
(1.89)
.255*
(1.88)
.260**
(1.93)
.200
(1.46)
.260*
(1.89)
ROA .362***
(2.64)
.407***
(2.96)
.413***
(3.00)
.394***
(2.86)
.383***
(2.81)
.396***
(2.91)
.413***
(2.99)
Constant -.003
(-0.17)
-.005
(-0.30)
-.003
(-0.20)
-.005
(-0.28)
-.004
(-0.25)
-.004
(-0.22)
-.004
(-0.24)
-.002
(-0.10)
-.002
(-0.14)
-.001
(-0.05)
-.002
(-0.13)
-.001
(-0.07)
-.002
(-0.11)
-.001
(-0.09)
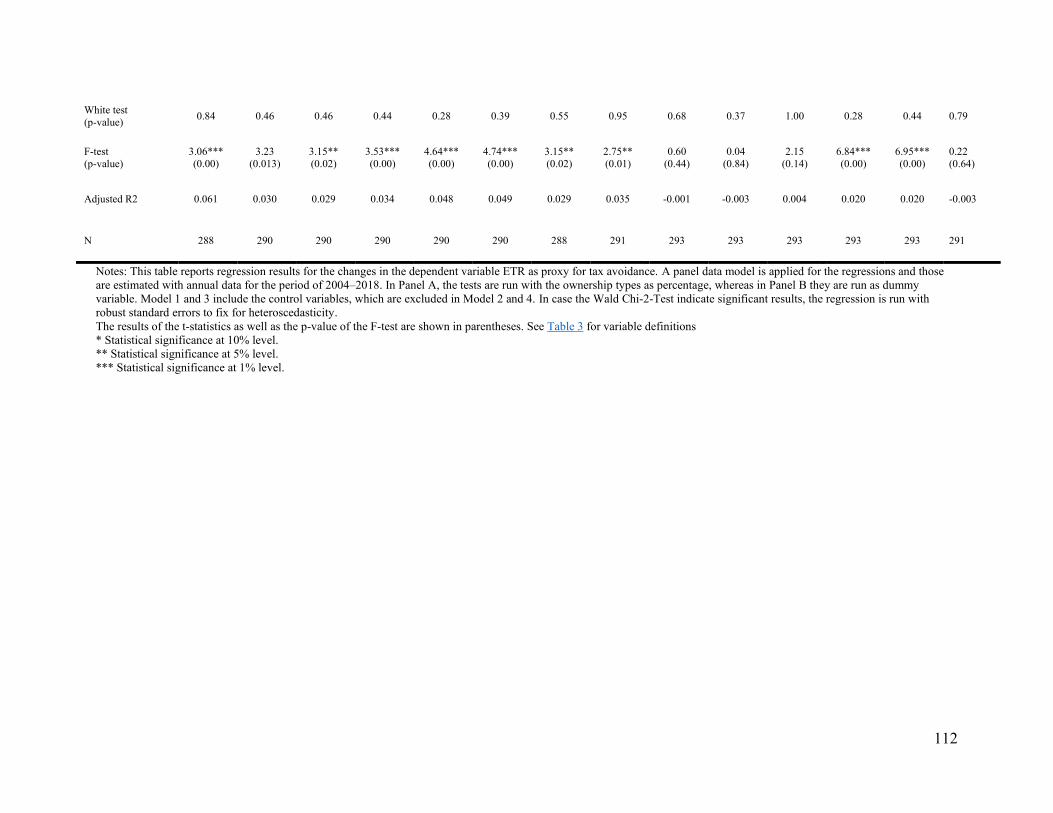
112
White test
(p-value) 0.84 0.46 0.46 0.44 0.28 0.39 0.55 0.95 0.68 0.37 1.00 0.28 0.44 0.79
F-test
(p-value)
3.06***
(0.00)
3.23
(0.013)
3.15**
(0.02)
3.53***
(0.00)
4.64***
(0.00)
4.74***
(0.00)
3.15**
(0.02)
2.75**
(0.01)
0.60
(0.44)
0.04
(0.84)
2.15
(0.14)
6.84***
(0.00)
6.95***
(0.00)
0.22
(0.64)
Adjusted R2 0.061 0.030 0.029 0.034 0.048 0.049 0.029 0.035 -0.001 -0.003 0.004 0.020 0.020 -0.003
N 288 290 290 290 290 290 288 291 293 293 293 293 293 291
Notes: This table reports regression results for the changes in the dependent variable ETR as proxy for tax avoidance. A panel data model is applied for the regressions and those
are estimated with annual data for the period of 2004–2018. In Panel A, the tests are run with the ownership types as percentage, whereas in Panel B they are run as dummy
variable. Model 1 and 3 include the control variables, which are excluded in Model 2 and 4. In case the Wald Chi-2-Test indicate significant results, the regression is run with
robust standard errors to fix for heteroscedasticity.
The results of the t-statistics as well as the p-value of the F-test are shown in parentheses. See Table 3 for variable definitions
* Statistical significance at 10% level.
** Statistical significance at 5% level.
*** Statistical significance at 1% level.
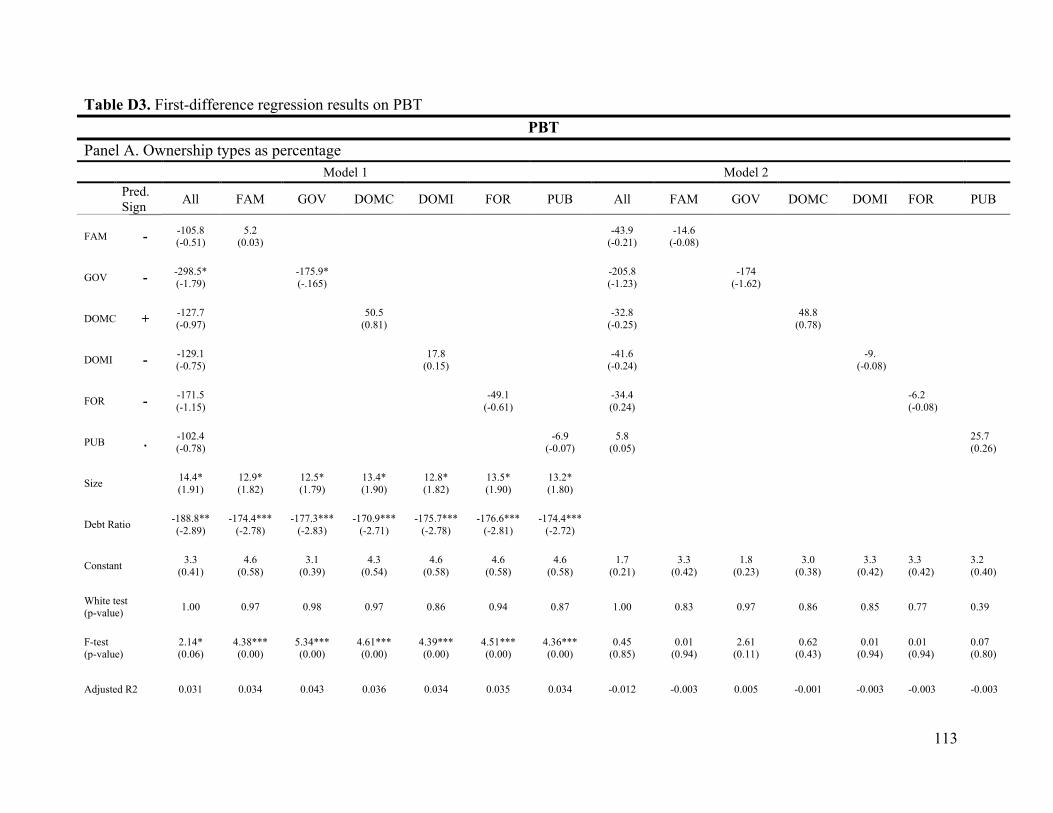
113
Table D3. First-difference regression results on PBT
PBT
Panel A. Ownership types as percentage
Model 1 Model 2
Pred.
Sign All FAM GOV DOMC DOMI FOR PUB All FAM GOV DOMC DOMI FOR PUB
FAM - -105.8 (-0.51)
5.2 (0.03)
-43.9
(-0.21) -14.6
(-0.08)
GOV - -298.5*
(-1.79)
-175.9*
(-.165)
-205.8
(-1.23)
-174
(-1.62)
DOMC + -127.7
(-0.97)
50.5
(0.81)
-32.8
(-0.25)
48.8
(0.78)
DOMI - -129.1
(-0.75)
17.8
(0.15)
-41.6
(-0.24)
-9.
(-0.08)
FOR - -171.5
(-1.15)
-49.1
(-0.61)
-34.4
(0.24)
-6.2
(-0.08)
PUB . -102.4
(-0.78)
-6.9
(-0.07)
5.8
(0.05)
25.7
(0.26)
Size 14.4*
(1.91)
12.9*
(1.82)
12.5*
(1.79)
13.4*
(1.90)
12.8*
(1.82)
13.5*
(1.90)
13.2*
(1.80)
Debt Ratio -188.8**
(-2.89)
-174.4***
(-2.78)
-177.3***
(-2.83)
-170.9***
(-2.71)
-175.7***
(-2.78)
-176.6***
(-2.81)
-174.4***
(-2.72)
Constant 3.3
(0.41)
4.6
(0.58)
3.1
(0.39)
4.3
(0.54)
4.6
(0.58)
4.6
(0.58)
4.6
(0.58)
1.7
(0.21)
3.3
(0.42)
1.8
(0.23)
3.0
(0.38)
3.3
(0.42)
3.3
(0.42)
3.2
(0.40)
White test (p-value)
1.00 0.97 0.98 0.97 0.86 0.94 0.87 1.00 0.83 0.97 0.86 0.85 0.77 0.39
F-test (p-value)
2.14* (0.06)
4.38*** (0.00)
5.34*** (0.00)
4.61*** (0.00)
4.39*** (0.00)
4.51*** (0.00)
4.36*** (0.00)
0.45 (0.85)
0.01 (0.94)
2.61 (0.11)
0.62 (0.43)
0.01 (0.94)
0.01 (0.94)
0.07 (0.80)
Adjusted R2 0.031 0.034 0.043 0.036 0.034 0.035 0.034 -0.012 -0.003 0.005 -0.001 -0.003 -0.003 -0.003
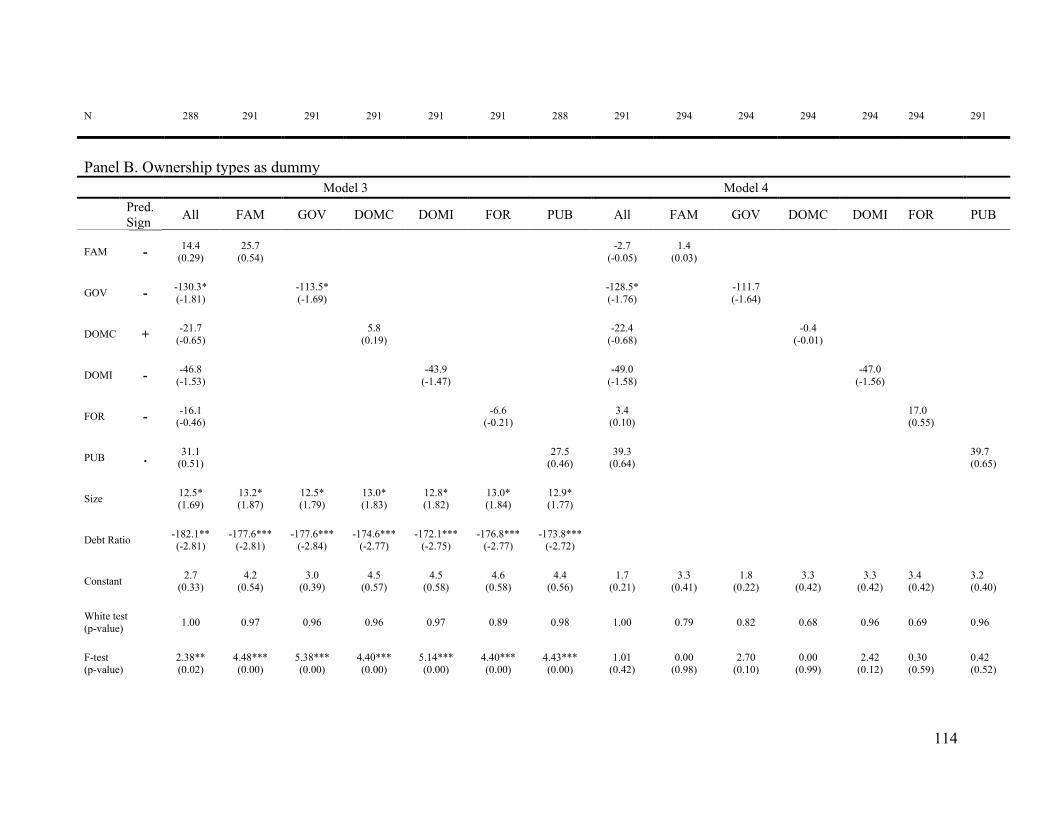
114
N 288 291 291 291 291 291 288 291 294 294 294 294 294 291
Panel B. Ownership types as dummy
Model 3 Model 4
Pred.
Sign All FAM GOV DOMC DOMI FOR PUB All FAM GOV DOMC DOMI FOR PUB
FAM - 14.4
(0.29)
25.7
(0.54)
-2.7
(-0.05)
1.4
(0.03)
GOV - -130.3*
(-1.81)
-113.5*
(-1.69)
-128.5*
(-1.76)
-111.7
(-1.64)
DOMC + -21.7
(-0.65)
5.8
(0.19)
-22.4
(-0.68)
-0.4
(-0.01)
DOMI - -46.8
(-1.53)
-43.9
(-1.47)
-49.0
(-1.58)
-47.0
(-1.56)
FOR - -16.1
(-0.46)
-6.6 (-0.21)
3.4
(0.10)
17.0 (0.55)
PUB . 31.1
(0.51)
27.5 (0.46)
39.3 (0.64)
39.7 (0.65)
Size 12.5* (1.69)
13.2* (1.87)
12.5* (1.79)
13.0* (1.83)
12.8* (1.82)
13.0* (1.84)
12.9* (1.77)
Debt Ratio -182.1** (-2.81)
-177.6*** (-2.81)
-177.6*** (-2.84)
-174.6*** (-2.77)
-172.1*** (-2.75)
-176.8*** (-2.77)
-173.8*** (-2.72)
Constant 2.7
(0.33) 4.2
(0.54) 3.0
(0.39) 4.5
(0.57) 4.5
(0.58) 4.6
(0.58) 4.4
(0.56) 1.7
(0.21) 3.3
(0.41) 1.8
(0.22) 3.3
(0.42) 3.3
(0.42) 3.4 (0.42)
3.2 (0.40)
White test
(p-value) 1.00 0.97 0.96 0.96 0.97 0.89 0.98 1.00 0.79 0.82 0.68 0.96 0.69 0.96
F-test
(p-value)
2.38**
(0.02)
4.48***
(0.00)
5.38***
(0.00)
4.40***
(0.00)
5.14***
(0.00)
4.40***
(0.00)
4.43***
(0.00)
1.01
(0.42)
0.00
(0.98)
2.70
(0.10)
0.00
(0.99)
2.42
(0.12)
0.30
(0.59)
0.42
(0.52)
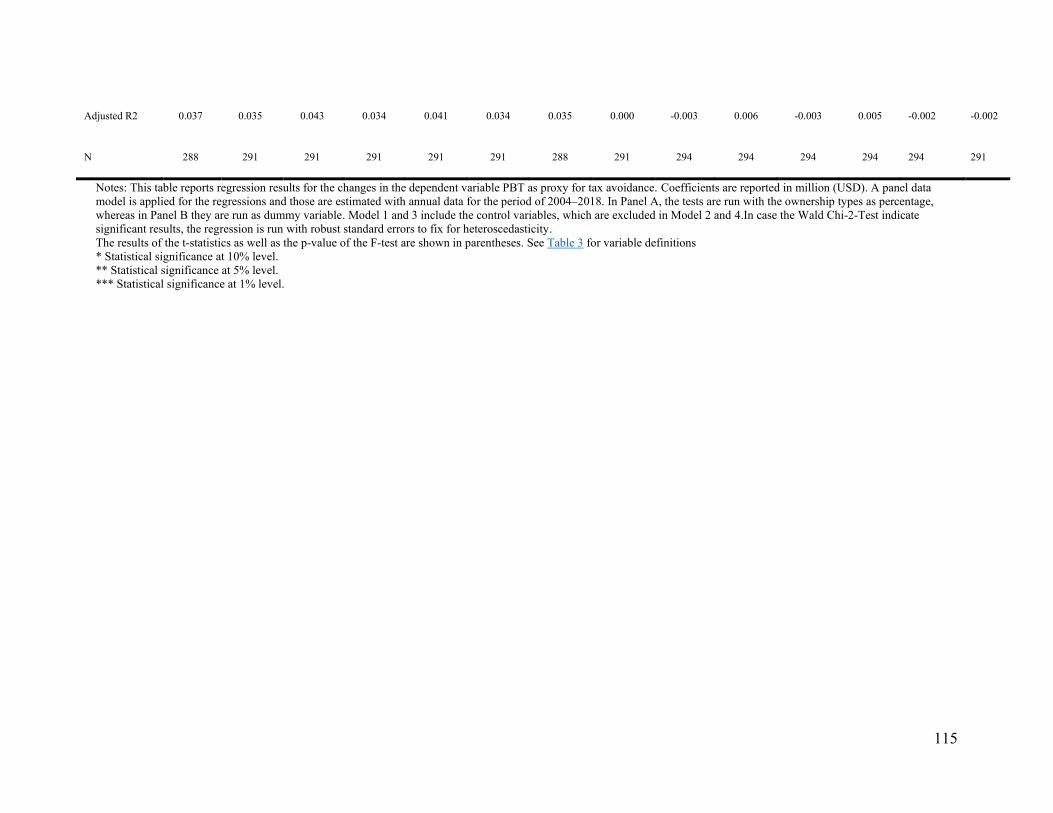
115
Adjusted R2 0.037 0.035 0.043 0.034 0.041 0.034 0.035 0.000 -0.003 0.006 -0.003 0.005 -0.002 -0.002
N 288 291 291 291 291 291 288 291 294 294 294 294 294 291
Notes: This table reports regression results for the changes in the dependent variable PBT as proxy for tax avoidance. Coefficients are reported in million (USD). A panel data
model is applied for the regressions and those are estimated with annual data for the period of 2004–2018. In Panel A, the tests are run with the ownership types as percentage,
whereas in Panel B they are run as dummy variable. Model 1 and 3 include the control variables, which are excluded in Model 2 and 4.In case the Wald Chi-2-Test indicate
significant results, the regression is run with robust standard errors to fix for heteroscedasticity.
The results of the t-statistics as well as the p-value of the F-test are shown in parentheses. See Table 3 for variable definitions
* Statistical significance at 10% level.
** Statistical significance at 5% level.
*** Statistical significance at 1% level.
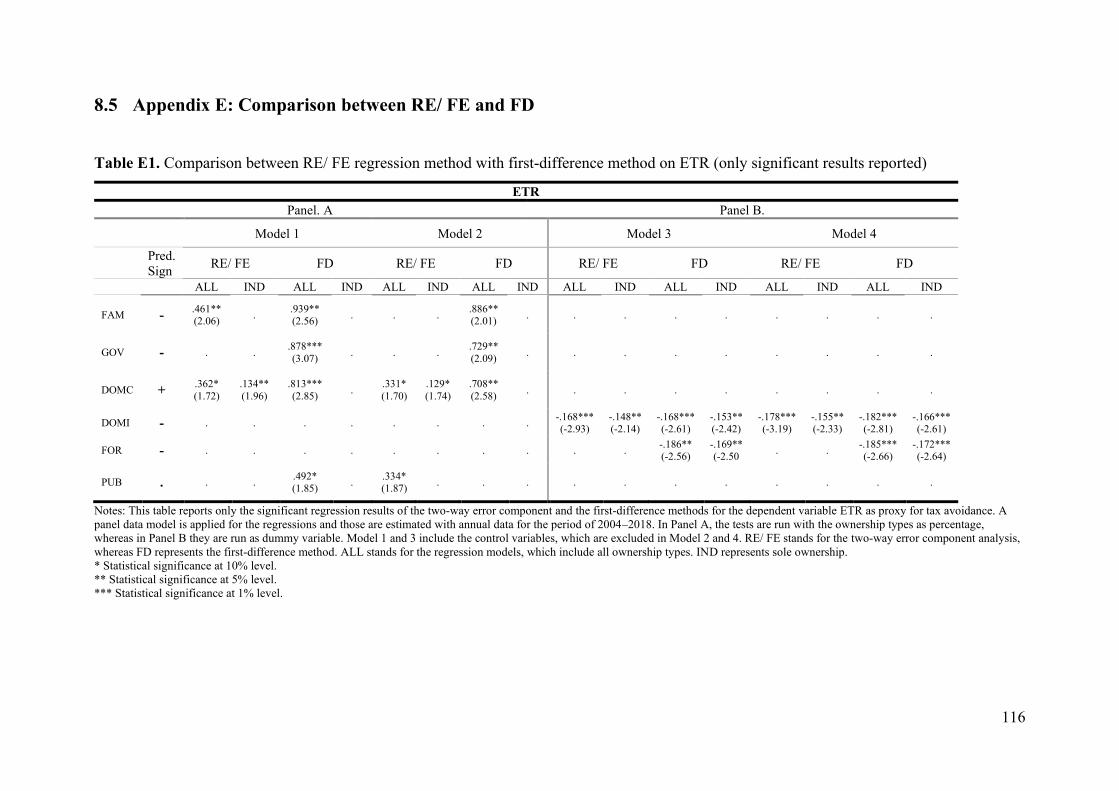
116
8.5 Appendix E: Comparison between RE/ FE and FD
Table E1. Comparison between RE/ FE regression method with first-difference method on ETR (only significant results reported)
ETR
Panel. A Panel B.
Model 1 Model 2 Model 3 Model 4
Pred.
Sign RE/ FE FD RE/ FE FD RE/ FE FD RE/ FE FD
ALL IND ALL IND ALL IND ALL IND ALL IND ALL IND ALL IND ALL IND
FAM - .461** (2.06)
. .939** (2.56)
. . . .886** (2.01)
. . . . . . . . .
GOV - . . .878***
(3.07) . . .
.729**
(2.09) . . . . . . . . .
DOMC + .362*
(1.72)
.134**
(1.96)
.813***
(2.85) .
.331*
(1.70)
.129*
(1.74)
.708**
(2.58) . . . . . . . . .
DOMI - . . . . . . . . -.168*** (-2.93)
-.148** (-2.14)
-.168*** (-2.61)
-.153** (-2.42)
-.178*** (-3.19)
-.155** (-2.33)
-.182*** (-2.81)
-.166*** (-2.61)
FOR - . . . . . . . . . . -.186** (-2.56)
-.169** (-2.50
. . -.185*** (-2.66)
-.172*** (-2.64)
PUB . . . .492* (1.85)
. .334* (1.87)
. . . . . . . . . . .
Notes: This table reports only the significant regression results of the two-way error component and the first-difference methods for the dependent variable ETR as proxy for tax avoidance. A
panel data model is applied for the regressions and those are estimated with annual data for the period of 2004–2018. In Panel A, the tests are run with the ownership types as percentage,
whereas in Panel B they are run as dummy variable. Model 1 and 3 include the control variables, which are excluded in Model 2 and 4. RE/ FE stands for the two-way error component analysis,
whereas FD represents the first-difference method. ALL stands for the regression models, which include all ownership types. IND represents sole ownership.
* Statistical significance at 10% level.
** Statistical significance at 5% level.
*** Statistical significance at 1% level.
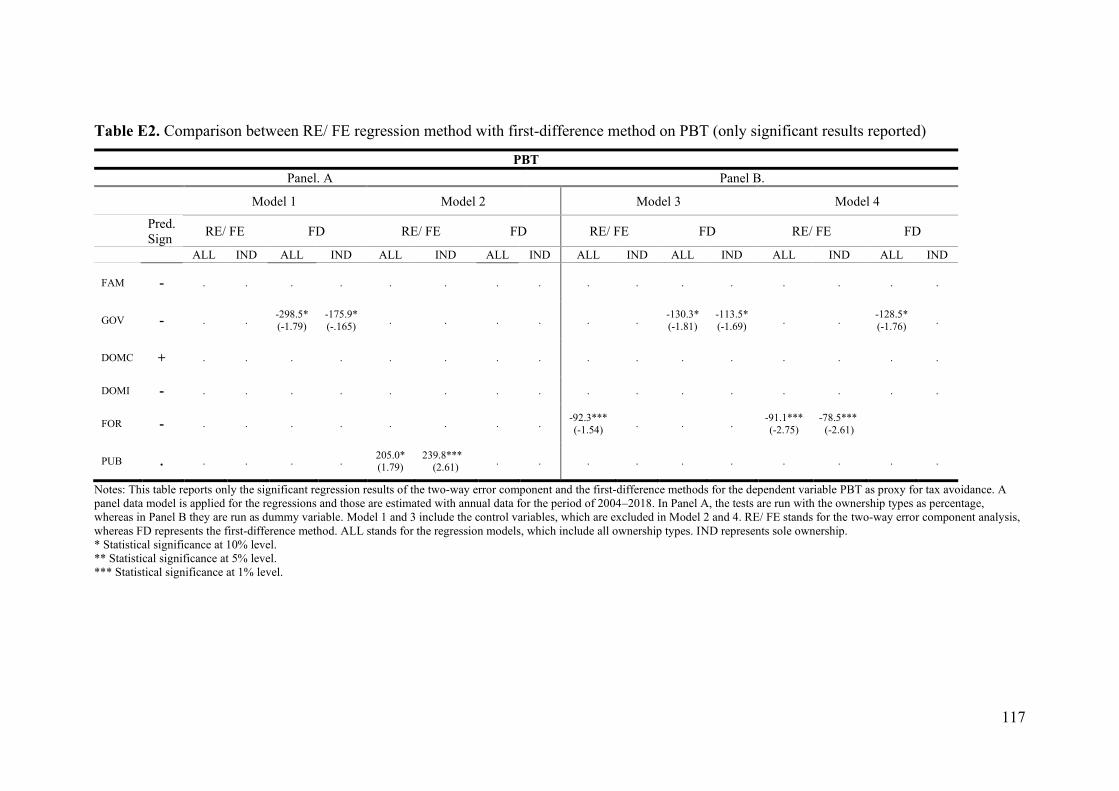
117
Table E2. Comparison between RE/ FE regression method with first-difference method on PBT (only significant results reported)
PBT
Panel. A Panel B.
Model 1 Model 2 Model 3 Model 4
Pred.
Sign RE/ FE FD RE/ FE FD RE/ FE FD RE/ FE FD
ALL IND ALL IND ALL IND ALL IND ALL IND ALL IND ALL IND ALL IND
FAM - . . . . . . . . . . . . . . . .
GOV - . . -298.5*
(-1.79)
-175.9*
(-.165) . . . . . .
-130.3*
(-1.81)
-113.5*
(-1.69) . .
-128.5*
(-1.76) .
DOMC + . . . . . . . . . . . . . . . .
DOMI - . . . . . . . . . . . . . . . .
FOR - . . . . . . . . -92.3***
(-1.54) . . .
-91.1***
(-2.75)
-78.5***
(-2.61)
PUB . . . . . 205.0* (1.79)
239.8*** (2.61)
. . . . . . . . . .
Notes: This table reports only the significant regression results of the two-way error component and the first-difference methods for the dependent variable PBT as proxy for tax avoidance. A
panel data model is applied for the regressions and those are estimated with annual data for the period of 2004–2018. In Panel A, the tests are run with the ownership types as percentage,
whereas in Panel B they are run as dummy variable. Model 1 and 3 include the control variables, which are excluded in Model 2 and 4. RE/ FE stands for the two-way error component analysis,
whereas FD represents the first-difference method. ALL stands for the regression models, which include all ownership types. IND represents sole ownership.
* Statistical significance at 10% level.
** Statistical significance at 5% level.
*** Statistical significance at 1% level.
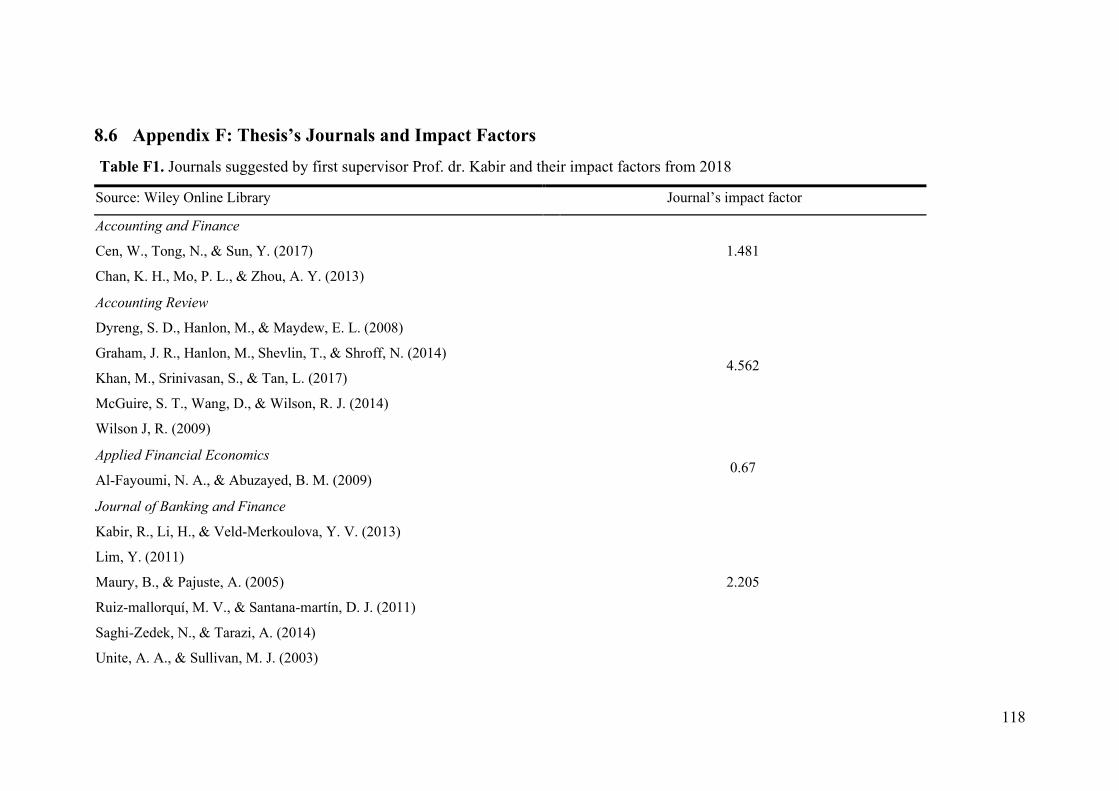
118
8.6 Appendix F: Thesis’s Journals and Impact Factors
Table F1. Journals suggested by first supervisor Prof. dr. Kabir and their impact factors from 2018
Source: Wiley Online Library Journal’s impact factor
Accounting and Finance
Cen, W., Tong, N., & Sun, Y. (2017)
Chan, K. H., Mo, P. L., & Zhou, A. Y. (2013)
1.481
Accounting Review
Dyreng, S. D., Hanlon, M., & Maydew, E. L. (2008)
Graham, J. R., Hanlon, M., Shevlin, T., & Shroff, N. (2014)
Khan, M., Srinivasan, S., & Tan, L. (2017)
McGuire, S. T., Wang, D., & Wilson, R. J. (2014)
Wilson J, R. (2009)
4.562
Applied Financial Economics
Al-Fayoumi, N. A., & Abuzayed, B. M. (2009) 0.67
Journal of Banking and Finance
Kabir, R., Li, H., & Veld-Merkoulova, Y. V. (2013)
Lim, Y. (2011)
Maury, B., & Pajuste, A. (2005)
Ruiz-mallorquí, M. V., & Santana-martín, D. J. (2011)
Saghi-Zedek, N., & Tarazi, A. (2014)
Unite, A. A., & Sullivan, M. J. (2003)
2.205
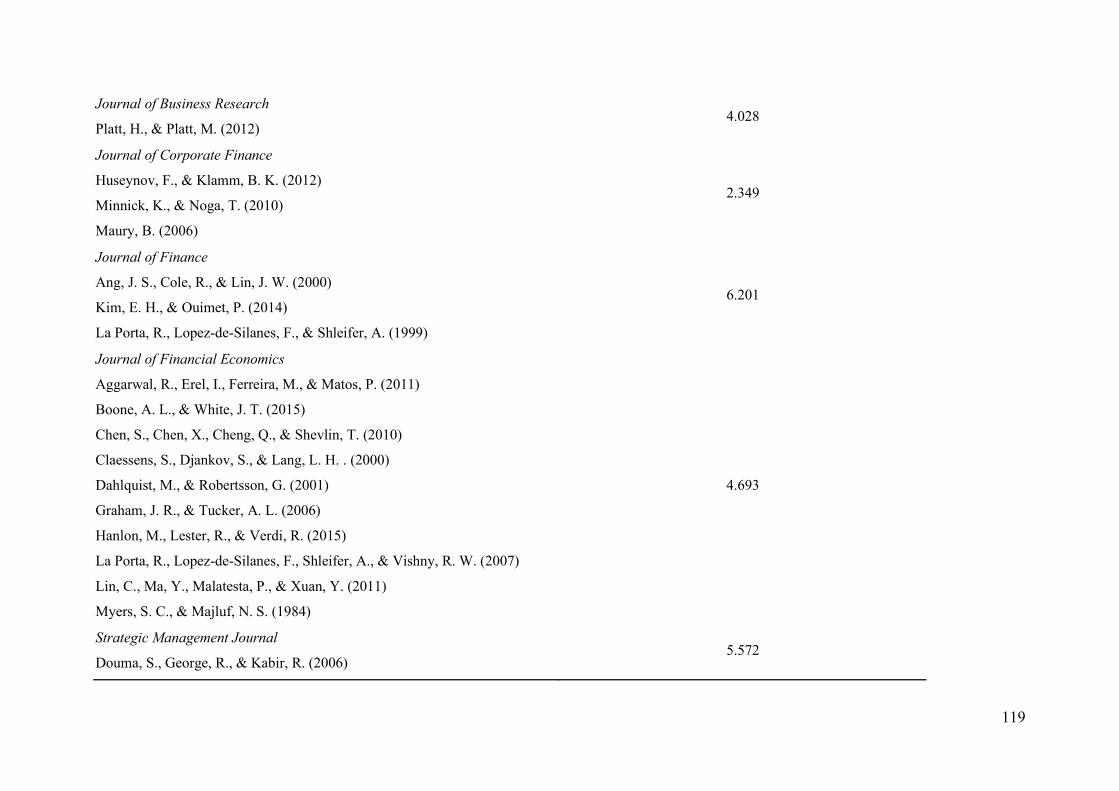
119
Journal of Business Research
Platt, H., & Platt, M. (2012) 4.028
Journal of Corporate Finance
Huseynov, F., & Klamm, B. K. (2012)
Minnick, K., & Noga, T. (2010)
Maury, B. (2006)
2.349
Journal of Finance
Ang, J. S., Cole, R., & Lin, J. W. (2000)
Kim, E. H., & Ouimet, P. (2014)
La Porta, R., Lopez-de-Silanes, F., & Shleifer, A. (1999)
6.201
Journal of Financial Economics
Aggarwal, R., Erel, I., Ferreira, M., & Matos, P. (2011)
Boone, A. L., & White, J. T. (2015)
Chen, S., Chen, X., Cheng, Q., & Shevlin, T. (2010)
Claessens, S., Djankov, S., & Lang, L. H. . (2000)
Dahlquist, M., & Robertsson, G. (2001)
Graham, J. R., & Tucker, A. L. (2006)
Hanlon, M., Lester, R., & Verdi, R. (2015)
La Porta, R., Lopez-de-Silanes, F., Shleifer, A., & Vishny, R. W. (2007)
Lin, C., Ma, Y., Malatesta, P., & Xuan, Y. (2011)
Myers, S. C., & Majluf, N. S. (1984)
4.693
Strategic Management Journal
Douma, S., George, R., & Kabir, R. (2006) 5.572
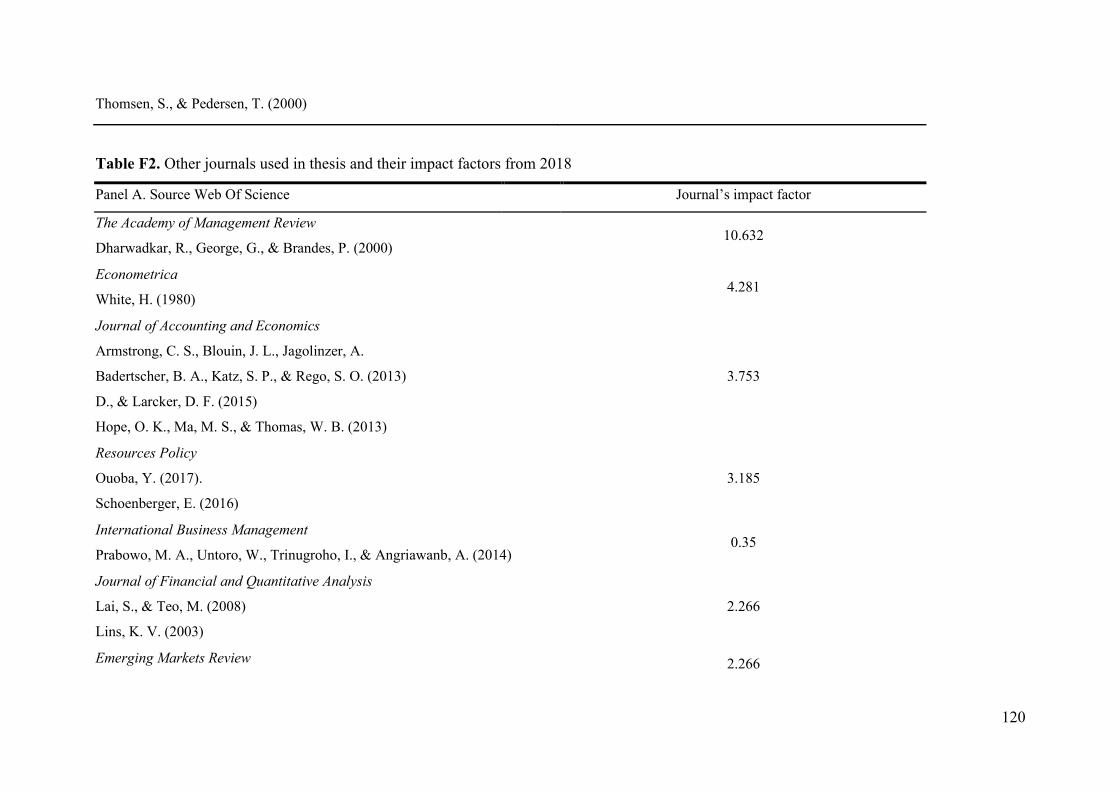
120
Thomsen, S., & Pedersen, T. (2000)
Table F2. Other journals used in thesis and their impact factors from 2018
Panel A. Source Web Of Science Journal’s impact factor
The Academy of Management Review
Dharwadkar, R., George, G., & Brandes, P. (2000) 10.632
Econometrica
White, H. (1980) 4.281
Journal of Accounting and Economics
Armstrong, C. S., Blouin, J. L., Jagolinzer, A.
Badertscher, B. A., Katz, S. P., & Rego, S. O. (2013)
D., & Larcker, D. F. (2015)
Hope, O. K., Ma, M. S., & Thomas, W. B. (2013)
3.753
Resources Policy
Ouoba, Y. (2017).
Schoenberger, E. (2016)
3.185
International Business Management
Prabowo, M. A., Untoro, W., Trinugroho, I., & Angriawanb, A. (2014) 0.35
Journal of Financial and Quantitative Analysis
Lai, S., & Teo, M. (2008)
Lins, K. V. (2003)
2.266
Emerging Markets Review 2.266
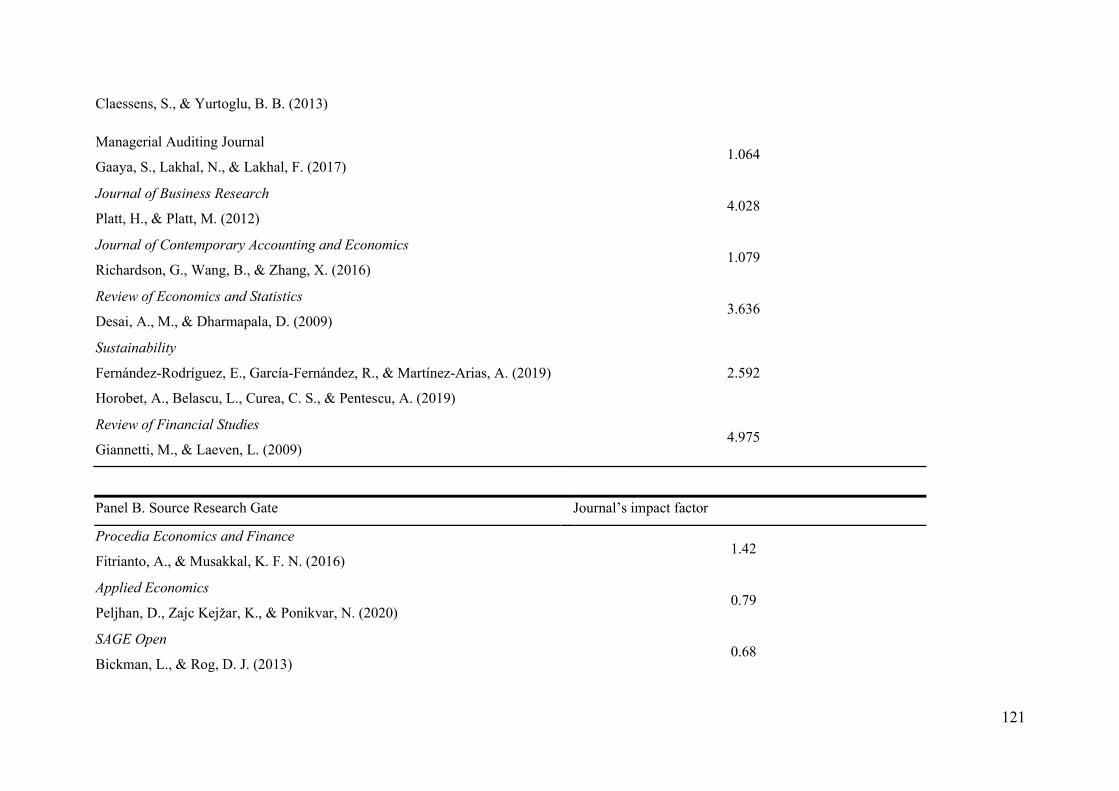
121
Claessens, S., & Yurtoglu, B. B. (2013)
Managerial Auditing Journal
Gaaya, S., Lakhal, N., & Lakhal, F. (2017) 1.064
Journal of Business Research
Platt, H., & Platt, M. (2012) 4.028
Journal of Contemporary Accounting and Economics
Richardson, G., Wang, B., & Zhang, X. (2016) 1.079
Review of Economics and Statistics
Desai, A., M., & Dharmapala, D. (2009) 3.636
Sustainability
Fernández-Rodríguez, E., García-Fernández, R., & Martínez-Arias, A. (2019)
Horobet, A., Belascu, L., Curea, C. S., & Pentescu, A. (2019)
2.592
Review of Financial Studies
Giannetti, M., & Laeven, L. (2009) 4.975
Panel B. Source Research Gate Journal’s impact factor
Procedia Economics and Finance
Fitrianto, A., & Musakkal, K. F. N. (2016) 1.42
Applied Economics
Peljhan, D., Zajc Kejžar, K., & Ponikvar, N. (2020) 0.79
SAGE Open
Bickman, L., & Rog, D. J. (2013) 0.68
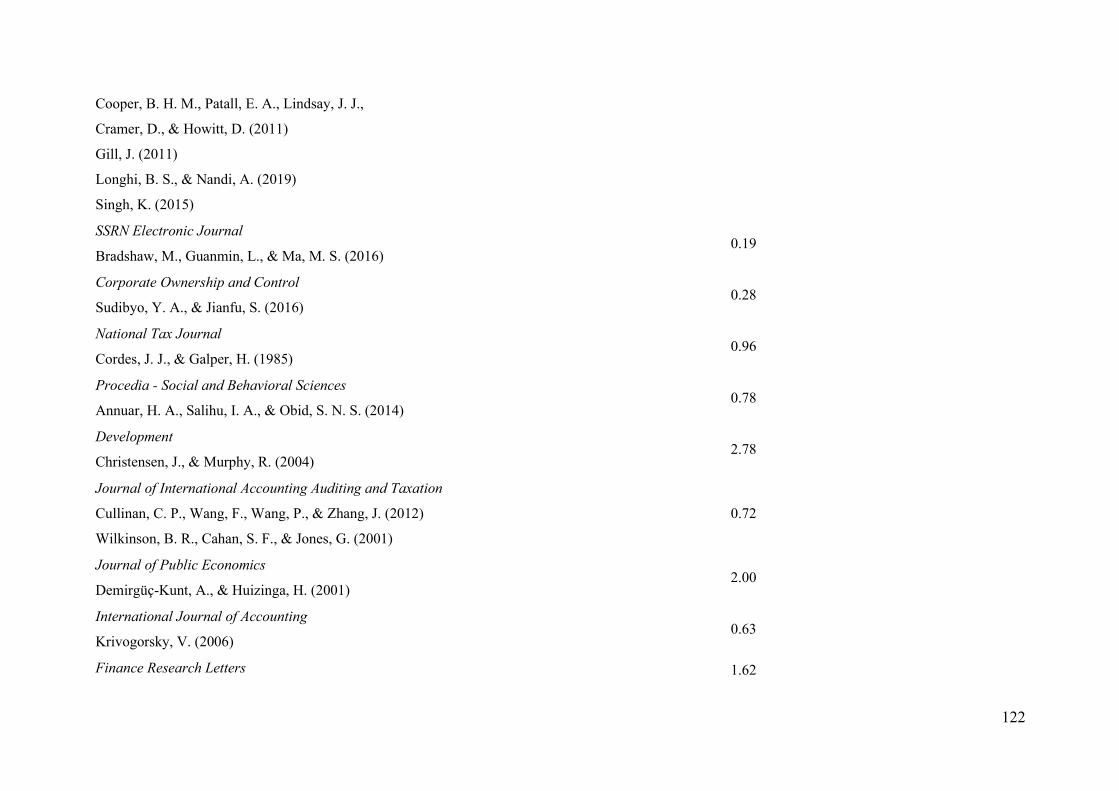
122
Cooper, B. H. M., Patall, E. A., Lindsay, J. J.,
Cramer, D., & Howitt, D. (2011)
Gill, J. (2011)
Longhi, B. S., & Nandi, A. (2019)
Singh, K. (2015)
SSRN Electronic Journal
Bradshaw, M., Guanmin, L., & Ma, M. S. (2016) 0.19
Corporate Ownership and Control
Sudibyo, Y. A., & Jianfu, S. (2016) 0.28
National Tax Journal
Cordes, J. J., & Galper, H. (1985) 0.96
Procedia - Social and Behavioral Sciences
Annuar, H. A., Salihu, I. A., & Obid, S. N. S. (2014) 0.78
Development
Christensen, J., & Murphy, R. (2004) 2.78
Journal of International Accounting Auditing and Taxation
Cullinan, C. P., Wang, F., Wang, P., & Zhang, J. (2012)
Wilkinson, B. R., Cahan, S. F., & Jones, G. (2001)
0.72
Journal of Public Economics
Demirgüç-Kunt, A., & Huizinga, H. (2001) 2.00
International Journal of Accounting
Krivogorsky, V. (2006) 0.63
Finance Research Letters 1.62
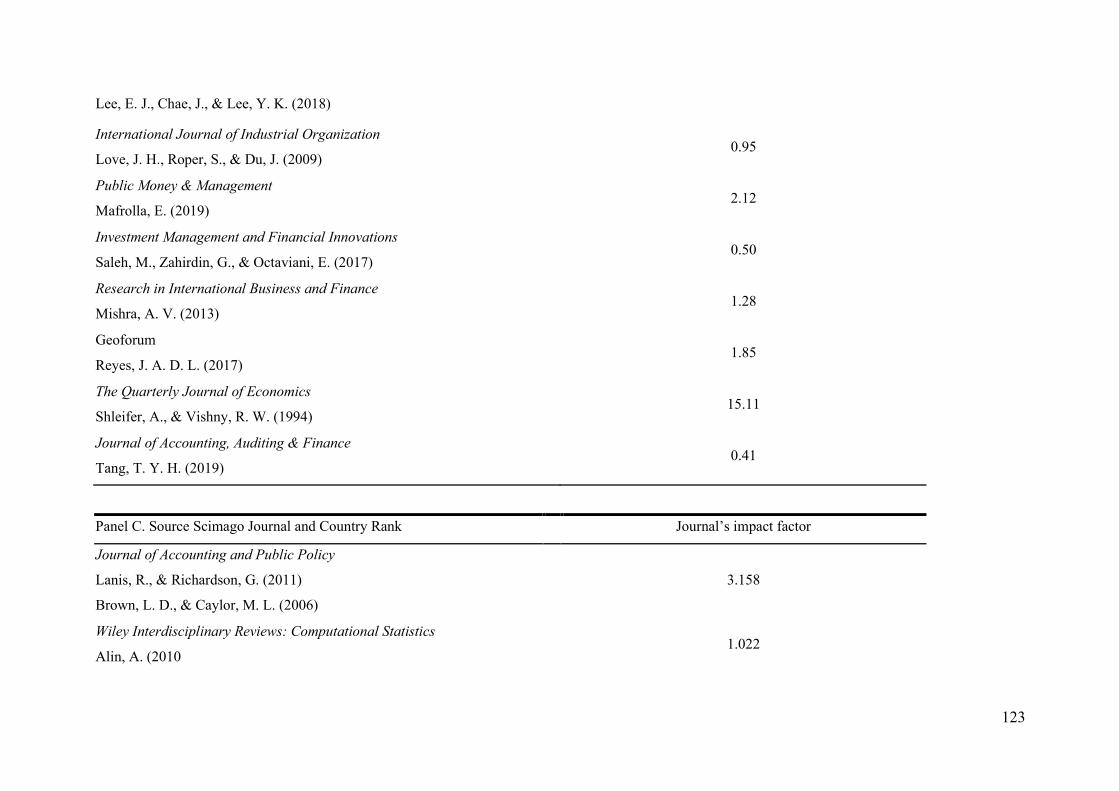
123
Lee, E. J., Chae, J., & Lee, Y. K. (2018)
International Journal of Industrial Organization
Love, J. H., Roper, S., & Du, J. (2009) 0.95
Public Money & Management
Mafrolla, E. (2019) 2.12
Investment Management and Financial Innovations
Saleh, M., Zahirdin, G., & Octaviani, E. (2017) 0.50
Research in International Business and Finance
Mishra, A. V. (2013) 1.28
Geoforum
Reyes, J. A. D. L. (2017) 1.85
The Quarterly Journal of Economics
Shleifer, A., & Vishny, R. W. (1994) 15.11
Journal of Accounting, Auditing & Finance
Tang, T. Y. H. (2019) 0.41
Panel C. Source Scimago Journal and Country Rank Journal’s impact factor
Journal of Accounting and Public Policy
Lanis, R., & Richardson, G. (2011)
Brown, L. D., & Caylor, M. L. (2006)
3.158
Wiley Interdisciplinary Reviews: Computational Statistics
Alin, A. (2010 1.022
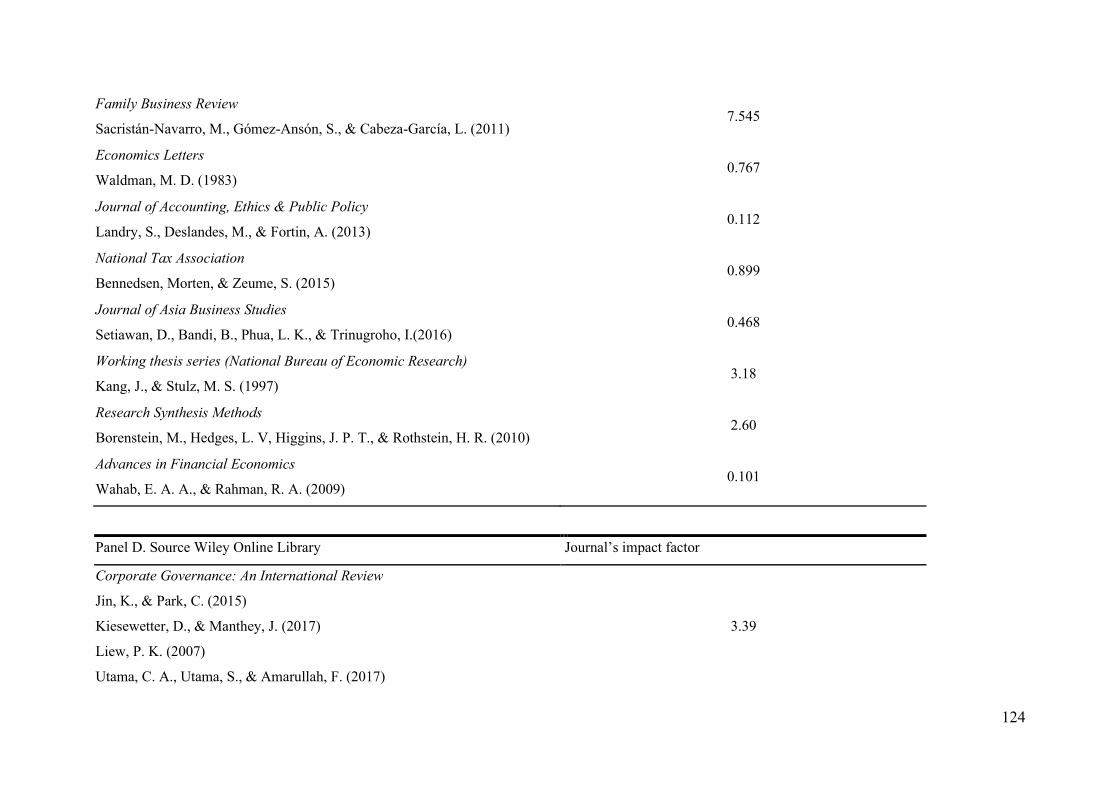
124
Family Business Review
Sacristán-Navarro, M., Gómez-Ansón, S., & Cabeza-García, L. (2011) 7.545
Economics Letters
Waldman, M. D. (1983) 0.767
Journal of Accounting, Ethics & Public Policy
Landry, S., Deslandes, M., & Fortin, A. (2013) 0.112
National Tax Association
Bennedsen, Morten, & Zeume, S. (2015) 0.899
Journal of Asia Business Studies
Setiawan, D., Bandi, B., Phua, L. K., & Trinugroho, I.(2016) 0.468
Working thesis series (National Bureau of Economic Research)
Kang, J., & Stulz, M. S. (1997) 3.18
Research Synthesis Methods
Borenstein, M., Hedges, L. V, Higgins, J. P. T., & Rothstein, H. R. (2010) 2.60
Advances in Financial Economics
Wahab, E. A. A., & Rahman, R. A. (2009) 0.101
Panel D. Source Wiley Online Library Journal’s impact factor
Corporate Governance: An International Review
Jin, K., & Park, C. (2015)
Kiesewetter, D., & Manthey, J. (2017)
Liew, P. K. (2007)
Utama, C. A., Utama, S., & Amarullah, F. (2017)
3.39
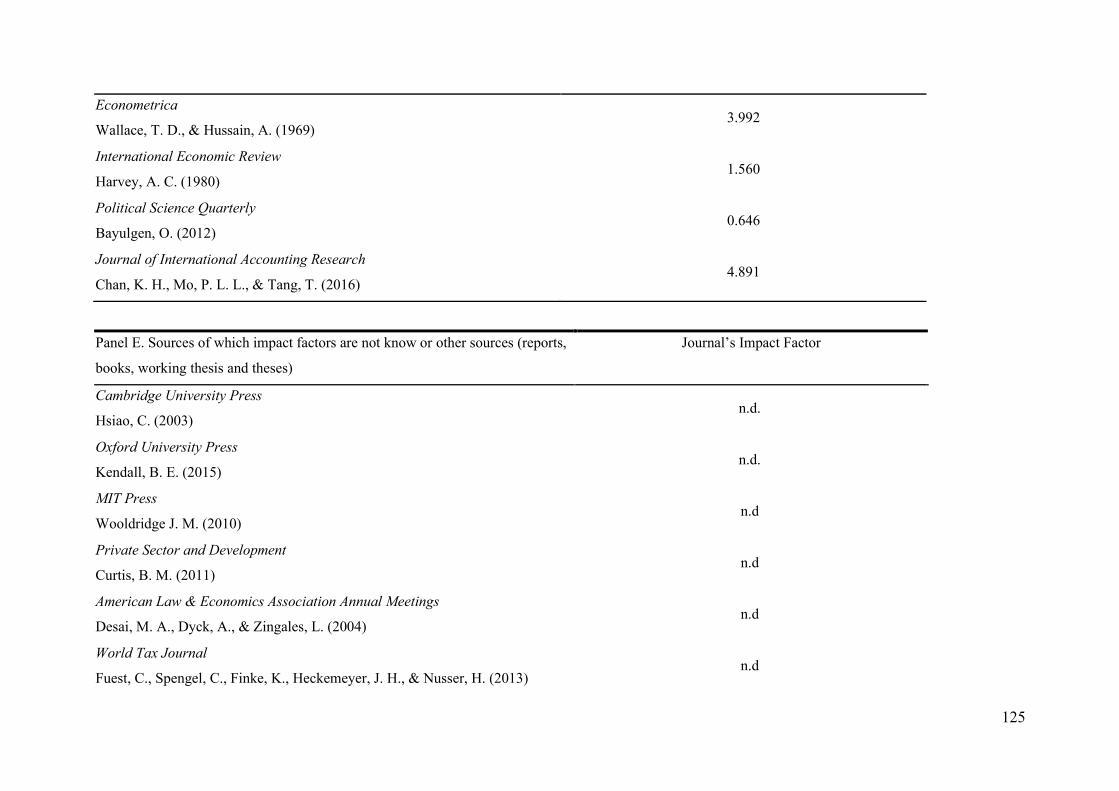
125
Econometrica
Wallace, T. D., & Hussain, A. (1969) 3.992
International Economic Review
Harvey, A. C. (1980) 1.560
Political Science Quarterly
Bayulgen, O. (2012) 0.646
Journal of International Accounting Research
Chan, K. H., Mo, P. L. L., & Tang, T. (2016) 4.891
Panel E. Sources of which impact factors are not know or other sources (reports,
books, working thesis and theses)
Journal’s Impact Factor
Cambridge University Press
Hsiao, C. (2003) n.d.
Oxford University Press
Kendall, B. E. (2015) n.d.
MIT Press
Wooldridge J. M. (2010) n.d
Private Sector and Development
Curtis, B. M. (2011) n.d
American Law & Economics Association Annual Meetings
Desai, M. A., Dyck, A., & Zingales, L. (2004) n.d
World Tax Journal
Fuest, C., Spengel, C., Finke, K., Heckemeyer, J. H., & Nusser, H. (2013) n.d
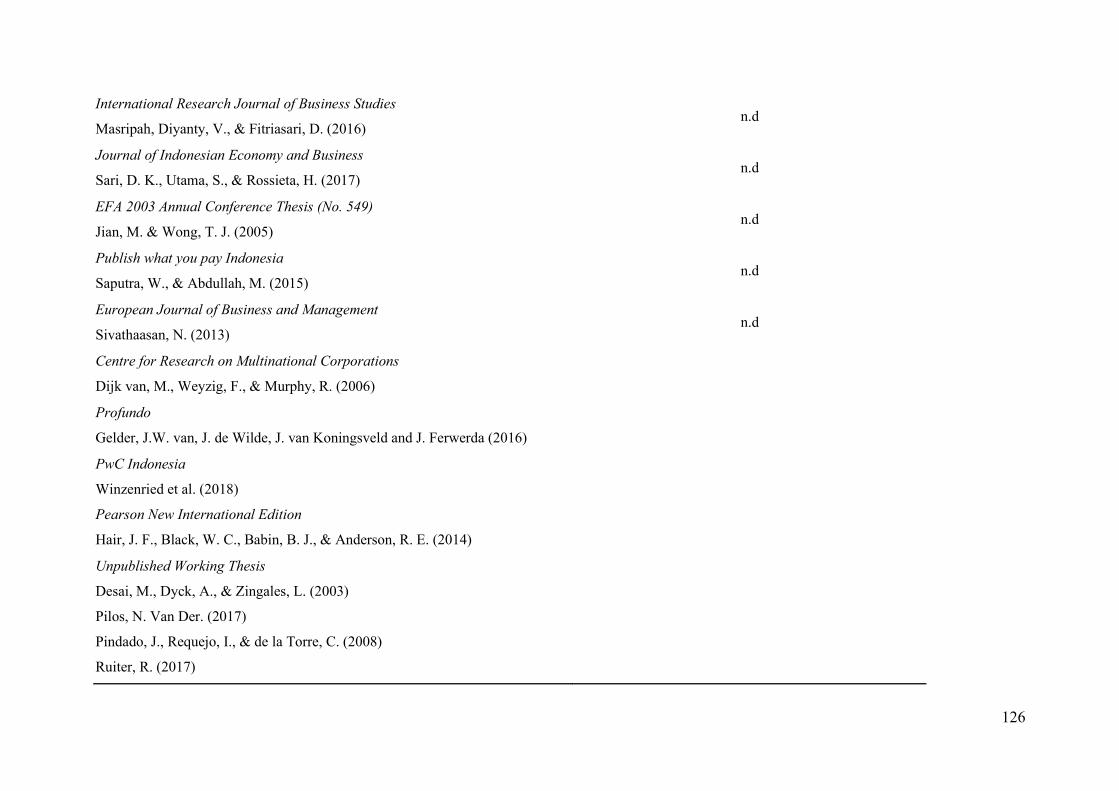
126
International Research Journal of Business Studies
Masripah, Diyanty, V., & Fitriasari, D. (2016) n.d
Journal of Indonesian Economy and Business
Sari, D. K., Utama, S., & Rossieta, H. (2017) n.d
EFA 2003 Annual Conference Thesis (No. 549)
Jian, M. & Wong, T. J. (2005) n.d
Publish what you pay Indonesia
Saputra, W., & Abdullah, M. (2015) n.d
European Journal of Business and Management
Sivathaasan, N. (2013) n.d
Centre for Research on Multinational Corporations
Dijk van, M., Weyzig, F., & Murphy, R. (2006)
Profundo
Gelder, J.W. van, J. de Wilde, J. van Koningsveld and J. Ferwerda (2016)
PwC Indonesia
Winzenried et al. (2018)
Pearson New International Edition
Hair, J. F., Black, W. C., Babin, B. J., & Anderson, R. E. (2014)
Unpublished Working Thesis
Desai, M., Dyck, A., & Zingales, L. (2003)
Pilos, N. Van Der. (2017)
Pindado, J., Requejo, I., & de la Torre, C. (2008)
Ruiter, R. (2017)

127
Thorne, D. (2013)