Embed Size (px)
Citation preview
361
Ownership Structure and Corporate Governance: Has an Increase in In-stitutional Investors’ Ownership Improved Business Performance?*
Hideaki MiyajimaProfessor, Graduate School of Commerce, Waseda University (E-mail: [email protected])
Takaaki HodaAssociate Professor, Faculty of Global Business, Showa Women’s University (E-mail: [email protected])
AbstractA dramatic increase in shareholder ownership by domestic and foreign institutional in-
vestors, along with the decline of the main bank system, is one of the greatest changes in the governance structure of Japanese companies in recent years. This paper aims to identify the effects of the rapid change in the shareholder ownership structure on corporate governance in Japan. Based on a comprehensive database concerning major shareholders in fiscal 1990–2008 that specifies the attributes of shareholders to the maximum possible extent, this paper indicated the following points. First, by examining the selecting stocks among institutional investors, we found that both domestic and foreign institutional investors not only make the selection based on companies’ size and stock liquidity but also prefer high-quality stocks in terms of profitability, stability and financial soundness. In contrast, banks and insurance companies continue to invest in low-quality companies. Furthermore, compared with do-mestic institutional investors, foreign ones have a strong tendency to attach importance to formal governance features (size of the board of directors and presence or absence of out-side directors). Foreign institutional investors also consistently have a strong home bias. Second, by testing the relationship between ownership and performance, we found that, whereas shareholder ownership by banks and insurance companies has negative effects on enterprise value and corporate earnings, share ownership by domestic and foreign institu-tional investors has positive effects. This finding indicates that even if a rise in domestic and foreign institutional investors’ ownership ratio is based on an institutional investor bias or a home bias, or if the impact on the stock price is due to a demand shock, an increase in share ownership by domestic and foreign institutional investors will enable them to exercise the monitoring effect through actions such as indicating the possibility of an exit (possibility of selling off their holdings of shares) and voicing of complaints.
Keywords: Ownership structure, investment criteria, corporate governance, corporate performance, institutional investors
JEL Classification: G11, G32, G34
Policy Research Institute, Ministry of Finance, Japan, Public Policy Review, Vol.11, No.3, July 2015
I. Introduction
The dramatic shift in ownership structure, along with the decline of the main bank sys-tem, was one of the most important changes that took place in corporate governance in Ja-pan between the end of the 20th century and the beginning of the 21st century. From the early 1970s to mid-1990s, shareholder ownership in Japanese companies was characterized by the prominent presence of corporate shareholders represented by banks and business cor-porations. However, following the onset of the banking crisis in 1997, this corporate-domi-nant ownership structure underwent a dramatic transformation. Companies and banks swift-ly dissolved their cross-shareholdings, while domestic and foreign institutional investors increased their shares, foreign ones in particular.1 By the mid-2000s, it was no longer un-common to see institutional investors holding a majority of total shares.
This brings us to a question: Does the rise in institutional investors’ presence imply that a new mechanism for management discipline is being created in Japan? This paper exam-ines this question by revealing how domestic and foreign institutional investors, and finan-cial institutions (banks and insurance companies) select stocks, and how such selections af-fect corporate performance.2
From the aspect of corporate governance, foreign institutional investors—who are in-creasing their shareholdings and whose aim is to maximize their return on investment—may replace former main banks as central players to create a new management discipline, since they are more independent from their investee compared to domestic institutional investors (Ferreira and Matos, 2008).3 In fact, it is often pointed out that there is a positive correlation between the ownership ratio or the increase in the ratio of foreign institutional investors, and the increase in stock prices. As a drawback, however, foreign institutional investors face se-rious issues in the asymmetry of information, and thus may not sufficiently produce pre-in-
* The data presented in this paper is based on a database developed by Miyajima and Nitta (2011). We would like to thank Keisuke Nitta (Nippon Life Insurance Company) for willingly allowing us to use the data. We are also grateful to Takuya Kawanishi (Prefectural University of Kumamoto) and Kaori Ubukata (Waseda University) for providing their counsel on our study. We received valuable advice from Yasuhiro Arikawa (Waseda University), Ryoichi Arai (Arai Capital Management; Doctoral Program, Graduate School, Waseda University), and Ryo Ogawa (Doctoral Program, Graduate School, Waseda Uni-versity). We also received invaluable feedback from the following: Toshio Serita (Aoyama Gakuin University; commentator at the Japanese Economic Association 2012 Spring Meeting), Naoki Watanabe (Ritsumeikan University; commentator at the Nip-pon Finance Association 20th Annual Meeting), participants of Research Institute of Economy, Trade & Industry (RIETI) Frontiers of Analysis in Corporate Governance: Growth, value creation and corporate governance workshop, and participants of a symposium organized by the Tokyo Stock Exchange. In preparing this paper, Japan Society for the Promotion of Science provided us with grants-in-aid for scientific research (Kakenhi 19203017 and 26870020). Please note that any errors in this pa-per are attributed to the authors.1 For details on the process of the unwinding of cross-shareholdings, refer to Miyajima and Kuroki (2007), Miyajima and Kuroki (2002), and Miyajima and Nitta (2011).2 In this paper, we focus on the impact that the change in ownership structure has on corporate performance; however, we need to also consider the impact that change in ownership structure has on e.g., management reshuffles, dividend policies, business reorganization, and functions of market for corporate control. It is also important to consider the cause and effect between in-vestors’ stock selections, decisions made by the board of directors, and the corporate actions described above.3 Aoki (2010) also pointed out this possibility, and suggested that the answer lies in whether or not institutional investors can evaluate the quality of business models.
362 T Hoda, H Miyajima / Public Policy Review
363
vestment monitoring (screening) effects. In addition, while the aggregate of their ownership ratio may be high, each investor’s ownership could be low, and therefore respective inves-tors may not have strong incentives to carry out post-investment monitoring. Moreover, for-eign investors are known to have a strong behavioral bias when making investments, so it is also possible that the positive correlation between the increase in institutional investors’ ownership ratio and rise in stock price is the result of such investment bias serving as a de-mand shock and thereby raising stock prices, rather than the result of pre- or post-invest-ment monitoring.
In contrast, domestic institutional investors, whose number increased largely from the end of the 1990s, do not face as many issues in asymmetry of information as foreign institu-tional investors. Hence, they may be just as capable as, or perhaps even more capable than foreign institutional investors in imposing discipline on corporate management. Generally, institutional investors mainly consist of domestic institutional investors managing invest-ment trusts or pension funds. They increased their ownership ratio from 2000, which was when they entered full-scale into stock investments for pension fund management. Domestic institutional investors most likely strengthened their post-investment monitoring roles not only because of the spread in pension fund mandates, but also due to stronger external pres-sure for fulfilling fiduciary responsibility. At the same time, many domestic institutional in-vestors are group companies of large financial institutions (banks and insurance companies), e.g., an insurance company’s subsidiary specializing in investment advisory, a trust bank af-filiated with a bank-oriented group or in a keiretsu group. Therefore, it has been pointed out that such investors (i.e., grey investors) opt for investments that benefit the bank or insur-ance company that is their parent or affiliate company.4 Japan is not the only country that experiences this issue where banks and insurance companies invest not only for economic benefits, but also with the intention to gain advantages in business relationships; the same issue can be seen in the U.S. and other countries. Therefore, it may be slightly shortsighted to claim that an increase in institutional investors will lead directly to adequate corporate governance.5
Finally, it has generally been understood that banks and insurance companies—whose ownership ratio declined largely after 1999—make investments with intentions other than to gain economic benefits. For example, banks held client companies’ shares to ensure credit collections, while life insurance companies held shares mainly to acquire new insurance contracts or maintain existing ones. Consequently, from the standpoint of corporate gover-nance, bank and insurance company shareholders were expected to serve as an entrench-ment that protects the company’s management from capital market pressure (Morck and Na- 4 Flath (1993), Hiraki et al. (2003), and Ahmadjian (2007). Also, in 2004, Tomomi Yano, former Managing Director of the Em-ployees’ Pension Fund Association, suggested that Japanese institutional investors “lack independence” since they are associat-ed with a keiretsu or group (SHOJIHOMU Co., Ltd., 2004).5 An empirical research conducted in the U.S. regarded this as an issue of disparity in investment criteria between independent and non-independent (i.e., grey) institutional investors (Brickley et al. 1988; Borokhovichi et al. 2006; Chen et al. 2007; Fer-reira and Matos, 2008). For example, Ferreira and Matos (2008) indicated that compared to grey institutional investors, inde-pendent institutional investors tended to select stocks purely to maximize return on investment.
Policy Research Institute, Ministry of Finance, Japan, Public Policy Review, Vol.11, No.3, July 2015
kamura, 2000). After 2000, however, the banking sector, which had to dispose of non-performing loans, and life insurance companies, which faced serious competition due to deregulations, drastically reduced their shareholdings. In the process, banks and insurance companies may have changed the way they selected stocks. For example, the banking sec-tor, which was required to reduce shareholdings, may have focused on the performance of the investees when selecting stocks, and similarly, insurance companies may have raised their awareness toward fiduciary responsibility when making investments. However, these assumptions have not yet been fully validated in past research.
The main objective of this paper is to clarify which of the aforementioned contrasting views regarding domestic and foreign institutional investors and financial institutions (banks and insurance companies) is valid. As with Miyajima and Nitta (2011), the analysis is based on a comprehensive database covering a long period, compiled from companies’ lists of ma-jor shareholders and specifying the attribute of such shareholders to a maximum possible extent.
To unravel this question, we broke the analysis down into two steps. First, we analyzed the features of stock preference by shareholder type. According to analyses, both domestic and foreign institutional investors not only select stocks based on company size and stock li-quidity, but also tend to select high-quality stocks, as defined in Del Guercio (1996), in terms of profitability, stability and financial soundness, and no gap was detected between domestic and foreign investors in such preferences. In contrast, financial institutions (banks and insurance companies) continued to invest in low-quality stocks with low liquidity up until 2008. This implies that Japanese banks and insurance companies continued to hold shares to sustain business ties, rather than to maximize return on investment.
In terms of investment criteria, foreign institutional investors are strongly and consis-tently biased toward companies that have a high overseas sales ratio and whose stocks are incorporated in the MSCI Japan Index, meaning they are widely and well known. Mean-while, domestic institutional investors include relatively smaller companies in their invest-ment scope. Thus, there is moderate segmentation between the Japanese stocks that domes-tic and foreign institutional investors invest in. Also, foreign institutional investors apparently prefer companies with strong governance schemes: up until the 2000s, they placed value on the size of the board, and from 2000 onward, they valued the ratio of out-side directors. Such preferences could not be confirmed among domestic investors. These findings are consistent with the view that foreign institutional investors are key players in driving governance system reforms.
The second step validates whether the rapid change in ownership structure produced monitoring effects, thereby boosting managements’ efforts and enhancing companies’ finan-cial results. We will focus on whether the increase in the ownership ratio of institutional in-vestors serves to raise pressure through exits or voicing complaints, and in turn enforces management discipline, regardless of the reason for the increase. According to analyses, there was a positive correlation between firm value, measured by Tobin’s Q and financial performance (ROA), and the ownership ratio level of foreign and domestic institutional in-
364 T Hoda, H Miyajima / Public Policy Review
365
vestors, even when considering the reverse causality that institutional investors prefer com-panies with high financial performance. Comparing the 1990s to the 2000s, the correlation is stronger, especially for domestic institutional investors during the 2000s, which was when the ownership ratio of domestic and foreign institutional investors increased drastically. Al-though the exact cause and effects behind this phenomenon are yet to be analyzed, it is high-ly probable that once shareholder ownership by domestic and foreign institutional investors increases, whether it be the result of biased investments, such increase raises the pressure of exits and voices, and thereby has an impact on corporate governance. In contrast, the owner-ship ratio of banks and insurance companies had a significantly negative impact on compa-nies’ performance indices, and this impact is once again more apparent during the 2000s. Accordingly, we cannot support the view that banks and life insurance companies started exercising management discipline through shareholding. They remain to act as an entrench-ment that guards the management from stock market pressure.6
This paper is composed of the following sections: Section 2 provides an overview of the changes in ownership structure in Japanese companies after the 1990s. Section 3 analyzes the stock selections of institutional investors, and banks and insurance companies. Section 4 analyzes the impact that the change in ownership ratio of institutional investors has on the price to earnings ratio. Section 5 analyzes the impact that the change in ownership structure has on firm value and financial performance. Section 6 presents our conclusion.
II. Changes in Ownership Structure of Japanese Companies and its Background: Outline of Facts
II-1. Unwinding of Cross-Shareholding and Increase in Institutional Investors
The ownership structure of listed companies in Japan changed dramatically from the 1990s. The ownership ratio of domestic financial institutions (banks and insurance compa-nies) decreased rapidly, and in their place, the ownership ratio of domestic and foreign insti-tutional investors increased substantially. It is worth bringing to attention that the data pub-lished by the Tokyo Stock Exchange that is often sited to validate this point is weighted by market capitalization. Thus, the overall trend is determined by the trend of companies with large market capitalization, and the data does not capture the actual diversification in owner-ship structure in individual companies.
It is therefore necessary to grasp the trend of ownership structure in respective compa-nies; however, precautions need to be taken when referring to the shareholder composition presented in companies’ securities reports. As pointed out in Miyajima and Nitta (2011), classifications used in the shareholder composition are purely formal and do not duly ad-dress the differences in investors’ attributes or their objectives. For example, foreigners in-clude foreign business corporations and foreign institutional investors despite the fact that 6 For example, Tachibanaki and Nagakubo (1997) and Isagawa (2003) pointed out that financial institutions who are stable shareholders may prevent companies from strengthening their management discipline, or damage shareholder value in the long run by not carrying out actions that maximize return on investment.
Policy Research Institute, Ministry of Finance, Japan, Public Policy Review, Vol.11, No.3, July 2015
business corporations and institutional investors have different investment behavior and ob-jectives. Even more problematic is financial institutions, as it consolidates shares held by in-stitutional investors, who aim to maximize return on investment through investment trusts and pension funds, with shares held by banks and insurance companies, who have different objectives.7
Taking such issues into account, we developed our own data to match the context of this paper. The data captures ownership structure classified more explicitly into foreign institu-tional investors, domestic institutional investors, and financial institutions (banks and insur-ance companies). The data was developed by drawing on shareholder compositions and lists of major shareholders released by individual companies from 1990 and onwards, and com-bining that with a database identifying cross-shareholding between companies.8
In our data, ownership by foreign institutional investors was calculated by deducting shareholdings by foreign-registered business corporations and major foreign individual shareholders holding 3% or more of total shares, from the foreigner ownership ratio report-ed in each company’s securities report. Thus, this category is mainly represented by foreign pension funds and investment funds whose beneficiaries are large account investors.
Ownership by domestic institutional investors is the sum of the ownership ratio of in-vestment trusts, pension trusts, and special accounts for life insurance (entrusted investment of life insurance companies), and was calculated by aggregating accounts from lists of ma-jor shareholders. It should be noted that ownership by domestic institutional investors does not include trust bank safe deposits that are managed by investment advisory companies whose beneficiaries are public or private pension funds, since obtaining and identifying such data is difficult.9
Finally, ownership of banks and insurance companies was calculated by aggregating ownership by banks (excluding trust accounts), life insurance companies (excluding special accounts) and non-life insurance companies.
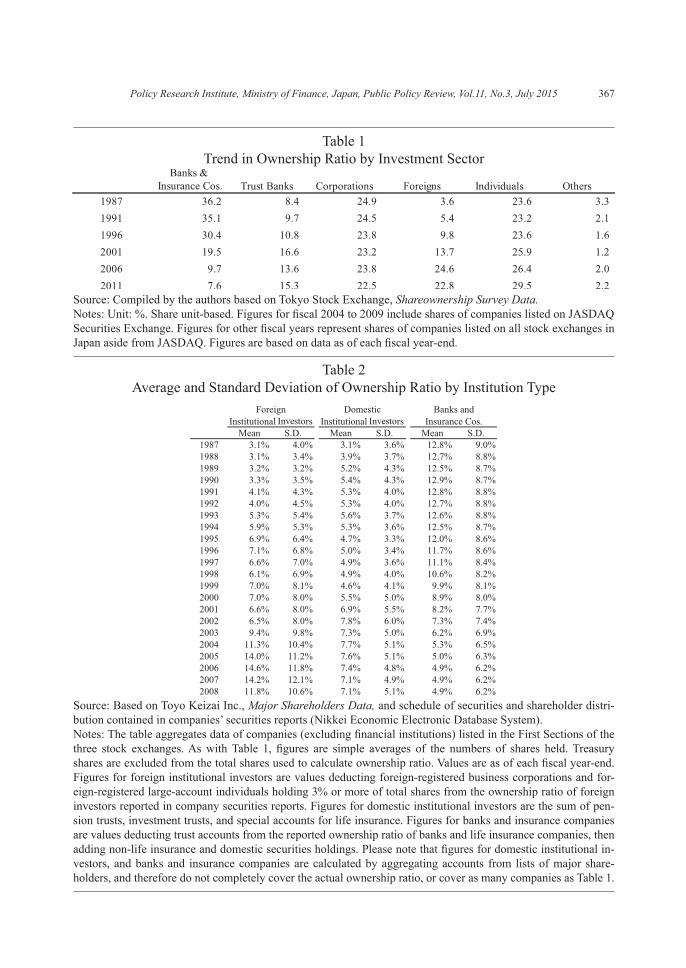
As a benchmark, Table 1 presents the trend of ownership ratio by investor sector based on the number of shares, drawing on Tokyo Stock Exchange data. Table 2 summarizes the simple average and standard deviation of ownership ratio by the institution types defined in the preceding paragraphs, for companies listed on the First Section of the Tokyo Stock Ex-
7 TSE discloses the number of investment trusts and pension trusts included in the aggregate ownership ratio of banks and trust banks; however, it does not disclose respective data of banks and trust banks that deducts the number of such shares. There-fore, we cannot confirm the standalone ownership ratio of banks, which were the main players in cross-shareholding.8 More specifically, the figures were compiled based on the following steps: A shareholder lists was created for respective non-financial institutions listed on the First Sections of Tokyo Stock Exchange, Osaka Securities Exchange and Nagoya Stock Exchange, by combining Major Shareholders Data (Toyo Keizai Inc.) with the schedule of securities and shareholder distribu-tion contained in companies’ securities reports (Nikkei Economic Electronic Database System). Based on the recreated share-holder lists, we distinguished foreign institutional investors, domestic institutional investors, and banks and insurance compa-nies. The data is the same as those used in Miyajima and Nitta (2011). We would like to thank Keisuke Nitta for willingly allowing us to use the data.9 Shares held by trust banks can be classified into trust accounts and own accounts; however, the breakdown of trust accounts cannot be confirmed. Roughly speaking, from the late 1980s to late 1990s, securities trusts, also called tokkin trust funds (spec-ified money in trusts) or fund trusts accounted for the majority of trust bank shareholder ownership; however, from 2000 and onward, it seems that safe deposits of funds set up by investment advisories became dominant.
366 T Hoda, H Miyajima / Public Policy Review
367
Table 1Trend in Ownership Ratio by Investment Sector
Source: Compiled by the authors based on Tokyo Stock Exchange, Shareownership Survey Data.Notes: Unit: %. Share unit-based. Figures for fiscal 2004 to 2009 include shares of companies listed on JASDAQ Securities Exchange. Figures for other fiscal years represent shares of companies listed on all stock exchanges in Japan aside from JASDAQ. Figures are based on data as of each fiscal year-end.
Table 2Average and Standard Deviation of Ownership Ratio by Institution Type
Source: Based on Toyo Keizai Inc., Major Shareholders Data, and schedule of securities and shareholder distri-bution contained in companies’ securities reports (Nikkei Economic Electronic Database System).Notes: The table aggregates data of companies (excluding financial institutions) listed in the First Sections of the three stock exchanges. As with Table 1, figures are simple averages of the numbers of shares held. Treasury shares are excluded from the total shares used to calculate ownership ratio. Values are as of each fiscal year-end. Figures for foreign institutional investors are values deducting foreign-registered business corporations and for-eign-registered large-account individuals holding 3% or more of total shares from the ownership ratio of foreign investors reported in company securities reports. Figures for domestic institutional investors are the sum of pen-sion trusts, investment trusts, and special accounts for life insurance. Figures for banks and insurance companies are values deducting trust accounts from the reported ownership ratio of banks and life insurance companies, then adding non-life insurance and domestic securities holdings. Please note that figures for domestic institutional in-vestors, and banks and insurance companies are calculated by aggregating accounts from lists of major share-holders, and therefore do not completely cover the actual ownership ratio, or cover as many companies as Table 1.
Policy Research Institute, Ministry of Finance, Japan, Public Policy Review, Vol.11, No.3, July 2015
change. Please note that in Table 2, figures for domestic institutional investors, and banks and insurance companies are computed by aggregating accounts extracted from lists of ma-jor shareholders, and therefore do not completely cover the actual ownership ratio, and also have a smaller coverage compared to Table 1. We describe the key characteristics of recent changes in listed companies’ ownership structure below.
(1) Ownership structure was consistent until the mid-1990s, characterized by the domi-nance of financial institutions and business corporations. For companies listed on the First Section of TSE, the average ownership ratio for the two sectors combined exceeded 60%. This structure shifted substantially, triggered by the 1997 banking crisis. The ownership ra-tio of business corporations, however, did not change all that much even after 1997. In con-trast, many companies and banks dissolved their cross-shareholdings, and life insurance companies also sold off their shares. Thus, the ownership ratio of banks and life insurance companies in TSE listed companies dropped from 30.4% in fiscal 1996 to 9.7% in fiscal 2006 (Table 1). Although sales of bank stocks by companies leveled out around 2002, sales (selloffs accompanying dissolved cross-shareholdings) by banks continued at a high level. Table 2 shows that the ownership ratio of banks and insurance companies declined some 0.5% to 1.0% per year between fiscal 1996 and 2004.
(2) The following two factors need to be considered with respect to the process of such unwinding of cross shareholding. First, an important factor driving the rapid sales of stocks was the enforcement of the Act on Limitation on Shareholding by Banks and Other Finan-cial Institutions in 2001. Up until then, the government’s stance toward shareholding by banks was neutral, so this was a drastic change in policy. Banks were required to reduce their stock holdings to 8% of total assets by September 2004.
Second, stock purchasing institutions and the Bank of Japan started to purchase stocks in order to ease the impact that the massive amount of selloffs accompanying dissolved cross-shareholdings had on the stock market; however, their purchases were restricted to stocks with credit ratings of BBB or higher. Consequently, banks and insurance companies concentrated on selling stocks that had high liquidity and were issued by companies that ful-filled the conditions above, and as a result, their stock portfolio ended up consisting mostly of companies with high risks (Miyajima and Nitta, 2011: Tables 2-4).
(3) Foreign institutional investors were the most active in purchasing the stocks sold through dissolved cross-shareholdings. Table 2 shows that the ownership ratio of foreign in-stitutional investors was 5% or lower in the 1980s, but gradually increased during the 1990s, and reached 7.1% in March 1997. This hike was driven by the expansion of pension funds in the U.S. and Europe, as well as rising investments in the Japanese market by U.S. and U.K. institutional investors on the back of increasing oil money in the Middle East (Shirota, 2002).10 The ownership ratio of foreign institutional investors leveled out during the late 1990s, when the financial crisis occurred, but jumped again from fiscal 2002, and during the four years up until fiscal 2006 their ownership ratio (simple average) increased 8.1%.
The second largest group to purchase stocks sold through dissolved cross-shareholdings was domestic institutional investors who procured funds from pension funds. This was
368 T Hoda, H Miyajima / Public Policy Review
369
mainly owing to deregulations in the realm of pension management, as well as institutional investors gearing up stock-based pension managements. In December 1997, the 5.3.3.2 Reg-ulation pertaining to asset management of employees’ pension fund was abolished, allowing distribution of all funds at one’s own discretion and without restrictions. In addition, the pension scheme revision in 2000 caused a fundamental shift in the handling of accumulated funds for employees’ pensions and national pensions; from entrustment to the former Trust Fund Bureau, to market investments. Furthermore, the Government Pension Investment Fund (GPIF) was established in 2000, prompting the diffusion of managing funds through domestic stock investments. Such investments served as an alternative to foreign institution-al investors’ investments, albeit to a small extent, and the ownership ratio of domestic insti-tutional investors increased 3.2% between fiscal 1999 and 2002.
II-2. Diversification in Ownership Structure
It should be highlighted that the change in ownership structure during the 1990s and 2000s described above did not progress uniformly among listed companies. Figure 1 shows the transition in the ownership ratios of foreign institutional investors, domestic institutional investors, and banks and insurance companies based on a comparison between fiscal 1991, 1997, 2003, and 2006.
First, at the end of fiscal 1991, foreign institutional investors accounted for less than 3% of total ownership in the majority of companies, but many companies raised this ratio to 10% or more thereafter. By the end of fiscal 2003, the group with foreign institutional inves-tors accounting for 20% to 32% peaked slightly, and as of the end of fiscal 2006, this group represented the mode. Second, the ownership ratio of domestic institutional investors dis-persed as can be seen at the end of fiscal 2003, when the group with the lowest ratio of 0% to 9%, which was initially the mode, decreased, while the group with a ratio of 10% or more increased rapidly. Finally, for banks and insurance companies, the group with a ratio of 10% or more, which was initially the mode, decreased drastically by the end of fiscal 2003, and as of the end of fiscal 2006, the group with a ratio of less than 3% accounted for 45% of all listed companies. At the same time, the group with a ratio of 10% or more reached 12.2%. These results indicate that each institution type’s investment behavior is affected by some kind of preference or bias.
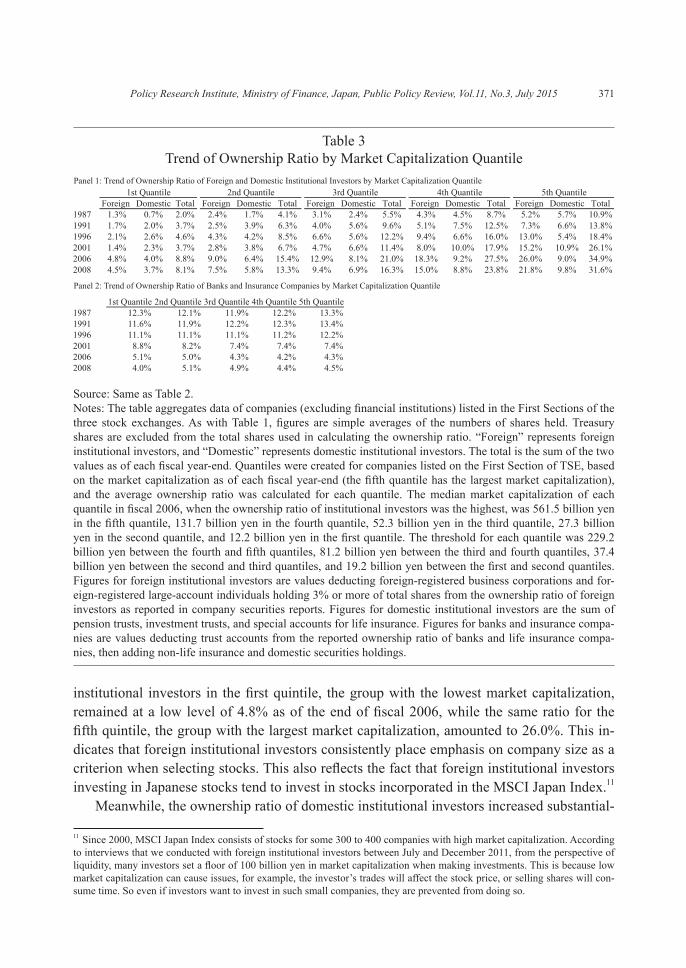
Generally, institutional investors are believed to have a strong preference for large com-panies. We therefore examined ownership by market capitalization, as shown in Table 3. According to Panel 1, the increase in ownership by foreign institutional investors from the early 1990s occurred mainly in the group with high market capitalization (the fourth and fifth quintiles), and this trend continued through the 2000s. The ownership ratio of foreign 10 For example, according to Jacoby (2009), CalPERS (California Public Employees’ Retirement System), the largest public pension in the U.S., showed increasing interest in foreign investments from the early 1990s, focusing on Japan alongside the U.K. as investment markets. In 1993, the ratio of foreign stocks incorporating Japanese stocks reached 45%. This caused 300 companies to exercise dissenting votes at the shareholder’s meeting that same year.
Policy Research Institute, Ministry of Finance, Japan, Public Policy Review, Vol.11, No.3, July 2015
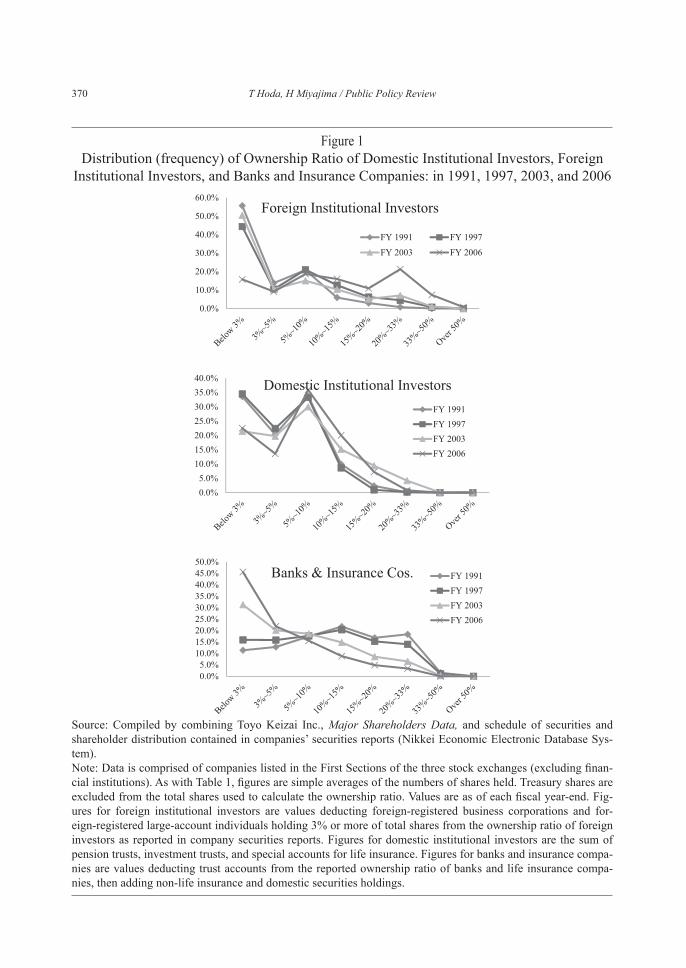
Figure 1Distribution (frequency) of Ownership Ratio of Domestic Institutional Investors, Foreign
Institutional Investors, and Banks and Insurance Companies: in 1991, 1997, 2003, and 2006
Source: Compiled by combining Toyo Keizai Inc., Major Shareholders Data, and schedule of securities and shareholder distribution contained in companies’ securities reports (Nikkei Economic Electronic Database Sys-tem). Note: Data is comprised of companies listed in the First Sections of the three stock exchanges (excluding finan-cial institutions). As with Table 1, figures are simple averages of the numbers of shares held. Treasury shares are excluded from the total shares used to calculate the ownership ratio. Values are as of each fiscal year-end. Fig-ures for foreign institutional investors are values deducting foreign-registered business corporations and for-eign-registered large-account individuals holding 3% or more of total shares from the ownership ratio of foreign investors as reported in company securities reports. Figures for domestic institutional investors are the sum of pension trusts, investment trusts, and special accounts for life insurance. Figures for banks and insurance compa-nies are values deducting trust accounts from the reported ownership ratio of banks and life insurance compa-nies, then adding non-life insurance and domestic securities holdings.
370 T Hoda, H Miyajima / Public Policy Review
371
institutional investors in the first quintile, the group with the lowest market capitalization, remained at a low level of 4.8% as of the end of fiscal 2006, while the same ratio for the fifth quintile, the group with the largest market capitalization, amounted to 26.0%. This in-dicates that foreign institutional investors consistently place emphasis on company size as a criterion when selecting stocks. This also reflects the fact that foreign institutional investors investing in Japanese stocks tend to invest in stocks incorporated in the MSCI Japan Index.11
Meanwhile, the ownership ratio of domestic institutional investors increased substantial-
Table 3Trend of Ownership Ratio by Market Capitalization Quantile
Source: Same as Table 2.Notes: The table aggregates data of companies (excluding financial institutions) listed in the First Sections of the three stock exchanges. As with Table 1, figures are simple averages of the numbers of shares held. Treasury shares are excluded from the total shares used in calculating the ownership ratio. “Foreign” represents foreign institutional investors, and “Domestic” represents domestic institutional investors. The total is the sum of the two values as of each fiscal year-end. Quantiles were created for companies listed on the First Section of TSE, based on the market capitalization as of each fiscal year-end (the fifth quantile has the largest market capitalization), and the average ownership ratio was calculated for each quantile. The median market capitalization of each quantile in fiscal 2006, when the ownership ratio of institutional investors was the highest, was 561.5 billion yen in the fifth quantile, 131.7 billion yen in the fourth quantile, 52.3 billion yen in the third quantile, 27.3 billion yen in the second quantile, and 12.2 billion yen in the first quantile. The threshold for each quantile was 229.2 billion yen between the fourth and fifth quantiles, 81.2 billion yen between the third and fourth quantiles, 37.4 billion yen between the second and third quantiles, and 19.2 billion yen between the first and second quantiles. Figures for foreign institutional investors are values deducting foreign-registered business corporations and for-eign-registered large-account individuals holding 3% or more of total shares from the ownership ratio of foreign investors as reported in company securities reports. Figures for domestic institutional investors are the sum of pension trusts, investment trusts, and special accounts for life insurance. Figures for banks and insurance compa-nies are values deducting trust accounts from the reported ownership ratio of banks and life insurance compa-nies, then adding non-life insurance and domestic securities holdings.
11 Since 2000, MSCI Japan Index consists of stocks for some 300 to 400 companies with high market capitalization. According to interviews that we conducted with foreign institutional investors between July and December 2011, from the perspective of liquidity, many investors set a floor of 100 billion yen in market capitalization when making investments. This is because low market capitalization can cause issues, for example, the investor’s trades will affect the stock price, or selling shares will con-sume time. So even if investors want to invest in such small companies, they are prevented from doing so.
Policy Research Institute, Ministry of Finance, Japan, Public Policy Review, Vol.11, No.3, July 2015
ly in companies belonging to the fourth and fifth quintiles around 2000. The aforementioned pension entrustment business initially expanded with a focus on large companies. However, from the late 2000s, their ownership increased in small- and medium-sized companies (the first and second quintile), and decreased in the fourth and fifth quintile. As a result, the ratio gap contracted between companies of different sizes by the end of fiscal 2008.
Finally, let us look at the trend in the ownership ratio of banks and insurance companies by business size during the same period (Panel 2). The decline in ratio for the fourth and fifth quintile was relatively sharp between the end of fiscal 1996 and 2006, when cross-shareholdings dissolved. This trend suggests that during the time when cross-share-holdings were dissolved, banks and insurance companies prioritized selling stocks of com-panies with high liquidity and market capitalization (stocks that were easy to sell, or that had relatively low effects on the company’s stock prices even if they were sold). From the end of fiscal 2006, when sales of stocks by banks and insurance companies leveled out, the ownership ratio of banks and insurance companies bottomed out in large companies, while the same ownership ratio in companies in the first and second quintile also decreased, and the gap in ratio between companies of different sizes contracted.
In the next section we will unveil the factors that guided such changes in the ownership ratios of banks and insurance companies, which were distinct between companies of differ-ent sizes.
III. Stock Selection by Institutional Investors, and Banks and Insurance Companies
III-1. Investment Criteria
In this paper, we are mainly concerned with whether corporate governance in Japan was affected by the drastic change in ownership structure, which was played out differently among companies of different sizes during the 1990s and 2000s. First, let us focus on pre-in-vestment monitoring (screening). We can deduce that institutional investors, whose owner-ship ratio increased drastically, elicit pre-investment governance effects if they: adequately evaluate companies’ business models; invest in stocks of companies that are expected to im-prove efficiency and achieve high growth; and sell stocks of companies that are not expect-ed to improve profitability or achieve growth. Unfortunately, there is no forthright method to assess the levels of such pre-investment monitoring. We therefore examine this issue by looking at the stock preference of each shareholder type.
Institutional Investors’ Bias and the Prudent Man Rule
Two criteria determine the stock selection of institutional investors, who aim to maxi-mize return on investment while also conforming to their duty of diligence: a quantitative criterion based on stock price valuation, and a qualitative criterion such as the manage-ment’s initiatives in corporate governance. As for the former quantitative criterion, institu-
372 T Hoda, H Miyajima / Public Policy Review
373
tional investors do not necessarily share a uniform criterion for valuation. For example, even with basic indices such as PER (Price Earnings Ratio) and PBR (Price Book-value Ratio; or its reciprocal Book to Market Ratio), it cannot unanimously be determined whether a higher or lower PER and PBR means that pre-investment monitoring is adequate. Meanwhile, em-pirical analysis shows that there are several views on what kind of stocks institutional inves-tors prefer. For example, based on a study of Swedish companies, Dahlquist and Robertsson (2001) suggested that institutional investors prefer stocks with high market liquidity, offered by companies that are large, and have low dividend payments and high cash positions. They called this institutional investors’ bias. Based on an analysis of U.S. companies between 1980 and 1996, Gompers and Metrick (2001) revealed that institutional investors preferred large-cap stocks with high liquidity and low shareholder returns for the previous year. These features were different from those preferred by other types of investors.12 The institutional investors that we interviewed mentioned that they more or less agreed to the above state-ments.
At the same time, institutional investors are entrusted with funds from an ultimate bene-ficiary, and are thus required to make investments conforming to fiduciary responsibilities. According to previous research, institutional investors therefore tend to prefer high-quality stocks, i.e., stock of companies with high profitability, stability and financial positions. Del Guercio (1996) titled this fiduciary motives as prudence, and suggested that institutional in-vestors, who are required to take the utmost caution as fiduciaries, prefer stocks that are low-risk and can definitely yield profits.
Preference for Strong Governance
Institutional investors tend to attach weight to the investee’s level of corporate gover-nance as a qualitative criterion. To meet their fiduciary responsibilities, domestic institution-al investors established guidelines for exercising voting rights among others around the be-ginning of the 2000s, clarifying that they will actively invest in companies that disclose sufficient information and assign outside directors. Previous empirical research, for exam-ple, Ferreira and Matos (2008) also pointed out that institutional investors prefer stocks of companies not only that are large yet have adequate governance schemes in place (compa-nies with dispersed ownership and that take progressive measures in information disclo-sure).13 Also, Leuz et al. (2009) suggested that foreign investors who face restrictions in their investments due to asymmetry of information and higher monitoring costs tend to
12 The intention of their research was to answer a question: Why did small-cap stock premium (i.e., small-cap stocks yielding a higher return on investment than large-cap stocks) vanish from the U.S. market? They discovered that one of the factors was because the ownership ratio of institutional investors accounted for an increasingly larger portion of the stock market, and boosted return on investment for large-cap stocks.13 More specifically, the study analyzed the role that institutional investors played in monitoring corporate management based on data of 27 countries (for the six years from January 2000 through December 2005 inclusive) against the backdrop of the in-creasing volume of assets managed by institutional investors worldwide. As of the time of the analysis, it was estimated that institutional investors held close to 40% of the total global market capitalization, and half the floating stocks.
Policy Research Institute, Ministry of Finance, Japan, Public Policy Review, Vol.11, No.3, July 2015
avoid investing in companies that do not disclose enough information, or that pose gover-nance-related risks. Giannetti and Simonov (2006) stated that outsiders (domestic and for-eign institutional investors and individual investors) whose only objective is to maximize returns on investment prefer to invest in companies with adequate governance schemes in place.14
Asymmetry of Information and Home-Bias
Even under the premise that foreign institutional investors are motivated by the principle of maximizing return on investments and by fiduciary responsibilities as independent par-ties, this does not ensure that they will fulfill the role of (pre-investment) monitoring. The most profound restriction that foreign institutional investors face is asymmetry of informa-tion; i.e., they cannot obtain sufficient information about Japanese companies. Foreign insti-tutional investors that cannot fully assess the profitability or risks of Japanese companies will end up selecting stocks of companies that are well known among the ultimate fund pro-vider (public pensions and/or investors), based on such indices as whether they have a high overseas sales ratio or issue ADRs. However, foreign institutional investors may be prevent-ed from fulfilling their roles in adequate pre-investment monitoring if they rely heavily on such formal indices to assess the quality of corporate governance mentioned above, since the influence of outside directors depends on each company’s business characteristics and is not necessarily valid in all cases.
Much previous research has been conducted concerning such home bias of foreign in-vestors. For example, Dahlquist and Robertsson (2001) indicated the presence of such bias based on data of Swedish companies. Also, Ahearne et al. (2004) analyzed U.S. investors’ shareholding of offshore stocks, and concluded that one of the factors preventing them from holding offshore stocks is the information cost required in dealing with the asymmetry of information.15 It has been pointed out that home bias by foreign institutional investors also applies to Japanese stocks. Based on research for 1975 through 1991, Kang and Stulz (1997) reported that the ownership ratio of foreign investors is high in Japanese companies that have high liquidity (turnover ratio) and are listed on ADR. Based on data from 1985 to 1998, Hiraki et al. (2003) claimed that foreign institutional investors investing in Japanese stocks had a strong tendency to invest in companies with high export ratios, and that their stock selections were impacted substantially by levels of recognition and familiarity. Also, based on analysis focusing on 1990 through 2008, Miyajima and Nitta (2011) confirmed that foreign institutional investors valued company size and overseas sales ratio when selecting 14 Aggarwal et al. (2005) analyzed investments in developing countries by institutional investors managing U.S. investment trusts, and reported that they favored countries with established accounting standards, shareholder ownership, and laws and regulations, while also favoring companies that conduct transparent disclosure of accounting information, and issue an ADR. The study claims that establishing a robust governance scheme at both the company and country level will contribute to at-tracting more foreign investors.15 Other research, e.g., Merton (1987), French and Poterba (1991), and Brennan and Cao (1997) also confirmed the presence of home bias.
374 T Hoda, H Miyajima / Public Policy Review
375
stocks, and that in that sense they were inclined toward home bias.What previous research targeting Japan did not fully take note of was the impact that the
MSCI Japan Index had on determining investment scope. According to an interview with foreign institutional investors, as a general rule, funds that carry out offshore investment in-structions only invest in stocks that are incorporated in the MSCI Japan Index.16 It is highly likely that an increase in the ratio of foreign institutional investors is confined to stocks in-corporated in the MSCI Japan Index; therefore, it is necessary to find out to what extent this factor determines the stock selection of foreign institutional investors.
Banks and Insurance Companies: Smart vs. Grey Investors
While foreign institutional investors are most likely to confront issues in asymmetry of information, domestic institutional investors are immune from such issues. Domestic insti-tutional investors can select stocks of companies that have high potential for growth, regard-less of whether or not the company is listed in overseas stock markets, or is widely and well known, e.g., its stocks are a constituent of the MSCI Japan Index. If domestic institutional investors are free from home bias factors when selecting stocks, it implies that they have strong smart investor features. However, if domestic banks and insurance companies are bound by their business relationships (e.g., loan contracts, insurance contracts, keiretsu rela-tionship) when selecting stocks as earlier mentioned, they still maintain strong grey investor features. It is necessary to analyze which feature is more pronounced.
III-2. Estimation Model
In this section we analyze the determinant of ownership ratio by shareholder type (for-eign institutional investors, domestic institutional investors, and banks and insurance com-panies). The analysis targets non-financial business corporations that are listed in the First Section of the three stock markets, and whose fiscal year ends in March. The analysis focus-es on the 19 fiscal years between fiscal 1990 (fiscal year ending March 31, 1991) and 2008 (fiscal year ending March 31, 2009) inclusive. We used Quick Astra Manager to extract companies’ incomes, financial data, and stock price-related data.
The model below was used as an estimation model, drawing from Gompers and Metrick (2001), Ferreira and Matos (2008), and Miyajima and Nitta (2011). 16 The breakdown of foreign investors’ ownership cannot be determined explicitly; however, asset managements that are com-pletely passive are few, and the breakdown consists of (1) funds centered on MSCI Japan Index stocks (representing some 300 to 400 stocks since 2000) that carry out investment instructions in Japan and offshore; and (2) funds and entrustments of asset management set up as Japanese stocks by overseas subsidiaries of Japanese Companies. (1) can be categorized into (1)-A, pas-sive asset management linked to the weight of market capitalization for stocks incorporated in MSCI to the extent possible; and (1)-B, proactive asset management that selects some 50 to 100 stocks out of the MSCI stocks. Meanwhile, (2) consists of funds and entrustments of asset management for foreign pensions or large account customers, and there is a floor to the market capitalization and liquidity of the investee. Chronologically, (1)-A was initially mainstream; (1)-B and (2) increased around 1999, when foreign investors’ investments were on an upward trend; and (1) and (2) increased simultaneously from 2003 on-wards in line with the rise in foreign investors’ investments.
Policy Research Institute, Ministry of Finance, Japan, Public Policy Review, Vol.11, No.3, July 2015
SHjit = F (INSBit, QSit, GOVit, HBit, GOVit, CONTit, YEAR) (1)
The dependent variable SHjit is the ownership ratio of company i belonging to sharehold-er type j, and is adjusted by deducting the ratio of floating shares.17 Independent variable IN-SBit is a variable indicating the basic preference of institutional investors (institutional inves-tors’ bias), and tests whether institutional investors tend to prefer large companies with high liquidity.18 The logarithmic value of market capitalization and the trading turnover ratio are used respectively as proxy variables. The coefficients of each variable are expected to be positive against the ownership ratio of institutional investors. Also, following previous re-search, we used the PBR. Coefficients should be positive if investors prefer value stocks.
QSit is a variable indicating the degree to which each investor is conscious of fiduciary responsibilities. According to Del Guercio (1996), institutions with strong fiduciary motives as prudence prefer companies of high quality in terms of profitability, stability, and financial soundness among other aspects (high-quality stock). In this paper, we used stock price vola-tility, dividend yield, ROA, investing opportunity (growth rate of net sales for the past two years), debt ratio and the ADR dummy (U.S. stocks that issue ADR) as the proxy variable. If institutional investors perform their fiduciary responsibilities with the utmost precautions, it is expected that they will prefer stocks with low risks that ensure definite returns. Hence, stock price volatility and debt ratio are expected to be negative, while ROA, investing op-portunity, dividend yield and the ADR dummy are expected to be positive. HBit is a variable that captures home bias factors. More specifically, we used companies’ overseas sales ratio. Kang and Stulz (1997), Hiraki, Ito and Kuroki (2003), and Miyajima and Nitta (2011), re-ported the presence of home bias in Japan as well, and therefore, the overseas sales ratio is expected to be positive. In addition, as mentioned earlier, according to interviews with for-eign institutional investors, the MSCI Japan Index is extremely important in determining in-vestment scope, so its impact is expected to be large. We therefore applied a dummy vari-able that is a value of one when the stock is incorporated in the MSCI Japan Index.19
GOVit is a variable that represents corporate governance. We used an objective index; namely, the number of executive officers, and the ratio of outside directors excluding those affiliated to banks or the parent company.20 If both domestic and foreign institutional inves-
17 Gompers and Metrick (2001), Ferreira and Matos (2008), and Miyajima and Nitta (2011) all used the ownership ratio of in-stitutional investors as the dependent variable, and incorporated the ratio of floating shares as the independent variable. Japan is characterized by the presence of cross-shareholdings, and the ratio of floating shares is expected to affect the ownership ratio of cross-shareholding by institutional investors or banks and insurance companies to a certain degree. Therefore, rather than using the ownership ratio of each shareholder type, we believe that it is more adequate to base the analysis on ownership ratio adjusted by the floating share ratio. In order to assure the liability of our results, we also conducted the analysis using the own-ership ratio not adjusted by the floating share ratio, but the results were roughly the same. Toshio Serita (Aoyama Gakuin Uni-versity) pointed out the endogeneity of the ratio of floating shares to us.18 Gompers and Metrick (2001). This was also confirmed through interviews with domestic and foreign institutional investors conducted by the authors.19 To the authors’ knowledge, there is no previous analysis on foreign institutional investors’ home bias with respect to Japan that considers the element of MSCI Japan Index stocks.20 The above-mentioned ADR dummy, which is included in fiduciary responsibility, can also be considered an objective vari-able for corporate governance.
376 T Hoda, H Miyajima / Public Policy Review
377
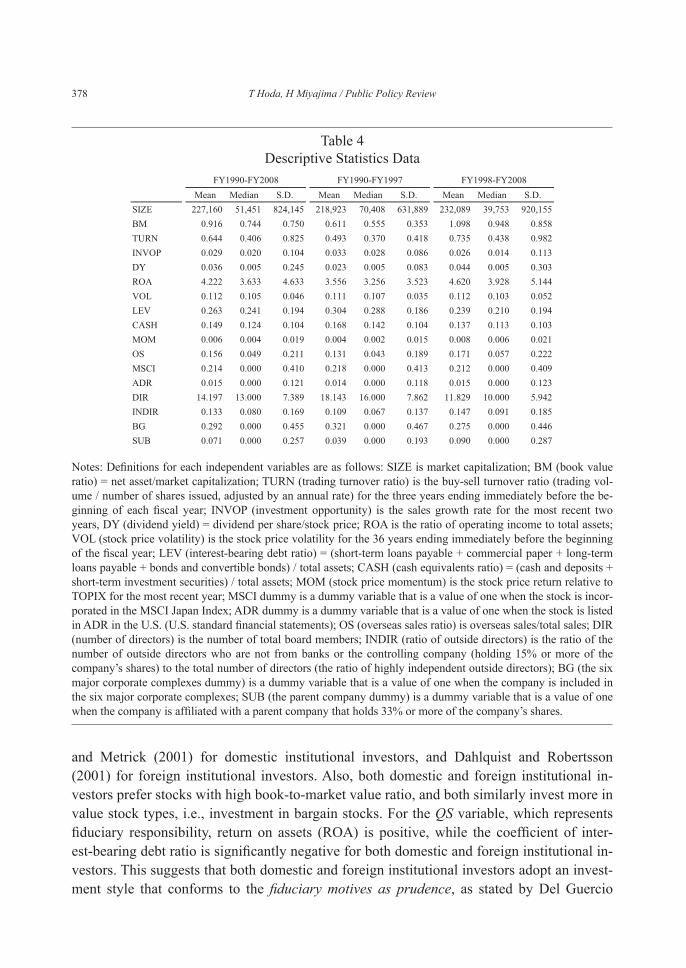
tors prefer a small board, the coefficient of the number of directors should be negative. If in-vestors prefer a heavier presence of highly independent outside directors, the ratio of outside directors excluding those from banks and the parent company should be positive. In addi-tion, in order to test whether stock selections are affected by potential expropriation of mi-nority shareholders by the parent company, we used a parent company dummy for compa-nies with a sole investor accounting for 33% or more in ownership ratio. We also used a dummy for the six major corporate complexes to test whether keiretsu relationships affect stock selections by domestic and foreign institutional investors. Table 4 summarizes all de-scriptive statistics of the variables above.
Furthermore, as in previous research, we used the stock price trend as the control vari-able CONTit for this estimation model. Also, to control any industry-specific effects, we used an industry dummy based on the 33 sectors defined by TSE.
Estimations were calculated based on the pooled estimation, using the ownership ratio of each investor as the dependent variable, as well as the Fama and MacBeth (1973) meth-od. The latter is a method that conducts a cross-sectional regression analysis for each year, and calculates the chronological average of the coefficients. The advantage of this method is that it can capture the historical change in factors contributing to stock selections during the estimation period, while also covering the issue of cross-sectional correlations.
III-3. Results
The bias of institutional investors
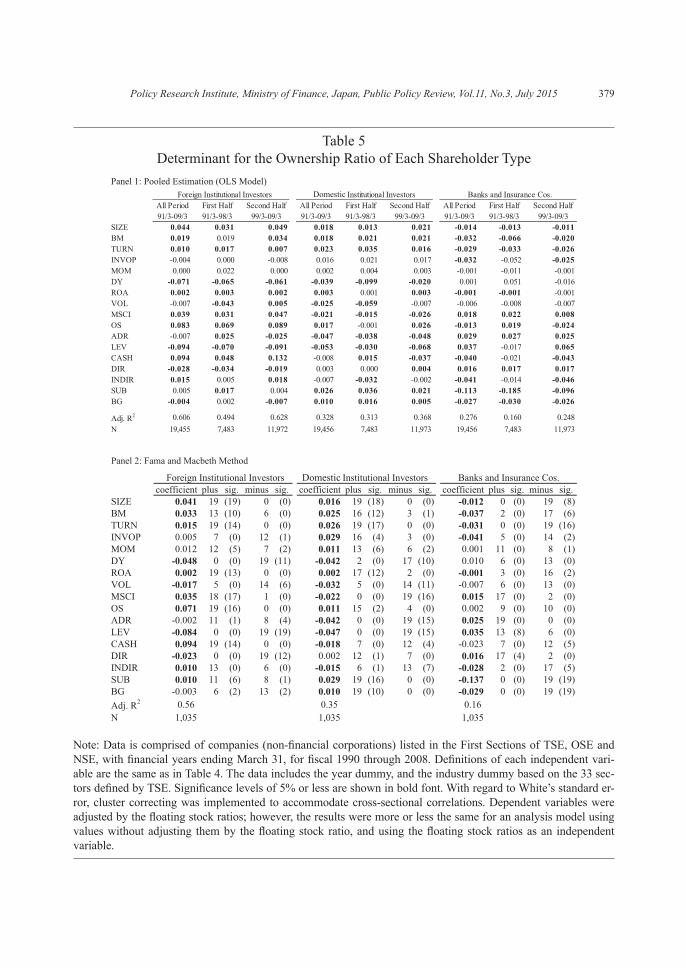
Panels 1 and 2 of Table 5 present the results of the analysis.21 Panel 1 is a pooled estima-tion (year dummy) covering the entire period between fiscal 1990 and 2008. We also con-ducted an analysis splitting the period in two: fiscal 1990 through 1997 (hereinafter referred to as “first half”) and 1998 to 2008 (hereinafter referred to as “second half”) in order to test whether the stock preference of institutional investors changed around the time of the bank-ing crisis, which was when ownership structure changed drastically. Panel 2 summarizes analysis results based on the method of Fama and MacBeth22 for the entire period in which the analysis was conducted. Results of Panels 1 and 2 are mostly consistent, and below, we mainly explain the results in Panel 1.
First, let us examine the results for the entire period. From the INSB variable represent-ing institutional investors’ behavior, we can confirm that both domestic and foreign institu-tional investors invest in stocks of companies that are large (in terms of market capitaliza-tion) and with high liquidity (turnover ratio). This corresponds with the findings of Gompers
21 Analysis results were more or less the same when using the ownership ratio of foreign institutional investors, domestic insti-tutional investors, and banks and insurance companies without adjusting the dependent variable with the ratio of floating stock.22 Although an explanation of results is omitted, we also conducted an analysis by separating the period into the first and sec-ond half for Panel 2 as with Panel 1, and the results were very similar. On request, we can provide the results for each of the 19 fiscal years as well as for the first and second half.
Policy Research Institute, Ministry of Finance, Japan, Public Policy Review, Vol.11, No.3, July 2015
and Metrick (2001) for domestic institutional investors, and Dahlquist and Robertsson (2001) for foreign institutional investors. Also, both domestic and foreign institutional in-vestors prefer stocks with high book-to-market value ratio, and both similarly invest more in value stock types, i.e., investment in bargain stocks. For the QS variable, which represents fiduciary responsibility, return on assets (ROA) is positive, while the coefficient of inter-est-bearing debt ratio is significantly negative for both domestic and foreign institutional in-vestors. This suggests that both domestic and foreign institutional investors adopt an invest-ment style that conforms to the fiduciary motives as prudence, as stated by Del Guercio
Table 4Descriptive Statistics Data
Notes: Definitions for each independent variables are as follows: SIZE is market capitalization; BM (book value ratio) = net asset/market capitalization; TURN (trading turnover ratio) is the buy-sell turnover ratio (trading vol-ume / number of shares issued, adjusted by an annual rate) for the three years ending immediately before the be-ginning of each fiscal year; INVOP (investment opportunity) is the sales growth rate for the most recent two years, DY (dividend yield) = dividend per share/stock price; ROA is the ratio of operating income to total assets; VOL (stock price volatility) is the stock price volatility for the 36 years ending immediately before the beginning of the fiscal year; LEV (interest-bearing debt ratio) = (short-term loans payable + commercial paper + long-term loans payable + bonds and convertible bonds) / total assets; CASH (cash equivalents ratio) = (cash and deposits + short-term investment securities) / total assets; MOM (stock price momentum) is the stock price return relative to TOPIX for the most recent year; MSCI dummy is a dummy variable that is a value of one when the stock is incor-porated in the MSCI Japan Index; ADR dummy is a dummy variable that is a value of one when the stock is listed in ADR in the U.S. (U.S. standard financial statements); OS (overseas sales ratio) is overseas sales/total sales; DIR (number of directors) is the number of total board members; INDIR (ratio of outside directors) is the ratio of the number of outside directors who are not from banks or the controlling company (holding 15% or more of the company’s shares) to the total number of directors (the ratio of highly independent outside directors); BG (the six major corporate complexes dummy) is a dummy variable that is a value of one when the company is included in the six major corporate complexes; SUB (the parent company dummy) is a dummy variable that is a value of one when the company is affiliated with a parent company that holds 33% or more of the company’s shares.
378 T Hoda, H Miyajima / Public Policy Review
379
Panel 1: Pooled Estimation (OLS Model)
Table 5Determinant for the Ownership Ratio of Each Shareholder Type
Note: Data is comprised of companies (non-financial corporations) listed in the First Sections of TSE, OSE and NSE, with financial years ending March 31, for fiscal 1990 through 2008. Definitions of each independent vari-able are the same as in Table 4. The data includes the year dummy, and the industry dummy based on the 33 sec-tors defined by TSE. Significance levels of 5% or less are shown in bold font. With regard to White’s standard er-ror, cluster correcting was implemented to accommodate cross-sectional correlations. Dependent variables were adjusted by the floating stock ratios; however, the results were more or less the same for an analysis model using values without adjusting them by the floating stock ratio, and using the floating stock ratios as an independent variable.
Domestic
Panel 2: Fama and Macbeth Method
Domestic
Policy Research Institute, Ministry of Finance, Japan, Public Policy Review, Vol.11, No.3, July 2015
(1996), in the sense that they prefer companies of high quality in terms of profitability, sta-bility and financial soundness (high-quality stock). On the flipside, the coefficient of the div-idend yield is significantly negative, opposing the view of fiduciary motives as prudence. However, it is known that there is a trade-off between investment opportunities and divide yield; for example, Del Guercio (1996) and Dahlquist and Robertsson (2001) found that the coefficient of the dividend yield is negative, so the variable itself may not be a reliable proxy variable representing strong fiduciary motives as prudence. What is important is that in terms of fiduciary motives as prudence, the gap is minimal between domestic and foreign institutional investors.
In contrast, the aforementioned INS and QS variables show that financial institutions’ in-vestment criteria differs largely from that of domestic and foreign institutional investors. First, banks and insurance companies tend to hold stocks of smaller-sized companies with lower liquidity. In addition, the fact that both investment opportunity and ROA variables are negative indicates that they hold stocks with lower growth potential and profitability. They also continue to hold stocks with high debt ratio. Furthermore, they invest in stocks with low book-to-market value ratio, and considering that such investee’s profitability is not so high, they seem to invest in slightly over-priced stocks. All of these preferences differ large-ly from the investment style of institutional investors whose objective is to maximize profit-ability.
The home bias
Next, the home bias factor HB for foreign institutional investors is high in the overseas sales ratio. This is in line with prior research including Miyajima and Nitta (2011). The weight of this factor is significant with the increase in overseas sales ratio by two standard deviations (42%) contributing to an increase of some 3.5% in the ownership ratio of foreign institutional investors. Also, while the ADR dummy for foreign institutional investors is not significant throughout the entire period, the MSCI dummy is significantly positive for the duration of the period. Moreover, the weight of the MSCI factor is heavy: when the stock is incorporated in the MSCI Japan index, the ownership ratio of foreign institutional investors is 4% higher on average under the condition that all other variables are fixed.
Interestingly, the coefficients of the MSCI dummy and ADR dummy are significantly negative in an analysis using the ownership ratio of domestic institutional investors as the dependent variable. This suggests that while foreign and domestic institutional investors share common investment features in that they value business size and turnover ratio, do-mestic institutional investors may intentionally be investing in stocks that are not incorpo-rated in MSCI nor listed on ADR. The estimation result that domestic investors have a larger investment scope (lower floor for market capitalization, and not restricted to formal criteria such as MSCI and ADR) than foreign institutional investors is consistent with the under-standing that domestic institutional investors have an advantage over foreign institutional investors in acquiring information.23
380 T Hoda, H Miyajima / Public Policy Review
381
Preference on Governance Arrangement
As for the corporate governance factor GOV, the coefficient for number of directors is negative, while the coefficient for the ratio of outside directors is significantly positive in an estimation that uses the ownership ratio of foreign institutional investors as a dependent variable. This implies that foreign institutional investors have a strong preference for stocks of companies with small boards, and the presence of highly independent outside directors. At the same time, recent empirical research suggests that the higher the ownership ratio of foreign institutional investors is, the smaller the size of the board and the higher the ratio of outside director assignment is;24 therefore, we can assume that foreign institutional investors bolster reforms in a company’s director structure.
In contrast, domestic institutional investors do not seem to have a preference regarding the board size or the presence of independent directors. This result, however, cannot neces-sarily be attributed to restrictions in their stock selection due to business relationships. While foreign institutional investors confront issues in asymmetry of information and de-pend on objective and formal criteria, domestic institutional investors can access sufficient information, and may be more strategic in their selections. It is worth noting that in estima-tions of the ownership ratio of banks and insurance companies, the coefficients of the parent company dummy and six major corporate complexes dummy were significantly negative; but this is probably the result of unwinding of cross-shareholdings after the bubble burst, or the result of banks and insurance companies preferentially selling stocks that were easy to sell off in order to realize incomes. Also, in the estimations for banks and insurance compa-nies, the coefficient of the number of directors is significantly positive, while the coefficient of ratio of outside directors is significantly negative. This implies that banks and insurance companies are systematically restricting their investments in companies with large boards or a high ratio of outside directors.
Gap between Different Periods
Next, we take a closer look at the difference between the first and second half. First, with regard to the home bias of foreign institutional investors, there is no difference in terms of the significance level of business size, overseas sales ratio, or MSCI dummy variables be-tween the two periods. However, the coefficients are slightly higher for the second half. For example, the effect of the MSCI dummy is 3.1% in the 1990s, and increases to 4.6% in the 2000s. Meanwhile, the coefficient of ADR is significantly positive for the first half, but turns negative for the second. This implies that the overweight of foreign institutional investors’ investments in ADR stocks dissolved in the 2000s.25
23 In an interview with domestic and foreign institutional investors, we obtained feedback to the effect that foreign institutional investors set higher floor market capitalization when considering investments compared to domestic institutional investors.24 Refer to Saito (2011), Miyajima and Ogawa (2012).
Policy Research Institute, Ministry of Finance, Japan, Public Policy Review, Vol.11, No.3, July 2015
Second, with regard to stock selection by domestic institutional investors, the difference between the two periods is relatively small. The coefficients indicate that the inclination to avoid stocks incorporated in MSCI and to select companies with a high overseas sales ratio and low debt ratio becomes prominent in the second half. What stands out is that the coeffi-cient of the cash equivalent ratio is positive for the first half, but negative for the second. This may be because domestic institutional investors preferred companies that did not re-serve excess cash during the second half. Also worth noting is that the coefficient of the six major corporate complexes dummy declined to approximately one third.
Similarly, for banks and insurance companies, not a lot of difference was detected be-tween the first and second half in that they consistently preferred small companies with low book-to-market value ratios and low trading turnover ratio. A notable feature is that the co-efficient of overseas sales ratio is 0.919 for the first half, but falls to -0.024 for the second, while the coefficient of the interest-bearing debt ratio is not significant for the first half, but climbs to 0.065 for the second. This implies that during the second half, institutional inves-tors preferred stocks that were traded more globally or had a low interest-bearing debt ratio, while banks and insurance companies were heavily inclined conversely toward stocks that were domestically traded or had a high interest-bearing debt ratio.
In summary, the follow three findings came to light from the investment criteria analysis for each shareholder type. First, domestic and foreign institutional investors shared common ground in that they selected stocks of companies that were not only large, with high stock li-quidity, but that also maintained high quality in terms of profitability, stability and financial soundness (high-quality stock). In contrast, banks and insurance companies preferred to hold stocks of companies that were not only smaller, with lower stock liquidity, but that were also inferior in terms of profitability, stability, and financial soundness. Second, the analysis indicated that foreign institutional investors still maintain a strong home bias. Third, with regard to the investee’s efforts in implementing adequate governance, foreign institutional investors were positively affected while domestic institutional investors were neutral.
IV. Monitoring Effect of Institutional Investor’s Shareholding
IV-1. Impact on Firm Value
In this section, we consider whether increased shareholding by institutional investors contributes to effective monitoring. Regardless of whether the increase in institutional in-vestor’s ownership is attributed to institutional investors’ bias or home bias, if they ade-quately monitor the investee by way of voices and exits, their increase should have a posi-tive impact on firm value, as pointed out by Ferreira and Matos (2008). As our estimation
25 The result that the ADR dummy is significantly positive for the first half is consistent with the results of Kang and Stulz (1997).
382 T Hoda, H Miyajima / Public Policy Review
383
model, we used the standard model below which regresses firm value on fundamental fac-tors defining such firm value as well as ownership structure.
Qit =F (SHijt , Qij, Xit , YEAR) (4)
The dependent variable Qit is Tobin’s Q, which represents firm value. As with previous research, Q is calculated by adding the market capitalization to the book value of total as-sets, then deducting the book value of capital stock, and dividing that by total assets. As in-dependent variables, we used the industrial median of Tobin’s Q, business size (logarithmic value of total assets), debt ratio, and investment opportunity. This estimation focuses on whether the ownership ratio SHijt of each investor j, controlled by the above variables, has a significant effect on firm value,26 Since this analysis focuses on the monitoring effect on management through the voting rights ratio, we did not adjust SHijt with the floating stock ratio as we did in the earlier analyses, and instead used actual values. We added a year dum-my to formula (4) above to cover the volatility in macro environment for each year. As with the previous analyses, the sample consists of non-financial business corporations listed on the First Section of TSE, covering 19 fiscal years from 1990 to 2008. Also, as confirmed in Sections 2 and 3, the ownership structure of Japanese companies transformed drastically af-ter the 1997 banking crisis, and with that, investment behavior of each shareholder type also changed. Accordingly, we conducted estimation for the entire period, as well as two sub-pe-riods: the first half, which covers fiscal 1990 through 1997, and the second half, which cov-ers fiscal 1998 through 2008.
The estimation used median regression, as with Ferreira and Matos (2008), to cover the measurement error of Tobin’s Q. Table 6 is a summary of the results.27
Table 6 indicates that firm value is positively affected by ownership of foreign as well as domestic institutional investors. This relation is present throughout most of the entire period as well as during the first and second halves, suggesting that both foreign and domestic in-stitutional investors fulfill monitoring roles and thereby contribute to raising corporate val-ue. Interestingly, when examining the two sub-periods, the coefficient of domestic institu-tional investors is significantly negative for the first half, but turns significantly positive for the second half in a regression equation that inserts the ownership ratio of shareholder type as the independent variable. This suggests that as with foreign institutional investors, do-mestic institutional investors started exercising monitoring roles and thereby contributed to higher firm value from the late 1990s, which coincides with the time they began to rigorous-ly assume fiduciary responsibilities.
Contrarily, the impact of shareholding by banks and insurance companies is mostly neg- 26 There have been many analyses on the effect that foreign institutional investors have on performance of listed companies in Japan (Iwatsubo and Tonogi, 2007; Miyajima and Nitta, 2011). However, to the knowledge of the authors, there is no research analyzing the effect of ownership ratio of domestic institutional investor, and banks and insurance companies.27 We also conducted an estimation based on the fixed-effect model for the panel data, as well as the least-square method using the logarithmic value of Q and -1/Q as explained variables, and confirmed that results are the same. Also, we used the industri-al median of Q as an independent variable; however, results were basically the same when replacing the dependent variable with the difference between the industrial median.
Policy Research Institute, Ministry of Finance, Japan, Public Policy Review, Vol.11, No.3, July 2015
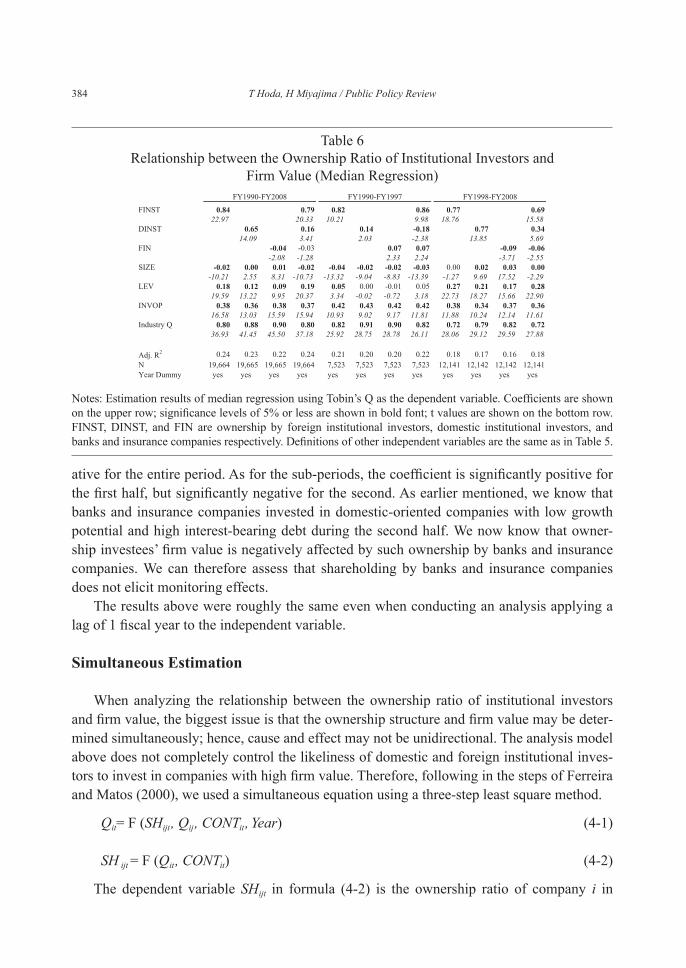
ative for the entire period. As for the sub-periods, the coefficient is significantly positive for the first half, but significantly negative for the second. As earlier mentioned, we know that banks and insurance companies invested in domestic-oriented companies with low growth potential and high interest-bearing debt during the second half. We now know that owner-ship investees’ firm value is negatively affected by such ownership by banks and insurance companies. We can therefore assess that shareholding by banks and insurance companies does not elicit monitoring effects.
The results above were roughly the same even when conducting an analysis applying a lag of 1 fiscal year to the independent variable.
Simultaneous Estimation
When analyzing the relationship between the ownership ratio of institutional investors and firm value, the biggest issue is that the ownership structure and firm value may be deter-mined simultaneously; hence, cause and effect may not be unidirectional. The analysis model above does not completely control the likeliness of domestic and foreign institutional inves-tors to invest in companies with high firm value. Therefore, following in the steps of Ferreira and Matos (2000), we used a simultaneous equation using a three-step least square method.
Qit= F (SHijt , Qij, CONTit, Year) (4-1)
SH ijt = F (Qit, CONTit) (4-2)
The dependent variable SHijt in formula (4-2) is the ownership ratio of company i in
Table 6Relationship between the Ownership Ratio of Institutional Investors and
Firm Value (Median Regression)
Notes: Estimation results of median regression using Tobin’s Q as the dependent variable. Coefficients are shown on the upper row; significance levels of 5% or less are shown in bold font; t values are shown on the bottom row. FINST, DINST, and FIN are ownership by foreign institutional investors, domestic institutional investors, and banks and insurance companies respectively. Definitions of other independent variables are the same as in Table 5.
384 T Hoda, H Miyajima / Public Policy Review
385
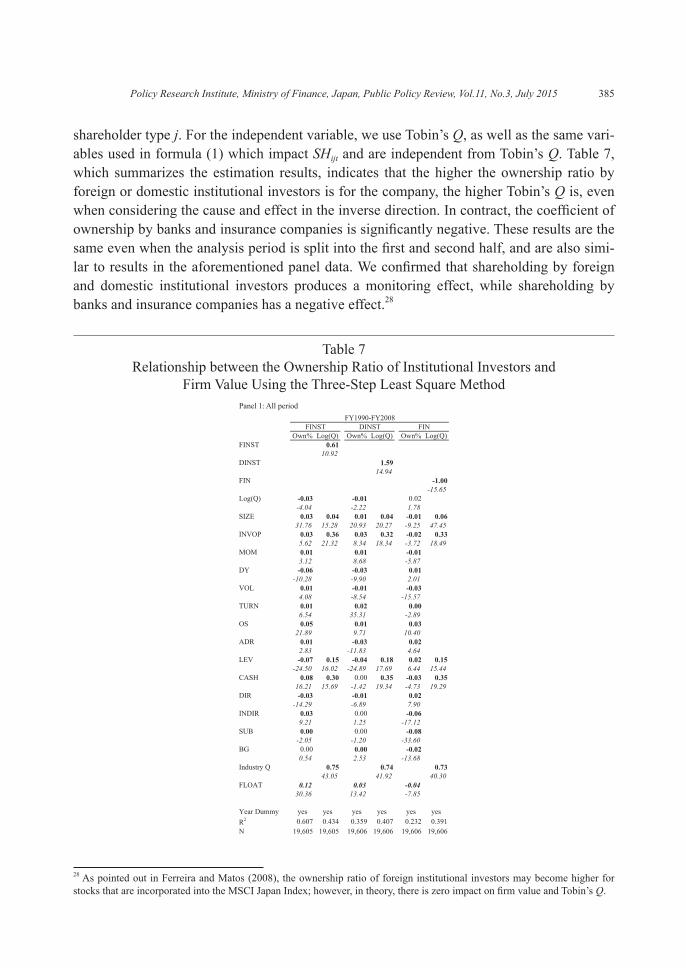
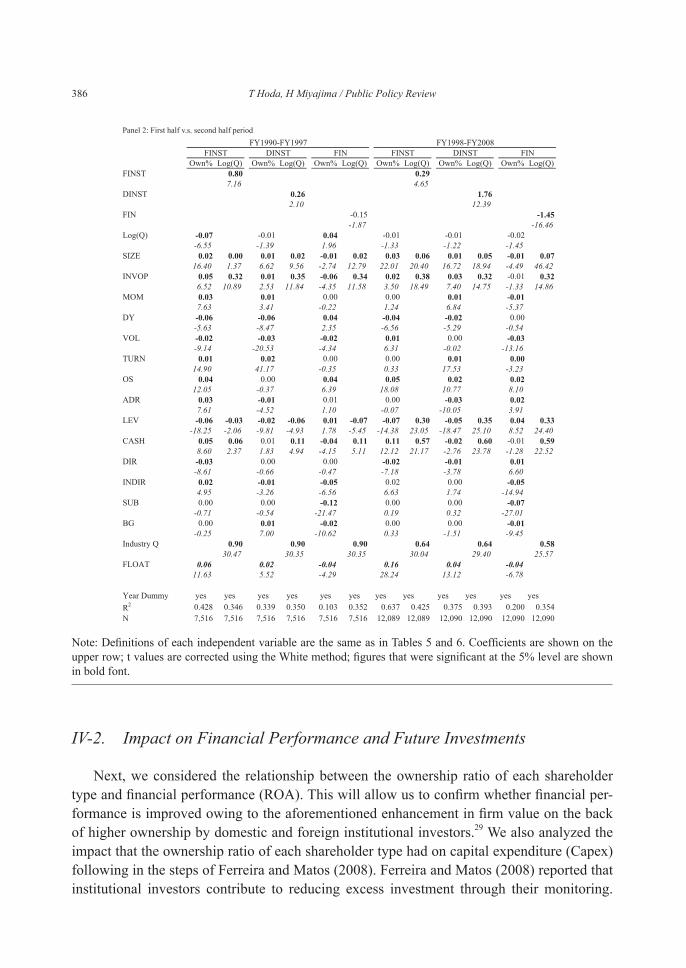
shareholder type j. For the independent variable, we use Tobin’s Q, as well as the same vari-ables used in formula (1) which impact SHijt and are independent from Tobin’s Q. Table 7, which summarizes the estimation results, indicates that the higher the ownership ratio by foreign or domestic institutional investors is for the company, the higher Tobin’s Q is, even when considering the cause and effect in the inverse direction. In contract, the coefficient of ownership by banks and insurance companies is significantly negative. These results are the same even when the analysis period is split into the first and second half, and are also simi-lar to results in the aforementioned panel data. We confirmed that shareholding by foreign and domestic institutional investors produces a monitoring effect, while shareholding by banks and insurance companies has a negative effect.28
Table 7Relationship between the Ownership Ratio of Institutional Investors and
Firm Value Using the Three-Step Least Square MethodPanel 1: All period
28 As pointed out in Ferreira and Matos (2008), the ownership ratio of foreign institutional investors may become higher for stocks that are incorporated into the MSCI Japan Index; however, in theory, there is zero impact on firm value and Tobin’s Q.
Policy Research Institute, Ministry of Finance, Japan, Public Policy Review, Vol.11, No.3, July 2015
IV-2. Impact on Financial Performance and Future Investments
Next, we considered the relationship between the ownership ratio of each shareholder type and financial performance (ROA). This will allow us to confirm whether financial per-formance is improved owing to the aforementioned enhancement in firm value on the back of higher ownership by domestic and foreign institutional investors.29 We also analyzed the impact that the ownership ratio of each shareholder type had on capital expenditure (Capex) following in the steps of Ferreira and Matos (2008). Ferreira and Matos (2008) reported that institutional investors contribute to reducing excess investment through their monitoring.
Note: Definitions of each independent variable are the same as in Tables 5 and 6. Coefficients are shown on the upper row; t values are corrected using the White method; figures that were significant at the 5% level are shown in bold font.
Panel 2: First half v.s. second half period
386 T Hoda, H Miyajima / Public Policy Review
387
We examined whether such relationships are also applicable in Japan.Panel A of Table 8 shows the results of an analysis using the aforementioned formula (4),
but applying ROA based on operating income in place of Tobin’s Q.30 The results were roughly in line with the analysis using Tobin’s Q.
The coefficient for the ownership ratio of foreign institutional investors is significantly positive, at approximately 1% for the entire period, as well as for the first and second halves. The coefficient of domestic institutional investors was significantly positive when including the coefficient solely to the regression equation. Also, the coefficient of domestic institution-al investors was negative for the first half, but turned significantly positive for the second half in a model simultaneously applying the ownership ratio of both foreign institutional in-vestors, and banks and insurance companies. As examined in the preceding section, we can deduce that domestic institutional investors, whose awareness of fiduciary responsibilities began to increase from the 2000s, gradually strengthened their monitoring effect on invest-ees, and that this boosted financial performance.
On the other hand, the coefficient for the ownership ratio of banks and insurance compa-nies was mostly significantly negative, as with the analysis using Tobin’s Q. We reconfirmed that shareholding by banks and insurance companies does not elicit a monitoring effect, and does not lead to bolstering financial performance.31
As for estimation results applying capital expenditure (Capex) to the dependent variable, (Panel B), coefficients for both foreign and domestic institutional investors were positive, mostly functioning to promote a company’s investments. This result contradicts those in Ferreira and Matos (2008). In Japanese companies, institutional investors do not necessarily boost financial performance (ROA) by promoting business restructuring (reducing assets).32 Rather, it seems that both foreign and domestic institutional investors urge companies to in-vest in future growth, which in turn leads to elevating firm value. In contrast, the ownership ratio of banks and insurance companies are significantly negative with respect to Capex. Companies with a higher ownership ratio of banks and insurance companies tend to reduce their investments (asset compression), but considering that the ownership ratio of banks and insurance companies has a negative effect on ROA, we can assume that such asset compres-sions do not lead to enhanced financial performance.
In summary, even if the increase in ownership ratio is based on institutional investors’ 29 Miyajima and Nitta (2011) also analyzed the impact that the ownership ratio of foreign institutional investors has on finan-cial performance (ROA), but for the above analysis, we analyzed the impact for ownership by domestic institutional investors and domestic financial institutions as well. Also, monitoring by institutional investors may have an impact on corporate perfor-mance not only during the same fiscal year, but during the course of several years. So to get a comprehensive understanding of the impact that the ownership ratio of institutional investors has, we should also analyze firm value (Tobin’s Q), which reflects future cash flows as well, together with analyses based on annual ROA.30 Results were the same when conducting the same analysis using operating income margin as the dependent variable.31 As with Tobin’s Q, we need to consider the endogeneity of ROA as well. Thus, similar to Miyajima and Nitta (2011), we conducted a two-step fixed-effect estimation for the panel data and checked the results, but results were the same as those of the above analysis. Even when considering simultaneity, we can assess that shareholding by foreign and domestic institutional investors has a positive effect on ROA, while shareholding by banks and insurance companies has a negative effect.32 Contrary to the analysis results for institutional investors, the effect of ownership by banks and insurance companies was systematically negative with respect to stock prices, firm value, and financial performance.
Policy Research Institute, Ministry of Finance, Japan, Public Policy Review, Vol.11, No.3, July 2015
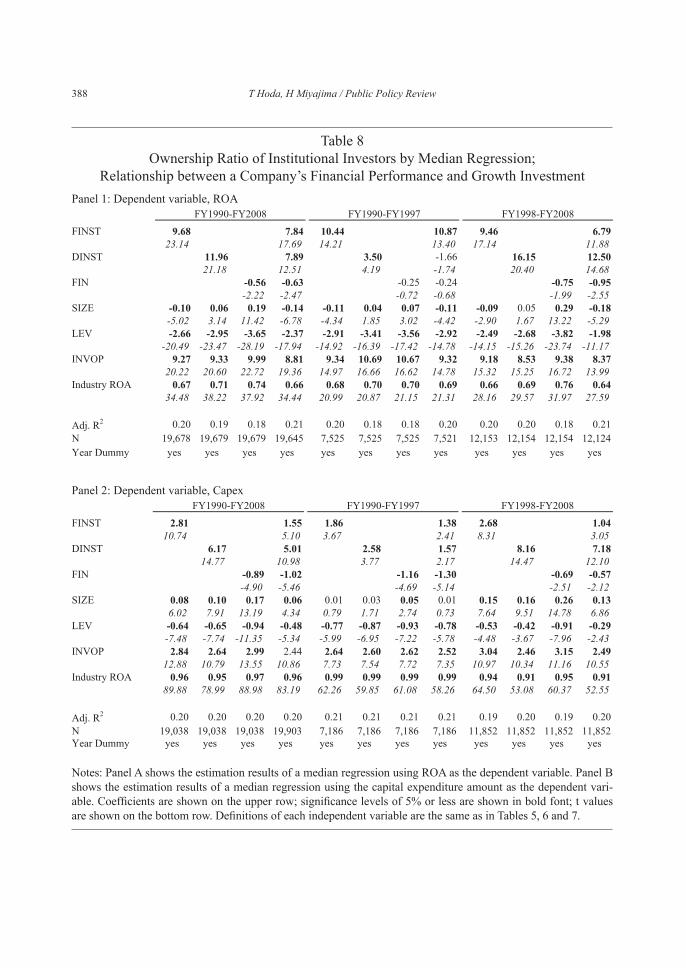
Notes: Panel A shows the estimation results of a median regression using ROA as the dependent variable. Panel B shows the estimation results of a median regression using the capital expenditure amount as the dependent vari-able. Coefficients are shown on the upper row; significance levels of 5% or less are shown in bold font; t values are shown on the bottom row. Definitions of each independent variable are the same as in Tables 5, 6 and 7.
Table 8Ownership Ratio of Institutional Investors by Median Regression;
Relationship between a Company’s Financial Performance and Growth InvestmentPanel 1: Dependent variable, ROA
Panel 2: Dependent variable, Capex
388 T Hoda, H Miyajima / Public Policy Review
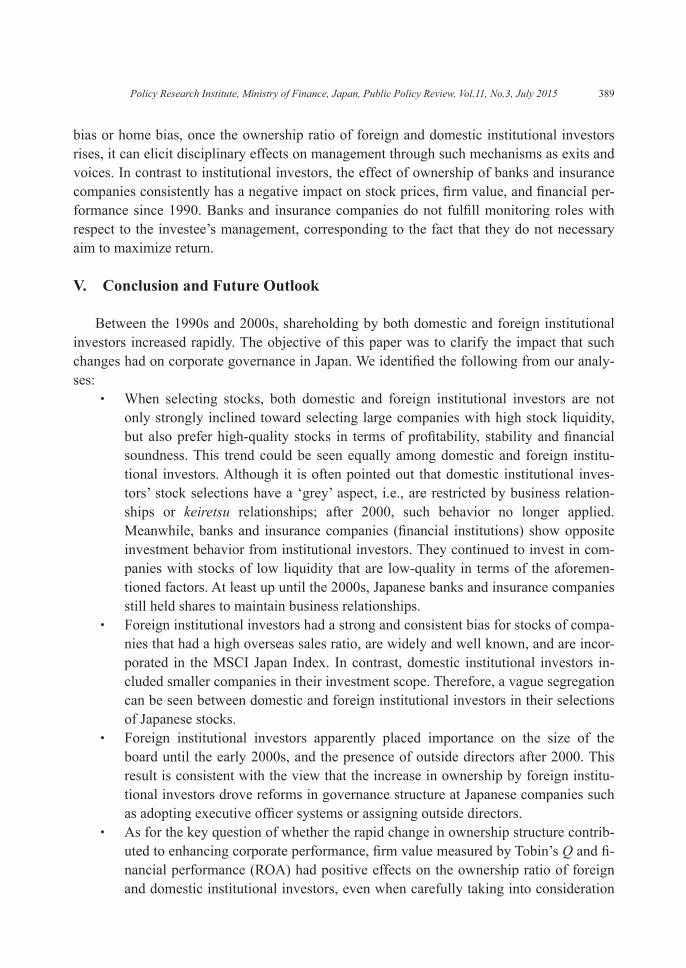
389
bias or home bias, once the ownership ratio of foreign and domestic institutional investors rises, it can elicit disciplinary effects on management through such mechanisms as exits and voices. In contrast to institutional investors, the effect of ownership of banks and insurance companies consistently has a negative impact on stock prices, firm value, and financial per-formance since 1990. Banks and insurance companies do not fulfill monitoring roles with respect to the investee’s management, corresponding to the fact that they do not necessary aim to maximize return.
V. Conclusion and Future Outlook
Between the 1990s and 2000s, shareholding by both domestic and foreign institutional investors increased rapidly. The objective of this paper was to clarify the impact that such changes had on corporate governance in Japan. We identified the following from our analy-ses:
・ When selecting stocks, both domestic and foreign institutional investors are not only strongly inclined toward selecting large companies with high stock liquidity, but also prefer high-quality stocks in terms of profitability, stability and financial soundness. This trend could be seen equally among domestic and foreign institu-tional investors. Although it is often pointed out that domestic institutional inves-tors’ stock selections have a ‘grey’ aspect, i.e., are restricted by business relation-ships or keiretsu relationships; after 2000, such behavior no longer applied. Meanwhile, banks and insurance companies (financial institutions) show opposite investment behavior from institutional investors. They continued to invest in com-panies with stocks of low liquidity that are low-quality in terms of the aforemen-tioned factors. At least up until the 2000s, Japanese banks and insurance companies still held shares to maintain business relationships.
・ Foreign institutional investors had a strong and consistent bias for stocks of compa-nies that had a high overseas sales ratio, are widely and well known, and are incor-porated in the MSCI Japan Index. In contrast, domestic institutional investors in-cluded smaller companies in their investment scope. Therefore, a vague segregation can be seen between domestic and foreign institutional investors in their selections of Japanese stocks.
・ Foreign institutional investors apparently placed importance on the size of the board until the early 2000s, and the presence of outside directors after 2000. This result is consistent with the view that the increase in ownership by foreign institu-tional investors drove reforms in governance structure at Japanese companies such as adopting executive officer systems or assigning outside directors.
・ As for the key question of whether the rapid change in ownership structure contrib-uted to enhancing corporate performance, firm value measured by Tobin’s Q and fi-nancial performance (ROA) had positive effects on the ownership ratio of foreign and domestic institutional investors, even when carefully taking into consideration
Policy Research Institute, Ministry of Finance, Japan, Public Policy Review, Vol.11, No.3, July 2015
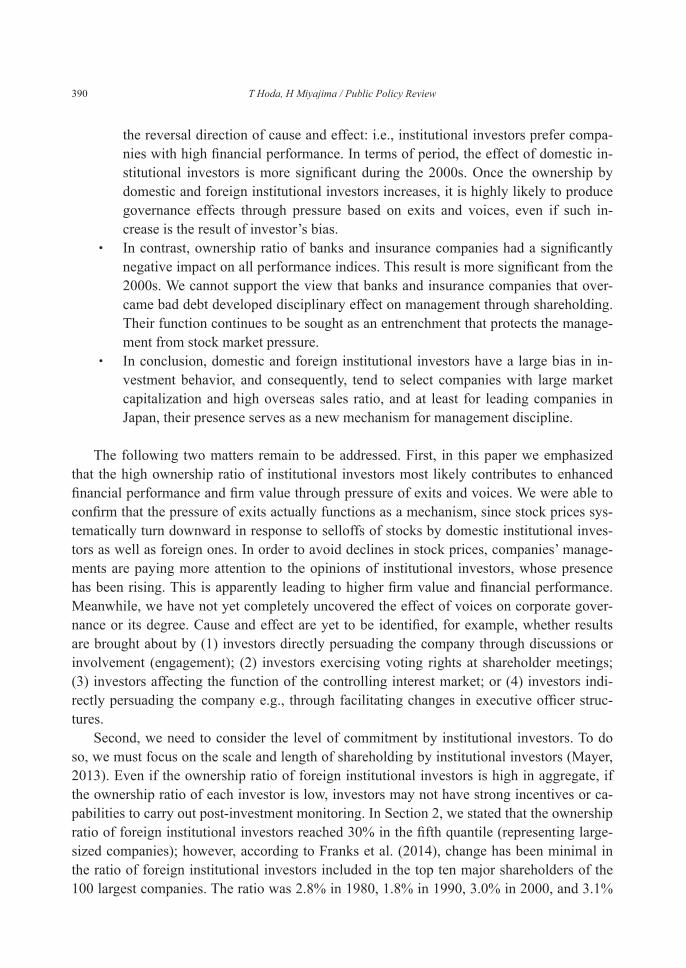
the reversal direction of cause and effect: i.e., institutional investors prefer compa-nies with high financial performance. In terms of period, the effect of domestic in-stitutional investors is more significant during the 2000s. Once the ownership by domestic and foreign institutional investors increases, it is highly likely to produce governance effects through pressure based on exits and voices, even if such in-crease is the result of investor’s bias.
・ In contrast, ownership ratio of banks and insurance companies had a significantly negative impact on all performance indices. This result is more significant from the 2000s. We cannot support the view that banks and insurance companies that over-came bad debt developed disciplinary effect on management through shareholding. Their function continues to be sought as an entrenchment that protects the manage-ment from stock market pressure.
・ In conclusion, domestic and foreign institutional investors have a large bias in in-vestment behavior, and consequently, tend to select companies with large market capitalization and high overseas sales ratio, and at least for leading companies in Japan, their presence serves as a new mechanism for management discipline.
The following two matters remain to be addressed. First, in this paper we emphasized that the high ownership ratio of institutional investors most likely contributes to enhanced financial performance and firm value through pressure of exits and voices. We were able to confirm that the pressure of exits actually functions as a mechanism, since stock prices sys-tematically turn downward in response to selloffs of stocks by domestic institutional inves-tors as well as foreign ones. In order to avoid declines in stock prices, companies’ manage-ments are paying more attention to the opinions of institutional investors, whose presence has been rising. This is apparently leading to higher firm value and financial performance. Meanwhile, we have not yet completely uncovered the effect of voices on corporate gover-nance or its degree. Cause and effect are yet to be identified, for example, whether results are brought about by (1) investors directly persuading the company through discussions or involvement (engagement); (2) investors exercising voting rights at shareholder meetings; (3) investors affecting the function of the controlling interest market; or (4) investors indi-rectly persuading the company e.g., through facilitating changes in executive officer struc-tures.
Second, we need to consider the level of commitment by institutional investors. To do so, we must focus on the scale and length of shareholding by institutional investors (Mayer, 2013). Even if the ownership ratio of foreign institutional investors is high in aggregate, if the ownership ratio of each investor is low, investors may not have strong incentives or ca-pabilities to carry out post-investment monitoring. In Section 2, we stated that the ownership ratio of foreign institutional investors reached 30% in the fifth quantile (representing large-sized companies); however, according to Franks et al. (2014), change has been minimal in the ratio of foreign institutional investors included in the top ten major shareholders of the 100 largest companies. The ratio was 2.8% in 1980, 1.8% in 1990, 3.0% in 2000, and 3.1%
390 T Hoda, H Miyajima / Public Policy Review
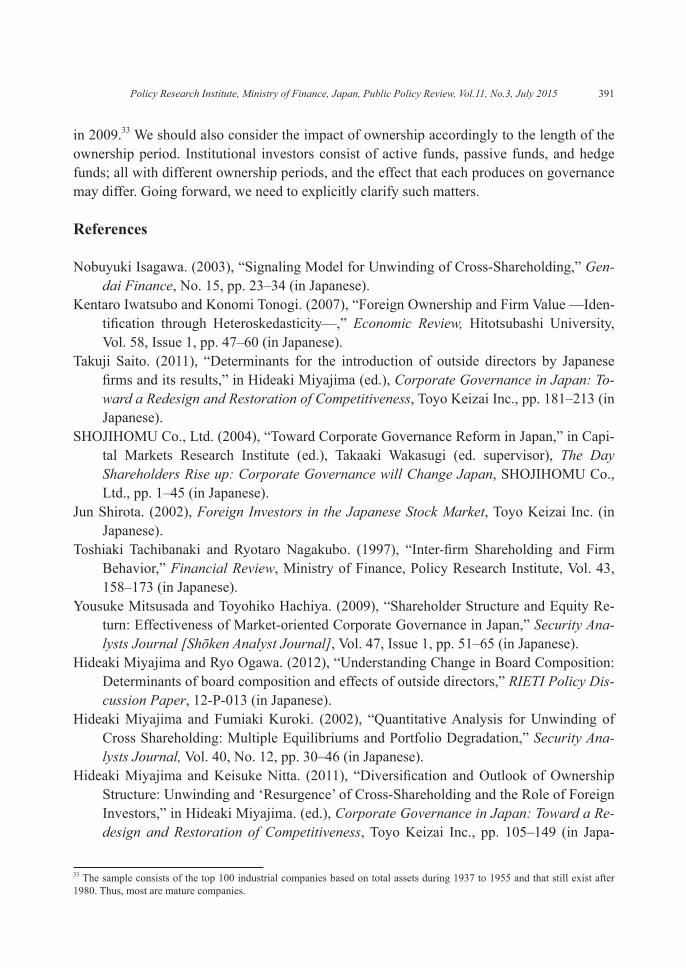
391
in 2009.33 We should also consider the impact of ownership accordingly to the length of the ownership period. Institutional investors consist of active funds, passive funds, and hedge funds; all with different ownership periods, and the effect that each produces on governance may differ. Going forward, we need to explicitly clarify such matters.
References
Nobuyuki Isagawa. (2003), “Signaling Model for Unwinding of Cross-Shareholding,” Gen-dai Finance, No. 15, pp. 23–34 (in Japanese).
Kentaro Iwatsubo and Konomi Tonogi. (2007), “Foreign Ownership and Firm Value —Iden-tification through Heteroskedasticity—,” Economic Review, Hitotsubashi University, Vol. 58, Issue 1, pp. 47–60 (in Japanese).
Takuji Saito. (2011), “Determinants for the introduction of outside directors by Japanese firms and its results,” in Hideaki Miyajima (ed.), Corporate Governance in Japan: To-ward a Redesign and Restoration of Competitiveness, Toyo Keizai Inc., pp. 181–213 (in Japanese).
SHOJIHOMU Co., Ltd. (2004), “Toward Corporate Governance Reform in Japan,” in Capi-tal Markets Research Institute (ed.), Takaaki Wakasugi (ed. supervisor), The Day Shareholders Rise up: Corporate Governance will Change Japan, SHOJIHOMU Co., Ltd., pp. 1–45 (in Japanese).
Jun Shirota. (2002), Foreign Investors in the Japanese Stock Market, Toyo Keizai Inc. (in Japanese).
Toshiaki Tachibanaki and Ryotaro Nagakubo. (1997), “Inter-firm Shareholding and Firm Behavior,” Financial Review, Ministry of Finance, Policy Research Institute, Vol. 43, 158–173 (in Japanese).
Yousuke Mitsusada and Toyohiko Hachiya. (2009), “Shareholder Structure and Equity Re-turn: Effectiveness of Market-oriented Corporate Governance in Japan,” Security Ana-lysts Journal [Shoken Analyst Journal], Vol. 47, Issue 1, pp. 51–65 (in Japanese).
Hideaki Miyajima and Ryo Ogawa. (2012), “Understanding Change in Board Composition: Determinants of board composition and effects of outside directors,” RIETI Policy Dis-cussion Paper, 12-P-013 (in Japanese).
Hideaki Miyajima and Fumiaki Kuroki. (2002), “Quantitative Analysis for Unwinding of Cross Shareholding: Multiple Equilibriums and Portfolio Degradation,” Security Ana-lysts Journal, Vol. 40, No. 12, pp. 30–46 (in Japanese).
Hideaki Miyajima and Keisuke Nitta. (2011), “Diversification and Outlook of Ownership Structure: Unwinding and ‘Resurgence’ of Cross-Shareholding and the Role of Foreign Investors,” in Hideaki Miyajima. (ed.), Corporate Governance in Japan: Toward a Re-design and Restoration of Competitiveness, Toyo Keizai Inc., pp. 105–149 (in Japa-
33 The sample consists of the top 100 industrial companies based on total assets during 1937 to 1955 and that still exist after 1980. Thus, most are mature companies.
Policy Research Institute, Ministry of Finance, Japan, Public Policy Review, Vol.11, No.3, July 2015
nese).Aggarwal, R., L. Klapper and P. D. Wysocki. (2005), “Portfolio Preferences of Foreign In-
stitutional Investors,” Journal of Banking and Finance, Vol. 29, Issue 12, pp. 2919–2946.
Aggarwal, R., I. Erel, M. Ferreira and P. Matos. (2011), “Does Governance Travel Around the World? Evidence from Institutional Investors,” Journal of Financial Economics, Vol. 100, Issue 1, pp. 154–181.
Ahearne, A. G., W. L. Griever, and F. E. Warnock. (2004), “Information Costs and Home Bias: An Analysis of US Holdings of Foreign Equities,” Journal of International Eco-nomics, Vol. 62, Issue 2, pp. 313–336.
Ahmadjian, C. (2007), “Foreign Investors and Corporate Governance in Japan,” in Aoki, M., G. Jackson and H. Miyajima (eds), Corporate Governance in Japan: Institutional Change and Organizational Diversity, Oxford University Press, pp. 125–150.
Aoki, M. (2010), Corporations in Evolving Diversity: Cognition, Governance, and Institu-tions, Oxford University Press (Kazuhiro Taniguchi (trans.) Corporation no shinka tayosei: shūgoninchi, governance, seido, NTT Publishing Co., Ltd., 2011)
Brickley, J.A., R.C. Lease and C.W. Smith. (1988), “Ownership Structure and Voting on An-titakeover Amendments,” Journal of Financial Economics, Vol. 20, pp. 267–291.
Brennan, M.J. and H.H. Cao. (1997), “International Portfolio Investment Flows,” Journal of Finance, Vol. 52, Issue 5, pp. 1851–1880.
Borokhovichi, K.A., K. Brunarski, Y.S. Harman and R. Parrino. (2006), “Variation in the Monitoring Incentives of Outside Stockholders,” Journal of Law and Economics, Vol. 49, No. 2, pp. 651–680.
Chen, X., J. Harford and K. Li. (2007), “Monitoring: Which Institutions Matter?” Journal of Financial Economics, Vol. 86, Issue 2, pp. 279–305.
Dahlquist, M., and G. Robertsson. (2001), “Direct Foreign Ownership, Institutional Inves-tors, and Firm Characteristics,” Journal of Financial Economics, Vol. 59, Issue 3, pp. 413–440.
Del Guercio, D. (1996), “The Distorting Effect of the Prudent-man Laws on Institutional Equity Investments,” Journal of Financial Economics, Vol. 40, Issue 1, pp. 31–62.
Fama, E. F., and J. D. Macbeth. (1973), “Risk, Return, and Equilibrium: Empirical Tests,” The Journal of Political Economy, Vol. 81, No. 3, pp. 607–636.
Ferreira, M. A. and P. Matos. (2008), “The Colors of Investors’ Money: The Role of Institu-tional Investors around the World,” Journal of Financial Economics, Vol. 88, Issue 3, pp. 499–533.
Flath, D. (1993), “Shareholding in the Keiretsu, Japan’s Financial Groups,” Review of Eco-nomics and Statistics, Vol. 75, No. 2, pp. 249–257.
Franks, J., C. Mayer, and H. Miyajima. (2014), “The Ownership of Japanese Corporations in the 20th Century,” Review of Financial Studies, Vol. 27, No. 9, pp. 2580–2625.
French, K. R. and J. M. Poterba. (1991), “Investor Diversification and International Equity Markets,” American Economic Review, Vol. 81, Issue 2, pp. 222–226.
392 T Hoda, H Miyajima / Public Policy Review
393
Giannetti, M. and A. Simonov. (2006), “Which Investors Fear Expropriation? Evidence from Investors’ Portfolio Choices,” Journal of Finance, Vol. 61, Issue 3, pp. 1507–1547.
Gompers, P. A. and A. Metrick. (2001), “Institutional Investors and Equity Prices,” Quarter-ly Journal of Economics, Vol. 116, Issue 1, pp. 229–259.
Hiraki, T., H. Inoue, A. Ito, F. Kuroki, and H. Masuda. (2003), “Corporate Governance and Firm Value in Japan: Evidence from 1985 to 1998,” Pacific-Basin Finance Journal, Vol. 11, Issue 3, pp. 239–265.
Hiraki, T., A. Ito, and F. Kuroki. (2003), “Investor Familiarity and Home Bias: Japanese Ev-idence,” Asia-Pacific Financial Markets, Vol. 10, Issue 4, pp. 281–300.
Jacoby, S. M. (2009), “Foreign Investors and Corporate Governance in Japan: The Case of CalPERS,” in Whittaker, D.H. and S.F. Deakin (eds), Corporate Governance and Man-agerial Reform in Japan,” Oxford University Press, pp. 99–133.
Kang, J.K. and R.M. Stulz. (1997), “Why is there a Home Bias? An Analysis of Foreign Portfolio Equity Ownership in Japan,” Journal of Financial Economics, Vol. 46, Issue 1, pp. 3–28.
Leuz, C., K.V. Lins and F.E. Warnock. (2009), “Do Foreigners Invest Less in Poorly Gov-erned Firms?” Review of Financial Studies, Vol. 22, Issue 8, pp. 3245–3285.
Mayer, C. (2013), Firm Commitment: Why the corporation is failing us and how to restore trust in it, Oxford University Press (Hideaki Miyajima (trans. supervisor), Masato Shi-mizu and Takuya Kawanishi (trans.) Firm Commitment: Shinrai dekiru kabushikigai-sha wo tsukuru, NTT Publishing Co., Ltd, 2014).
Morck, R. and M. Nakamura. (2000), “Japanese Corporate Governance and Macroeconomic Problems,” Working Papers (Harvard Institute of Economic Research), Number 1893.
Merton, R.C. (1987), “A Simple Model of Capital Market Equilibrium with Incomplete In-formation,” Journal of Finance, Vol. 42, Issue 3, pp. 483–510.
Miyajima, H. and F. Kuroki. (2007), “The Unwinding of Cross-Shareholding in Japan: Causes, Effects, and Implications” in Aoki, M., G. Jackson and H. Miyajima (eds.) Corporate Governance in Japan: Institutional Change and Organizational Diversity, Oxford University Press, pp. 79–124.
Policy Research Institute, Ministry of Finance, Japan, Public Policy Review, Vol.11, No.3, July 2015