Embed Size (px)
Citation preview
MOVING FORWARDOVERSEAS VOTE FOUNDATION AND U.S. VOTE FOUNDATION 2012 POST-ELECTION SURVEY
REPORTS AND ANALYSES
JANUARY 2013JANUARY 2013
A DETAILED LOOK AT HOW VOTERS AND ELECTION OFFICIALS FARED IN THE 2012 GENERAL ELECTIONAND WHAT TO DO ABOUT IT
2012 POST-ELECTION OVF AND US VOTE
SURVEY REPORT

Overseas Vote Foundation and U.S. Vote FoundationSusan Dzieduszycka-Suinat, President and Chief Executive OfficerDr. Claire M. Smith, PhD, Research Program DirectorDr. Judith Murray, PhD, Assistant ResearcherPaige Warman, Marketing and Communications SupportBrian Leclair, Research Editor AcknowledgementsWe would like to thank Dr. Scott Huffmon and the Social & Behavioral Research Laboratory at Winthrop University for their consultation services.
Special acknowledgement and appreciation is given to the voters and the local election officials, whose participation made this report possible.
For additional information on Overseas Vote Foundation, please visit www.overseasvotefoundation.org.
For additional information on U.S. Vote Foundation, please visit www.usvotefoundation.org.
January 2013
©2013 Overseas Vote Foundation and U.S. Vote Foundation 4325 Old Glebe Road, Arlington, VA 22207

Table of Contents
Overseas vOte FOundatiOn and u.s. vOte FOundatiOn 2013 POst-electiOn survey rePOrt
1
I. Executive Summary . . . . . . . . . . . . . . . . . . . . . . . . . . . . . . . . . . . 2 A. Results and Reflections on Military and Overseas Voting in 2012 . . . . . . . . . . . . . . . . . . . . . . . 2 B. Results and Reflections on U.S. Domestic Absentee Voting in 2012 . . . . . . . . . . . . . . . . . . . . . . 3
C. 2012 Post-Election Surveys Overview . . . . . . . . . . . . . . . . . . . . . . . . . . . . . . . . . . . . . 3
II. Evaluating MOVE Act Implementation in 2012 . . . . . . . . . . . . . . . . . . . . 4 A. Electronic Availability Of Materials . . . . . . . . . . . . . . . . . . . . . . . . . . . . . . . . . . . . . . 4
B. Ballot-tracking Mechanism . . . . . . . . . . . . . . . . . . . . . . . . . . . . . . . . . . . . . . . . . . 5
C. Designate Means for Electronic Communication . . . . . . . . . . . . . . . . . . . . . . . . . . . . . . . 5
D. Single Application For Multiple Elections . . . . . . . . . . . . . . . . . . . . . . . . . . . . . . . . . . . 6
E. 45-Day Transmission Time . . . . . . . . . . . . . . . . . . . . . . . . . . . . . . . . . . . . . . . . . . 6
F. Expansion of the FWAB . . . . . . . . . . . . . . . . . . . . . . . . . . . . . . . . . . . . . . . . . . . . 6
III. Policy Recommendations . . . . . . . . . . . . . . . . . . . . . . . . . . . . . . . 6A. Improve Outreach through Website Optimization . . . . . . . . . . . . . . . . . . . . . . . . . . . . . . 7
B. Clarify Usage of the FWAB . . . . . . . . . . . . . . . . . . . . . . . . . . . . . . . . . . . . . . . . . . . 7 C. Electronic Balloting Issues and Fixes . . . . . . . . . . . . . . . . . . . . . . . . . . . . . . . . . . . . . . 7 D. Validity of the FPCA Form . . . . . . . . . . . . . . . . . . . . . . . . . . . . . . . . . . . . . . . . . . . 7
E. Considerations for U.S. Domestic Absentee Voting . . . . . . . . . . . . . . . . . . . . . . . . . . . . . . . 8
IV. 2012 Post-Election Military and Overseas Voter Survey Report . . . . . . . . . . . . 8A. Methodology . . . . . . . . . . . . . . . . . . . . . . . . . . . . . . . . . . . . . . . . . . . . . . . . . 8
B. Respondent Profile And Demographics: Who Are Overseas Voters? . . . . . . . . . . . . . . . . . . . . . . 9 C. Voter Registration And Ballot Request Issues . . . . . . . . . . . . . . . . . . . . . . . . . . . . . . . . 11 D. Ballot Issues . . . . . . . . . . . . . . . . . . . . . . . . . . . . . . . . . . . . . . . . . . . . . . . . . 14 E. FWAB Awareness and Use . . . . . . . . . . . . . . . . . . . . . . . . . . . . . . . . . . . . . . . . . . 17 F. Uniformed Services Members And Spouses Or Dependents . . . . . . . . . . . . . . . . . . . . . . . . . 18 G. Conclusion . . . . . . . . . . . . . . . . . . . . . . . . . . . . . . . . . . . . . . . . . . . . . . . . . 18
V. 2012 Post-Election Local Election Official Survey Report . . . . . . . . . . . . . . . 19 A. Methodology . . . . . . . . . . . . . . . . . . . . . . . . . . . . . . . . . . . . . . . . . . . . . . . . 19 B. Numbers: Registrations And Ballot Requests . . . . . . . . . . . . . . . . . . . . . . . . . . . . . . . . . 20 C. Registration and Ballot Request . . . . . . . . . . . . . . . . . . . . . . . . . . . . . . . . . . . . . . . 21 D. Ballot Issues: Blank Ballots, Voted Ballots, and Ballot Rejections . . . . . . . . . . . . . . . . . . . . . . . 23 E. Assistance and Communications to Overseas and Military Voters . . . . . . . . . . . . . . . . . . . . . . 24 F. Conclusion . . . . . . . . . . . . . . . . . . . . . . . . . . . . . . . . . . . . . . . . . . . . . . . . . . 26
VI. 2012 US Vote Voter Survey Report . . . . . . . . . . . . . . . . . . . . . . . . . . 27 A. Methodology and Respondent Profile . . . . . . . . . . . . . . . . . . . . . . . . . . . . . . . . . . . . 27 B. Domestic Voter Registration . . . . . . . . . . . . . . . . . . . . . . . . . . . . . . . . . . . . . . . . . 27 C. Domestic Absentee Voting . . . . . . . . . . . . . . . . . . . . . . . . . . . . . . . . . . . . . . . . . . 29 D. Summary . . . . . . . . . . . . . . . . . . . . . . . . . . . . . . . . . . . . . . . . . . . . . . . . . . 30
VII. OVF and US Vote Year in Review . . . . . . . . . . . . . . . . . . . . . . . . . . . 30 A. About OVF and US Vote . . . . . . . . . . . . . . . . . . . . . . . . . . . . . . . . . . . . . . . . . . . 30 B. OVF and US Vote in 2012 . . . . . . . . . . . . . . . . . . . . . . . . . . . . . . . . . . . . . . . . . . 31 C. Website Users and Visitors . . . . . . . . . . . . . . . . . . . . . . . . . . . . . . . . . . . . . . . . . . 31 D. About the OVF Research Program . . . . . . . . . . . . . . . . . . . . . . . . . . . . . . . . . . . . . . 31

Overseas vOte FOundatiOn and u.s. vOte FOundatiOn 2013 POst-electiOn survey rePOrt
2
I Executive Summary
A. Results and Reflections on Military and Overseas Voting in 2012
Overseas Vote Foundation (OVF) is pleased to release the results of its 2012 Post-Election Survey of Military and Overseas Voters, and 2012 Local Election Official Survey. Now in their fifth federal election cycle, these surveys uniquely position OVF at the forefront of research concerning the Uniformed and Overseas Citizens Absentee Voting Act (UOCAVA) community and the election administration that facilitates military and overseas voting for American citizens abroad.1 More than 13,500 voters in 160 countries and more than 2,000 local election officials (LEOs) in the U.S. participated in the OVF surveys. These extensive surveys provide a unique look into the voting experiences of overseas citizens and military voters, and are an unequaled resource in supporting OVF’s ongoing mission to help UOCAVA voters register and vote in federal elections.
In 2012, over 150,000 voters accessed OVF’s unique voter registration/ballot request tools. Based on voter turnout in previous elections, OVF is responsible for generating roughly 15 percent of the 2012 overseas absentee ballot requests.
The Military and Voter Empowerment (MOVE) Act, passed in 2009, is a success story in the narrative of UOCAVA, as it represented the first major policy change for military and overseas voters in decades.2 The results of the 2012 surveys reflect the full implementation and impact of the MOVE Act on voters and local election officials. 2012 proved to be a tipping point in the use of technology by military and overseas voters. Over 83 percent of survey respondents used the Internet to generate a voter registration/ballot request form and over 50 percent used some form of electronic transmission (i.e., fax, email, or Internet download) to receive a blank ballot. The increased use of technology has led to new problems in the voting process: print problems, paper size, and computer compatibility issues, to name just name a few.
While we acknowledge the tremendous progress and positive trends now visible, continued improvements can
1The Uniformed and Overseas Citizens Absentee Voting Act is commonly referred to as UOCAVA. UOCAVA voters are U.S. citizens who are active members of the Uniformed Services, the Merchant Marine, and the commissioned corps of the Public Health Service and the National Oceanic and Atmospheric Administration, their family members, and U.S. citizens residing outside the U.S. The Act, passed in 1986, provides the legal basis for absentee voting requirements for these citizens.2The Military and Overseas Voter Empowerment (MOVE) Act of 2009 amended UOCAVA and paved the way for modernization in the arena of military and over-seas voting regarding technology, communications, and election administration. The MOVE Act required states to implement nearly all of its provisions in time for the 2010 federal elections.
Key Findings: Military and Overseas Voters
• Over 80 percent of respondents used the Internet to gain access to voter registration information, tools, and services.
• 35 percent of respondents used email, fax, or Internet upload to submit a voter registration/ballot request form (FPCA) for the 2012 federal election.
• There was a 30 percent increase in blank ballot delivery using electronic methods compared to the 2010 federal election.
• 22 percent of respondents who attempted to vote could not because they either did not get a ballot or received it too late.
• 85 percent of LEOs reported experiencing no problems with the electronic transmission of registration material.
• Communicating the availability of state online voter tools is not well established, as 64 percent of respondents noted they did not use a state website to look up their voter registration, and 84 percent of respondents noted they did not use a state online ballot-tracking system.
• Only 35 percent of LEOs reported that voters who submitted a voter registration/ballot request form in 2010 were required to do the same in 2012, despite the MOVE Act requirements.
Key Findings: Domestic Voters• 59 percent of voters relied on the Internet to
generate a voter registration form.
• Nearly 74 percent used the Internet to download or generate an absentee ballot request form.
• Domestic voters tended to submit their registration and ballot request applications in October.
• Domestic voters overwhelmingly used postal methods to submit ballot requests and return their voted ballots.
• Few domestic voters experienced problems with their absentee ballots, but many did report ballots being delivered late.
• 14 percent of voters who requested an absentee ballot did not receive one.

Overseas vOte FOundatiOn and u.s. vOte FOundatiOn 2013 POst-electiOn survey rePOrt
3
still be realized. Although the number of voters voting “on time” has increased and the majority of ballots are being sent 45 days before Election Day, almost 22 percent of survey respondents who attempted to participate either did not receive a ballot or received it late. While states must continue to make punctual ballot transmission a top priority, voters must also remember to submit their registration/ballot request forms in a timely manner. There is a statistically significant correlation between when a voter sent in a request form and when they received their ballot. That is, a voter who sent in her form late is more likely to receive her ballot late or not receive it at all.
B. Results and Reflections on U.S. Domestic Absentee Voting in 2012
In January 2012, OVF launched U.S. Vote Foundation (US Vote). US Vote adopts OVF’s concept of a customized voter services site, which provides web applications and information services that assist citizens to become active voters. US Vote provides domestic U.S. voters with the ability to generate accurate and complete state-specific voter registration and state-specific absentee ballot request applications across all states with the intention of helping voters submit more complete information to their election office. US Vote also launched its first post-election survey following the 2012 General Election. With more than 1,000 responses, the survey provides unique insight into the voting processes used by domestic voters.
The data give us some insight into the domestic voting process. First, like overseas and military voters, domestic voters (59 percent) are using the Internet to create registration forms and nearly three-quarters (74 percent) of survey respondents used a website to download or generate an absentee ballot request. Second, domestic absentee voters rely primarily on traditional postal systems to receive blank ballots and return voted ballots. Third, domestic absentee voters also have trouble receiving their ballots on time, and 14 percent of respondents who requested an absentee ballot did not receive one. However, as is the case with overseas and military voters, voters must also be sure to submit their forms in a timely manner, as over one-third of registration forms and two-thirds of absentee ballot requests were submitted in October.
C. 2012 Post-Election Surveys Overview
OVF launched its 48-question 2012 Post-Election Military and Overseas Voter Survey on Election Day, November 6, 2012, and it ran through December 15, 2012. OVF reports a 14 percent response rate, as 13,676 UOCAVA voters completed the survey. The survey focused primarily on matters affecting the respondents’ voting experiences. It was intended to gain both quantitative and qualitative data. This is OVF’s fifth post-election voter survey.
The 2012 Local Election Official (LEO) survey was sent to 7,785 LEOs in jurisdictions around the U.S. The LEOs
working in all 50 states, the District of Columbia, American Samoa, Guam, Puerto Rico, and the Virgin Islands were included in the survey distribution. The 38-question LEO survey ran from November 29, 2012 through December 26, 2012. OVF enjoyed its best response to date, as 2,071 LEOs responded, which represents a 26.6 percent response rate. This was the fourth post-election LEO survey that OVF has executed.
The first U.S. Vote Foundation Post-Election Voter Survey was launched on Election Day, November 6, 2012 and ran until December 15, 2012. Of the 9,961 individuals invited to take the 42-question survey, 1,079 completed the survey for a 10.8 percent response rate.

“Electronic ballots cut the mailing time in half. Voters had immediate satisfaction. I can foresee the volume of electronic ballots increasing for overseas voters as more voters become aware of this method.„ Anonymous LEO Response
Overseas vOte FOundatiOn and u.s. vOte FOundatiOn 2013 POst-electiOn survey rePOrt
4
II Evaluating MOVE Act Implementation in 2012
The passage of the Military and Overseas Voter Empowerment (MOVE) Act in October 2009 heralded the first major policy change for overseas and military voters in more than a decade. This groundbreaking legislation amended UOCAVA and paved the way for modernization in the area of military and overseas voting. Overseas Vote Foundation’s 2010 Post-Election Survey began to assess the impact of the MOVE Act in the 2010 federal election. However, not all states were able to implement all MOVE Act provisions in time for the first election following its passage. Therefore, the data from OVF’s 2012 Post-Election Survey is a vital addition to the overall assessment of the MOVE Act reforms. By capturing data that reflects the first year in which full implementation of MOVE Act provisions was required across all states, the impact of this important legislation can be better understood and valued.
A. Electronic Availability of Voter Registration Applications, Absentee Ballot Applications, and Blank Ballots (Sections 577 and 578)
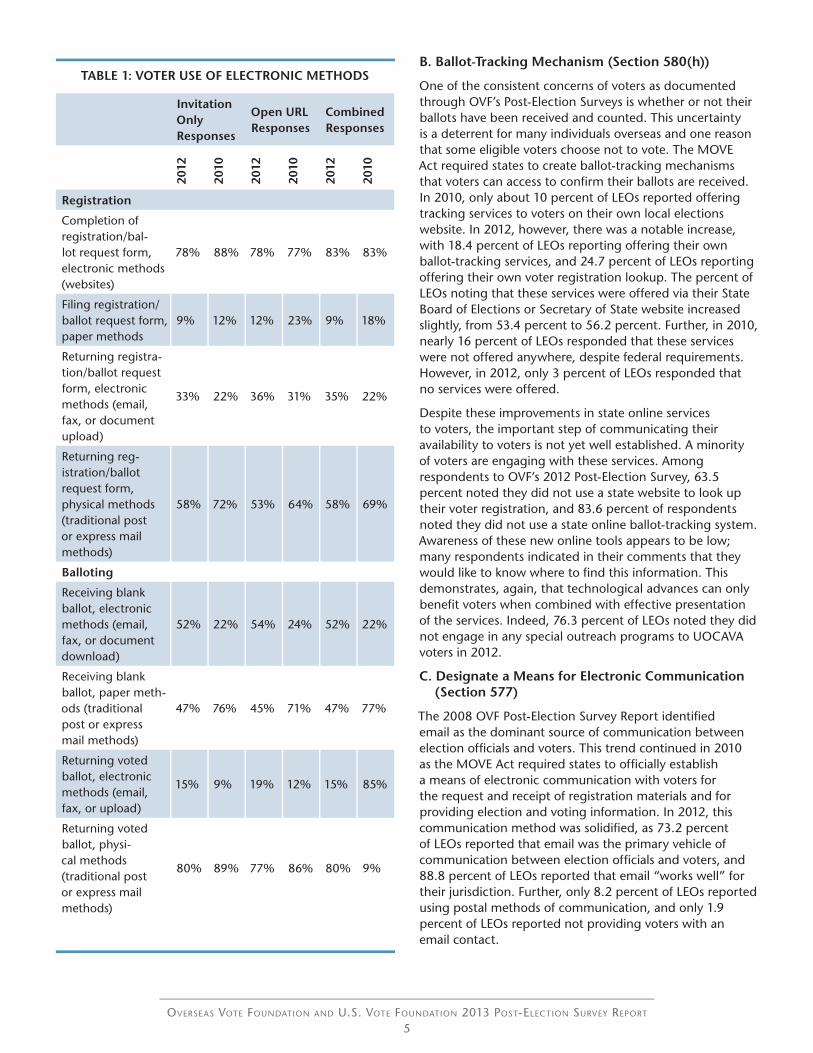
The MOVE Act mandated the availability of electronic transmission of voter registration material, absentee ballot request material, and blank ballots to military and overseas voters. As such, in 2010, there was an increase in the use of electronic transmission methods to deliver voting material. In 2012, this trend continued, notably with a 30 percent increase in the delivery of blank ballots by electronic means. Table 1 summarizes how voters used electronic methods in 2012 compared to 2010. The ability of UOCAVA voters to return registration material and voted ballots electronically was also extended in 2012. However, more voters used electronic methods to receive blank ballots than to return them.
LEOs appeared to have reservations about the new technological requirements of the MOVE Act in 2010, with only 13 percent of LEOs reporting the electronic transmission of voting material “worked well.” In 2012, however, the vast majority (85.1 percent) of LEOs reported experiencing no problems with the electronic transmission of registration material, and 86.2 percent reported experiencing no problems concerning the electronic transmission of blank ballots. Those problems that were reported by both LEOs and voters include printing problems, computer compatibility, and paper size issues. However, these data strongly demonstrate that this element of the MOVE Act has been implemented and voters are using new options.
Key Provisions of the MOVE Act· Technology:
Voter registration information online, options for electronic delivery of blank ballots, and ballot-tracking systems
· Communications: Use of email to communicate with voters
· Election Administration: Transmission of blank ballots 45 days before Election Day
Overseas vOte FOundatiOn and u.s. vOte FOundatiOn 2013 POst-electiOn survey rePOrt
5
TABLE 1: VOTER USE OF ELECTRONIC METHODS
Invitation Only Responses
Open URL Responses
Combined Responses
2012
2010
2012
2010
2012
2010
Registration
Completion of registration/bal-lot request form, electronic methods (websites)
78% 88% 78% 77% 83% 83%
Filing registration/ballot request form, paper methods
9% 12% 12% 23% 9% 18%
Returning registra-tion/ballot request form, electronic methods (email, fax, or document upload)
33% 22% 36% 31% 35% 22%
Returning reg-istration/ballot request form, physical methods (traditional post or express mail methods)
58% 72% 53% 64% 58% 69%
Balloting
Receiving blank ballot, electronic methods (email, fax, or document download)
52% 22% 54% 24% 52% 22%
Receiving blank ballot, paper meth-ods (traditional post or express mail methods)
47% 76% 45% 71% 47% 77%
Returning voted ballot, electronic methods (email, fax, or upload)
15% 9% 19% 12% 15% 85%
Returning voted ballot, physi-cal methods (traditional post or express mail methods)
80% 89% 77% 86% 80% 9%
B. Ballot-Tracking Mechanism (Section 580(h))
One of the consistent concerns of voters as documented through OVF’s Post-Election Surveys is whether or not their ballots have been received and counted. This uncertainty is a deterrent for many individuals overseas and one reason that some eligible voters choose not to vote. The MOVE Act required states to create ballot-tracking mechanisms that voters can access to confirm their ballots are received. In 2010, only about 10 percent of LEOs reported offering tracking services to voters on their own local elections website. In 2012, however, there was a notable increase, with 18.4 percent of LEOs reporting offering their own ballot-tracking services, and 24.7 percent of LEOs reporting offering their own voter registration lookup. The percent of LEOs noting that these services were offered via their State Board of Elections or Secretary of State website increased slightly, from 53.4 percent to 56.2 percent. Further, in 2010, nearly 16 percent of LEOs responded that these services were not offered anywhere, despite federal requirements. However, in 2012, only 3 percent of LEOs responded that no services were offered.
Despite these improvements in state online services to voters, the important step of communicating their availability to voters is not yet well established. A minority of voters are engaging with these services. Among respondents to OVF’s 2012 Post-Election Survey, 63.5 percent noted they did not use a state website to look up their voter registration, and 83.6 percent of respondents noted they did not use a state online ballot-tracking system. Awareness of these new online tools appears to be low; many respondents indicated in their comments that they would like to know where to find this information. This demonstrates, again, that technological advances can only benefit voters when combined with effective presentation of the services. Indeed, 76.3 percent of LEOs noted they did not engage in any special outreach programs to UOCAVA voters in 2012.
C. Designate a Means for Electronic Communication (Section 577)
The 2008 OVF Post-Election Survey Report identified email as the dominant source of communication between election officials and voters. This trend continued in 2010 as the MOVE Act required states to officially establish a means of electronic communication with voters for the request and receipt of registration materials and for providing election and voting information. In 2012, this communication method was solidified, as 73.2 percent of LEOs reported that email was the primary vehicle of communication between election officials and voters, and 88.8 percent of LEOs reported that email “works well” for their jurisdiction. Further, only 8.2 percent of LEOs reported using postal methods of communication, and only 1.9 percent of LEOs reported not providing voters with an email contact.

Overseas vOte FOundatiOn and u.s. vOte FOundatiOn 2013 POst-electiOn survey rePOrt
6
D. Single Application for Single Elections (Section 585)
Not all aspects of the MOVE Act were laudable. Section 585 of the MOVE Act was intended to reduce protections for UOCAVA voters to receive ballots over a four-year, two-general election cycle period when filing a single registration/ballot request form to just a two-year, single general election cycle.
This provision was a source of major confusion among voters in 2010, and continued to confuse voters in 2012. The non-uniform application of the provision by election officials calls attention to a needed review and reconsideration of the measure. Despite the MOVE Act requirements, only 35.3 percent of LEOs reported that voters who submitted a registration/ballot request form in 2010 were required to do the same in 2012. More than one-fifth of LEOs (22.4 percent) noted that voters who had submitted a registration/ballot request form in 2010 received a ballot in 2012 without re-filing. An almost equal number, 23.5 percent, of LEOs reported that if a voter had submitted a registration/ballot request form in 2010, and subsequently contacted the LEO via any means, a ballot would be sent in 2012 without re-filing.
These findings were also supported by the voter survey results as 14.3 percent of voters reported not submitting a new registration/ballot request form for the 2012 federal election, but still voting; and 17.3 percent reported not receiving an official ballot, although they expected one to arrive. The varied responses from LEOs, as well as the data collected from voters, continues to highlight the uncertainty surrounding the implementation of this aspect of the MOVE Act.
In 2012, Congresswoman Carolyn Maloney (D – NY) introduced H.R. 5828 to reinstate UOCAVA Section 104 for a single two-year general election cycle. Unfortunately, the bill languished in the House of Representatives, and no progress occurred.
E. Transmit ballots to voters by 45 days prior to Election Day. If states cannot comply, they must apply for a waiver. (Section 579)
The MOVE Act mandated that ballots be made available to UOCAVA voters 45 days prior to Election Day. For the 2012 election, many LEOs reported that the use of electronic technology facilitated the expedient delivery of ballots. The most common cause of problems with transmitting ballots to voters within the mandated timeframe was due to issues with vendor-supplied ballots, as reported by LEOs (3.7 percent).
Most voters (68.7 percent) reported receiving their ballot by October 15. However, 21.8 percent of voters reported receiving their ballot only by October 31. This late date does not allow a comfortable window of time for an overseas voter to return a ballot from overseas. Notably,
only 2.5 percent of individuals reported receiving their ballot the week before Election Day or later, down from 5 percent in 2010 and 11 percent in 2008. Unfortunately, 17.3 percent of survey respondents reported never receiving a ballot for the 2012 election, and 28.7 percent of survey respondents reported receiving their ballot too late.
There are improvements in ballot transmission to voters who apply for their ballots before the 45-day window, but there are voters receiving ballots late or not at all. However, election officials cannot be expected to provide on-time ballot delivery to last-minute voters. There is also a strong, significant correlation between when a voter submits his/her request form and when they receive a ballot: those that submit their forms late are naturally less likely to receive them on time. Voters must be mindful of deadlines and return their request forms in a timely manner.
F. Ballots cannot be rejected for overly burdensome requirements, such as notarization. Expansion of use of the Federal Write-in Absentee Ballot (FWAB) (Sections 581(a), 582)
The MOVE Act prohibits states from rejecting ballots that do not have notarization or witness signatures. There were no reports of LEOs rejecting voted ballots due to a lack of notarization or witness signature. However, 1.1 percent of LEOs reported rejecting voter registration and/or ballot request forms (FPCAs) due to a lack of witness signature.
The MOVE Act expanded the use of the FWAB to all special, primary, and runoff elections for federal office. This requirement did not go into effect until the end of 2010, and, therefore, was not realized until 2012. More than 1,000 respondents reported using a FWAB in 2012. In the 2012 Post-Election Survey, many LEOs noted that FWABs were submitted and subsequently rejected as ballots due to the fact that the voter did not first complete and file an FPCA to register and/or request an official ballot as required by UOCAVA.
III Policy Recommendations
As a nonpartisan, nonprofit organization with programs spanning technology development and innovation, research activities, strategic alliances, outreach, communications, and voter support, Overseas Vote Foundation and U.S. Vote Foundation together bring forward a unique view of the electoral process. Our recommendations are also influenced by years of work with election officials through our directory services, content management, licensing, and development programs; with voters through our web services and support; with researchers, academics, and members of the press and Congress through our growing research program; as well as with election specialists, technologists, and advocates through our commitment

“Communication with my overseas and military voters went very well. I have had no problems with emailing and have made some wonderful friendships.„Anonymous LEO Response
Overseas vOte FOundatiOn and u.s. vOte FOundatiOn 2013 POst-electiOn survey rePOrt
7
to election integrity. Our hands-on work with voters, as evidenced in this research report, underlies the fundamental purpose of our organization. Based on these experiences supporting overseas, military, and domestic voters, as well as the OVF and US Vote surveys, OVF makes the following recommendations:
A. Improve Outreach through Website Optimization
Continued outreach is important to make voters aware of the new voting technologies available to them. While not every state and county can have experts in website usability and design, we recommend a greater open-mindedness on the part of states and local website administrators to examine the user traffic to their voter services and to consider expert consultants to review their sites and recommend improvements.
Online services are only useful to voters if they are aware of them and can quickly find them when needed. Enhancements in state and local websites will make it possible for voters to find and access the UOCAVA and other website tools and services in which states and localities so heavily invest. For example, states made great strides in providing online tools, however only 36 percent of voters used voter registration look-up tools and 16 percent made use of ballot-tracking tools.
OVF recommends that election officials augment online communications as a way to increase and maintain voter participation, build contact lists to use for proactive, informative email communications, texting and social media messaging, which keep voters engaged not only in general elections, but also local, primary and special elections. Vendors involved with election services to UOCAVA voters should consider communications support in their development plans with states and counties. For example, the OVF Hosted Systems Solution builds qualified voter email lists as it registers voters and allows licensees, through the OVF Reporting Dashboard, to download email lists of voters on demand, supporting proactive communications programs.
B. Clarify Usage of the FWAB
In 2012, the MOVE Act requirement expanding the use of the FWAB to all special, primary, and runoff elections for federal office went into effect. The OVF voter survey revealed that awareness of the FWAB has topped 50 percent for the first time and more than 1,000 respondents reported using a FWAB in 2012. However, many LEOs noted that FWABs were submitted and subsequently rejected
as ballots due to the fact that the voter did not first complete and file an FPCA to register and/or request an official ballot as required by UOCAVA. Voters’ incorrect use of the FWAB is problematic for LEOs, and tragic for the voters whose ballots are rejected. Indeed, there is a misunderstanding regarding which states honor the FWAB as a truly simultaneous registration and ballot, and in precisely which timeframe. Voters are, in some cases, being misled to believe the FWAB will act as a last minute registration and ballot in states
where this is not the case.
Further, specific study of the FWAB must be conducted about how it is used across all states, and websites and widgets offered for the FWAB should be upgraded to filter out non-qualifying voters based on the state-specific use of the FWAB. States should also consider the fact that voters would gladly opt for a one-step voter registration/ballot request process and consider this multi-function FWAB option as a positive reform.
C. Electronic Balloting Issues and Fixes
The dramatic increase in the use of technology in the voting process was evident in the results of both the 2012 Post-Election Voter Survey and LEO Survey. Voters are increasingly using electronic transmission methods such as email and internet download to send in forms and receive blank ballots. However, this technology has introduced a new set of problems into the voting process. Voters and LEOs reported printing difficulties, computer compatibility issues, emails being sent to spam folders and PDFs that would not open. These problems were especially frustrating for military voters who often could not receive their ballot via email due to the security settings of their military email addresses. Before these issues grow and become systemic, corrections should be made. Additionally, it is vital that technical support is provided where needed.
D. Validity of the FPCA Form
The MOVE Act removed the requirement that states honor a registration/ballot request form (Federal Post Card Application, FPCA) for two general election cycles (i.e., four years). However, this mandate has not been implemented uniformly. The 2012 Post-Election surveys found that some voters were able to receive a ballot in 2012 based on their 2010 forms, whereas other voters had to submit a form for each election (i.e., primary and general) in which they participated. OVF recommends that this provision be

Overseas vOte FOundatiOn and u.s. vOte FOundatiOn 2013 POst-electiOn survey rePOrt
8
amended to reinstate validity of the FPCA voter registration/absentee ballot request form over one complete general election cycle and that it be uniform for both military and civilian voters, which, as currently written, it is not.
E. Considerations for U.S. Domestic Absentee Voting
When examining the differences in absentee ballot request and delivery procedures, as was done in OVF’s development process for US Vote, it is difficult to ignore the lack of standards in forms, deadlines or eligibility to vote as a domestic absentee voter across the states. The fact that 14 states do not have forms to apply for an absentee ballot is evidence of how non-uniform and archaic this method of voting is within the U.S. and how starkly it contrasts with the policies and procedures of overseas and military UOCAVA voting.
Significant and meaningful investments have already been made in technology and system development, election administration procedures, and reporting to support UOCAVA absentee voting across all states and local jurisdictions. Overseas and military absentee voters benefit from UOCAVA’s uniformity: they are able to use one standardized form of voter registration and ballot request across all states; they are able to use one single application as a simultaneous voter registration and absentee ballot request; and they have an emergency write-in ballot as a fall-back in the event their requested ballot does not arrive. As a result of the MOVE mandates, UOCAVA voters also enjoy the convenience of online ballot request form generation, electronic methods for blank ballot delivery, and online ballot-tracking systems, which have been implemented and are broadly available. These mandates have had many positive impacts on the voting process, fewer registration/ballot request forms are rejected and more voters are receiving their ballots in a timely manner.
It was not possible to examine the obstacles in the depth that would be required for definitive policy recommendations through this first US Vote survey; however, the results combined with OVF’s experience and perspective in UOCAVA voting, lead OVF to suggest that states consider ways to alleviate the discrepancies in voter services between UOCAVA and domestic absentee voters. OVF recommends that states closely consider the benefits of service inherent in UOCAVA voting procedures when looking toward reasonable improvements in domestic absentee voting.
processes.processes.IV 2012 Post-Election Military and Overseas Voter Survey Report
In 2012, for the fifth consecutive general election cycle, OVF administered its unique post-election survey of overseas and military voters. This survey represents OVF’s commitment to collecting and analyzing time series data related to the overseas and military voter experience, and positions OVF at the forefront in the realm of research and development for the overseas and military voter community. Launched on Election Day, November 6, 2012, 13,677 military and overseas voters had completed the survey as of December 15, 2012. The 48-question voter survey focused primarily on issues affecting ballot request, blank ballot receipt, and voted ballot return. This election cycle, OVF introduced new questions designed to evaluate the increasing use of electronic methods to send and receive blank ballots. These new questions aim to determine whether voters were aware of, and able to use, new electronic transmission technologies, and what types of problems they may have encountered with this technology.
A. Methodology
Two different groups took the online voter survey, although the content and form of the survey remained constant across the two groups. The first group consisted of 97,091 individuals who received an online invitation from OVF to complete the survey. These invitations allowed one-time completion of the survey and were auto-disabled after use, or if forwarded. This list of individuals was compiled from the OVF mailing list. Of the invited respondents, 13,140 (13.5 percent) completed the survey. The second group of respondents was derived through an open URL to the survey. Any overseas voter who had not received an invitation could complete the survey through the open URL, an option that OVF also offered in 2010 and 2008. This election cycle, 537 individuals completed the survey through the open URL, which is our largest response rate through an open URL to date.
The combined number of respondents to the voter survey was 13,677. Partially completed surveys were not included in the calculated response rates or analyses. Unless otherwise indicated, the reported results are for the total number of respondents from both groups. The global distribution of respondents continues to be robust, with respondents coming from 160 countries and representing voters across all 50 states, the District of Columbia, and Guam. A full methodology report containing detailed information on question development, sampling, response rates and the promotion of the open URL is available upon request.
Overseas vOte FOundatiOn and u.s. vOte FOundatiOn 2013 POst-electiOn survey rePOrt
9
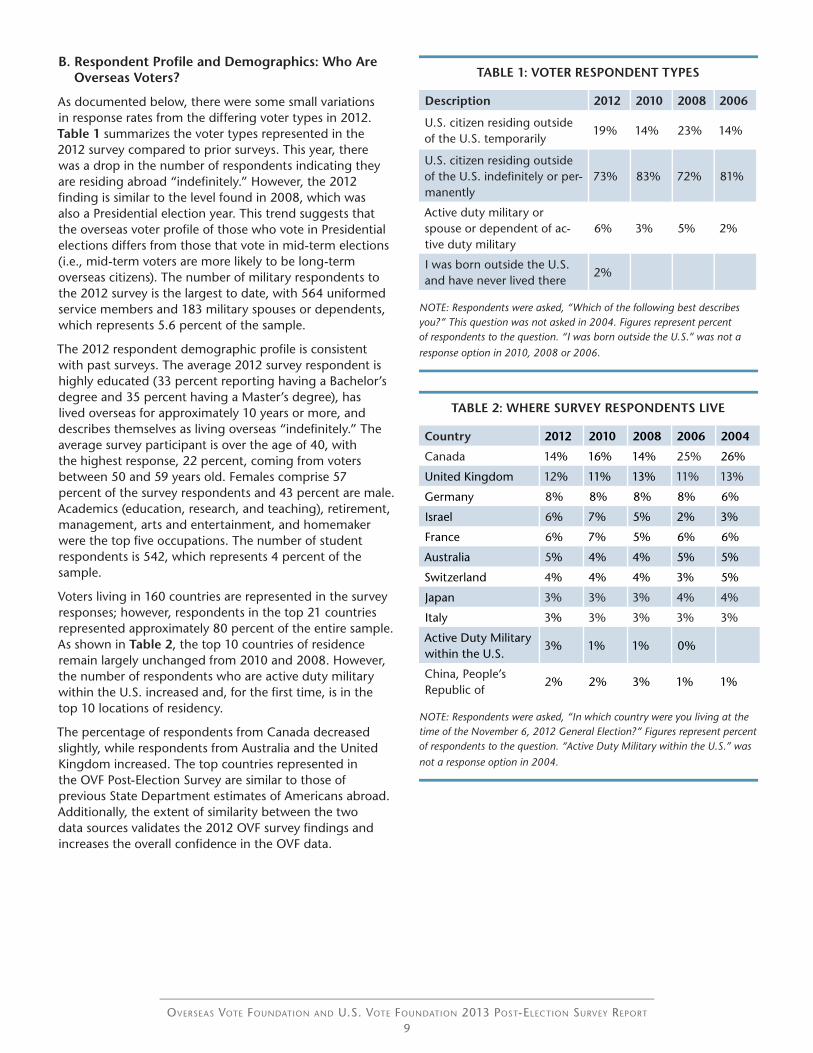
B. Respondent Profile and Demographics: Who Are Overseas Voters?
As documented below, there were some small variations in response rates from the differing voter types in 2012. Table 1 summarizes the voter types represented in the 2012 survey compared to prior surveys. This year, there was a drop in the number of respondents indicating they are residing abroad “indefinitely.” However, the 2012 finding is similar to the level found in 2008, which was also a Presidential election year. This trend suggests that the overseas voter profile of those who vote in Presidential elections differs from those that vote in mid-term elections (i.e., mid-term voters are more likely to be long-term overseas citizens). The number of military respondents to the 2012 survey is the largest to date, with 564 uniformed service members and 183 military spouses or dependents, which represents 5.6 percent of the sample.
The 2012 respondent demographic profile is consistent with past surveys. The average 2012 survey respondent is highly educated (33 percent reporting having a Bachelor’s degree and 35 percent having a Master’s degree), has lived overseas for approximately 10 years or more, and describes themselves as living overseas “indefinitely.” The average survey participant is over the age of 40, with the highest response, 22 percent, coming from voters between 50 and 59 years old. Females comprise 57 percent of the survey respondents and 43 percent are male. Academics (education, research, and teaching), retirement, management, arts and entertainment, and homemaker were the top five occupations. The number of student respondents is 542, which represents 4 percent of the sample.
Voters living in 160 countries are represented in the survey responses; however, respondents in the top 21 countries represented approximately 80 percent of the entire sample. As shown in Table 2, the top 10 countries of residence remain largely unchanged from 2010 and 2008. However, the number of respondents who are active duty military within the U.S. increased and, for the first time, is in the top 10 locations of residency.
The percentage of respondents from Canada decreased slightly, while respondents from Australia and the United Kingdom increased. The top countries represented in the OVF Post-Election Survey are similar to those of previous State Department estimates of Americans abroad. Additionally, the extent of similarity between the two data sources validates the 2012 OVF survey findings and increases the overall confidence in the OVF data.
TABLE 1: VOTER RESPONDENT TYPES
Description 2012 2010 2008 2006
U.S. citizen residing outside of the U.S. temporarily
19% 14% 23% 14%
U.S. citizen residing outside of the U.S. indefinitely or per-manently
73% 83% 72% 81%
Active duty military or spouse or dependent of ac-tive duty military
6% 3% 5% 2%
I was born outside the U.S. and have never lived there
2%
NOTE: Respondents were asked, “Which of the following best describes you?” This question was not asked in 2004. Figures represent percent of respondents to the question. “I was born outside the U.S.” was not a response option in 2010, 2008 or 2006.
TABLE 2: WHERE SURVEY RESPONDENTS LIVE
Country 2012 2010 2008 2006 2004
Canada 14% 16% 14% 25% 26%
United Kingdom 12% 11% 13% 11% 13%
Germany 8% 8% 8% 8% 6%
Israel 6% 7% 5% 2% 3%
France 6% 7% 5% 6% 6%
Australia 5% 4% 4% 5% 5%
Switzerland 4% 4% 4% 3% 5%
Japan 3% 3% 3% 4% 4%
Italy 3% 3% 3% 3% 3%
Active Duty Military within the U.S.
3% 1% 1% 0%
China, People’s Republic of
2% 2% 3% 1% 1%
NOTE: Respondents were asked, “In which country were you living at the time of the November 6, 2012 General Election?” Figures represent percent of respondents to the question. “Active Duty Military within the U.S.” was not a response option in 2004.
Overseas vOte FOundatiOn and u.s. vOte FOundatiOn 2013 POst-electiOn survey rePOrt
10
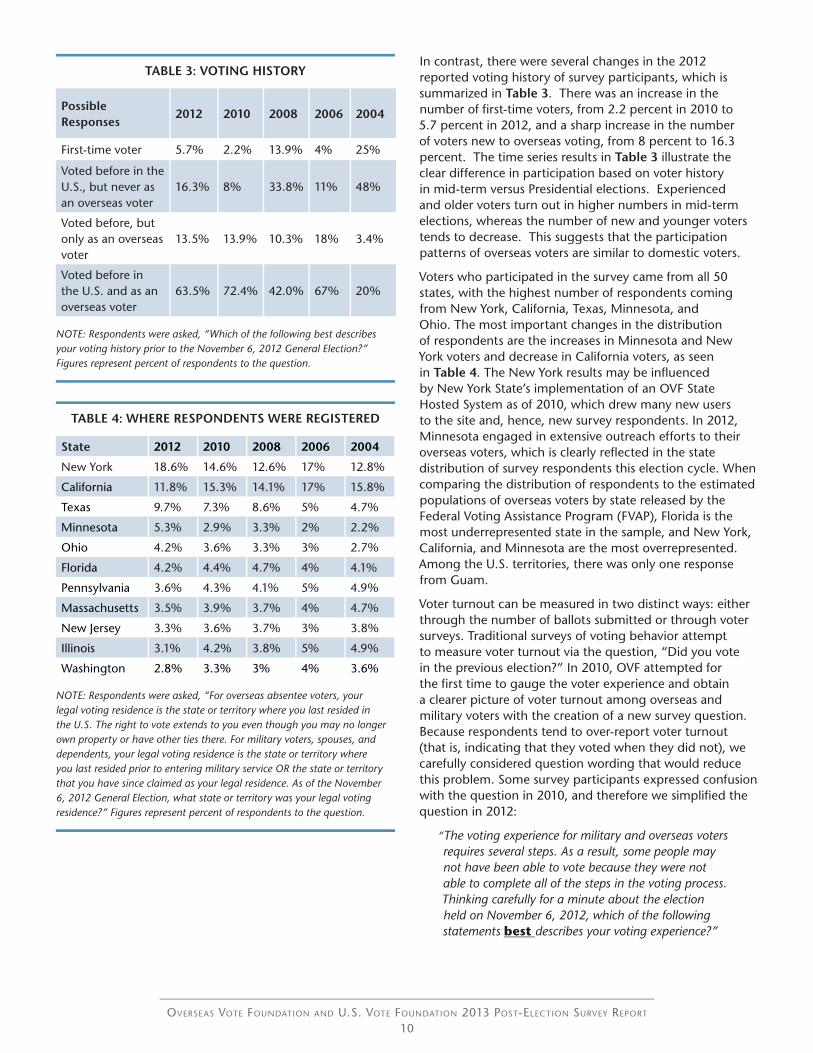
In contrast, there were several changes in the 2012 reported voting history of survey participants, which is summarized in Table 3. There was an increase in the number of first-time voters, from 2.2 percent in 2010 to 5.7 percent in 2012, and a sharp increase in the number of voters new to overseas voting, from 8 percent to 16.3 percent. The time series results in Table 3 illustrate the clear difference in participation based on voter history in mid-term versus Presidential elections. Experienced and older voters turn out in higher numbers in mid-term elections, whereas the number of new and younger voters tends to decrease. This suggests that the participation patterns of overseas voters are similar to domestic voters.
Voters who participated in the survey came from all 50 states, with the highest number of respondents coming from New York, California, Texas, Minnesota, and Ohio. The most important changes in the distribution of respondents are the increases in Minnesota and New York voters and decrease in California voters, as seen in Table 4. The New York results may be influenced by New York State’s implementation of an OVF State Hosted System as of 2010, which drew many new users to the site and, hence, new survey respondents. In 2012, Minnesota engaged in extensive outreach efforts to their overseas voters, which is clearly reflected in the state distribution of survey respondents this election cycle. When comparing the distribution of respondents to the estimated populations of overseas voters by state released by the Federal Voting Assistance Program (FVAP), Florida is the most underrepresented state in the sample, and New York, California, and Minnesota are the most overrepresented. Among the U.S. territories, there was only one response from Guam.
Voter turnout can be measured in two distinct ways: either through the number of ballots submitted or through voter surveys. Traditional surveys of voting behavior attempt to measure voter turnout via the question, “Did you vote in the previous election?” In 2010, OVF attempted for the first time to gauge the voter experience and obtain a clearer picture of voter turnout among overseas and military voters with the creation of a new survey question. Because respondents tend to over-report voter turnout (that is, indicating that they voted when they did not), we carefully considered question wording that would reduce this problem. Some survey participants expressed confusion with the question in 2010, and therefore we simplified the question in 2012:
“The voting experience for military and overseas voters requires several steps. As a result, some people may not have been able to vote because they were not able to complete all of the steps in the voting process. Thinking carefully for a minute about the election held on November 6, 2012, which of the following statements best describes your voting experience?”
TABLE 3: VOTING HISTORY
Possible Responses
2012 2010 2008 2006 2004
First-time voter 5.7% 2.2% 13.9% 4% 25%
Voted before in the U.S., but never as an overseas voter
16.3% 8% 33.8% 11% 48%
Voted before, but only as an overseas voter
13.5% 13.9% 10.3% 18% 3.4%
Voted before in the U.S. and as an overseas voter
63.5% 72.4% 42.0% 67% 20%
NOTE: Respondents were asked, “Which of the following best describes your voting history prior to the November 6, 2012 General Election?” Figures represent percent of respondents to the question.
TABLE 4: WHERE RESPONDENTS WERE REGISTERED
State 2012 2010 2008 2006 2004
New York 18.6% 14.6% 12.6% 17% 12.8%
California 11.8% 15.3% 14.1% 17% 15.8%
Texas 9.7% 7.3% 8.6% 5% 4.7%
Minnesota 5.3% 2.9% 3.3% 2% 2.2%
Ohio 4.2% 3.6% 3.3% 3% 2.7%
Florida 4.2% 4.4% 4.7% 4% 4.1%
Pennsylvania 3.6% 4.3% 4.1% 5% 4.9%
Massachusetts 3.5% 3.9% 3.7% 4% 4.7%
New Jersey 3.3% 3.6% 3.7% 3% 3.8%
Illinois 3.1% 4.2% 3.8% 5% 4.9%
Washington 2.8% 3.3% 3% 4% 3.6%
NOTE: Respondents were asked, “For overseas absentee voters, your legal voting residence is the state or territory where you last resided in the U.S. The right to vote extends to you even though you may no longer own property or have other ties there. For military voters, spouses, and dependents, your legal voting residence is the state or territory where you last resided prior to entering military service OR the state or territory that you have since claimed as your legal residence. As of the November 6, 2012 General Election, what state or territory was your legal voting residence?” Figures represent percent of respondents to the question.
Overseas vOte FOundatiOn and u.s. vOte FOundatiOn 2013 POst-electiOn survey rePOrt
11
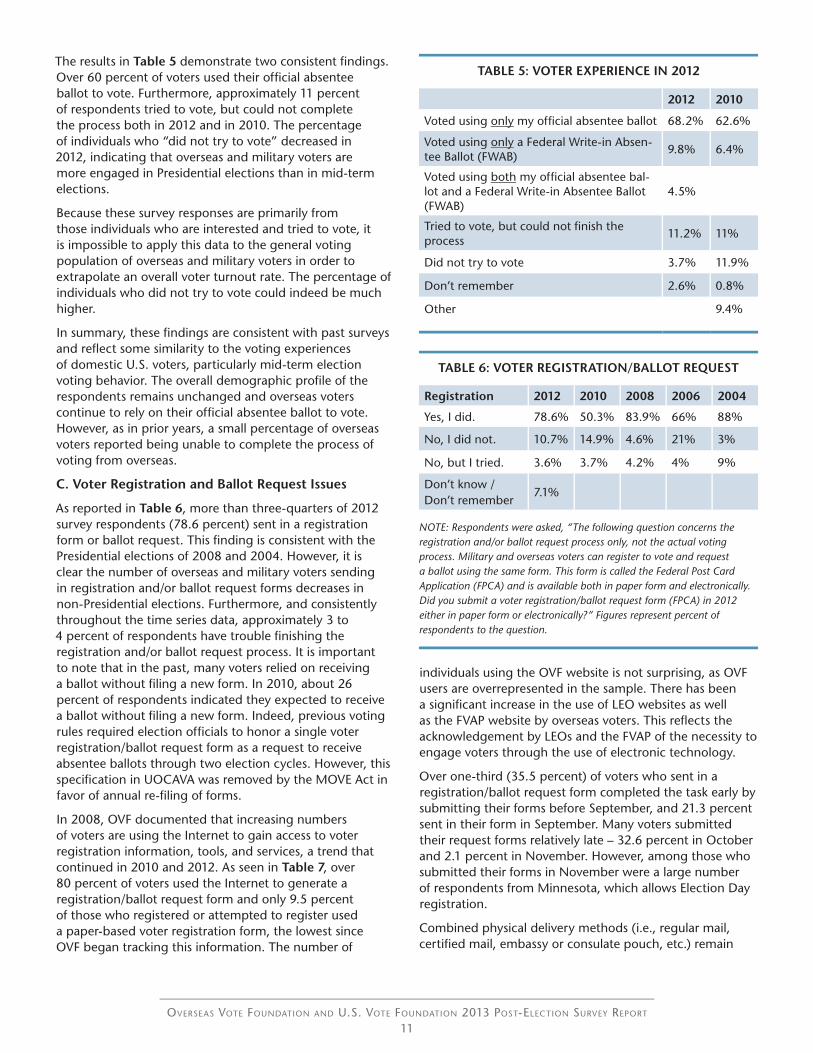
The results in Table 5 demonstrate two consistent findings. Over 60 percent of voters used their official absentee ballot to vote. Furthermore, approximately 11 percent of respondents tried to vote, but could not complete the process both in 2012 and in 2010. The percentage of individuals who “did not try to vote” decreased in 2012, indicating that overseas and military voters are more engaged in Presidential elections than in mid-term elections.
Because these survey responses are primarily from those individuals who are interested and tried to vote, it is impossible to apply this data to the general voting population of overseas and military voters in order to extrapolate an overall voter turnout rate. The percentage of individuals who did not try to vote could indeed be much higher.
In summary, these findings are consistent with past surveys and reflect some similarity to the voting experiences of domestic U.S. voters, particularly mid-term election voting behavior. The overall demographic profile of the respondents remains unchanged and overseas voters continue to rely on their official absentee ballot to vote. However, as in prior years, a small percentage of overseas voters reported being unable to complete the process of voting from overseas.
C. Voter Registration and Ballot Request Issues
As reported in Table 6, more than three-quarters of 2012 survey respondents (78.6 percent) sent in a registration form or ballot request. This finding is consistent with the Presidential elections of 2008 and 2004. However, it is clear the number of overseas and military voters sending in registration and/or ballot request forms decreases in non-Presidential elections. Furthermore, and consistently throughout the time series data, approximately 3 to 4 percent of respondents have trouble finishing the registration and/or ballot request process. It is important to note that in the past, many voters relied on receiving a ballot without filing a new form. In 2010, about 26 percent of respondents indicated they expected to receive a ballot without filing a new form. Indeed, previous voting rules required election officials to honor a single voter registration/ballot request form as a request to receive absentee ballots through two election cycles. However, this specification in UOCAVA was removed by the MOVE Act in favor of annual re-filing of forms.
In 2008, OVF documented that increasing numbers of voters are using the Internet to gain access to voter registration information, tools, and services, a trend that continued in 2010 and 2012. As seen in Table 7, over 80 percent of voters used the Internet to generate a registration/ballot request form and only 9.5 percent of those who registered or attempted to register used a paper-based voter registration form, the lowest since OVF began tracking this information. The number of
individuals using the OVF website is not surprising, as OVF users are overrepresented in the sample. There has been a significant increase in the use of LEO websites as well as the FVAP website by overseas voters. This reflects the acknowledgement by LEOs and the FVAP of the necessity to engage voters through the use of electronic technology.
Over one-third (35.5 percent) of voters who sent in a registration/ballot request form completed the task early by submitting their forms before September, and 21.3 percent sent in their form in September. Many voters submitted their request forms relatively late – 32.6 percent in October and 2.1 percent in November. However, among those who submitted their forms in November were a large number of respondents from Minnesota, which allows Election Day registration.
Combined physical delivery methods (i.e., regular mail, certified mail, embassy or consulate pouch, etc.) remain
TABLE 5: VOTER EXPERIENCE IN 2012
2012 2010
Voted using only my official absentee ballot 68.2% 62.6%
Voted using only a Federal Write-in Absen-tee Ballot (FWAB)
9.8% 6.4%
Voted using both my official absentee bal-lot and a Federal Write-in Absentee Ballot (FWAB)
4.5%
Tried to vote, but could not finish the process
11.2% 11%
Did not try to vote 3.7% 11.9%
Don’t remember 2.6% 0.8%
Other 9.4%
TABLE 6: VOTER REGISTRATION/BALLOT REQUEST
Registration 2012 2010 2008 2006 2004
Yes, I did. 78.6% 50.3% 83.9% 66% 88%
No, I did not. 10.7% 14.9% 4.6% 21% 3%
No, but I tried. 3.6% 3.7% 4.2% 4% 9%
Don’t know / Don’t remember
7.1%
NOTE: Respondents were asked, “The following question concerns the registration and/or ballot request process only, not the actual voting process. Military and overseas voters can register to vote and request a ballot using the same form. This form is called the Federal Post Card Application (FPCA) and is available both in paper form and electronically. Did you submit a voter registration/ballot request form (FPCA) in 2012 either in paper form or electronically?” Figures represent percent of respondents to the question.

Overseas vOte FOundatiOn and u.s. vOte FOundatiOn 2013 POst-electiOn survey rePOrt
12
the dominant means for submitting registration/ballot request forms and represented 57.8 percent of returns in 2012. This is down from 71 percent in 2010. Furthermore, the number of individuals using electronic methods, such as fax and email, to return their registration/ballot request forms continued to increase in this election cycle, up to 34.9 percent (compared to 23 percent in 2010 and 18 percent in 2008). These results are summarized in Table 8. The continued importance of postal methods may indicate a preference among voters or it may also be due to Internet limitations in some areas. Furthermore, many states require a wet signature in order to process forms; therefore, voters most often submit a signed original form. It should be noted that OVF recommends that all forms be sent via post.
As in 2010 and 2008, voter registration/ballot request forms submitted on paper positively influenced whether or not a voter received a ballot, as seen in Table 9. Of those voters who used an electronic method to send in a voter registration/ballot request form, 18.7 percent did not receive a ballot, whereas only 14.4 percent of those who used physical postal methods did not get a ballot. Although this is an improvement over 2010, when 22 percent who sent in a form electronically did not receive a ballot, it appears that electronic submission methods are not a more certain way of ensuring a ballot arrives. Furthermore, when examining electronic methods only, versus those voters who used an electronic method AND sent in a hard copy in 2012, those who sent in a hard copy were less likely to receive a ballot (nearly 20 percent did not receive a ballot) than those who just sent in a form electronically.
In 2012, 1,327 voters, or 10.7 percent, did not submit a voter registration/ballot request form. The majority of these respondents (50 percent) thought they were still registered. Of those that assumed they were still registered and did not submit a form, nearly 80 percent did in fact receive a ballot, but 20.5 percent did not. As with those individuals who could not complete the process, many missed the deadline (8 percent), as seen in Table 10. Only a small number of respondents (449, or 3.6 percent) attempted to submit a voter registration/ballot request form, but could not complete the process.
One of the most important technological advancements in the last two election cycles has been the ability of voters to check their voter registration status online. Most states offer new voter services websites where individuals can look up voter information and check their registration status. Unfortunately, usage of these tools remains minimal; only 28.6 percent of voters took advantage of these new tools, an increase from 10 percent in 2010. The primary reason for this continued low usage appears to be lack of awareness of these state websites. OVF received many emails and comments in the survey asking where state registration look-up could be found. Election officials are to
TABLE 7: TOP REGISTRATION METHODS
2012 2010 2008
Invi
tati
on
On
ly
Res
po
nse
s
Op
en U
RL
Res
po
nse
s
Invi
tati
on
On
ly
Res
po
nse
s
Op
en U
RL
Res
po
nse
s
Invi
tati
on
On
ly
Res
po
nse
s
Op
en U
RL
Res
po
nse
s
OVF Website 53.2% 24.3% 75.6% 22.8% 67.9% 32.9%
Paper Provided by Local Election Office
8.1% 10.4% 11.3% 18.3% 6.2% 14.7%
State Website 5.2% 7.3% 9.2% 22.8% 5.1% 8.7%
Local Election Office Website
8.1% 14.6% 8% 16.4% 2.6% 6.3%
FVAP Website 14.6% 26.4% 6.1% 12.7% 5.4% 13.9%
NOTE: Respondents were asked, “Which of the following did you use to complete the voter registration/ballot request form in 2012?” “State Website” and “Youth Vote Overseas Website” were not response options in the 2006. “FPCA Form” was not a response option in 2006 and 2008. Figures represent percent of respondents to the question. Controlled survey responses are derived from the invitation only responses from the OVF mailing list. Open survey responses come from the use of an open URL.
TABLE 8: METHODS FOR SENDING IN REGISTRATION/BALLOT REQUESTS
Method 2012 2010 2008 2006
Regular Mail 45.1% 58% 59.9% 73%
Email 17% 10% 5.9% 5%
Email + original by mail 10.4% 5.5% 3.9%
Certified Mail 5% 3.9% 5.5% 7%
Delivered in person or mailed in the U.S.
3.3% 2.8% 3.2% 2%
Fax 3.2% 2.7% 3.7%
Embassy or Consulate mail pouch
3.1% 1.4% 2.3% 2%
Fax + original by mail 2.6% 2.8% 4.7% 6%
FedEx, DHL, or other commercial courier
2.4% 1.9% 4.3% 2%
Military Post 2.2% 2.2% 2.0% 2%
Uploaded it to my election office voting system website
1.7% 1%
NOTE: Respondents were asked, “How did you send in your voter registration/ballot request form?”. Figures represent percent of respondents to the question. The response options changed from 2006 to 2008 and again in 2010.
Overseas vOte FOundatiOn and u.s. vOte FOundatiOn 2013 POst-electiOn survey rePOrt
13
TABLE 9: METHODS FOR SENDING IN REGISTRATION/BALLOT REQUESTS; RECEIPT OF A BALLOT
Did you receive your official ballot?
How did you send in your voter registration/ballot request form?
Yes No Total
Postal Methods 4,729(85.6%)
796(14.4%)
5,525
Electronic Methods 2,716(81.3%)
624(18.7%)
3,340
Delivered in Person or Mailed in the U.S.
265(84.9%)
47(15.1%)
312
Don’t know / Don’t remem-ber
227(82.2%)
49(17.8%)
276
Other 66(59.5%)
45(40.5%)
111
Total 8,003(83.7%)
1,561(16.3%)
9,564
NOTE: Respondents were asked, “How did you send in your voter registration/ballot request form?” and “Did you receive your official ballot from your election official for the November 6, 2012 General Election?”
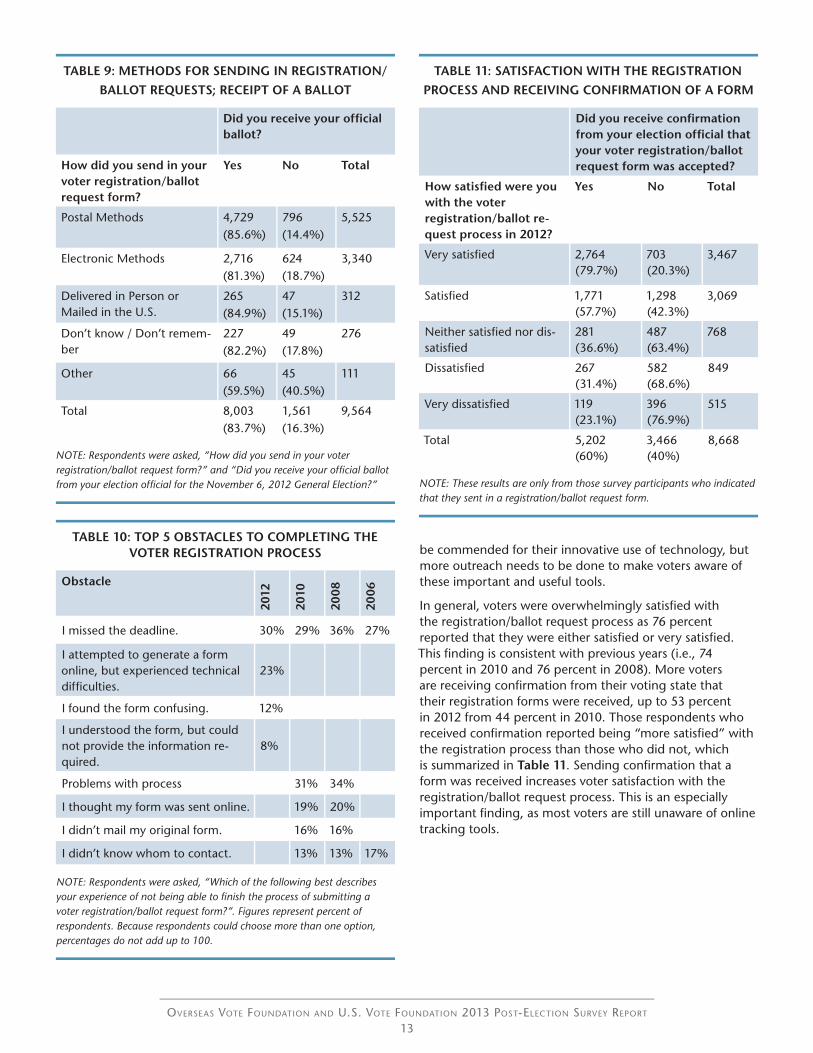
be commended for their innovative use of technology, but more outreach needs to be done to make voters aware of these important and useful tools.
In general, voters were overwhelmingly satisfied with the registration/ballot request process as 76 percent reported that they were either satisfied or very satisfied. This finding is consistent with previous years (i.e., 74 percent in 2010 and 76 percent in 2008). More voters are receiving confirmation from their voting state that their registration forms were received, up to 53 percent in 2012 from 44 percent in 2010. Those respondents who received confirmation reported being “more satisfied” with the registration process than those who did not, which is summarized in Table 11. Sending confirmation that a form was received increases voter satisfaction with the registration/ballot request process. This is an especially important finding, as most voters are still unaware of online tracking tools.
TABLE 10: TOP 5 OBSTACLES TO COMPLETING THE VOTER REGISTRATION PROCESS
Obstacle
2012
2010
2008
2006
I missed the deadline. 30% 29% 36% 27%
I attempted to generate a form online, but experienced technical difficulties.
23%
I found the form confusing. 12%
I understood the form, but could not provide the information re-quired.
8%
Problems with process 31% 34%
I thought my form was sent online. 19% 20%
I didn’t mail my original form. 16% 16%
I didn’t know whom to contact. 13% 13% 17%
NOTE: Respondents were asked, “Which of the following best describes your experience of not being able to finish the process of submitting a voter registration/ballot request form?”. Figures represent percent of respondents. Because respondents could choose more than one option, percentages do not add up to 100.
TABLE 11: SATISFACTION WITH THE REGISTRATION PROCESS AND RECEIVING CONFIRMATION OF A FORM
Did you receive confirmation from your election official that your voter registration/ballot request form was accepted?
How satisfied were you with the voter registration/ballot re-quest process in 2012?
Yes No Total
Very satisfied 2,764(79.7%)
703(20.3%)
3,467
Satisfied 1,771(57.7%)
1,298(42.3%)
3,069
Neither satisfied nor dis-satisfied
281(36.6%)
487(63.4%)
768
Dissatisfied 267(31.4%)
582(68.6%)
849
Very dissatisfied 119(23.1%)
396(76.9%)
515
Total 5,202(60%)
3,466(40%)
8,668
NOTE: These results are only from those survey participants who indicated that they sent in a registration/ballot request form.
Overseas vOte FOundatiOn and u.s. vOte FOundatiOn 2013 POst-electiOn survey rePOrt
14
We can draw four important conclusions from these results. First, the findings concerning the registration/ballot request process demonstrate that voters are continuing to move from using paper methods to electronic methods to complete registration/ballot request forms. Second, confusing forms and technical difficulties hinder some voters from completing the process. Third, a small portion of voters continue to send in forms late and miss deadlines. Finally, although satisfaction with the registration process continues to be high, voters that received confirmation of their registration status were more satisfied than those who did not.
D. Ballot Issues
After registration and ballot request, the next step in overseas and military absentee voting is receiving a blank ballot. In 2012, 80.5 percent of respondents received their ballots, while 17.3 percent did not. This is a slight improvement from 2010, when 18.2 percent did not get their ballot, and a more significant, nearly 5 percent improvement from 2008, when 22 percent did not get their ballot.
In 2010, the MOVE Act impacted how and when voters received their ballots: states were required to provide voters with an option for the electronic receipt of blank ballots in order to accelerate the voting process timeline and optimize the time available to vote. In 2010, there was a small shift toward the receipt of blank ballots using electronic methods, but voters continued to favor postal methods to receive their blank ballots.
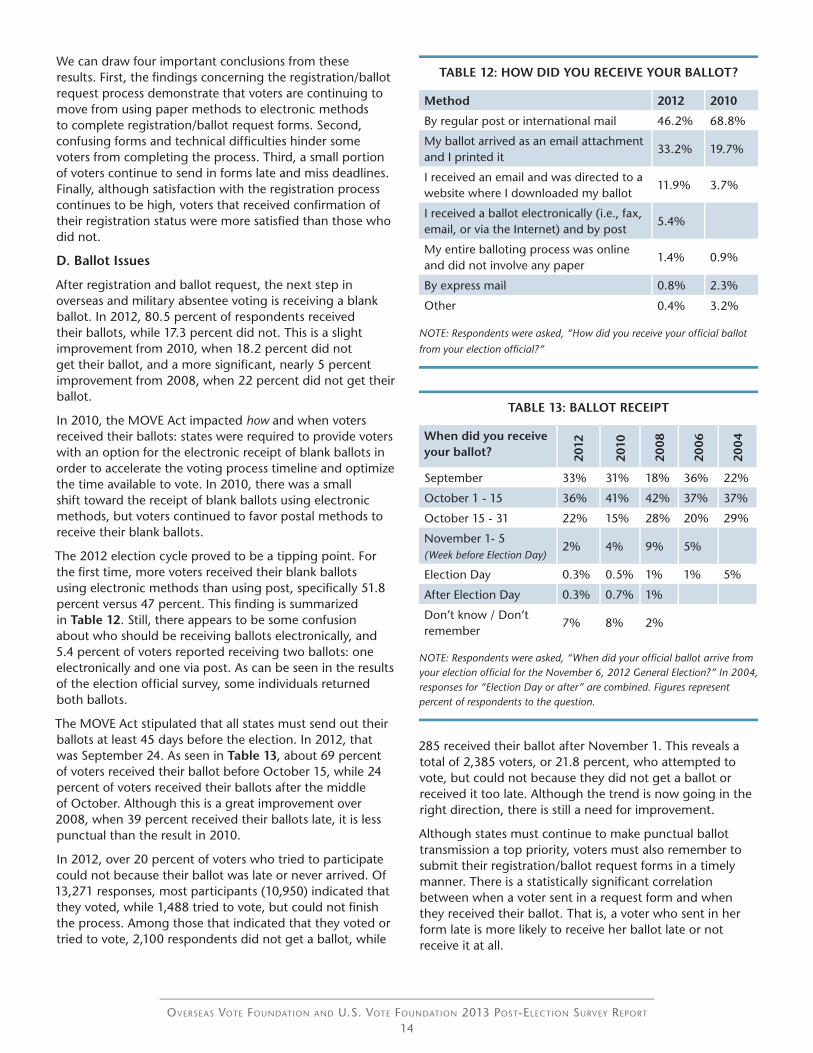
The 2012 election cycle proved to be a tipping point. For the first time, more voters received their blank ballots using electronic methods than using post, specifically 51.8 percent versus 47 percent. This finding is summarized in Table 12. Still, there appears to be some confusion about who should be receiving ballots electronically, and 5.4 percent of voters reported receiving two ballots: one electronically and one via post. As can be seen in the results of the election official survey, some individuals returned both ballots.
The MOVE Act stipulated that all states must send out their ballots at least 45 days before the election. In 2012, that was September 24. As seen in Table 13, about 69 percent of voters received their ballot before October 15, while 24 percent of voters received their ballots after the middle of October. Although this is a great improvement over 2008, when 39 percent received their ballots late, it is less punctual than the result in 2010.
In 2012, over 20 percent of voters who tried to participate could not because their ballot was late or never arrived. Of 13,271 responses, most participants (10,950) indicated that they voted, while 1,488 tried to vote, but could not finish the process. Among those that indicated that they voted or tried to vote, 2,100 respondents did not get a ballot, while
285 received their ballot after November 1. This reveals a total of 2,385 voters, or 21.8 percent, who attempted to vote, but could not because they did not get a ballot or received it too late. Although the trend is now going in the right direction, there is still a need for improvement.
Although states must continue to make punctual ballot transmission a top priority, voters must also remember to submit their registration/ballot request forms in a timely manner. There is a statistically significant correlation between when a voter sent in a request form and when they received their ballot. That is, a voter who sent in her form late is more likely to receive her ballot late or not receive it at all.
TABLE 12: HOW DID YOU RECEIVE YOUR BALLOT?
Method 2012 2010
By regular post or international mail 46.2% 68.8%
My ballot arrived as an email attachment and I printed it
33.2% 19.7%
I received an email and was directed to a website where I downloaded my ballot
11.9% 3.7%
I received a ballot electronically (i.e., fax, email, or via the Internet) and by post
5.4%
My entire balloting process was online and did not involve any paper
1.4% 0.9%
By express mail 0.8% 2.3%
Other 0.4% 3.2%
NOTE: Respondents were asked, “How did you receive your official ballot from your election official?”
TABLE 13: BALLOT RECEIPT
When did you receive your ballot? 20
12
2010
2008
2006
2004
September 33% 31% 18% 36% 22%
October 1 - 15 36% 41% 42% 37% 37%
October 15 - 31 22% 15% 28% 20% 29%
November 1- 5(Week before Election Day)
2% 4% 9% 5%
Election Day 0.3% 0.5% 1% 1% 5%
After Election Day 0.3% 0.7% 1%
Don’t know / Don‘t remember
7% 8% 2%
NOTE: Respondents were asked, “When did your official ballot arrive from your election official for the November 6, 2012 General Election?” In 2004, responses for “Election Day or after” are combined. Figures represent percent of respondents to the question.
Overseas vOte FOundatiOn and u.s. vOte FOundatiOn 2013 POst-electiOn survey rePOrt
15
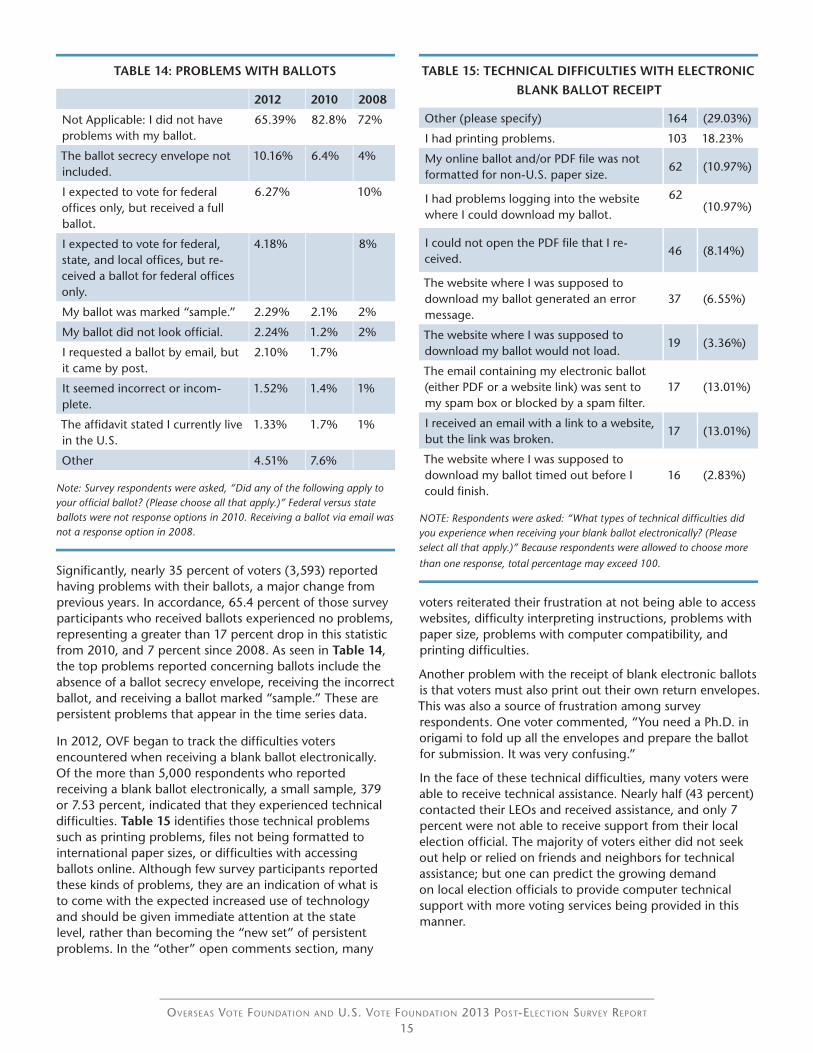
Significantly, nearly 35 percent of voters (3,593) reported having problems with their ballots, a major change from previous years. In accordance, 65.4 percent of those survey participants who received ballots experienced no problems, representing a greater than 17 percent drop in this statistic from 2010, and 7 percent since 2008. As seen in Table 14, the top problems reported concerning ballots include the absence of a ballot secrecy envelope, receiving the incorrect ballot, and receiving a ballot marked “sample.” These are persistent problems that appear in the time series data.
TABLE 14: PROBLEMS WITH BALLOTS
2012 2010 2008
Not Applicable: I did not have problems with my ballot.
65.39% 82.8% 72%
The ballot secrecy envelope not included.
10.16% 6.4% 4%
I expected to vote for federal offices only, but received a full ballot.
6.27% 10%
I expected to vote for federal, state, and local offices, but re-ceived a ballot for federal offices only.
4.18% 8%
My ballot was marked “sample.” 2.29% 2.1% 2%
My ballot did not look official. 2.24% 1.2% 2%
I requested a ballot by email, but it came by post.
2.10% 1.7%
It seemed incorrect or incom-plete.
1.52% 1.4% 1%
The affidavit stated I currently live in the U.S.
1.33% 1.7% 1%
Other 4.51% 7.6%
Note: Survey respondents were asked, “Did any of the following apply to your official ballot? (Please choose all that apply.)” Federal versus state ballots were not response options in 2010. Receiving a ballot via email was not a response option in 2008.
TABLE 15: TECHNICAL DIFFICULTIES WITH ELECTRONIC BLANK BALLOT RECEIPT
Other (please specify) 164 (29.03%)
I had printing problems. 103 18.23%
My online ballot and/or PDF file was not formatted for non-U.S. paper size.
62 (10.97%)
I had problems logging into the website where I could download my ballot.
62(10.97%)
I could not open the PDF file that I re-ceived.
46 (8.14%)
The website where I was supposed to download my ballot generated an error message.
37 (6.55%)
The website where I was supposed to download my ballot would not load.
19 (3.36%)
The email containing my electronic ballot (either PDF or a website link) was sent to my spam box or blocked by a spam filter.
17 (13.01%)
I received an email with a link to a website, but the link was broken.
17 (13.01%)
The website where I was supposed to download my ballot timed out before I could finish.
16 (2.83%)
NOTE: Respondents were asked: “What types of technical difficulties did you experience when receiving your blank ballot electronically? (Please select all that apply.)” Because respondents were allowed to choose more than one response, total percentage may exceed 100.
In 2012, OVF began to track the difficulties voters encountered when receiving a blank ballot electronically. Of the more than 5,000 respondents who reported receiving a blank ballot electronically, a small sample, 379 or 7.53 percent, indicated that they experienced technical difficulties. Table 15 identifies those technical problems such as printing problems, files not being formatted to international paper sizes, or difficulties with accessing ballots online. Although few survey participants reported these kinds of problems, they are an indication of what is to come with the expected increased use of technology and should be given immediate attention at the state level, rather than becoming the “new set” of persistent problems. In the “other” open comments section, many
voters reiterated their frustration at not being able to access websites, difficulty interpreting instructions, problems with paper size, problems with computer compatibility, and printing difficulties.
Another problem with the receipt of blank electronic ballots is that voters must also print out their own return envelopes. This was also a source of frustration among survey respondents. One voter commented, “You need a Ph.D. in origami to fold up all the envelopes and prepare the ballot for submission. It was very confusing.”
In the face of these technical difficulties, many voters were able to receive technical assistance. Nearly half (43 percent) contacted their LEOs and received assistance, and only 7 percent were not able to receive support from their local election official. The majority of voters either did not seek out help or relied on friends and neighbors for technical assistance; but one can predict the growing demand on local election officials to provide computer technical support with more voting services being provided in this manner.

Overseas vOte FOundatiOn and u.s. vOte FOundatiOn 2013 POst-electiOn survey rePOrt
16
TABLE 16: BALLOT RETURN
When did you return your ballot?
2012 2010 2008 2006
September 9.6% 9.5% 6% 9%
October 1 to October 15 31% 31.8% 30% 24%
October 15 to October 31 47.2% 39.7% 46% 43%
November 1 to November 5(Week before the Election)
8.5% 13.9% 15% 18%
Election Day 1.4% 2.3% 2% 3%
Don’t know / Don’t remem-ber
2.4% 2.6% 1% 2%
NOTE: Respondents were asked, “When did you return your completed ballot for the November 6, 2012 General Election?”
TABLE 17: METHODS FOR RETURNING BALLOTS
Method 2012 2010 2008 2006 2004
Regular Mail 63.3% 71.9% 68% 79% 62%
Certified Mail 6.7% 5.3% 7% 7% 21%
FedEx, DHL, or other commercial courier
3.6% 2.9% 5% 3% 6%
Embassy or Con-sulate mail pouch
3.8% 1.6% 3% 2% 4%
Express Your Vote (OVF/FedEx)
0.5% 1.4% 3%
Military Post 2.5% 2.1% 2% 1% 1%
Fax 4.8% 4.2%
Email 9.6% 4.9%
I uploaded my ballot onto the official election website
0.5%
Delivered it in person or mailed in U.S.
3.9% 3.3%
NOTE: Respondents were asked, “How did you return your completed ballot for the November 6, 2012 General Election?” In 2004, questions about the method for sending in registration request were combined with questions about ballot return. Figures represent percent of respondents.
Approximately 95 percent of respondents returned their official ballot. Table 16 demonstrates that the most voters (47.2 percent) sent their ballots back during the second half of October. If standard postal methods take approximately one to two weeks, a ballot must leave the voter at least 10 days before Election Day in order to arrive in the U.S. on time. The number of individuals returning ballots the week before the election or on Election Day decreased from 16 percent in 2010 to 10 percent in 2012. This positive trend indicates that more voters are returning their ballots earlier, which decreases the risk that their ballot will be rejected for arriving too late.
As in previous elections, some form of physical post was used to return ballots, representing 80.4 percent of cases, down from 85 percent in 2010 as seen in Table 17. As states expanded the use of fax and email for the return of voted ballots, voters began to utilize these online transmission services. Those using either fax or email to return their voted ballot in 2012 comprised 14.9 percent of survey respondents, up from 9.5 percent in 2010.
Additionally, 455 respondents (5 percent) did not return their official ballot from their election official for the November 6, 2012 General Election. Of the voters that did not return their ballots, 123 received their ballot too late. Many of the respondents who indicated they did not send in their official ballot reported they sent in an electronic or downloadable ballot instead of a paper ballot. Indeed, some respondents expressed confusion at what constitutes their official ballot. This suggests further clarity is needed to voters from the state level to ensure the appropriate ballots are returned.
One common question that OVF receives from voters is, “How can I be sure my ballot was received?” In order to help, the MOVE Act mandated that states create a ballot-tracking mechanism (Section 580(h)). In 2012, most states offered a voter services website where individuals could track their ballot in order to determine if it was received. Unfortunately, only 13.5 percent of voters took advantage of these services.
Despite deadlines and problems with envelopes, 85 percent of those voters who received a ballot and voted reported being either “very satisfied” or “satisfied” with the balloting process, and 75 percent with the registration process, which is consistent with previous years. Satisfaction with the balloting process is higher than the registration processing 2012. When the time series data is examined, voter satisfaction tends to be stable over time.
In summary, OVF can confidently conclude that the influence of the MOVE Act reform has positively impacted the voter experience. Increasing numbers of voters are using electronic methods to receive their blank ballots and return voted ballots. As more states comply with the 45-day blank ballot transit rule, fewer voters are receiving their ballots late and more are returning them earlier.
Overseas vOte FOundatiOn and u.s. vOte FOundatiOn 2013 POst-electiOn survey rePOrt
17
TABLE 18: SATISFACTION WITH THE VOTING PROCESS
Satisfaction 2012 2010 2008 2006 2004
Reg Ballot Reg Ballot Reg Ballot Reg Ballot
Very Satisfied 39% 47% 39% 48% 43% 47% 45% 44%
Satisfied 37% 38% 36% 38% 33% 38% 35% 42% 72%
Neutral 9% 8% 12% 9% 10% 9% 10% 9%
Dissatisfied 9% 6% 7% 4% 7% 4% 4% 4% 28%
Very dissatisfied 6% 1% 6% 1% 7% 2% 5% 2%
NOTE: In 2004, respondents were asked if they were satisfied or dissatisfied with the experience as a whole. “Reg” refers to “registration”.
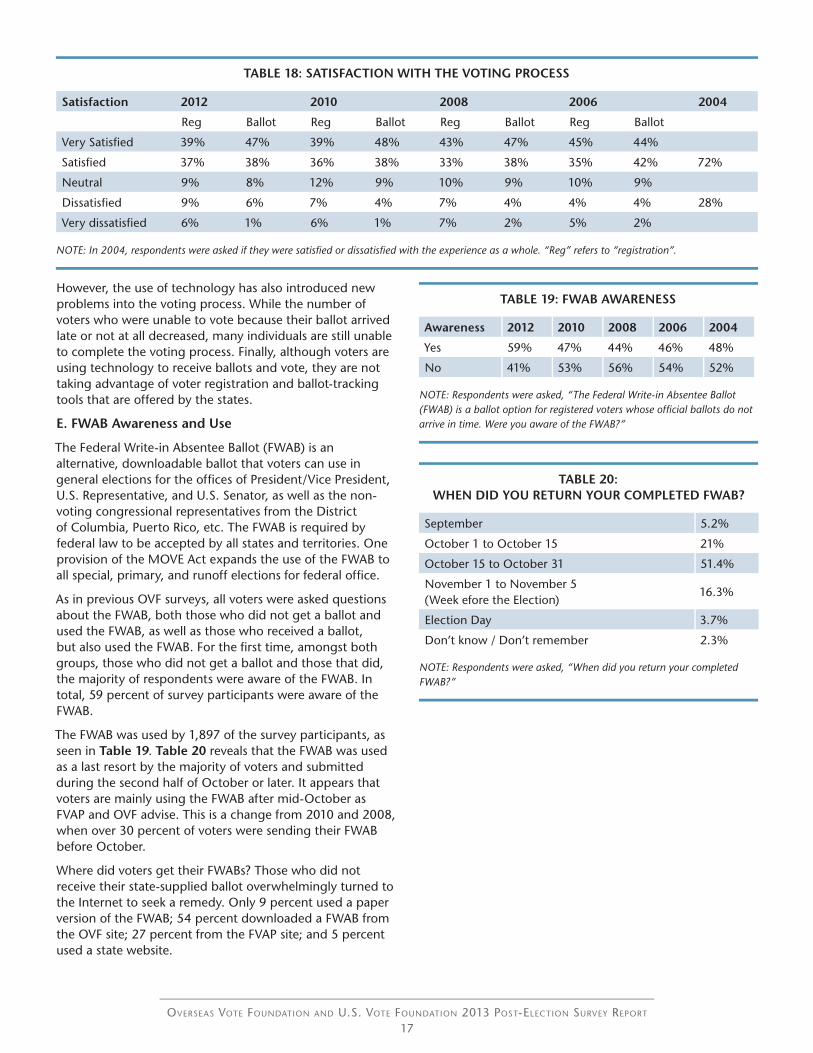
However, the use of technology has also introduced new problems into the voting process. While the number of voters who were unable to vote because their ballot arrived late or not at all decreased, many individuals are still unable to complete the voting process. Finally, although voters are using technology to receive ballots and vote, they are not taking advantage of voter registration and ballot-tracking tools that are offered by the states.
E. FWAB Awareness and Use
The Federal Write-in Absentee Ballot (FWAB) is an alternative, downloadable ballot that voters can use in general elections for the offices of President/Vice President, U.S. Representative, and U.S. Senator, as well as the non-voting congressional representatives from the District of Columbia, Puerto Rico, etc. The FWAB is required by federal law to be accepted by all states and territories. One provision of the MOVE Act expands the use of the FWAB to all special, primary, and runoff elections for federal office.
As in previous OVF surveys, all voters were asked questions about the FWAB, both those who did not get a ballot and used the FWAB, as well as those who received a ballot, but also used the FWAB. For the first time, amongst both groups, those who did not get a ballot and those that did, the majority of respondents were aware of the FWAB. In total, 59 percent of survey participants were aware of the FWAB.
The FWAB was used by 1,897 of the survey participants, as seen in Table 19. Table 20 reveals that the FWAB was used as a last resort by the majority of voters and submitted during the second half of October or later. It appears that voters are mainly using the FWAB after mid-October as FVAP and OVF advise. This is a change from 2010 and 2008, when over 30 percent of voters were sending their FWAB before October.
Where did voters get their FWABs? Those who did not receive their state-supplied ballot overwhelmingly turned to the Internet to seek a remedy. Only 9 percent used a paper version of the FWAB; 54 percent downloaded a FWAB from the OVF site; 27 percent from the FVAP site; and 5 percent used a state website.
TABLE 19: FWAB AWARENESS
Awareness 2012 2010 2008 2006 2004
Yes 59% 47% 44% 46% 48%
No 41% 53% 56% 54% 52%
NOTE: Respondents were asked, “The Federal Write-in Absentee Ballot (FWAB) is a ballot option for registered voters whose official ballots do not arrive in time. Were you aware of the FWAB?”
TABLE 20: WHEN DID YOU RETURN YOUR COMPLETED FWAB?
September 5.2%
October 1 to October 15 21%
October 15 to October 31 51.4%
November 1 to November 5 (Week efore the Election)
16.3%
Election Day 3.7%
Don’t know / Don’t remember 2.3%
NOTE: Respondents were asked, “When did you return your completed FWAB?”
Overseas vOte FOundatiOn and u.s. vOte FOundatiOn 2013 POst-electiOn survey rePOrt
18
F. Uniformed Services Member and Spouses or Dependents
The respondent profile of military voters and their spouses and/or dependents is slightly different than that of civilian UOCAVA voters. The military voter respondent group has more first-time voters (37.9 percent) in 2012 than in the general sample (22 percent). Military respondents are more likely to be male, younger, and away from the U.S. for a shorter length of time than their civilian counterparts. However, the level of education is still high among the military cohort.
The main difference in the voting experience in 2012 for military voters versus the general sample was that a higher number of military voters, 13.8 percent, tried to vote, but could not finish the process, compared to 11.2 percent of civilian voters.
With regard to the registration process, military voters were more likely to submit a voter registration/ballot request form in 2012: 84.5 percent submitted a form, compared to 78.8 percent of civilian voters. Not surprisingly, the majority of military voters used the FVAP website to generate a voter registration/ballot request form (52.6 percent). Most of the registration process paralleled the civilian voter experience. Military voters sent their registration forms at approximately the same time as civilian voters; however, military voters used the military post more often to return forms (16.1 percent).
Ballot receipt problems continue to plague military voters. Approximately 77.5 percent of military respondents received their ballots, while 21.6 percent did not. Among civilian voters, 80 percent received their ballots and 17 percent did not, a difference of nearly 4 percent. The method of ballot receipt was not different between the two groups. As with civilians, the majority of military personnel received their blank ballot using some form of electronic transmission. However, a larger number of military personnel received their ballots late. For example, 4.1 percent of military personnel reported receiving their ballot after November 1, compared to 2.6 percent for the civilian respondent group. There appears to be no relationship between a ballot arriving late and the mode of blank ballot receipt, although voters who received their blank ballot via express mail were more likely to receive it after November 1. Express mail was an important tool for jurisdictions that sent their ballots late or voters who requested ballots late, but it does not seem to have solved the late ballot problem. There were no significant differences between the voter groups regarding the amount of and types of problems experienced with their ballots.
Military voters seem more aware of the online services of state websites. More than a third (37 percent) used a state website to look up their voter information, versus 27.2 percent of civilians. Approximately 16.1 percent used a state ballot-tracking website, versus 13.5 percent of civilians.
This may be due to the links provided on the FVAP website. Overall voter satisfaction was similar among the two voting groups.
FWAB awareness among military personnel was comparable to the general sample. Only 62 military voters reported using a FWAB, of which 62 percent used the FVAP website to generate a FWAB. Further, 14.5 percent used a FWAB in paper form that they received from their Voting Assistance Officer (VAO).
Within the OVF 2012 Local Election Official survey, many election officials expressed concern that some military personnel did not or could not receive their ballots or voter registration material electronically. In some instances, the emailed ballot could not be delivered or opened due to Internet security settings at the military voter’s location. Also, LEOs expressed frustration that some military personnel could not return their ballots on time. The military postal system can be slower than international air mail, which may lead to the delays that uniformed personnel face. In addition, as detailed on the FVAP website, a plane crash carrying military post in Afghanistan resulted in the loss of many ballots from that region; however, the exact number of ballots lost is not known.
In summary, military voters appear less likely to receive their ballot (21.6 percent of military voters did not receive a ballot, versus 17 percent of civilians), and more often receive it late (4.1 percent of military voters received their ballot after November 1, compared to 2 percent of civilians). While the voting process has improved for military voters, they continue to face unique obstacles that are difficult to overcome.
G. Conclusion
In conclusion, 2012 was a tipping point in the use of technology in the overseas and military voting process. First, increasing numbers of voters are using the Internet to download and submit registration/ballot request forms (FPCAs). Second, for the first time, the majority of voters received a blank ballot using electronic methods. Third, although the vast majority of individuals return their voted ballots via post, greater numbers are using electronic transmission methods. In addition, a new, not unexpected trend is clear: as the use of technology increases, so have the number of technical difficulties, although their impact appears to be small.
The OVF voter survey also revealed several positive developments. Of those respondents who attempted to vote, the number of individuals who did not receive a ballot or received one too late continued to decrease, from 50 percent in 2008 to 30 percent in 2010 and 21 percent in 2012. Voters are sending their ballots back earlier, by approximately 6 percent. Overall voter satisfaction remained high. In contrast to these positives, a very small number of voters utilized the available state registration and

Overseas vOte FOundatiOn and u.s. vOte FOundatiOn 2013 POst-electiOn survey rePOrt
19
ballot-tracking tools. Furthermore, regardless of the positive trends and voting systems available, almost 20 percent of voters who attempted to vote may not have been able to complete the voting process because they did not receive a ballot or their ballot was late. Not only do election officials need to continue to make punctual ballot transmission a priority, voters must also be aware of deadlines and submit their forms on time. Those who submit their registration/request forms in October are more likely to receive a late ballot or not receive one at all.
V 2012 Post-Election Local Election Official Survey Report
Following the 2012 Presidential election, OVF conducted its fourth survey of local election officials (LEOs) across all U.S. states and territories. The 38-question survey covered a wide variety of overseas and military voting issues, including the voter registration/ballot request process, the balloting process (i.e., sending blank ballots and receiving voted ballots), and communication and outreach strategies. In light of the 2009 MOVE Act reforms, the 2012 survey focused special attention on new processes involving electronic transmission methods for registration/ballot request forms and ballots. A review of general responses, as well as comparisons to previous surveys, is provided in this section.
A. Methodology
OVF emailed survey invitations to 7,785 LEOs and absentee voting clerks, whose addresses were extracted from contact data available in the OVF Election Official Directory (EOD). Because several jurisdictions have multiple email addresses, jurisdictions that received more than one invitation were instructed to take the survey only once. The survey was issued through an online survey program that provided a unique one-time use URL link to each participant. State-level election officials did not receive survey invitations. As in previous surveys, all 50 states, the District of Columbia, American Samoa, Guam, Puerto Rico, and the Virgin Islands were included in the survey distribution. OVF launched the survey on November 29, 2012. There was a 26.6 percent response rate, as 2,071 election officials responded to and completed the survey. This represents the largest number of responses and the best response rate for the OVF Post-Election Local Election Official Survey to date. Partially completed surveys were not included in the analysis.
OVF received responses from 49 states, with 67 percent of the responses coming from just 10 states. These results are similar to those in 2008 and 2010. However, in 2012 there were two anomalies in the data due to specific election jurisdiction structures. First, there were a large number of responses from Wisconsin, which has approximately 1,850 election jurisdictions. Second, approximately 1,200
Michigan Township Election Official records were added to the EOD in 2012. As a result, Wisconsin and Michigan are overrepresented in the sample. However, when Wisconsin and Michigan are removed from the sample, there is a larger dispersion of response rates across the remaining 47 states, as seen in Table 1.3 The District of Columbia and the U.S. territories did not respond to the survey, and, therefore, are not represented in the results. Compared to 2010, there were a variety of changes in the top-responding states, such as the increase in responses from Vermont, North Carolina, and Ohio. The number of responses from Virginia, New Hampshire, and Georgia decreased.
TABLE 1: TOP RESPONDING STATES
State 2012 2010 2008
Michigan 23.7% 1.2% 0.7%
Wisconsin 20.7% 18% 16%
Massachusetts 5.4% 5.5% 1%
Texas 3.4% 6.3% 7%
Vermont 2.7% 1.9% 4.4%
Indiana 2.4% 2.8% 1%
Connecticut 2.3% 4.3% 5%
North Carolina 2.2% 1.1% 3.5%
Ohio 2.2% 1.3% 3.3%
Virginia 2.1% 3.2% 5%
Colorado 2% 3% 3%
New Hampshire 1.9% 3% 2%
Georgia 1.8% 4% 3%
NOTE: Figures represent percent of respondents.
Among all respondents, 92 percent reported that they were either the election official in charge of overseas and military absentee voting in their jurisdiction or one of several officials in charge. Only 91 jurisdictions (4.4 percent) indicated formally that they did not have any military or overseas voters. However, many election officials wrote in the open comments section of the survey that they did not have any UOCAVA voters. As a result, the precise number of jurisdictions responding to the survey that do not have any UOCAVA voters is unclear.
3Although there is a small bias in the data due to the large number of responses from Wisconsin and Michigan, when they are removed from the analysis, there is no significant difference in the results.

Overseas vOte FOundatiOn and u.s. vOte FOundatiOn 2013 POst-electiOn survey rePOrt
20
B. Numbers: Registration and Ballot Requests
As in 2010 and 2008, the majority of reporting jurisdictions were small, with fewer than 25,000 registered voters. The percentage of small jurisdictions increased slightly in 2012, as seen in Table 2. Of the surveyed LEOs, 74.5 percent of respondents have 0 to 24,999 registered voters, 10.9 percent have 25,000 to 49,999 registered voters, 6.2 percent have 50,000 to 99,999 registered voters, and the remaining 8.5 percent serve more than 100,000 registered voters in their jurisdictions. The additional 1,200 Michigan jurisdictions changed the surveyed population and resulted in an increase in small jurisdiction responses in comparison to past surveys.
When compared to the 2010 survey results, LEOs reported a general increase in overseas and military voter participation, the results of which are summarized in Table 3. The vast majority of LEO survey respondents (85.6 percent) reported an estimated 0 to 99 ballot requests from overseas civilian and/or military voters in their jurisdiction for the 2012 Presidential election. Among overseas civilian ballots, 9.4 percent indicated 100 to 499 requests, and 2 percent estimated 500 to 999 ballot requests. Only 47 jurisdictions (2.4 percent) calculated that there were more than 1,000 overseas civilian requests. The volume of military ballot requests was similar to that of overseas civilian requests: 9.9 percent reported that 100 to 499 military voters requested ballots in their jurisdictions, and 1.8 percent projected 500 to 999 ballots. Only 40 jurisdictions (2 percent) estimated more than 1,000 military ballot requests were processed. These data strongly suggest that the majority of LEOs deal with relatively small numbers of UOCAVA ballots.
The data in Table 3 demonstrate that the majority of election jurisdictions handle fairly small numbers of UOCAVA ballots. This finding corresponds to the overall size of the majority of election jurisdictions responding to this survey (i.e., less than 25,000 registered voters of all types). As would be expected, larger jurisdictions handle more requests than smaller jurisdictions.
TABLE 2: REPORTED JURISDICTION SIZE
2012 2010 2008
0 – 24,999 74.5% 70.4% 73%
25,000 – 49,999 10.9% 12.3% 13%
50,000 – 99,999 6.2% 7.7% 6%
100,000 – 249,999 5.3% 6% 5%
250,000 – 499,999 2% 2.4% 2%
500,000 – 999,999 0.9% 0.8% 1%
1,000,000 or more 0.3% 0.4% 0%
NOTE: Respondents were asked “How many registered voters of all types including local voters, domestic absentee voters, and overseas and military absentee voters do you estimate were registered in your jurisdiction for the November 6, 2012 General Election?”
TABLE 3: ESTIMATED BALLOT REQUESTS FROM OVERSEAS CIVILIAN AND MILITARY VOTERS
Jurisdiction Size
Total Overseas Civilian Voters 1
to
24,9
99
25,0
00 t
o 49
,999
50,0
00 t
o 99
,999
100,
000
to
249,
999
+ 25
0,00
0
Total
Under 100 1,436 181 60 17 2 1,696
100–499 31 32 54 57 13 187
500 – 999 1 2 6 17 14 40
Over 1,000 4 1 2 9 31 47
Don’t Know 3 0 2 5 2 12
Total Military Voters 1
to
24,9
99
25,0
00 t
o 49
,999
50,0
00 t
o 99
,999
100,
000
to
249,
999
+ 25
0,00
0
Total
Under 100 1,436 173 54 16 3 1,682
100–499 20 41 57 61 16 195
500 – 999 0 1 10 10 15 36
Over 1,000 0 0 2 13 25 40
Don’t Know 4 1 1 5 3 14
NOTE: Data represents number of respondents to the questions, “How many overseas civilian voters / military voters in your jurisdiction do you estimate requested ballots for the November 6, 2012 General Election?” There are 1,982 respondents to the civilian question and 1,967 respondents to the military question.

Overseas vOte FOundatiOn and u.s. vOte FOundatiOn 2013 POst-electiOn survey rePOrt
21
C. Registration and Ballot Request
In order to identify UOCAVA electoral processes that are effective and those that need improvement, OVF asked LEOs questions regarding the voting process in their jurisdiction. The first step in the UOCAVA voting process is the registration and/or ballot request form. The Federal Post Card Application (FPCA) is the official name given to the federal government’s voter registration form used by UOCAVA voters. The FPCA functions as a simultaneous voter registration and absentee ballot request form. In 2012, 67 percent of LEO survey respondents indicated that the FPCA is the primary form used for UOCAVA voter registration and/or an absentee ballot request, which is similar to 2010 (68 percent), but lower than in 2008 (76 percent).
Before the MOVE Act of 2009, election officials honored an FPCA form as a request for ballots for federal elections over a four-year, two-general election period. The MOVE Act removed this protection. The November 6, 2012 General Election was the first Presidential election for which election officials honored FPCAs for only one calendar year.
Nearly one-quarter (23.5 percent) of LEOs required voters who had previously registered to file a new form. Only 22.4 percent reported that overseas and military voters who registered in 2010 received a 2012 ballot without filing a new form; this is about half the number that automatically sent ballots in the 2010 general election, when 53 percent of LEOs honored previous ballot requests. Further, 23.5 percent of LEOs said that if a person registered to vote in 2010 and contacted their office in any manner (i.e., mail, telephone, fax, and email), a ballot was sent to them. These results represent a marked departure from 2010, 2008, and 2006. In accordance with the MOVE Act, more jurisdictions required a new ballot request form, which is summarized in Table 4.
States continue to vary their specific requirements regarding FPCA completion. This variance is a source of confusion among voters. In 2012, 170 LEOs (9 percent) indicated that they required some sort of additional state-specific information beyond that outlined on the FPCA. Supplemental personal identification remains at the top of the list of additional state imposed conditions for UOCAVA voter registration, as seen in Table 5. It should be noted that the number of actual jurisdictions that require additional information may be much higher than the small sample presented here.
TABLE 4: REGISTRATION SYSTEM FOR PREVIOUS VOTERS
Registration System 2012 2010 2008
Overseas and military voters who registered in 2010 received 2012 ballots without filing a new form
22.4% 52.8% 57% 59%
Overseas and military voters who registered in 2010 were required to file a new ballot request form in order to receive ballots in 2012
23.5% 15.1% 6% 5%
If an overseas or military voter was already regis-tered and then contacted us in any manner (mail, telephone, fax, email), then we sent the voter a ballot
23.5% 17.8% 20% 17%
Overseas and military vot-ers were required to file a request for each election in 2012 (i.e., primary and general election) as a bal-lot request is valid for only one election
5.2%
Don’t know 5% 1.90% 4% 2%
Other 8.6% 5% 6% 16%
NOTE: Respondents were asked, “Which of the following best describes your system for sending ballots to overseas and military voters who registered previously in 2010?”
TABLE 5: ADDITIONAL REGISTRATION REQUIREMENTS
Requirement 2012 2010 2008
Additional Identification 3.7% 8.3% 11.7%
Date of Birth 3% 7.1% 7.2%
Other 6.6% 5.2% 4.7%
Additional Address Information 0.8% 2% 2.8%
Additional Proof of Previous Residency
0.7% 0.01% 1.2%
NOTE: Respondents were asked, “Does your jurisdiction require a voter to submit any information in addition to what is required on the FPCA? (Check all that apply.)” Percentages are calculated as the number of respondents divided by the number of individuals who answered the question.

Overseas vOte FOundatiOn and u.s. vOte FOundatiOn 2013 POst-electiOn survey rePOrt
22
The additional state-specific registration requirements imposed on military and overseas voters are not the only hurdles that individuals encounter when attempting to participate. OVF asked LEOs to identify the top three reasons for rejecting registration forms. It appears that the number of registration rejections decreased in 2012 when compared to 2010 and 2008, as seen in Table 6.
As seen in the OVF 2012 Voter Survey, voters are increasingly using electronic transmission methods to return their registration/ballot request forms. Election officials verified this finding. As seen in Table 7, although most voters continued to use post (48 percent), the average election official reported that approximately 44 percent of registration/ballot request forms were submitted via email, and 16 percent were submitted electronically followed by a paper hard copy. Thus, about 60 percent of registration/ballot request forms were submitted electronically.
Only 65 percent of election officials reported requiring a hard copy of a form in addition to a FPCA form submitted electronically. Among those LEOs that require a hard copy, 11.7 percent required a hard copy from all voters and 10.2 percent only required a hard copy if the voter had never registered before. It is clear that as long as wet signatures are required, there will be limits on the use of electronic transmission of voter registration/ballot request forms. Indeed, 3.3 percent of LEOs identified “Faxed or emailed
TABLE 6: REASONS FOR REJECTING REGISTRATION FORMS
Reason for Rejection 2012 2010 2008
Missed deadline: Form arrived too late
27.5% 40.4% 48.9%
Signature and/or date missing 19.3% 25.9% 28.2%
Form is incomplete 14.5% 28.2% 35.5%
Can’t reach voter when we have questions
3.8% 11.3% 9.7%
Voter never lived in the U.S. or our jurisdiction
3.6% 4.1% 6%
Voter’s former residence could not be verified
3.4% 3.9% 6%
Wrong address 3.3% 8.3% 9.3%
Faxed or emailed forms not fol-lowed by signed original
3.3% 5.7% 7%
Invalid information on the form 3.0% 5.5% 8%
Illegible handwriting 2.9% 6.6% 10%
NOTE: Respondents were asked, “What were the most common reasons for rejecting a FPCA registration form and/or ballot request from overseas and military voters in your jurisdiction in 2012? (Please check only your top 3 reasons.)” Percentages are calculated as the number of respondents divided by the entire sample size. Because survey participants were allowed to choose more than one response, total percent may exceed 100.
TABLE 7: HOW VOTERS RETURNED REGISTRATION/BALLOT REQUEST FORMS; AVERAGE PERCENTAGE
Postal mail 48.35%
Email 43.97%
Electronically followed by paper hard copy 15.95%
Online voter registration system 15.06%
Fax 11.09%
Internet upload 9.02%
NOTE: Respondents were asked, “Overseas and military absentee voters can submit their registration and/or ballot request form (FPCA) in many different ways, such as postal mail, fax, email, or Internet upload. Thinking for a moment about how overseas and military voters submitted their registration and/or ballot request form in your jurisdiction, approximately what percentage sent their form on paper via postal mail? What percentage sent their form electronically (i.e., fax, email, or Internet upload)?” Cell entries represent the average response.
forms not followed by signed original” as a top reason for FPCA rejection.
Although electronic submission may have contributed to fewer missed deadlines, it also introduced new problems. Nearly 10 percent of election officials (195) indicated that there were technical difficulties when individuals submitted a registration/ballot request form electronically. Of the problems reported, the most significant problem was that the voter did not sign the form (65.4 percent), which is also a common problem amongst forms submitted via post. Forgetting attachments, incorrect attachments, and problems with PDF files are the most common technical issues, as seen in Table 8.
TABLE 8: TECHNICAL DIFFICULTIES AND VOTER REGISTRATION/BALLOT REQUEST FORM
The voter did not sign the form 65.4%
The voter forgot to include the attachment 32.4%
Could not open the PDF attachment 22.2%
Could not print the attachment 16.8%
The voter sent the wrong attachment 15.1%
Emails with forms were sent to a spam folder 7.6%
The attachment contained a virus 1.1%
Don’t know 0.5%
Other (please specify) 37.8%
NOTE: Respondents were asked, “The following question is for election officials who reported experiencing problems when receiving registration/ballot request forms (FPCA) via email. What types of problems did you experience when receiving FPCA forms via email in 2012? (Please check all that apply.)” Because survey participants were allowed to choose more than one response, total percent may exceed 100.

Overseas vOte FOundatiOn and u.s. vOte FOundatiOn 2013 POst-electiOn survey rePOrt
23
In general, most jurisdictions continue to deal with a small number of UOCAVA voters. The results above confirm many findings in the OVF voter survey, and paint a clear picture of the process of submitting a registration/ballot request form. First, the MOVE Act impacted the registration process in that more LEOs now require voters to submit a new FPCA. Second, increasing numbers of voters are submitting applications via email. Third, fewer applications are being rejected, but voters are still falling out of the voting process because they either return their forms too late or forget to sign them. This leads us to conclude that education and communication issues, versus process issues, are now essential to increasing voter success.
D. Balloting Issues: Blank Ballots, Voted Ballots, and Ballot Rejection
There were several sections of the MOVE Act that impacted how and when election officials were to send ballots. Section 579 requires election officials to transmit ballots to voters who requested them in time, no later than 45 days prior to the election. In 2012, this was September 24. OVF asked election officials, “When did you send out your official hard copy paper absentee ballots for the November 6, 2012 General Election to overseas and military voters?” OVF received responses from 1,233 LEOs, and a large majority indicated that they sent out their ballots on time. Only 266 (17.8 percent) responded that ballots were transmitted after September 24; 51 respondents sent ballots during the last week of September; 115 sent ballots in the first week of October; and 39 sent ballots in the second week of October. However, 61 respondents (4.9 percent) sent their ballots out after October 15. Because survey respondents were anonymous, we cannot determine which jurisdictions sent out their ballots late.
Section 578 of the MOVE Act stipulates that voters must be provided an option to receive blank ballots electronically. In 2012, all 50 states had provisions for the electronic transmission of blank ballots to voters. Most LEOs (80 percent) responded that they used either fax, email, or the Internet to send ballots to voters. When asked to identify their specific method of electronic transmission, 1,291 officials indicated that they sent ballots via email as an attached PDF file, as seen in Table 9.
Of responding LEOs, 11.5 percent (164) experienced technical difficulties when transmitting blank ballots electronically. Additionally, as seen in Table 10, many voters reported to LEOs that they had not received their ballots. Election officials offered detailed comments on problems such as voters not having access to the Internet, voters unable to print ballots and ballot envelopes or unable to print ballots on the specified paper size, or transmitted ballots ending up in the voter‘s spam folder. One can see that the MOVE Act, while addressing some process problems, also introduced new ones.
TABLE 9: METHODS OF ELECTRONIC TRANSMISSION OF BLANK BALLOTS
Email (as an attached PDF file) 90.5%
Downloadable over the Internet using an as-signed login
11.4%
Fax 10.9%
Other (please specify) 3.9%
We did not send blank ballots using electronic methods
0.6%
Don’t know 0.5%
NOTE: Respondents were asked “How did you transmit blank ballots electronically for the November 6, 2012 General Election? (Please check all that apply.)” Because survey participants were allowed to choose more than one response, total percent may exceed 100.
TABLE 10: ELECTRONIC TRANSMISSION OF BLANK BALLOTS AND TECHNICAL DIFFICULTIES
Voters were unable to open their PDF files 31.9%
Voters reported not receiving their ballot 53.4%
Voters reported receiving a blank ballot electroni-cally and in paper form
1.2%
Our website for Internet ballot download experi-enced technical difficulties
12.9%
We had problems with our vendor-supplied ballot delivery
3.7%
It was difficult to manage voters through email 8.0%
Other (please specify) 51.5%
NOTE: Respondents were asked “What problems did you experience when you transmitted blank ballots electronically? (Please check all that apply.)” Because survey participants were allowed to choose more than one response, total percent may exceed 100.
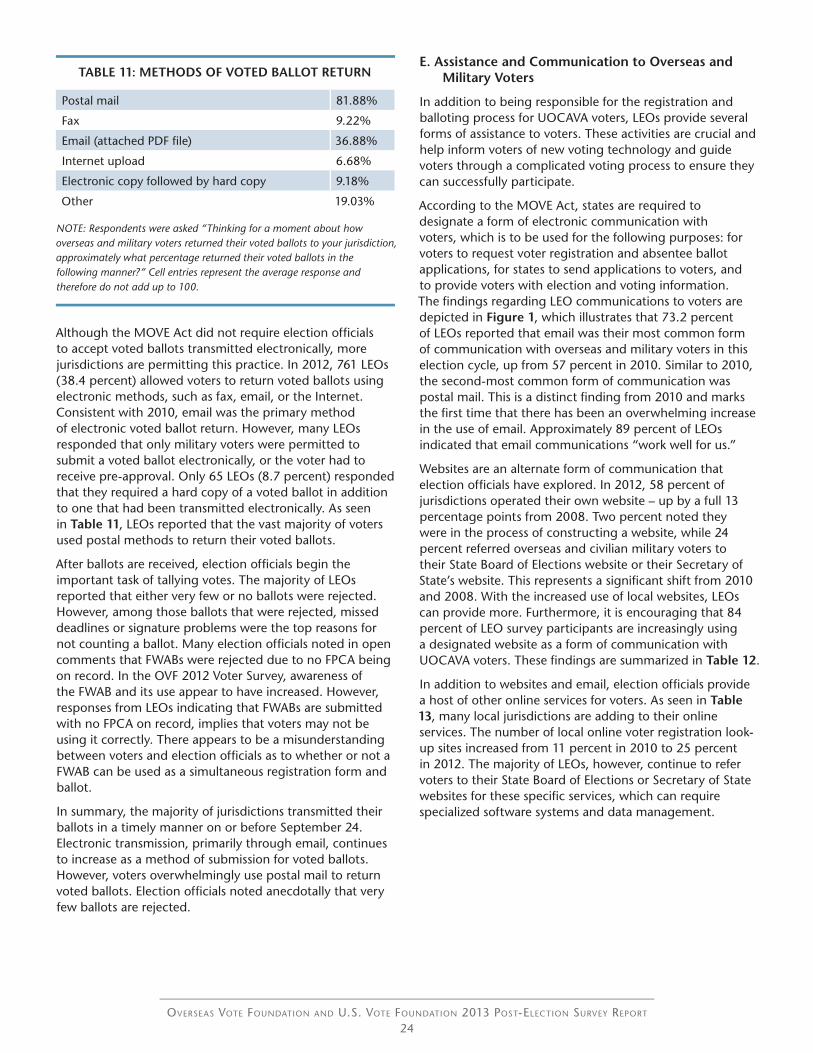
Overseas vOte FOundatiOn and u.s. vOte FOundatiOn 2013 POst-electiOn survey rePOrt
24
Although the MOVE Act did not require election officials to accept voted ballots transmitted electronically, more jurisdictions are permitting this practice. In 2012, 761 LEOs (38.4 percent) allowed voters to return voted ballots using electronic methods, such as fax, email, or the Internet. Consistent with 2010, email was the primary method of electronic voted ballot return. However, many LEOs responded that only military voters were permitted to submit a voted ballot electronically, or the voter had to receive pre-approval. Only 65 LEOs (8.7 percent) responded that they required a hard copy of a voted ballot in addition to one that had been transmitted electronically. As seen in Table 11, LEOs reported that the vast majority of voters used postal methods to return their voted ballots.
After ballots are received, election officials begin the important task of tallying votes. The majority of LEOs reported that either very few or no ballots were rejected. However, among those ballots that were rejected, missed deadlines or signature problems were the top reasons for not counting a ballot. Many election officials noted in open comments that FWABs were rejected due to no FPCA being on record. In the OVF 2012 Voter Survey, awareness of the FWAB and its use appear to have increased. However, responses from LEOs indicating that FWABs are submitted with no FPCA on record, implies that voters may not be using it correctly. There appears to be a misunderstanding between voters and election officials as to whether or not a FWAB can be used as a simultaneous registration form and ballot.
In summary, the majority of jurisdictions transmitted their ballots in a timely manner on or before September 24. Electronic transmission, primarily through email, continues to increase as a method of submission for voted ballots. However, voters overwhelmingly use postal mail to return voted ballots. Election officials noted anecdotally that very few ballots are rejected.
TABLE 11: METHODS OF VOTED BALLOT RETURN
Postal mail 81.88%
Fax 9.22%
Email (attached PDF file) 36.88%
Internet upload 6.68%
Electronic copy followed by hard copy 9.18%
Other 19.03%
NOTE: Respondents were asked “Thinking for a moment about how overseas and military voters returned their voted ballots to your jurisdiction, approximately what percentage returned their voted ballots in the following manner?” Cell entries represent the average response and therefore do not add up to 100.
E. Assistance and Communication to Overseas and Military Voters
In addition to being responsible for the registration and balloting process for UOCAVA voters, LEOs provide several forms of assistance to voters. These activities are crucial and help inform voters of new voting technology and guide voters through a complicated voting process to ensure they can successfully participate.
According to the MOVE Act, states are required to designate a form of electronic communication with voters, which is to be used for the following purposes: for voters to request voter registration and absentee ballot applications, for states to send applications to voters, and to provide voters with election and voting information. The findings regarding LEO communications to voters are depicted in Figure 1, which illustrates that 73.2 percent of LEOs reported that email was their most common form of communication with overseas and military voters in this election cycle, up from 57 percent in 2010. Similar to 2010, the second-most common form of communication was postal mail. This is a distinct finding from 2010 and marks the first time that there has been an overwhelming increase in the use of email. Approximately 89 percent of LEOs indicated that email communications “work well for us.”
Websites are an alternate form of communication that election officials have explored. In 2012, 58 percent of jurisdictions operated their own website – up by a full 13 percentage points from 2008. Two percent noted they were in the process of constructing a website, while 24 percent referred overseas and civilian military voters to their State Board of Elections website or their Secretary of State’s website. This represents a significant shift from 2010 and 2008. With the increased use of local websites, LEOs can provide more. Furthermore, it is encouraging that 84 percent of LEO survey participants are increasingly using a designated website as a form of communication with UOCAVA voters. These findings are summarized in Table 12.
In addition to websites and email, election officials provide a host of other online services for voters. As seen in Table 13, many local jurisdictions are adding to their online services. The number of local online voter registration look-up sites increased from 11 percent in 2010 to 25 percent in 2012. The majority of LEOs, however, continue to refer voters to their State Board of Elections or Secretary of State websites for these specific services, which can require specialized software systems and data management.
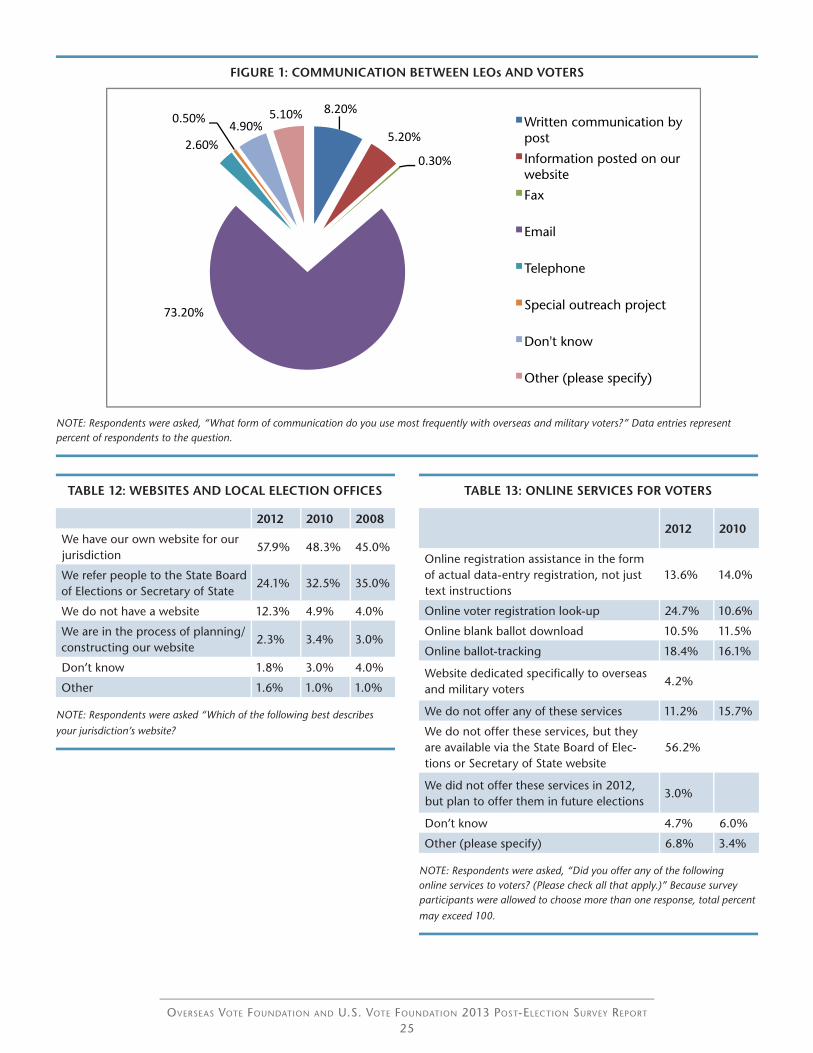
Overseas vOte FOundatiOn and u.s. vOte FOundatiOn 2013 POst-electiOn survey rePOrt
25
TABLE 12: WEBSITES AND LOCAL ELECTION OFFICES
2012 2010 2008
We have our own website for our jurisdiction
57.9% 48.3% 45.0%
We refer people to the State Board of Elections or Secretary of State
24.1% 32.5% 35.0%
We do not have a website 12.3% 4.9% 4.0%
We are in the process of planning/constructing our website
2.3% 3.4% 3.0%
Don’t know 1.8% 3.0% 4.0%
Other 1.6% 1.0% 1.0%
NOTE: Respondents were asked “Which of the following best describes your jurisdiction’s website?
FIGURE 1: COMMUNICATION BETWEEN LEOs AND VOTERS
8.20% 5.20%
0.30%
73.20%
2.60% 0.50%
4.90% 5.10% Wri1en communica9on by post
Informa9on posted on our website
Fax
Telephone
Special outreach project
Don't know
NOTE: Respondents were asked, “What form of communication do you use most frequently with overseas and military voters?” Data entries represent percent of respondents to the question.
TABLE 13: ONLINE SERVICES FOR VOTERS
2012 2010
Online registration assistance in the form of actual data-entry registration, not just text instructions
13.6% 14.0%
Online voter registration look-up 24.7% 10.6%
Online blank ballot download 10.5% 11.5%
Online ballot-tracking 18.4% 16.1%
Website dedicated specifically to overseas and military voters
4.2%
We do not offer any of these services 11.2% 15.7%
We do not offer these services, but they are available via the State Board of Elec-tions or Secretary of State website
56.2%
We did not offer these services in 2012, but plan to offer them in future elections
3.0%
Don’t know 4.7% 6.0%
Other (please specify) 6.8% 3.4%
NOTE: Respondents were asked, “Did you offer any of the following online services to voters? (Please check all that apply.)” Because survey participants were allowed to choose more than one response, total percent may exceed 100.
8.20% 5.20%
0.30%
73.20%
2.60% 0.50%
4.90% 5.10% Wri1en communica9on by post
Informa9on posted on our website
Fax
Telephone
Special outreach project
Don't know
8.20%
5.20%
0.30%
73.20%
2.60%
0.50% 4.90% 5.10%
Written communication by post
Information posted on our website
Fax
Telephone
Special outreach project
Don't know
Other (please specify)
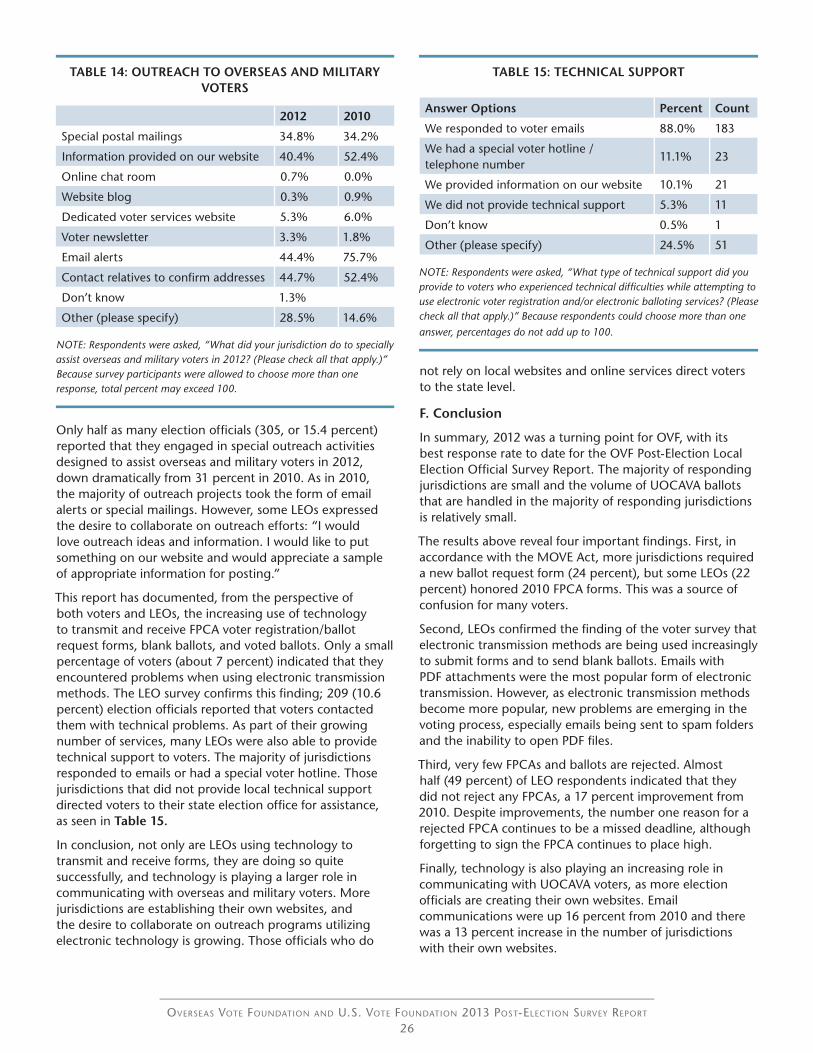
Overseas vOte FOundatiOn and u.s. vOte FOundatiOn 2013 POst-electiOn survey rePOrt
26
TABLE 14: OUTREACH TO OVERSEAS AND MILITARY VOTERS
2012 2010
Special postal mailings 34.8% 34.2%
Information provided on our website 40.4% 52.4%
Online chat room 0.7% 0.0%
Website blog 0.3% 0.9%
Dedicated voter services website 5.3% 6.0%
Voter newsletter 3.3% 1.8%
Email alerts 44.4% 75.7%
Contact relatives to confirm addresses 44.7% 52.4%
Don’t know 1.3%
Other (please specify) 28.5% 14.6%
NOTE: Respondents were asked, “What did your jurisdiction do to specially assist overseas and military voters in 2012? (Please check all that apply.)” Because survey participants were allowed to choose more than one response, total percent may exceed 100.
Only half as many election officials (305, or 15.4 percent) reported that they engaged in special outreach activities designed to assist overseas and military voters in 2012, down dramatically from 31 percent in 2010. As in 2010, the majority of outreach projects took the form of email alerts or special mailings. However, some LEOs expressed the desire to collaborate on outreach efforts: “I would love outreach ideas and information. I would like to put something on our website and would appreciate a sample of appropriate information for posting.”
This report has documented, from the perspective of both voters and LEOs, the increasing use of technology to transmit and receive FPCA voter registration/ballot request forms, blank ballots, and voted ballots. Only a small percentage of voters (about 7 percent) indicated that they encountered problems when using electronic transmission methods. The LEO survey confirms this finding; 209 (10.6 percent) election officials reported that voters contacted them with technical problems. As part of their growing number of services, many LEOs were also able to provide technical support to voters. The majority of jurisdictions responded to emails or had a special voter hotline. Those jurisdictions that did not provide local technical support directed voters to their state election office for assistance, as seen in Table 15.
In conclusion, not only are LEOs using technology to transmit and receive forms, they are doing so quite successfully, and technology is playing a larger role in communicating with overseas and military voters. More jurisdictions are establishing their own websites, and the desire to collaborate on outreach programs utilizing electronic technology is growing. Those officials who do
not rely on local websites and online services direct voters to the state level.
F. Conclusion
In summary, 2012 was a turning point for OVF, with its best response rate to date for the OVF Post-Election Local Election Official Survey Report. The majority of responding jurisdictions are small and the volume of UOCAVA ballots that are handled in the majority of responding jurisdictions is relatively small.
The results above reveal four important findings. First, in accordance with the MOVE Act, more jurisdictions required a new ballot request form (24 percent), but some LEOs (22 percent) honored 2010 FPCA forms. This was a source of confusion for many voters.
Second, LEOs confirmed the finding of the voter survey that electronic transmission methods are being used increasingly to submit forms and to send blank ballots. Emails with PDF attachments were the most popular form of electronic transmission. However, as electronic transmission methods become more popular, new problems are emerging in the voting process, especially emails being sent to spam folders and the inability to open PDF files.
Third, very few FPCAs and ballots are rejected. Almost half (49 percent) of LEO respondents indicated that they did not reject any FPCAs, a 17 percent improvement from 2010. Despite improvements, the number one reason for a rejected FPCA continues to be a missed deadline, although forgetting to sign the FPCA continues to place high.
Finally, technology is also playing an increasing role in communicating with UOCAVA voters, as more election officials are creating their own websites. Email communications were up 16 percent from 2010 and there was a 13 percent increase in the number of jurisdictions with their own websites.
TABLE 15: TECHNICAL SUPPORT
Answer Options Percent Count
We responded to voter emails 88.0% 183
We had a special voter hotline / telephone number
11.1% 23
We provided information on our website 10.1% 21
We did not provide technical support 5.3% 11
Don’t know 0.5% 1
Other (please specify) 24.5% 51
NOTE: Respondents were asked, “What type of technical support did you provide to voters who experienced technical difficulties while attempting to use electronic voter registration and/or electronic balloting services? (Please check all that apply.)” Because respondents could choose more than one answer, percentages do not add up to 100.

Overseas vOte FOundatiOn and u.s. vOte FOundatiOn 2013 POst-electiOn survey rePOrt
27
VI 2012 US Vote Post-Election Voter Survey
In January 2012, Overseas Vote Foundation (OVF) launched U.S. Vote Foundation (US Vote). US Vote adopts OVF’s concept of a customized voter services site, which provides web applications and information services that assist citizens in becoming active voters. The new site takes advantage of OVF’s six years of development investment and uses its core software engine to provide domestic U.S. voters the ability to generate accurate and complete state-specific voter registration and absentee ballot request applications. With its Election Official Directory, State Voter Information Directory, and Voter Help Desk, the comprehensive range of services offered by US Vote helps voters navigate today’s complicated landscape of U.S. voting regulations. Unlike other publicly available voter registration tools or widgets, US Vote’s service produces the complete state-specific forms for voter registration, which often require substantially more information than the National Voter Registration Application (NVRA) Form. Voters using their state forms will provide more complete information to their election office. US Vote stands apart as the only publicly available site that offers an online process for generating completed absentee ballot request forms across all states.
Along with development of voter services, research is a cornerstone activity of OVF, and 2012 marked the beginning of our voter survey research expansion into the realm of domestic voting. The first US Vote Post-Election Voter Survey was launched on Election Day, November 6, 2012. The 48-question survey was designed to capture the problems that domestic voters encounter when participating in the electoral process.
A. Methodology and Respondent Profile
Email invitations for an online survey were sent to 9,961 voters whose addresses were extracted from the U.S. Vote Foundation mailing list. These invitations allowed one-time completion of the survey and were auto-disabled after use or if forwarded. Of the invited respondents, 1,079 (10.8 percent) individuals completed the survey. Partially completed surveys were not included in the calculated response rates or analyses. The 48-question survey was divided into four parts: general demographic questions, questions regarding the voter registration process, questions regarding the domestic absentee voting process, and early and in-person voting. A full methodology report containing detailed information on question development, sampling, and response rates is available upon request.
The respondents represent voters across all 50 states and the District of Columbia. The top responding states were New York, California, Florida, Pennsylvania, and
Texas. Because of strong outreach through the National Association for Independent Colleges and Universities (NAICU), with their customized US Vote website, and broad visibility for US Vote’s absentee ballot request services through sites such as 866ourvote.org and ourtime.org, the US Vote respondent’s profile is younger and more likely to be a student. Through this sample, we can gain valuable insight into the voting experiences of young voters and retirees, and the domestic absentee mail voters represented in the US Vote survey.
The following demographic characteristics were reported by survey participants:
• Age: between 18 and 29 (55.8 percent), between 30 and 39 (10.4 percent), between 40 and 49 (8.8 percent), between 50 and 59 (12.6 percent), and over 60 (12.3 percent)
• Top Reported Occupation: student (39.3 percent), retired (7.8 percent), education and teaching (6.8 percent), management (6.1 percent), and medical (6.1 percent),
• Gender: 67 percent female and 33 percent male.
Overall, when compared to the OVF voter survey, we can see that the demographic profile of surveyed domestic voters is slightly different from overseas voters.
The sample contained a large number of new, first-time voters; 28 percent had not voted prior to the 2012 General Election, in comparison to the 5 percent of new voters in the OVF overseas and military voter survey. This is due to the significant number of students in the sample. Furthermore, many respondents were experienced absentee vote-by-mail voters; 36.2 percent reported voting by absentee mail ballot in the past. These findings are summarized in Table 1.
TABLE 1: VOTER HISTORY
Answer Options Percent Count
I have not voted, or attempted to vote, prior to the 2012 General Election.
28.0% 302
I have voted in person only. 35.5% 382
I have voted by absentee mail ballot only. 17.4% 187
I have voted both in person and by ab-sentee mail ballot.
18.8% 202
Don’t know / Don’t remember 0.4% 4
NOTE: Respondents were asked, “Which of the following best describes your voting history prior to the November 6, 2012 General Election?”
When asked about their voting experience in the 2012 General Election, 959 respondents (89 percent) reported that they voted, whereas 114 respondents (10.6 percent) did not vote. Because the sample is drawn from individuals
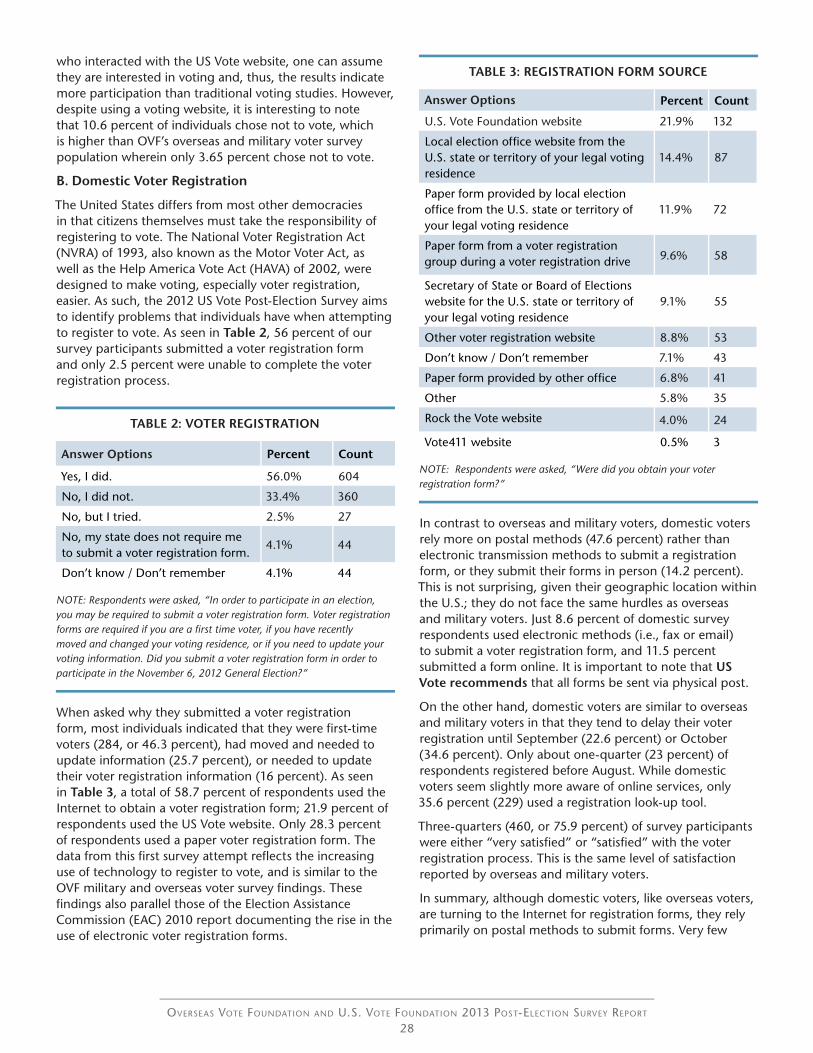
Overseas vOte FOundatiOn and u.s. vOte FOundatiOn 2013 POst-electiOn survey rePOrt
28
who interacted with the US Vote website, one can assume they are interested in voting and, thus, the results indicate more participation than traditional voting studies. However, despite using a voting website, it is interesting to note that 10.6 percent of individuals chose not to vote, which is higher than OVF’s overseas and military voter survey population wherein only 3.65 percent chose not to vote.
B. Domestic Voter Registration
The United States differs from most other democracies in that citizens themselves must take the responsibility of registering to vote. The National Voter Registration Act (NVRA) of 1993, also known as the Motor Voter Act, as well as the Help America Vote Act (HAVA) of 2002, were designed to make voting, especially voter registration, easier. As such, the 2012 US Vote Post-Election Survey aims to identify problems that individuals have when attempting to register to vote. As seen in Table 2, 56 percent of our survey participants submitted a voter registration form and only 2.5 percent were unable to complete the voter registration process.
TABLE 2: VOTER REGISTRATION
Answer Options Percent Count
Yes, I did. 56.0% 604
No, I did not. 33.4% 360
No, but I tried. 2.5% 27
No, my state does not require me to submit a voter registration form.
4.1% 44
Don’t know / Don’t remember 4.1% 44
NOTE: Respondents were asked, “In order to participate in an election, you may be required to submit a voter registration form. Voter registration forms are required if you are a first time voter, if you have recently moved and changed your voting residence, or if you need to update your voting information. Did you submit a voter registration form in order to participate in the November 6, 2012 General Election?”
When asked why they submitted a voter registration form, most individuals indicated that they were first-time voters (284, or 46.3 percent), had moved and needed to update information (25.7 percent), or needed to update their voter registration information (16 percent). As seen in Table 3, a total of 58.7 percent of respondents used the Internet to obtain a voter registration form; 21.9 percent of respondents used the US Vote website. Only 28.3 percent of respondents used a paper voter registration form. The data from this first survey attempt reflects the increasing use of technology to register to vote, and is similar to the OVF military and overseas voter survey findings. These findings also parallel those of the Election Assistance Commission (EAC) 2010 report documenting the rise in the use of electronic voter registration forms.
TABLE 3: REGISTRATION FORM SOURCE
Answer Options Percent Count
U.S. Vote Foundation website 21.9% 132
Local election office website from the U.S. state or territory of your legal voting residence
14.4% 87
Paper form provided by local election office from the U.S. state or territory of your legal voting residence
11.9% 72
Paper form from a voter registration group during a voter registration drive 9.6% 58
Secretary of State or Board of Elections website for the U.S. state or territory of your legal voting residence
9.1% 55
Other voter registration website 8.8% 53
Don’t know / Don’t remember 7.1% 43
Paper form provided by other office 6.8% 41
Other 5.8% 35
Rock the Vote website 4.0% 24
Vote411 website 0.5% 3
NOTE: Respondents were asked, “Were did you obtain your voter registration form?”
In contrast to overseas and military voters, domestic voters rely more on postal methods (47.6 percent) rather than electronic transmission methods to submit a registration form, or they submit their forms in person (14.2 percent). This is not surprising, given their geographic location within the U.S.; they do not face the same hurdles as overseas and military voters. Just 8.6 percent of domestic survey respondents used electronic methods (i.e., fax or email) to submit a voter registration form, and 11.5 percent submitted a form online. It is important to note that US Vote recommends that all forms be sent via physical post.
On the other hand, domestic voters are similar to overseas and military voters in that they tend to delay their voter registration until September (22.6 percent) or October (34.6 percent). Only about one-quarter (23 percent) of respondents registered before August. While domestic voters seem slightly more aware of online services, only 35.6 percent (229) used a registration look-up tool.
Three-quarters (460, or 75.9 percent) of survey participants were either “very satisfied” or “satisfied” with the voter registration process. This is the same level of satisfaction reported by overseas and military voters.
In summary, although domestic voters, like overseas voters, are turning to the Internet for registration forms, they rely primarily on postal methods to submit forms. Very few

Overseas vOte FOundatiOn and u.s. vOte FOundatiOn 2013 POst-electiOn survey rePOrt
29
respondents indicated that they experienced problems with the registration process.4
C. Domestic Absentee Voting
The Caltech/MIT Voting Technology Project reports that Americans are twice as likely to vote prior to Election Day. Indeed, domestic absentee voting by mail is on the rise in the U.S. Use of this voting method has increased 7 percent since 2004, and the EAC reported that more than 22 million Americans voted absentee in 2008. A large portion of survey respondents (655, or 60.7 percent) indicated that they submitted an application to vote absentee, while 416 (38.6 percent) did not.
The domestic absentee voting process requires voters to first be registered to vote. Then the voter must make an absentee ballot request by submitting a form or a letter, receive a blank ballot, and return a voted ballot. As seen in Table 4, voters in our survey are relying heavily on online services for assistance to prepare their absentee ballot request applications (482 respondents, or 73.5 percent). In addition, 16.9 percent reported using a paper form to request an absentee ballot, whereas only 9 percent of oveseas and military voters used a paper form.
Three-quarters (75.5 percent) of voters reported submitting their absentee ballot request form via post and only 15 percent submitted their form using electronic transmission methods (i.e., fax, email, or Internet), compared to the
TABLE 4: ABSENTEE BALLOT APPLICATION SOURCE
Answer Options Percent Count
U.S. Vote Foundation website 37.2% 244
Local election office website from the U.S. state or territory of your legal vot-ing residence
22.0% 144
Paper form provided by local election office from the U.S. state or territory of your legal voting residence
15.5% 102
Secretary of State or Board of Elections website for the U.S. state or territory of your legal voting residence
14.3% 94
Don’t know / Don’t remember 6.4% 42
Other 3.2% 21
Paper form provided by other office 1.4% 9
NOTE: Respondents were asked, “Where did you obtain your absentee ballot application form?
4The survey asked specific questions for voters who were not able to finish the registration process, but because most voters did, there were not enough respon-dents to draw conclusions.
34.9 percent of overseas and military voters who used electronic methods to request an absentee ballot. U.S. domestic absentee voters appear more likely to apply for an absentee ballot later in the process. Among US Vote’s survey respondents, 60.5 percent submitted their ballot application form in October, 20 percent submitted their form in September, and only 8 percent submitted their form before September. In contrast, 35.5 percent of overseas and military voters submitted their form before September. These findings are not surprising, as U.S. domestic absentee voters may not know far in advance if they will not be able to attend the polls.
Most voters, 536 individuals, or 81.7 percent, received their requested absentee ballot, whereas 13.9 percent did not, which is similar to the findings in the OVF 2012 overseas and military voter survey. Among surveyed domestic voters, 88 percent received their blank absentee ballot via post, whereas the remaining 11 percent received it in person. Although overseas and military voters are increasingly receiving their blank ballots electronically, this is not the case with domestic absentee voters. The MOVE Act mandated that all states make blank absentee ballot transmission available electronically for overseas and military absentee voters only. Overseas voters have used this technology and report improvements in timely blank ballot receipt.
There were very few reported problems with actual ballots; 91 percent indicated that they had no problems with their ballots. Among those that did experience difficulties with their blank ballots, many commented that they felt their ballot arrived too late. One 20 year-old college student voter commented, “I applied for an absentee ballot weeks ago and was really looking forward to performing my civic duty for the first time . . . It upsets me that I, and many others, were unable to participate in our first election through no fault of our own.” As seen in Table 5, 54.5 percent of absentee voters received their ballots in the three weeks leading up to Election Day.
TABLE 5: ABSENTEE BALLOT RECEIPT
Answer Options Percent Count
September 11.0% 58
October 1 to October 15 29.8% 157
October 16 to October 31 45.7% 241
November 1 to November 5 8.0% 42
Election Day 0.4% 2
After Election Day 0.4% 2
Don’t know / Don’t remember 4.7% 25
NOTE: Respondents were asked, “When did your official absentee ballot arrive from your local election official for the November 6, 2012 General Election?
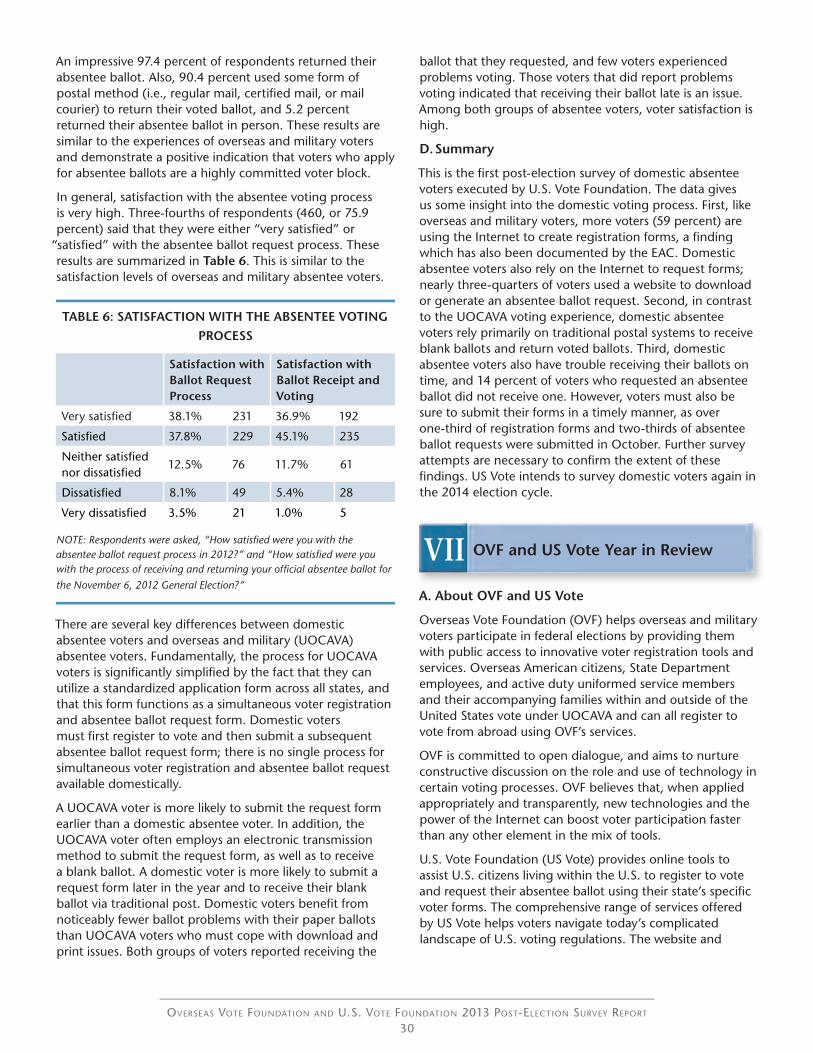
Overseas vOte FOundatiOn and u.s. vOte FOundatiOn 2013 POst-electiOn survey rePOrt
30
An impressive 97.4 percent of respondents returned their absentee ballot. Also, 90.4 percent used some form of postal method (i.e., regular mail, certified mail, or mail courier) to return their voted ballot, and 5.2 percent returned their absentee ballot in person. These results are similar to the experiences of overseas and military voters and demonstrate a positive indication that voters who apply for absentee ballots are a highly committed voter block.
In general, satisfaction with the absentee voting process is very high. Three-fourths of respondents (460, or 75.9 percent) said that they were either “very satisfied” or
“satisfied” with the absentee ballot request process. These results are summarized in Table 6. This is similar to the satisfaction levels of overseas and military absentee voters.
TABLE 6: SATISFACTION WITH THE ABSENTEE VOTING PROCESS
Satisfaction with Ballot Request Process
Satisfaction with Ballot Receipt and Voting
Very satisfied 38.1% 231 36.9% 192
Satisfied 37.8% 229 45.1% 235
Neither satisfied nor dissatisfied
12.5% 76 11.7% 61
Dissatisfied 8.1% 49 5.4% 28
Very dissatisfied 3.5% 21 1.0% 5
NOTE: Respondents were asked, “How satisfied were you with the absentee ballot request process in 2012?” and “How satisfied were you with the process of receiving and returning your official absentee ballot for the November 6, 2012 General Election?”
There are several key differences between domestic absentee voters and overseas and military (UOCAVA) absentee voters. Fundamentally, the process for UOCAVA voters is significantly simplified by the fact that they can utilize a standardized application form across all states, and that this form functions as a simultaneous voter registration and absentee ballot request form. Domestic voters must first register to vote and then submit a subsequent absentee ballot request form; there is no single process for simultaneous voter registration and absentee ballot request available domestically.
A UOCAVA voter is more likely to submit the request form earlier than a domestic absentee voter. In addition, the UOCAVA voter often employs an electronic transmission method to submit the request form, as well as to receive a blank ballot. A domestic voter is more likely to submit a request form later in the year and to receive their blank ballot via traditional post. Domestic voters benefit from noticeably fewer ballot problems with their paper ballots than UOCAVA voters who must cope with download and print issues. Both groups of voters reported receiving the
ballot that they requested, and few voters experienced problems voting. Those voters that did report problems voting indicated that receiving their ballot late is an issue. Among both groups of absentee voters, voter satisfaction is high.
D. Summary
This is the first post-election survey of domestic absentee voters executed by U.S. Vote Foundation. The data gives us some insight into the domestic voting process. First, like overseas and military voters, more voters (59 percent) are using the Internet to create registration forms, a finding which has also been documented by the EAC. Domestic absentee voters also rely on the Internet to request forms; nearly three-quarters of voters used a website to download or generate an absentee ballot request. Second, in contrast to the UOCAVA voting experience, domestic absentee voters rely primarily on traditional postal systems to receive blank ballots and return voted ballots. Third, domestic absentee voters also have trouble receiving their ballots on time, and 14 percent of voters who requested an absentee ballot did not receive one. However, voters must also be sure to submit their forms in a timely manner, as over one-third of registration forms and two-thirds of absentee ballot requests were submitted in October. Further survey attempts are necessary to confirm the extent of these findings. US Vote intends to survey domestic voters again in the 2014 election cycle.
VII OVF and US Vote Year in Review
A. About OVF and US Vote
Overseas Vote Foundation (OVF) helps overseas and military voters participate in federal elections by providing them with public access to innovative voter registration tools and services. Overseas American citizens, State Department employees, and active duty uniformed service members and their accompanying families within and outside of the United States vote under UOCAVA and can all register to vote from abroad using OVF’s services.
OVF is committed to open dialogue, and aims to nurture constructive discussion on the role and use of technology in certain voting processes. OVF believes that, when applied appropriately and transparently, new technologies and the power of the Internet can boost voter participation faster than any other element in the mix of tools.
U.S. Vote Foundation (US Vote) provides online tools to assist U.S. citizens living within the U.S. to register to vote and request their absentee ballot using their state’s specific voter forms. The comprehensive range of services offered by US Vote helps voters navigate today’s complicated landscape of U.S. voting regulations. The website and
Overseas vOte FOundatiOn and u.s. vOte FOundatiOn 2013 POst-electiOn survey rePOrt
31
organization of US Vote are part of the parent organization, OVF.
OVF is a 501(c)(3) nonprofit, nonpartisan public charity incorporated in Delaware. Neither OVF nor US Vote is connected in any way with any U.S. government or U.S. military organization.
B. OVF and US Vote in 2012
Overseas Vote Foundation’s (OVF) reach continued to grow in 2012. OVF now maintains 18 websites: 15 offering the complete suite of OVF integrated voter services, two offering U.S. Vote Foundation’s domestic voter services, and Voto Ausente USA, which provides Spanish-language absentee ballot request support to voters in 12 states. The National Association of Secretaries of State, the United States Postal Service, and the State of Minnesota continue as long-term licensees of the OVF Election Official Directory services, and FedEx Corporation continues to renew its commitment to provide discounted ballot return services from around the world together with OVF through the Express Your Vote program.
OVF Hosted System Solutions sites are in place in Alabama, Kentucky, Minnesota, New York, Ohio, Vermont, Okaloosa County (Florida), and Bernalillo County (New Mexico). OVF also operated sites for Texas and West Virginia from January 2012 to August 2012. Exxon Mobil, the League of Women Voters, the Federation of Women’s Clubs Overseas (FAWCO), and Rock the Vote also feature OVF hosted systems sites for the voters they serve. OVF continues to support our main ‘Classic’ site, as well as Youth Vote Overseas, Military Voter Services, and a ‘Lite’ edition for voters in remote areas with low-bandwidth Internet access. We thank the Federal Voting Assistance Program (FVAP) for their effective support to direct voters to their state-specific voter services sites.
US Vote offered its full services at www.usvotefoundation.org and hosted two additional full-service sites in 2012:
“Your Vote Your Voice” was developed for the National Association of Independent Colleges and Universities (NAICU), and “VotoAusente USA”, a pilot Spanish-language website was developed in conjunction with the Hispanic Communications Network (HCN). The www.votoausenteusa.org website provided state-specific absentee ballot request services for voters in 12 states.
C. Website Users and Visitors
The OVF and US Vote sites were visited by more than one million website users in 2012. Out of those, 188,051 voters used OVF registration and ballot services in 2012. This represents an over 150 percent increase from usage in 2008 (119,342). The top five sites in terms of voter usage of OVF registration and ballot services were OVF Classic, New York, Minnesota, Ohio, and Alabama. The top countries reported among OVF users in 2012 were the United States, United Kingdom, Canada, Germany, United States Uniformed Services, Israel, France, Australia, Japan, and Italy.
Despite the limited outreach conducted during this first year, and its late launch (i.e., June 2012); almost 100,000 visitors viewed the US Vote websites. Furthermore, 14,145 visitors used the absentee ballot request services and 8,161 accessed the voter registration application services.
Also of note was an 86 percent completion rate for voters using the OVF designed voter services to generate their registration/ballot request forms or write-in ballots, indicating that those individuals who began the process completed it. Nearly one-fifth (19 percent) of the users across all sites combined were first-time voters, and one-third (30 percent) of users were uniformed services personnel, spouses or dependents.
D. About the OVF Research Department
OVF is dedicated to advancing research concerning overseas, military, and domestic voting. Surveys and ongoing research are vital to substantiating the efforts of OVF, election officials on all levels, scholars, and advocates in understanding and improving registration and voting processes for all U.S. citizens. Furthermore, there is a growing demand for sound evidence as the basis for policy development and professional practice. OVF seeks to meet this demand through our contribution of methodologically sound research that answers the pressing questions concerning a vital aspect of our democracy: the right to vote.
The OVF Research Department comprises Dr. Claire M. Smith, Research Director; Dr. Judith Murray, Assistant Researcher; Brian Leclair, Research Editor; and Alex Snider, State Voter Information Directory Manager.
The following OVF Research Reports are available for download from our website:
• Post-Election Survey Reports for 2006, 2008, 2010, and 2012
• State Fact Sheets for all 50 States
• OVF Research Newsletter
• Defining the Universe: The Problem of Counting UOCAVA Voters
• These are our Numbers: Civilian Americans Overseas and Voter Turnout
• It’s in the Mail: Surveying UOCAVA Voters and Barriers to Overseas Voting
• Case Study: Minnesota Takes the Lead in 2008
Please visit the OVF Research website for more information: https://www.overseasvotefoundation.org/research-intro

Printed with the generous support of