Embed Size (px)
Citation preview

43Bibliography . . . . . . . . . . . . . . . . . . . . . . . . . . . . . . . . . . . . . . . . . . .38Glossary . . . . . . . . . . . . . . . . . . . . . . . . . . . . . . . . . . . . . . . . . . . . . .36Appendix . . . . . . . . . . . . . . . . . . . . . . . . . . . . . . . . . . . . . . . . . . . . .35Explanatory Notes . . . . . . . . . . . . . . . . . . . . . . . . . . . . . . . . . . . . . . . .
A D D I T I O N A L I N F O R M A T I O N
33Other data sources . . . . . . . . . . . . . . . . . . . . . . . . . . . . . . . . . . . . . . .31Health management . . . . . . . . . . . . . . . . . . . . . . . . . . . . . . . . . . . . . .23Lifestyle risk factors . . . . . . . . . . . . . . . . . . . . . . . . . . . . . . . . . . . . . .14Health status . . . . . . . . . . . . . . . . . . . . . . . . . . . . . . . . . . . . . . . . . .
7Socioeconomic characteristics . . . . . . . . . . . . . . . . . . . . . . . . . . . . . . . . .3Introduction . . . . . . . . . . . . . . . . . . . . . . . . . . . . . . . . . . . . . . . . . . . .
C H A P T E R S
2Notes . . . . . . . . . . . . . . . . . . . . . . . . . . . . . . . . . . . . . . . . . . . . . . . .page
C O N T E N T S
E M B A R G O : 1 1 . 3 0 A M ( C A N B E R R A T I M E ) F R I 2 5 J A N 2 0 0 8
OVERWEIGHT AND OBESITYIN ADULTS A U S T R A L I A
4719.02 0 0 4 – 0 5
For further informationabout these and relatedstatistics, contact theNational Information andReferral Service on1300 135 070.
I N Q U I R I E S
w w w . a b s . g o v . a u
Su s a n L i n a c r e
Ac t i n g Au s t r a l i a n S t a t i s t i c i a n
Where estimates have been rounded, discrepancies may occur between sums of the
component items and totals.
EF F E C T S OF RO U N D I N G
BMI information is presented in this publication for the adult population only (i.e.
persons aged 18 years and over). Respondents who did not provide their height and
weight are excluded from this publication.
Age standardising is a method of removing the influence of age when comparing
populations. It has been applied to the proportions used when making comparisons
over time, or where otherwise noted.
Estimates which have been age standardised have been explicitly identified as such. Refer
to the Glossary for further information.
I N F O R M A T I O N IN TH I S
PU B L I C A T I O N
Excess body weight is a health concern affecting increasing numbers of Australians. This
publication presents information about adults who were classified as being overweight or
obese in the 2004–05 National Health Survey (NHS), and compares this to results from
previous surveys in 1989–90, 1995 and 2001. In the NHS, overweight and obesity are
defined using the Body Mass Index (BMI), which is based on height and weight
information reported by survey respondents. See the Glossary for detailed information
on the BMI and how it is calculated.
The NHS is designed to obtain national benchmarks on a number of health issues such
as chronic disease and risk factors, and to enable changes in health to be monitored over
time.
AB O U T TH I S PU B L I C A T I O N
2 A B S • OV E R W E I G H T A N D OB E S I T Y I N A D U L T S • 4 7 1 9 . 0 • 2 0 0 4 – 0 5
N O T E S

In 2004–05, 54% of adults were classified as overweight or obese. The proportion of men
in these categories was significantly higher than that for women (62% of men compared
to 45% of women). This difference is most evident in the overweight category, where
43% of men were overweight compared to 28% of women. The median age of men who
were overweight or obese (45 years) is lower than that of women (48 years).
In addition to the BMI score calculated from the height and weight reported by
respondents in the NHS, adults were also asked for their own perception of whether
they were of acceptable weight, underweight or overweight. In 2004–05, the majority of
adults considered themselves to be of acceptable weight (63% of men and 59% of
women), while 32% of men and 37% of women considered themselves to be overweight.
However, this was significantly below the proportions classified as overweight or obese
based on their body mass index (BMI), calculated from reported height and weight; 62%
of men and 45% of women. Of those classified as obese, 84% perceived themselves as
overweight compared to only 42% of those who were overweight.
OV E R V I E W
Body Mass Index (BMI) is an internationally recognised measure of the amount of fat and
muscle in the human body and used as an index of obesity. The BMI values in this
publication are calculated from self-reported height and weight. The values are grouped
into body mass categories in line with the WHO and National Health and Medical
Research Council (NHMRC) guidelines, and are used to derive a measure of the
proportion of overweight and obesity in the population. See BMI in the Glossary for
more information.
Because height and weight measures are ‘as reported’ by respondents, they may differ
from those which might be obtained for the same person by actual physical
measurement. Overall, people tend to overstate their height and understate their weight
(ABS 1995).
It should be noted that while BMI is a useful tool to assess and monitor changes in body
mass at the population level, it has been identified as an inappropriate measure for
certain populations and individuals. For example, those whose high body mass is due to
muscle rather than fat.
BO D Y MA S S IN D E X
Overweight and obesity have become a world-wide concern, reaching epidemic
proportions. Excess body weight contributes to medical risk for conditions such as
diabetes, cardiovascular disease, osteoarthritis, some cancers, high blood pressure and
high cholesterol (WHO 2003). High body mass was responsible for 7.5% of the total
burden of disease and injury in Australia in 2003 (AIHW 2007). It has been estimated that
overweight and obesity and their associated illnesses cost Australian society and
governments a total of $21 billion in 2005 (Access Economics 2006).
A range of factors influence the body mass outcomes of given individuals and
populations. Specific lifestyle behaviours such as exercise and dietary habits impact on
weight. This publication presents body mass information and associated characteristics
as reported by adults in the National Health Survey (NHS).
I N T R O D U C T I O N
A B S • OV E R W E I G H T A N D OB E S I T Y I N A D U L T S • 4 7 1 9 . 0 • 2 0 0 4 – 0 5 3
C H A P T E R 1 . I N T R O D U C T I O N
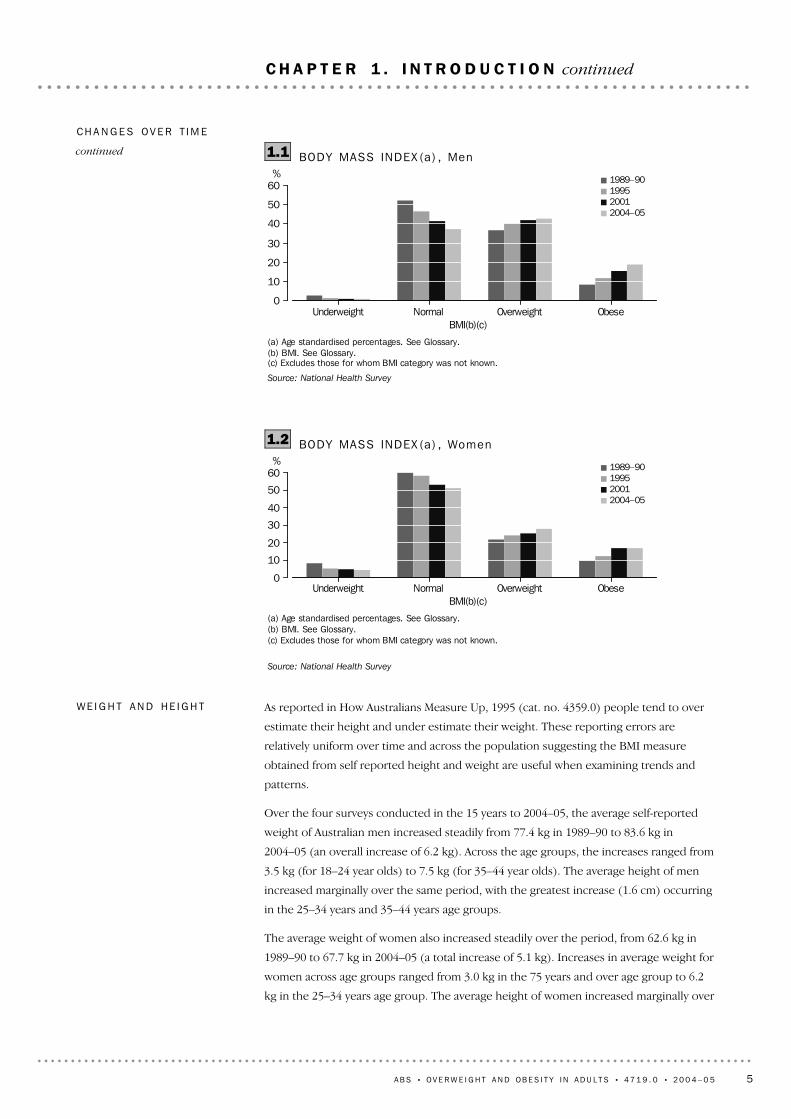
Comparing the results of the 2004–05 survey with those conducted in the preceding 15
years shows increases in the number and proportion of adults who are overweight or
obese. Over the four surveys, the number of overweight or obese adults increased from
4.6 million in 1989–90 to 5.4 million in 1995, 6.6 million in 2001, and 7.4 million in
2004–05.
Even when the effect of changes in the age structure of the adult population over time is
taken into account (i.e. when age standardisation is applied to the data), the proportion
of overweight or obese adults increased steadily over this period - from 38% in 1989–90
to 44% in 1995, 50% in 2001 and 53% in 2004–05. The increase was most marked among
obese adults, with the proportion of the adult population in this category doubling
between 1989–90 and 2004–05 (from 9% to 18%). Over the same period, the proportion
of overweight adults increased from 29% to 35%.
The proportion of men classified as overweight or obese increased steadily from 45% in
1989–90, to 52% in 1995, 58% in 2001, and 62% in 2004–05. The proportion of
overweight or obese women also increased progressively, from 32% in 1989–90, to 37%
in 1995, 42% in 2001, and 45% in 2004–05. During the period, the proportion of men
who were classified as obese more than doubled (from 9% in 1989–90 to 19% in
2004–05) while the proportion of women in this category increased from 10% to 17%.
Increases in the proportion of adults who were overweight or obese occurred among all
age groups. Hence the median age of overweight or obese adults remained similar over
the 15 year period. In 2004–05, the median age of overweight or obese adults was 46
years.
In keeping with the increase in the proportions of the population who were overweight
or obese in the 15 years to 2004–05, there were corresponding decreases in the
proportions of the population who were classified as normal or underweight during this
period. Between 1989–90 and 2004–05, the proportion of men who reported normal
weight decreased from 52% to 37%, and the proportion of women in this category
decreased from 60% to 51%. Over the same period, the proportion of men who were
underweight decreased from 3% to 1%, and the proportion of women in this category
decreased from 8% to 4%.
While adults with higher BMI scores are more likely to assess themselves as being
overweight than those with lower scores, overweight or obese adults (both male and
female) are increasingly likely to see themselves as having an acceptable weight. On an
age standardised basis, the proportion who perceived themselves as having an
acceptable weight increased from 37% in 1995, to 41% in 2001, and 44% in 2004–05. This
change over time was most marked for those in the overweight BMI category (45% in
1995, 53% in 2001 and 57% in 2004–05) although it was also apparent among those in
the obese category (13% in 1995, 17% in 2001 and 16% in 2004–05).
CH A N G E S OV E R T I M E 1
4 A B S • OV E R W E I G H T A N D OB E S I T Y I N A D U L T S • 4 7 1 9 . 0 • 2 0 0 4 – 0 5
C H A P T E R 1 . I N T R O D U C T I O N continued
1 Percentages in this section are based on age standardised data.
As reported in How Australians Measure Up, 1995 (cat. no. 4359.0) people tend to over
estimate their height and under estimate their weight. These reporting errors are
relatively uniform over time and across the population suggesting the BMI measure
obtained from self reported height and weight are useful when examining trends and
patterns.
Over the four surveys conducted in the 15 years to 2004–05, the average self-reported
weight of Australian men increased steadily from 77.4 kg in 1989–90 to 83.6 kg in
2004–05 (an overall increase of 6.2 kg). Across the age groups, the increases ranged from
3.5 kg (for 18–24 year olds) to 7.5 kg (for 35–44 year olds). The average height of men
increased marginally over the same period, with the greatest increase (1.6 cm) occurring
in the 25–34 years and 35–44 years age groups.
The average weight of women also increased steadily over the period, from 62.6 kg in
1989–90 to 67.7 kg in 2004–05 (a total increase of 5.1 kg). Increases in average weight for
women across age groups ranged from 3.0 kg in the 75 years and over age group to 6.2
kg in the 25–34 years age group. The average height of women increased marginally over
WE I G H T AN D HE I G H T
(a) Age standardised percentages. See Glossary.(b) BMI. See Glossary.(c) Excludes those for whom BMI category was not known.
Source: National Health Survey
Underweight Normal Overweight ObeseBMI(b)(c)
%
0
10
20
30
40
50
601989–90199520012004–05
BODY MASS INDEX (a) , Women1.2
(a) Age standardised percentages. See Glossary.(b) BMI. See Glossary.(c) Excludes those for whom BMI category was not known.
Source: National Health Survey
Underweight Normal Overweight ObeseBMI(b)(c)
%
0
10
20
30
40
50
601989–90199520012004–05
BODY MASS INDEX (a) , Men1.1CH A N G E S OV E R T I M E
continued
A B S • OV E R W E I G H T A N D OB E S I T Y I N A D U L T S • 4 7 1 9 . 0 • 2 0 0 4 – 0 5 5
C H A P T E R 1 . I N T R O D U C T I O N continued
the same period, with the greatest increase (1.8 cm) occurring in the 25–34 years age
group.
WE I G H T AN D HE I G H T
continued
6 A B S • OV E R W E I G H T A N D OB E S I T Y I N A D U L T S • 4 7 1 9 . 0 • 2 0 0 4 – 0 5
C H A P T E R 1 . I N T R O D U C T I O N continued
Adults born in Southern and Eastern Europe and the Oceania region (excluding
Australia) were the most likely to be overweight or obese (65% and 63% respectively).
While those born in Australia were less likely to be overweight or obese (55%), adults
born in South East Asia were least likely to be classified in this way (31%).
Adults who arrived in Australia before 1996 were more likely to be overweight or obese
than those who arrived between 1996 and 2005 (54% compared to 40%). Most people
born overseas are in good health on arrival due to the rigorous health checks they
undergo to be eligible for migration. This 'healthy migrant effect' generally wanes as their
length of time in Australia increases, and time since migration is an important factor in
excess weight in migrants (AIHW 2004).
CO U N T R Y OF B I R T H
(a) Overweight or obese BMI. See Glossary.(b) Excludes those for whom BMI category was not known.
Source: National Health Survey 2004–05
18-24 25-34 35-44 45-54 55-64 65-74 75 and overAge group (years)
%
20
40
60
80MenWomen
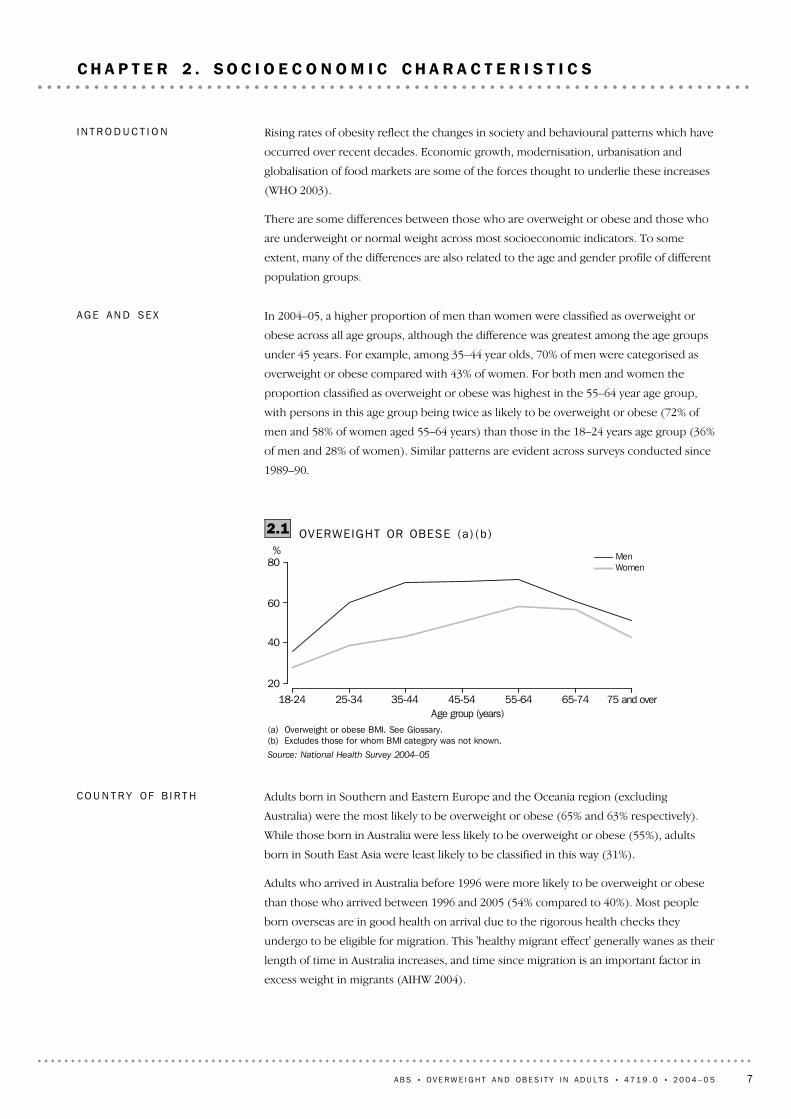
OVERWEIGHT OR OBESE (a) (b )2.1
In 2004–05, a higher proportion of men than women were classified as overweight or
obese across all age groups, although the difference was greatest among the age groups
under 45 years. For example, among 35–44 year olds, 70% of men were categorised as
overweight or obese compared with 43% of women. For both men and women the
proportion classified as overweight or obese was highest in the 55–64 year age group,
with persons in this age group being twice as likely to be overweight or obese (72% of
men and 58% of women aged 55–64 years) than those in the 18–24 years age group (36%
of men and 28% of women). Similar patterns are evident across surveys conducted since
1989–90.
AG E AN D SE X
Rising rates of obesity reflect the changes in society and behavioural patterns which have
occurred over recent decades. Economic growth, modernisation, urbanisation and
globalisation of food markets are some of the forces thought to underlie these increases
(WHO 2003).
There are some differences between those who are overweight or obese and those who
are underweight or normal weight across most socioeconomic indicators. To some
extent, many of the differences are also related to the age and gender profile of different
population groups.
I N T R O D U C T I O N
A B S • OV E R W E I G H T A N D OB E S I T Y I N A D U L T S • 4 7 1 9 . 0 • 2 0 0 4 – 0 5 7
C H A P T E R 2 . S O C I O E C O N O M I C C H A R A C T E R I S T I C S

Of Australian adults in the labour force aged 18–64 years, the proportion of overweight
and obesity was higher among those who were employed (54%) than those who were
unemployed (50%). Over half (53%) of those who were not in the labour force in this
age group were overweight or obese.
Nearly two-thirds (65%) of men who were employed full-time were overweight or obese,
and this was higher than the proportions amongst those employed part-time (51%), the
unemployed (55%) and those not in the labour force (62%). Among women, the
proportion who were overweight or obese was similar regardless of labour force status:
LA B O U R FO R C E
(a) Proportion of persons aged 18 years and over who were overweight or obese.See Glossary.(b) Excludes those for whom BMI category was not known.
Source: National Health Survey 2004–05
Degree/diplomaor higher
qualification
Other qualification No non-schoolqualification
%
0
20
40
60
80MenWomen
HIGHEST NON-SCHOOL QUAL IF ICAT ION (a) (b )2.2
Adults with a degree, diploma or higher qualification were less likely to be overweight or
obese than those with other or no non-school qualifications. Approximately half (48%) of
those with a degree, diploma or higher qualification were overweight or obese,
compared to 57% of those with other qualifications and 55% of those with no
qualifications.
The proportion of men with a degree, diploma or higher qualification who were
overweight or obese was 57%, compared to 65% of men with other qualifications and
62% of men with no non-school qualifications. The proportion of women with a degree,
diploma or higher qualification who were overweight or obese was 38%, while the
proportion was 45% for those with other qualifications and 49% for those with no
qualifications.
H I G H E S T NO N – S C H O O L
QU A L I F I C A T I O N
Those who mainly spoke a language other than English at home were less likely than
English speakers to be classified as overweight or obese (46% compared to 54%). This
partly reflects the differing birthplaces and ages within this group.
MA I N LA N G U A G E SP O K E N
As for the total population, men born overseas were more likely to be to be classified as
overweight or obese than overseas born women (58% compared to 43%). The highest
proportion of overweight and obesity was recorded for men born in Southern and
Eastern Europe (72%), followed by men born in the Oceania region (excluding Australia)
(68%). The largest proportion of overweight and obese women were those born in the
Oceania region (excluding Australia) and Southern and Eastern Europe (both with 56%).
CO U N T R Y OF B I R T H
continued
8 A B S • OV E R W E I G H T A N D OB E S I T Y I N A D U L T S • 4 7 1 9 . 0 • 2 0 0 4 – 0 5
C H A P T E R 2 . S O C I O E C O N O M I C C H A R A C T E R I S T I C S continued
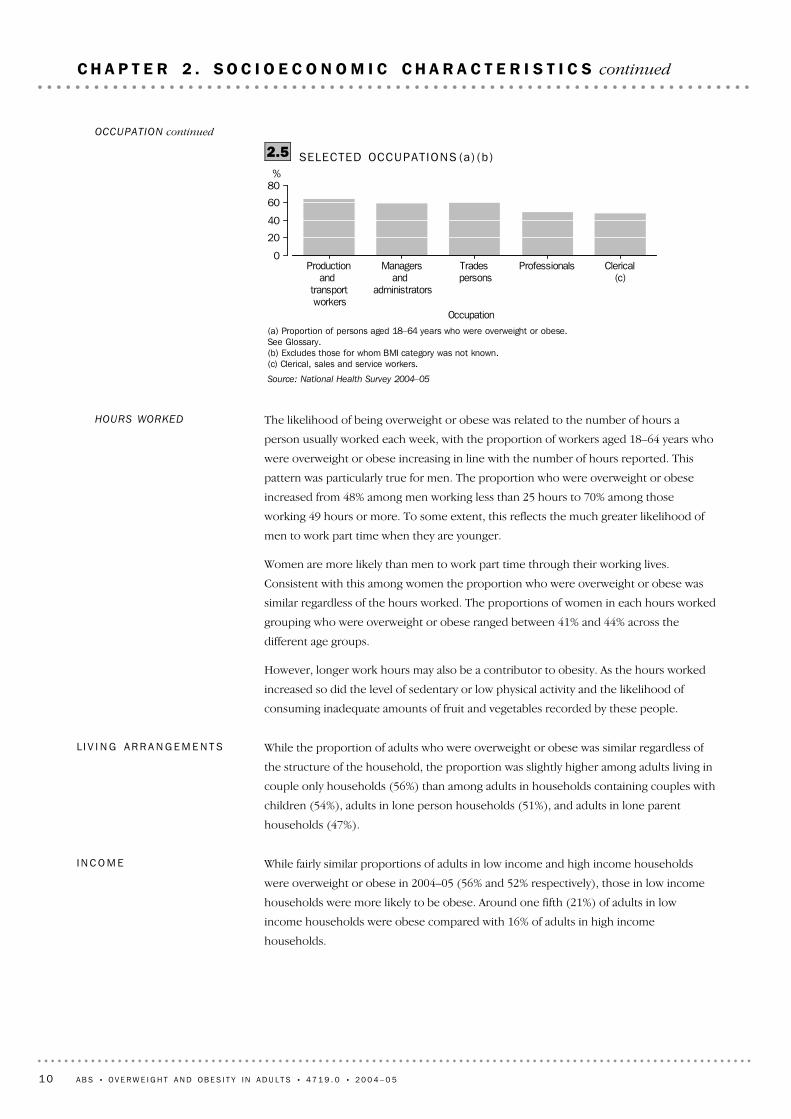
The occupation with the highest proportion of overweight or obese adults aged 18–64
years was production and transport workers (63%), while the lowest proportion was
recorded among clerical, sales and services workers (46%). As with industry, this partly
reflects differences in the age and sex of workers across occupations.
OCCUPATION
(a) Proportion of persons aged 18–64 years who were overweight or obese.See Glossary.(b) Excludes those for whom BMI category was not known.(c) Accommodation, cafes and restaurants.
Source: National Health Survey 2004–05
Mining Construction,electricity,gas andwater
Governmentadministration
anddefence
Hospitality(c) Education Health andcommunityservices
%
0
20
40
60
80
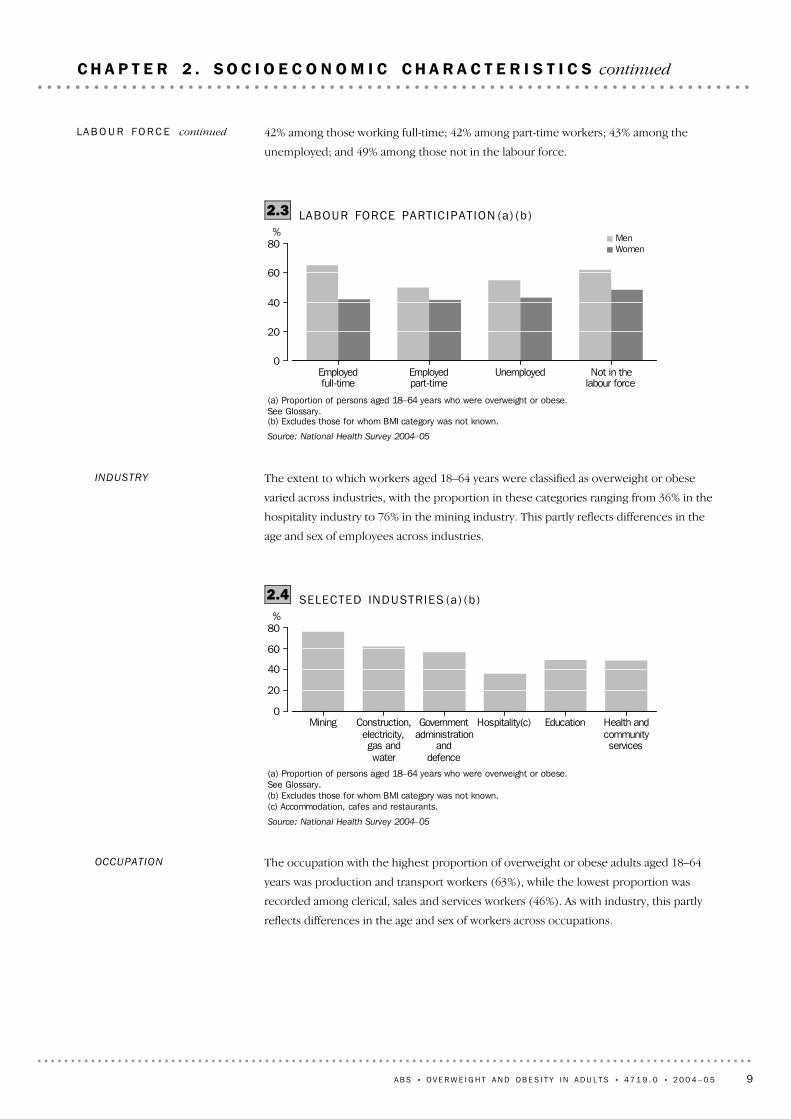
SELECTED INDUSTRIES (a) (b )2.4
The extent to which workers aged 18–64 years were classified as overweight or obese
varied across industries, with the proportion in these categories ranging from 36% in the
hospitality industry to 76% in the mining industry. This partly reflects differences in the
age and sex of employees across industries.
INDUSTRY
(a) Proportion of persons aged 18–64 years who were overweight or obese.See Glossary.(b) Excludes those for whom BMI category was not known.
Source: National Health Survey 2004–05
Employedfull-time
Employedpart-time
Unemployed Not in thelabour force
%
0
20
40
60
80MenWomen
LABOUR FORCE PARTIC IPAT ION (a) (b )2.3
42% among those working full-time; 42% among part-time workers; 43% among the
unemployed; and 49% among those not in the labour force.
LA B O U R FO R C E continued
A B S • OV E R W E I G H T A N D OB E S I T Y I N A D U L T S • 4 7 1 9 . 0 • 2 0 0 4 – 0 5 9
C H A P T E R 2 . S O C I O E C O N O M I C C H A R A C T E R I S T I C S continued
While fairly similar proportions of adults in low income and high income households
were overweight or obese in 2004–05 (56% and 52% respectively), those in low income
households were more likely to be obese. Around one fifth (21%) of adults in low
income households were obese compared with 16% of adults in high income
households.
I N C O M E
While the proportion of adults who were overweight or obese was similar regardless of
the structure of the household, the proportion was slightly higher among adults living in
couple only households (56%) than among adults in households containing couples with
children (54%), adults in lone person households (51%), and adults in lone parent
households (47%).
L I V I N G AR R A N G E M E N T S
The likelihood of being overweight or obese was related to the number of hours a
person usually worked each week, with the proportion of workers aged 18–64 years who
were overweight or obese increasing in line with the number of hours reported. This
pattern was particularly true for men. The proportion who were overweight or obese
increased from 48% among men working less than 25 hours to 70% among those
working 49 hours or more. To some extent, this reflects the much greater likelihood of
men to work part time when they are younger.
Women are more likely than men to work part time through their working lives.
Consistent with this among women the proportion who were overweight or obese was
similar regardless of the hours worked. The proportions of women in each hours worked
grouping who were overweight or obese ranged between 41% and 44% across the
different age groups.
However, longer work hours may also be a contributor to obesity. As the hours worked
increased so did the level of sedentary or low physical activity and the likelihood of
consuming inadequate amounts of fruit and vegetables recorded by these people.
HOURS WORKED
(a) Proportion of persons aged 18–64 years who were overweight or obese.See Glossary.(b) Excludes those for whom BMI category was not known.(c) Clerical, sales and service workers.
Source: National Health Survey 2004–05
Productionand
transport workers
Managersand
administrators
Trades persons
Professionals Clerical(c)
Occupation
%
0
20
40
60
80
SELECTED OCCUPAT IONS (a) (b )2.5OCCUPATION continued
10 A B S • OV E R W E I G H T A N D OB E S I T Y I N A D U L T S • 4 7 1 9 . 0 • 2 0 0 4 – 0 5
C H A P T E R 2 . S O C I O E C O N O M I C C H A R A C T E R I S T I C S continued
After adjusting for age differences between the two populations and for differences in
non-response in the 2004–05 NHS and the 2004–05 National Aboriginal and Torres Strait
Islander Health Survey (NATSIHS), Indigenous Australians (aged 18 years or more) were
17% more likely to be overweight or obese than non-Indigenous Australians.
Of Indigenous respondents aged 18 years or more, an estimated 60% were overweight or
obese. Among men, 62% were overweight or obese. Among women, 58% were
overweight or obese. Some 35% of Indigenous adults were classified as being of normal
weight, and 4% were underweight.
The proportion of adults who were overweight or obese was higher among Indigenous
Australians than the non-Indigenous population in all age groups. While this pattern held
for women, among men the proportion who were overweight or obese was lower than
the non-Indigenous population in the middle years (68% and 72% respectively in the
35–54 years age group). In each age group the disparity between Indigenous and
I N D I G E N O U S
AU S T R A L I A N S
(a) Proportion of persons aged 18 years and over who were overweight or obese.See Glossary.(b) Excludes those for whom BMI category was not known.
Source: National Health Survey 2004–05
Major Cities of Australia Inner Regional Australia Outer RegionalAustralia/other areas
%
0
20
40
60
80MenWomen
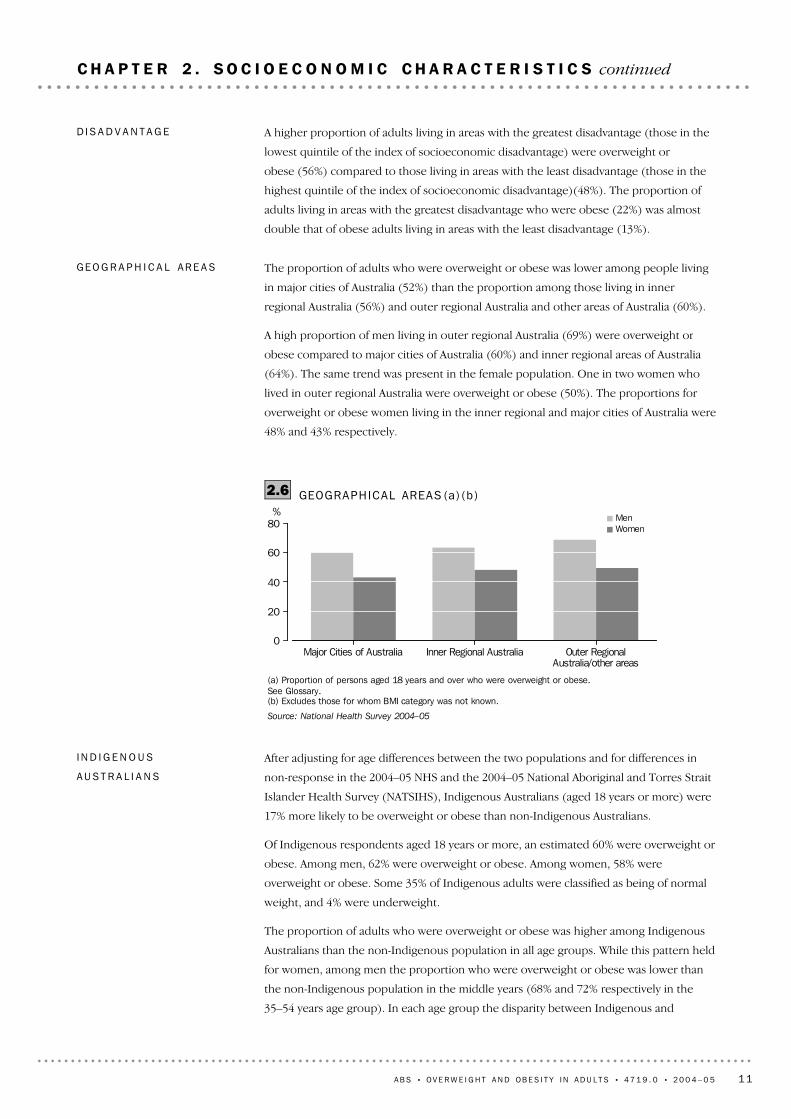
GEOGRAPHICAL AREAS (a) (b )2.6
The proportion of adults who were overweight or obese was lower among people living
in major cities of Australia (52%) than the proportion among those living in inner
regional Australia (56%) and outer regional Australia and other areas of Australia (60%).
A high proportion of men living in outer regional Australia (69%) were overweight or
obese compared to major cities of Australia (60%) and inner regional areas of Australia
(64%). The same trend was present in the female population. One in two women who
lived in outer regional Australia were overweight or obese (50%). The proportions for
overweight or obese women living in the inner regional and major cities of Australia were
48% and 43% respectively.
GE O G R A P H I C A L AR E A S
A higher proportion of adults living in areas with the greatest disadvantage (those in the
lowest quintile of the index of socioeconomic disadvantage) were overweight or
obese (56%) compared to those living in areas with the least disadvantage (those in the
highest quintile of the index of socioeconomic disadvantage)(48%). The proportion of
adults living in areas with the greatest disadvantage who were obese (22%) was almost
double that of obese adults living in areas with the least disadvantage (13%).
D I S A D V A N T A G E
A B S • OV E R W E I G H T A N D OB E S I T Y I N A D U L T S • 4 7 1 9 . 0 • 2 0 0 4 – 0 5 11
C H A P T E R 2 . S O C I O E C O N O M I C C H A R A C T E R I S T I C S continued

non-Indigenous people was greater for females than for males. Further data on age and
sex is available in Appendix 1.
I N D I G E N O U S
AU S T R A L I A N S continued
12 A B S • OV E R W E I G H T A N D OB E S I T Y I N A D U L T S • 4 7 1 9 . 0 • 2 0 0 4 – 0 5
C H A P T E R 2 . S O C I O E C O N O M I C C H A R A C T E R I S T I C S continued

(d) Includes inadequately described qualifications.(e) Persons aged 18–64 years.(f) Persons aged 18–64 years.(g) Household income. See Glossary.(h) Index of disadvantage. See Glossary.Source: National Health Survey 2004–05
* estimate has a relative standard error of 25% to 50% and should beused with caution
** estimate has a relative standard error greater than 50% and isconsidered too unreliable for general use
(a) BMI. See Glossary.(b) Data on age and sex available in Appendix 1.(c) Excludes those for whom BMI category was not known.
2 983.7100.048.413.235.251.649.02.6Fifth quintile2 453.0100.056.421.934.543.640.43.2First quintile
Index of disadvantage(h)
2 476.5100.052.215.536.647.846.21.7Fifth quintile2 465.1100.056.121.234.943.940.53.5First quintile
Household income(g)
4 391.9100.050.217.332.849.846.03.8All other households5 454.4100.054.418.535.945.643.12.5Couple with children3 914.4100.056.118.138.043.942.51.4Couple only
Living arrangements
1 641.4100.059.523.036.540.538.51.9Outer regional Australia/other
areas
2 695.4100.055.919.536.444.141.62.5Inner regional Australia9 423.8100.051.816.735.148.245.52.7Major cities of Australia
Geographical areas
2 095.6100.065.321.443.934.734.0*0.749 hours and over5 139.2100.052.816.836.047.244.92.325 to 48 hours1 619.7100.042.914.228.757.153.53.7Less than 25 hours
Hours worked(f)
2 348.2100.052.821.831.047.243.83.4Not in the labour force362.9100.049.718.930.950.346.4*3.8Unemployed
8 854.4100.054.017.436.546.043.92.2EmployedLabour force status(e)
6 299.9100.055.119.835.344.942.02.9No non-school qualification3 609.2100.057.419.937.642.640.91.7Other qualification(d)3 804.7100.047.813.534.352.249.52.7
Degree/diploma or higherqualification
Highest non-schoolqualification
1 306.2100.046.114.132.053.949.74.2Language other than English12 449.6100.054.318.435.945.743.32.4English
Main language spoken athome
3 975.4100.050.815.935.049.246.13.1Total overseas-born817.6100.040.49.930.559.653.66.0Arrived 1996–2005
3 157.7100.053.517.436.146.544.22.3Arrived before 1996Born overseas
558.1100.046.411.435.053.652.0*1.6All other countries439.8100.031.13.227.968.961.07.9South East Asia211.8100.052.916.736.147.146.7**0.4
North Africa and the MiddleEast
636.2100.064.821.643.335.233.5*1.7Southern and Eastern Europe313.2100.053.918.135.846.144.1*2.0Other North West Europe
1 027.6100.055.618.337.344.442.51.9United Kingdom444.6100.062.925.537.437.135.3*1.8Other Oceania
9 785.3100.054.618.935.845.443.02.4AustraliaCountry of birth
'000%%%%%%%
Total(c)Total(c)Overweight
or obeseObeseOverweight
Underweight
or normalNormalUnderweight
BODY MASS INDEX
BODY MASS INDEX (a) , Soc ioeconomic charac te r i s t i cs (b )2.7
A B S • OV E R W E I G H T A N D OB E S I T Y I N A D U L T S • 4 7 1 9 . 0 • 2 0 0 4 – 0 5 13
C H A P T E R 2 . S O C I O E C O N O M I C C H A R A C T E R I S T I C S continued

The likelihood of having a long-term condition (one that lasted or was expected to last
for six months or more) among adults who were overweight was similar to the general
population (around 87%). However, people who were obese were slightly more likely to
have a long-term condition.
Proportionally more overweight or obese adults had multiple long-term conditions.
Overall, the average number of long-term conditions reported by each adult was 3.
Obese adults reported having an average of 4 conditions. Of those with 5 or more
long-term conditions, 61% were overweight or obese.
LO N G - T E R M CO N D I T I O N S
Obese women were equally as likely as obese men to rate their health as excellent (9%
and 8% respectively) or very good (33% and 31%).
Underweight men were more likely than underweight women to place their health
self-assessment at the extremes of the scale, that is: excellent (29% and 22% respectively)
or poor (17% and 10%).
(a) Self assessed health. See Glossary.(b) BMI. See Glossary.(c) Excludes those for whom BMI category was not known.
Source: National Health Survey 2004–05
Underweight Normal Overweight ObeseBody Mass Index(b)(c)
%
0
10
20
30
40ExcellentVery goodGoodFairPoor
SELF ASSESSED HEALTH STATUS (a)3.1
In the NHS, respondents reported their general assessment of their own health, selecting
a single option from a five point scale: excellent, very good, good, fair, poor.
In 2004–05, 20% of adults reported their self assessed health status as excellent, 35% very
good, 28% good, 12% fair and 5% poor.
Adults classified as overweight or obese were less likely than those classified as
underweight or normal weight to assess their health as excellent or very good (50%
compared with 62%). Overweight or obese adults were more likely than those classified
as underweight or normal weight to rate their health as fair or poor (19% compared to
13%).
SE L F AS S E S S E D HE A L T H
ST A T U S
Being overweight or obese is a modifiable risk factor for a number of chronic diseases,
including National Health Priority Area (NHPA) conditions such as diabetes,
cardiovascular disease, osteoarthritis and some cancers. Excess body weight is also
associated with a range of risk factors for chronic disease such as high blood pressure
and high blood cholesterol (AIHW 2006).
I N T R O D U C T I O N
14 A B S • OV E R W E I G H T A N D OB E S I T Y I N A D U L T S • 4 7 1 9 . 0 • 2 0 0 4 – 0 5
C H A P T E R 3 . H E A L T H S T A T U S
Forms of heart disease include hypertensive disease and ischaemic heart disease
(including angina). Being overweight or obese is a major risk factor for heart disease
(AIHW 2007).
In 2004–05, 15% of Australian adults (approximately 2.1 million people) had heart
disease. Of adults who were overweight or obese, 20% had heart disease. Obese adults
were most likely to report heart disease. More than a quarter (26%) of adults who were
obese reported heart disease, while 18% of those who were overweight reported heart
disease. This rate halved for those with a normal weight (10%) and decreased further in
those who were underweight (8%).
Three quarters (75%) of males with heart disease were overweight or obese, whereas
two thirds (66%) of females with heart disease were overweight or obese. Although
nearly half (46%) of males with heart disease were overweight, the proportion of females
with heart disease was evenly spread between the normal (32%), overweight (35%) and
obese (31%) categories.
Heart disease
(a) BMI. See Glossary.(b) Excludes those for whom BMI category was not known.
Source: National Health Survey 2004–05
Underweight Normal Overweight ObeseBody Mass Index(a)(b)
%
0
10
20
30
40MenWomen
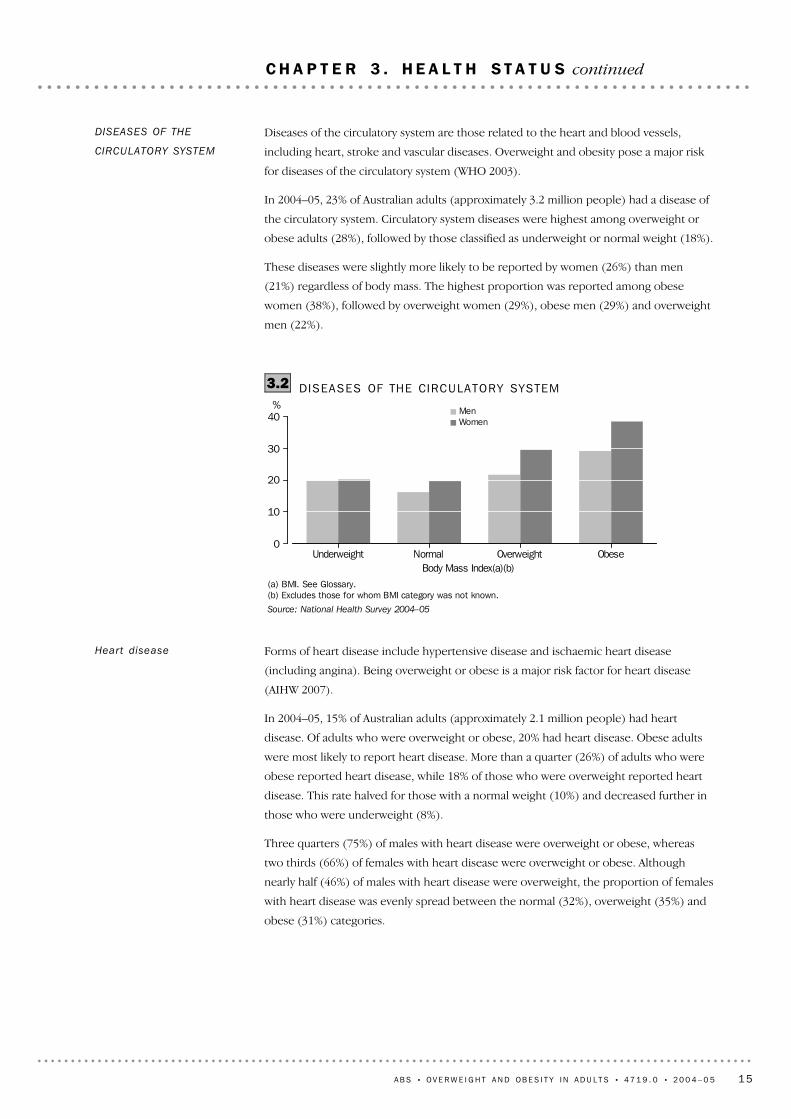
DISEASES OF THE CIRCULATORY SYSTEM3.2
Diseases of the circulatory system are those related to the heart and blood vessels,
including heart, stroke and vascular diseases. Overweight and obesity pose a major risk
for diseases of the circulatory system (WHO 2003).
In 2004–05, 23% of Australian adults (approximately 3.2 million people) had a disease of
the circulatory system. Circulatory system diseases were highest among overweight or
obese adults (28%), followed by those classified as underweight or normal weight (18%).
These diseases were slightly more likely to be reported by women (26%) than men
(21%) regardless of body mass. The highest proportion was reported among obese
women (38%), followed by overweight women (29%), obese men (29%) and overweight
men (22%).
DISEASES OF THE
CIRCULATORY SYSTEM
A B S • OV E R W E I G H T A N D OB E S I T Y I N A D U L T S • 4 7 1 9 . 0 • 2 0 0 4 – 0 5 15
C H A P T E R 3 . H E A L T H S T A T U S continued

Diseases of the musculoskeletal system and connective tissue manifest in many forms of
joint problems and disorders of the bones and muscles and their attachments, including
arthritis, osteoporosis, rheumatism, back pain and disc disorders. Chronic
musculoskeletal conditions are among the debilitating health problems associated with
obesity (WHO 2003).
DISEASES OF THE
MUSCULOSKELETAL
SYSTEM AND CONNECTIVE
TISSUE
(a) BMI. See Glossary.(b) Excludes those for whom BMI category was not known.
Source: National Health Survey 2004–05
Underweight Normal weight Overweight ObeseBody Mass Index(a)(b)
%
0
5
10
15
HIGH BLOOD CHOLESTEROL3.3
High blood cholesterol is a risk factor for diseases of the circulatory system such as
coronary heart disease and stroke (AIHW 2007a). As for high blood pressure, overweight
and obesity lead to adverse metabolic effects on blood cholesterol (WHO 2003).
In 2004–05, 9% of Australian adults (approximately 1.3 million people) had high blood
cholesterol. The proportion of people with high cholesterol increased with BMI
category, with a marked increase occurring between the normal weight and overweight
categories where the proportion doubled. Among those classified as underweight or
normal weight 6% reported high blood cholesterol, compared to those classified as
overweight or obese (12%) with high cholesterol.
High cholesterol was reported by 9% of both men and women and there was very little
difference between the sexes across BMI categories.
HIGH BLOOD
CHOLESTEROL
HY P E R T E N S I V E D I S E A S E
Hypertensive disease or high blood pressure is the most common form of heart disease,
and is a risk factor for other more severe diseases of the circulatory system such as
coronary heart disease and stroke (AIHW 2007). Overweight and obesity lead to adverse
metabolic effects on blood pressure (World Health Organisation 2003).
In 2004–05, 14% of Australian adults (approximately 1.9 million people) had hypertensive
disease. The proportion with high blood pressure increased with BMI category. Among
those in the underweight category 7% reported elevated blood pressure, followed by
adults of normal weight (9%), 16% of those who were overweight and 24% among those
classified as obese.
Heart disease continued
16 A B S • OV E R W E I G H T A N D OB E S I T Y I N A D U L T S • 4 7 1 9 . 0 • 2 0 0 4 – 0 5
C H A P T E R 3 . H E A L T H S T A T U S continued

Of those who were overweight or obese, 23% reported arthritis, including osteoarthritis
(19% of men and 29% of women). Arthritis is age related, and the proportion of
overweight or obese adults with arthritis increased with age with the highest proportion
in the 75 years or more age group (54%).
OS T E O A R T H R I T I S
Osteoarthritis is among the most common forms of arthritis. It is a degenerative
condition caused mainly by accumulated wear of the cartilage that cushions the ends of
bones where they meet to form a joint. As the cartilage degenerates the normal
functioning of the joint is disrupted causing pain. The disease affects mainly the hands,
spine and weight-bearing joints such as the hips, knees and ankles. Excess body weight is
a risk factor for osteoarthritis (AIHW 2007).
In 2004–05, 10% of Australian adults (approximately 1.4 million people) had
osteoarthritis. Of adults who reported osteoarthritis, 63% were classified as overweight
or obese. The prevalence of this condition was higher for women (13%) than men (8%),
and this was the case in all except the underweight BMI category. Of women classified as
overweight or obese, 17% reported osteoarthritis compared to 9% of those women
classified as underweight or normal weight. In contrast, for overweight or obese men, 9%
reported osteoarthritis compared to 7% of underweight or normal weight men.
Arthr i t is
(a) BMI. See Glossary.(b) Excludes those for whom BMI category was not known.
Source: National Health Survey 2004–05
Underweight Normal Overweight ObeseBody Mass Index (a)(b)
%
0
15
30
45
60MenWomen
DISEASES OF THE MUSCULOSKELETAL SYSTEM3.4
In 2004–05, 40% of Australian adults (approximately 5.5 million people) had a disease of
the musculoskeletal system. Musculoskeletal diseases were more prevalent among
overweight or obese adults (44%), than among those classified as underweight or normal
weight (35%).
The proportion of women (42%) with diseases of the musculoskeletal system was higher
than the corresponding proportion of men (38%), and this was evident in all BMI
categories. More than half (52%) of obese women, and 45% of overweight women had a
musculoskeletal disease. In men, 45% of the obese and 40% of the overweight had at
least one of these conditions.
DISEASES OF THE
MUSCULOSKELETAL
SYSTEM AND CONNECTIVE
TISSUE continued
A B S • OV E R W E I G H T A N D OB E S I T Y I N A D U L T S • 4 7 1 9 . 0 • 2 0 0 4 – 0 5 17
C H A P T E R 3 . H E A L T H S T A T U S continued
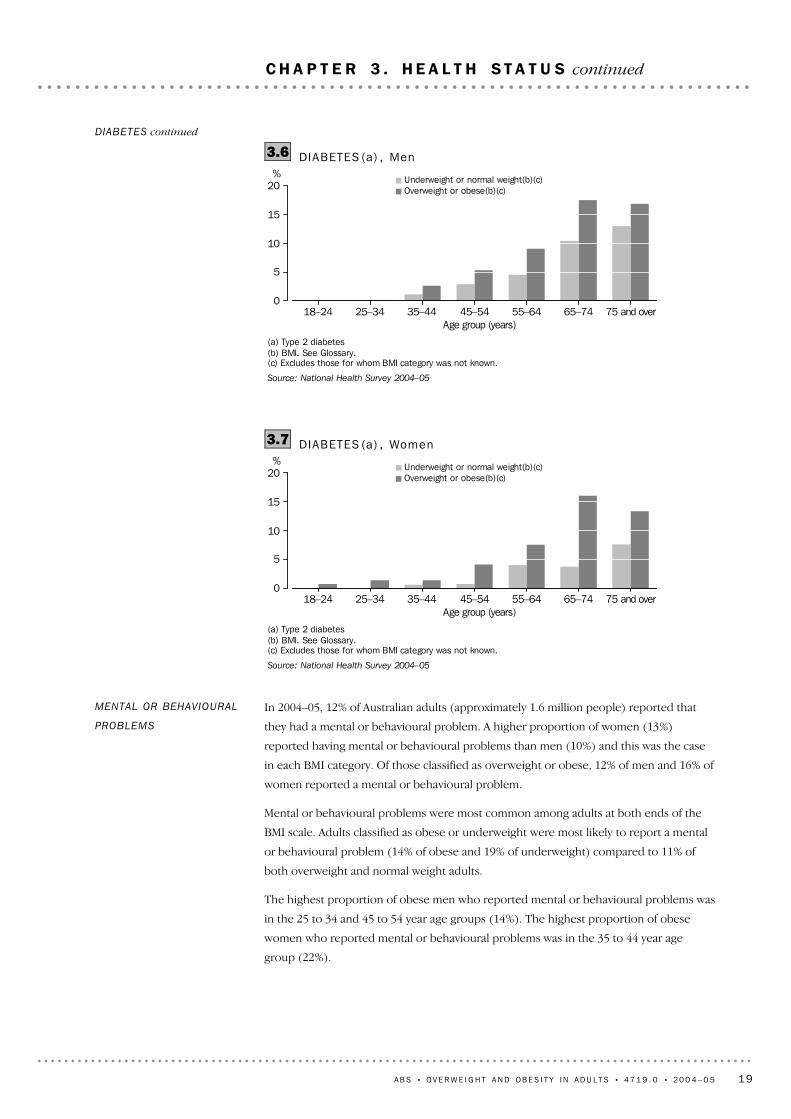
For both men and women, and in most age groups, the proportion with Type 2 diabetes
was higher among those who were overweight or obese than it was in those who were
underweight or normal weight. This difference according to BMI category was
particularly marked for women.
(a) Type 2 diabetes(b) BMI. See Glossary.(c) Excludes those for whom BMI category was not known.
Source: National Health Survey 2004–05
Underweight Normal weight Overweight ObeseBody Mass Index (b)(c)
%
0
2
4
6
8
10MenWomen
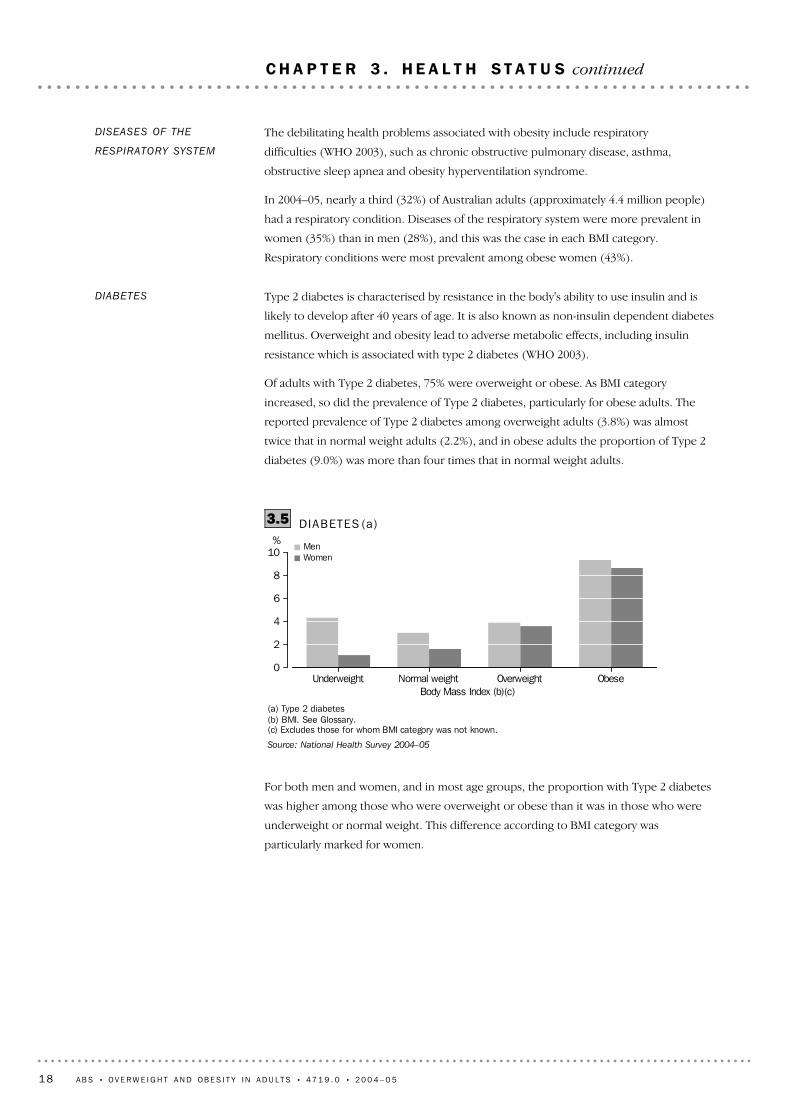
DIABETES (a)3.5
Type 2 diabetes is characterised by resistance in the body's ability to use insulin and is
likely to develop after 40 years of age. It is also known as non-insulin dependent diabetes
mellitus. Overweight and obesity lead to adverse metabolic effects, including insulin
resistance which is associated with type 2 diabetes (WHO 2003).
Of adults with Type 2 diabetes, 75% were overweight or obese. As BMI category
increased, so did the prevalence of Type 2 diabetes, particularly for obese adults. The
reported prevalence of Type 2 diabetes among overweight adults (3.8%) was almost
twice that in normal weight adults (2.2%), and in obese adults the proportion of Type 2
diabetes (9.0%) was more than four times that in normal weight adults.
DIABETES
The debilitating health problems associated with obesity include respiratory
difficulties (WHO 2003), such as chronic obstructive pulmonary disease, asthma,
obstructive sleep apnea and obesity hyperventilation syndrome.
In 2004–05, nearly a third (32%) of Australian adults (approximately 4.4 million people)
had a respiratory condition. Diseases of the respiratory system were more prevalent in
women (35%) than in men (28%), and this was the case in each BMI category.
Respiratory conditions were most prevalent among obese women (43%).
DISEASES OF THE
RESPIRATORY SYSTEM
18 A B S • OV E R W E I G H T A N D OB E S I T Y I N A D U L T S • 4 7 1 9 . 0 • 2 0 0 4 – 0 5
C H A P T E R 3 . H E A L T H S T A T U S continued
In 2004–05, 12% of Australian adults (approximately 1.6 million people) reported that
they had a mental or behavioural problem. A higher proportion of women (13%)
reported having mental or behavioural problems than men (10%) and this was the case
in each BMI category. Of those classified as overweight or obese, 12% of men and 16% of
women reported a mental or behavioural problem.
Mental or behavioural problems were most common among adults at both ends of the
BMI scale. Adults classified as obese or underweight were most likely to report a mental
or behavioural problem (14% of obese and 19% of underweight) compared to 11% of
both overweight and normal weight adults.
The highest proportion of obese men who reported mental or behavioural problems was
in the 25 to 34 and 45 to 54 year age groups (14%). The highest proportion of obese
women who reported mental or behavioural problems was in the 35 to 44 year age
group (22%).
MENTAL OR BEHAVIOURAL
PROBLEMS
(a) Type 2 diabetes(b) BMI. See Glossary.(c) Excludes those for whom BMI category was not known.
Source: National Health Survey 2004–05
18–24 25–34 35–44 45–54 55–64 65–74 75 and overAge group (years)
%
0
5
10
15
20Underweight or normal weight(b)(c)Overweight or obese(b)(c)
DIABETES (a) , Women3.7
(a) Type 2 diabetes(b) BMI. See Glossary.(c) Excludes those for whom BMI category was not known.
Source: National Health Survey 2004–05
18–24 25–34 35–44 45–54 55–64 65–74 75 and overAge group (years)
%
0
5
10
15
20Underweight or normal weight(b)(c)Overweight or obese(b)(c)
DIABETES (a) , Men3.6DIABETES continued
A B S • OV E R W E I G H T A N D OB E S I T Y I N A D U L T S • 4 7 1 9 . 0 • 2 0 0 4 – 0 5 19
C H A P T E R 3 . H E A L T H S T A T U S continued
Of people classified as overweight or obese, 16% reported experiencing one or more
injuries in the four weeks prior to interview, proportionally less than people who were
classified as underweight or normal weight (18%). However, of those classified as
overweight or obese who had experienced an injury, 26% reported cutting down on their
usual activities because of the injury (or most recent if more than one), compared to
21% of those classified as underweight or normal weight who had an injury.
I N J U R I E S
Among adults with a very high level of psychological distress, the extremes of the BMI
scale were over-represented. A higher proportion of adults with a very high level of
psychological distress were obese (24%) or underweight (7%), compared with adults in
the total Australian population (where 18% were obese and 3% were underweight).
(a) Psychological distress. See Glossary.(b) BMI. See Glossary.(c) Excludes those for whom BMI category was not known.
Source: National Health Survey 2004–05
Underweight Normal Overweight ObeseBody Mass Index (b)(c)
%
0
5
10
15
20
25MenWomen
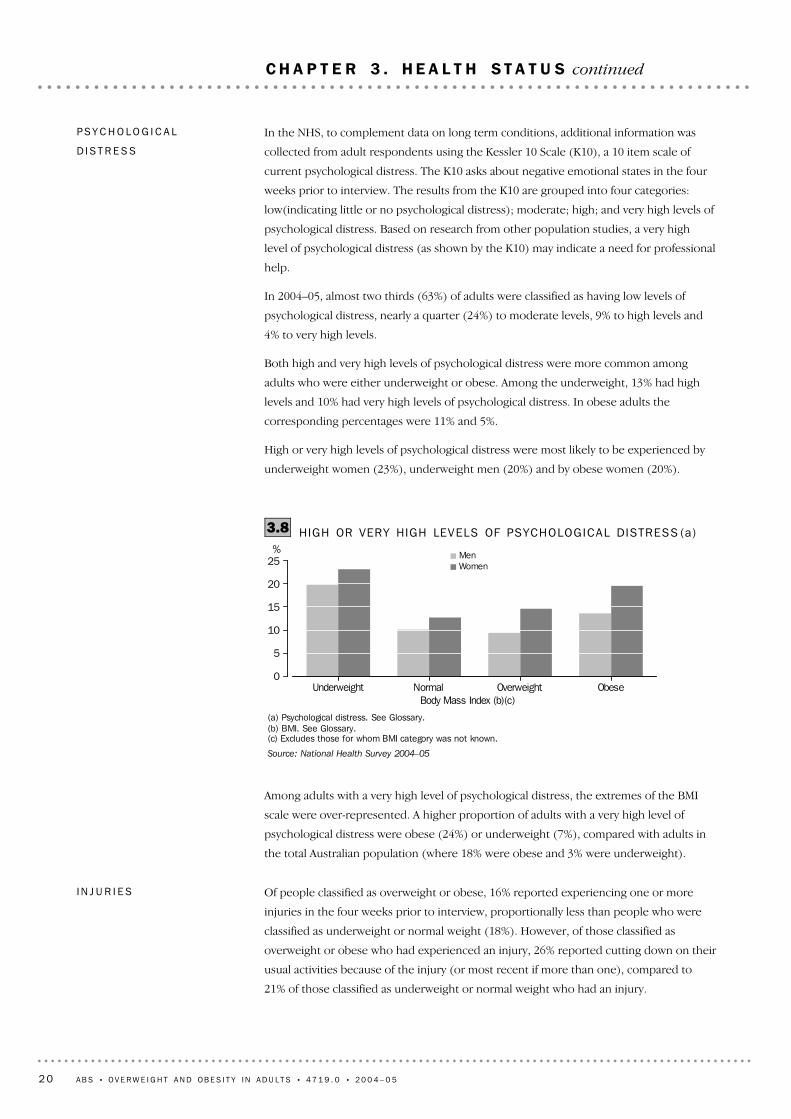
HIGH OR VERY HIGH LEVELS OF PSYCHOLOGICAL DISTRESS (a)3.8
In the NHS, to complement data on long term conditions, additional information was
collected from adult respondents using the Kessler 10 Scale (K10), a 10 item scale of
current psychological distress. The K10 asks about negative emotional states in the four
weeks prior to interview. The results from the K10 are grouped into four categories:
low(indicating little or no psychological distress); moderate; high; and very high levels of
psychological distress. Based on research from other population studies, a very high
level of psychological distress (as shown by the K10) may indicate a need for professional
help.
In 2004–05, almost two thirds (63%) of adults were classified as having low levels of
psychological distress, nearly a quarter (24%) to moderate levels, 9% to high levels and
4% to very high levels.
Both high and very high levels of psychological distress were more common among
adults who were either underweight or obese. Among the underweight, 13% had high
levels and 10% had very high levels of psychological distress. In obese adults the
corresponding percentages were 11% and 5%.
High or very high levels of psychological distress were most likely to be experienced by
underweight women (23%), underweight men (20%) and by obese women (20%).
PS Y C H O L O G I C A L
D I S T R E S S
20 A B S • OV E R W E I G H T A N D OB E S I T Y I N A D U L T S • 4 7 1 9 . 0 • 2 0 0 4 – 0 5
C H A P T E R 3 . H E A L T H S T A T U S continued
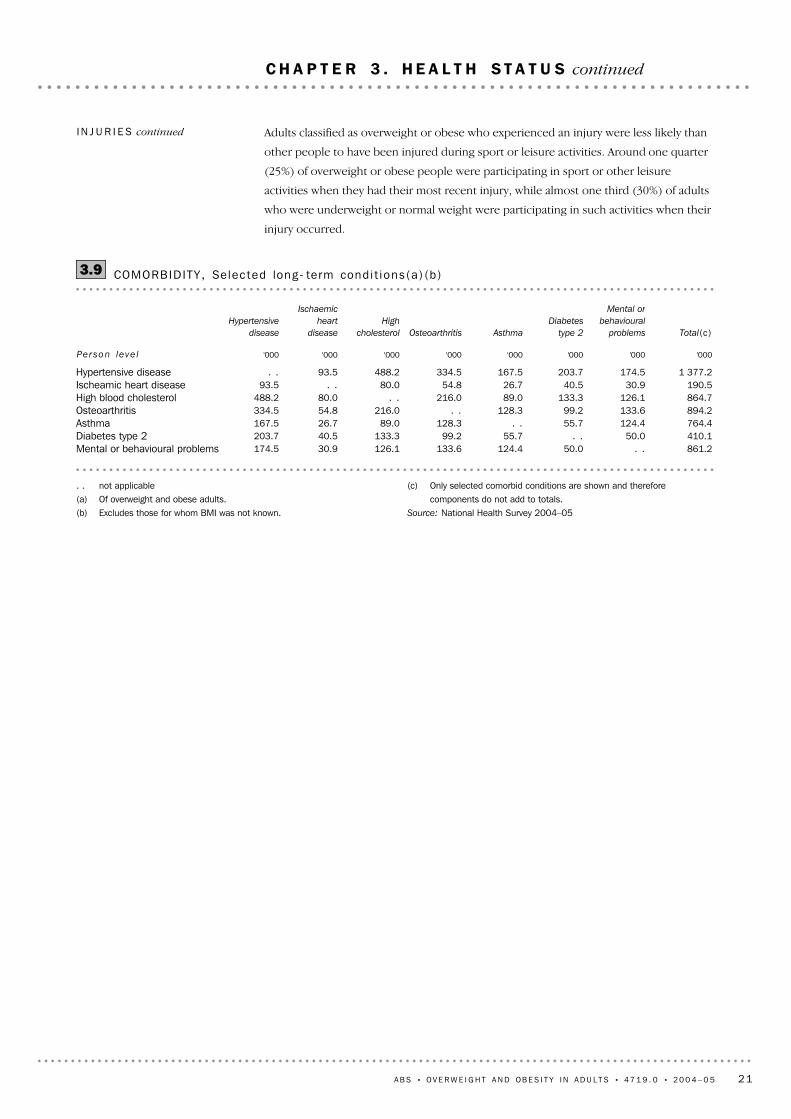
(c) Only selected comorbid conditions are shown and thereforecomponents do not add to totals.
Source: National Health Survey 2004–05
. . not applicable(a) Of overweight and obese adults.(b) Excludes those for whom BMI was not known.
861.2. .50.0124.4133.6126.130.9174.5Mental or behavioural problems410.150.0. .55.799.2133.340.5203.7Diabetes type 2764.4124.455.7. .128.389.026.7167.5Asthma894.2133.699.2128.3. .216.054.8334.5Osteoarthritis864.7126.1133.389.0216.0. .80.0488.2High blood cholesterol190.530.940.526.754.880.0. .93.5Ischeamic heart disease
1 377.2174.5203.7167.5334.5488.293.5. .Hypertensive disease
'000'000'000'000'000'000'000'000
Total(c)
Mental or
behavioural
problems
Diabetes
type 2AsthmaOsteoarthritis
High
cholesterol
Ischaemic
heart
disease
Hypertensive
disease
Per son le ve l
COMORBIDITY , Selec ted long- term condi t ions (a ) (b )3.9
Adults classified as overweight or obese who experienced an injury were less likely than
other people to have been injured during sport or leisure activities. Around one quarter
(25%) of overweight or obese people were participating in sport or other leisure
activities when they had their most recent injury, while almost one third (30%) of adults
who were underweight or normal weight were participating in such activities when their
injury occurred.
I N J U R I E S continued
A B S • OV E R W E I G H T A N D OB E S I T Y I N A D U L T S • 4 7 1 9 . 0 • 2 0 0 4 – 0 5 21
C H A P T E R 3 . H E A L T H S T A T U S continued

(c) As measured by the Kessler 10 scale, from which a score of10 to 50 is produced. See Psychological distress inGlossary.
(d) Injury sustained in the 4 weeks prior to interview.Source: National Health Survey 2004–05
* estimate has a relative standard error of 25% to 50% andshould be used with caution
(a) Excludes those for whom BMI category was not stated ornot known.
(b) Per cent of people in each BMI category who reported therelevant long-term condition.
2 318.516.815.216.018.217.4InjuryInjury(d)
13 760.6100.0100.0100.0100.0100.0Total
626.14.56.94.13.511.3Poor1 598.911.618.011.98.811.4Fair3 897.428.334.729.025.129.3Good4 875.735.431.836.536.724.9Very good2 762.520.18.518.526.023.1Excellent
Self assessed health status
13 760.6100.0100.0100.0100.0100.0Total
508.03.74.93.43.19.9Very high1 232.29.011.48.08.512.6High3 312.824.123.223.425.221.7Moderate8 693.963.260.365.263.255.0Low
Level of psychological distress(c)
12 000.687.290.488.285.286.0Total with a long-term condition(b)1 608.811.713.710.711.318.9Mental and behavioural problems
549.44.09.03.82.21.7Type 2 diabetes mellitus4 372.231.834.831.131.032.9Diseases of the respiratory system1 423.810.314.311.08.38.6Osteoarthritis5 511.240.148.542.135.235.9
Diseases of the musculoskeletalsystem and connective tissue
1 253.19.113.111.16.2*4.4High blood cholesterol1 924.514.024.415.88.76.6Hypertensive disease2 100.715.325.517.49.87.9Heart disease3 202.823.333.424.718.120.0Diseases of the circulatory system
Long-term conditions'000%%%%%
Total(a)Total(a)ObeseOverweight
Normal
weightUnderweight
SELECTED HEALTH CHARACTERIST ICS3.10
22 A B S • OV E R W E I G H T A N D OB E S I T Y I N A D U L T S • 4 7 1 9 . 0 • 2 0 0 4 – 0 5
C H A P T E R 3 . H E A L T H S T A T U S continued
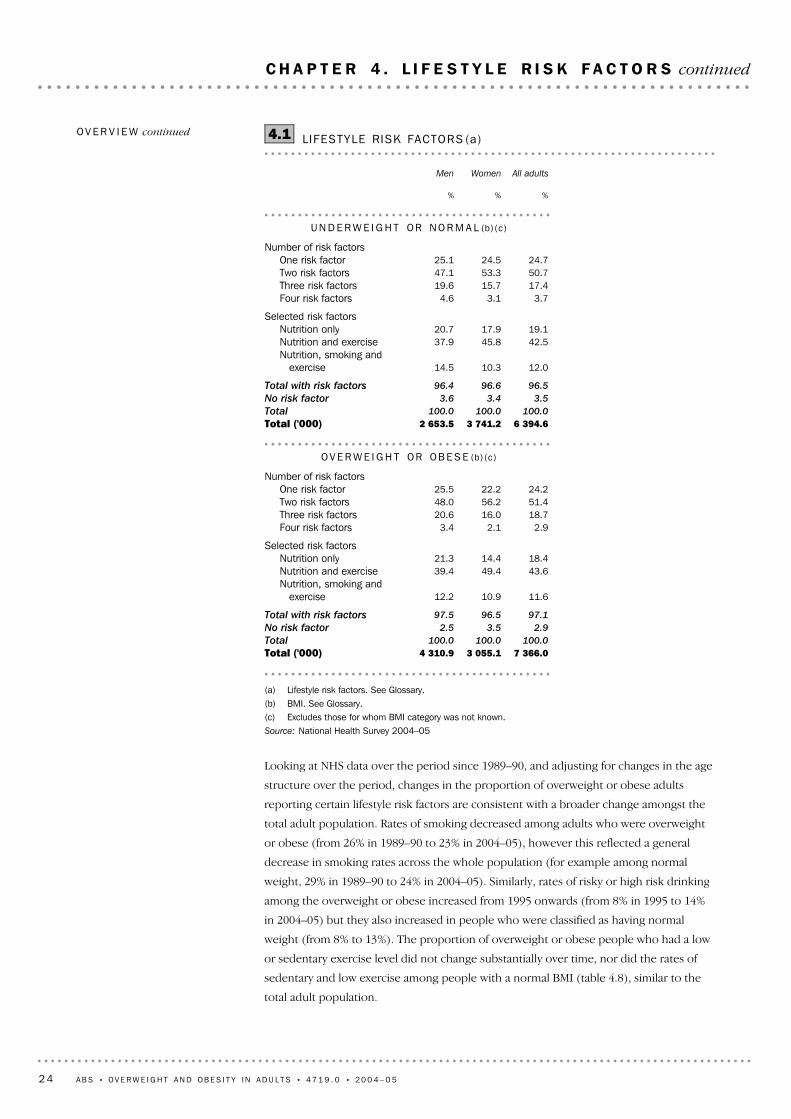
In 2004–05, the pattern of reporting these risk factors was similar among adults classified
as overweight or obese, and those classified as normal weight or underweight. Almost all
adults reported at least one of the four key lifestyle risk factors (97%).
The two most frequently reported lifestyle risk factors among adults were inadequate
fruit or vegetable intake (90%) and sedentary or low level exercise (70%), and the most
common pattern was to report them both, without also reporting smoking or drinking at
risky levels (44%). In comparison to those classified as normal or underweight, adults
who were overweight or obese were slightly more likely to report in this way (43% and
44%).
Among females, there was a difference in responses between those classified as
overweight or obese, and other females. The former group were more likely to report
sedentary or a low level exercise alongside inadequate fruit or vegetable intake (49%
compared to 46%), and less likely to report inadequate fruit or vegetable intake alone
(14% compared to 18%). The other response patterns were similar in both the
overweight or obese, and normal or underweight groups.
Most adults reported both of the two common lifestyle risk factors (sedentary or a low
level exercise and inadequate fruit or vegetable intake), making two lifestyle risk factors
the most common outcome (52%).
OV E R V I E W
Behavioural or lifestyle risk factors increase the risk of ill health, but unlike other factors
such as age, sex, and genetics, lifestyle behaviours can be altered. Regular exercise and
diet are factors in preventing obesity, diabetes and some mental health problems.
Conversely, smoking, excessive alcohol consumption and obesity are major risks for a
range of chronic diseases including mental health problems.
In the NHS, adult respondents are asked to report on lifestyle risk factors such as current
daily smoking, alcohol consumption at a risky to high risk level, insufficient physical
activity (sedentary or exercise at a low level), and inadequate fruit or vegetable intake
(less than 2 serves and 5 serves respectively per day). The consumption of skim or
reduced fat milk was also collected for use as a proxy for fat intake.
It should be noted that these measures are broad concepts based on recall rather than
detailed data collected from observation or diary techniques. There may also be an
awareness on the part of respondents about the social desirability of their responses.
While the personal interview methodology used in the NHS may result in a greater
likelihood of behaviours which are obvious to interviewers being reported, the level of
the activity reported, for example, may be affected by respondent concern about the
acceptability of their responses.
I N T R O D U C T I O N
A B S • OV E R W E I G H T A N D OB E S I T Y I N A D U L T S • 4 7 1 9 . 0 • 2 0 0 4 – 0 5 23
C H A P T E R 4 . L I F E S T Y L E R I S K F A C T O R S
Looking at NHS data over the period since 1989–90, and adjusting for changes in the age
structure over the period, changes in the proportion of overweight or obese adults
reporting certain lifestyle risk factors are consistent with a broader change amongst the
total adult population. Rates of smoking decreased among adults who were overweight
or obese (from 26% in 1989–90 to 23% in 2004–05), however this reflected a general
decrease in smoking rates across the whole population (for example among normal
weight, 29% in 1989–90 to 24% in 2004–05). Similarly, rates of risky or high risk drinking
among the overweight or obese increased from 1995 onwards (from 8% in 1995 to 14%
in 2004–05) but they also increased in people who were classified as having normal
weight (from 8% to 13%). The proportion of overweight or obese people who had a low
or sedentary exercise level did not change substantially over time, nor did the rates of
sedentary and low exercise among people with a normal BMI (table 4.8), similar to the
total adult population.
(a) Lifestyle risk factors. See Glossary.(b) BMI. See Glossary.(c) Excludes those for whom BMI category was not known. Source: National Health Survey 2004–05
7 366.03 055.14 310.9Total ('000)100.0100.0100.0Total
2.93.52.5No risk factor
97.196.597.5Total with risk factors
11.610.912.2Nutrition, smoking and
exercise
43.649.439.4Nutrition and exercise18.414.421.3Nutrition only
Selected risk factors
2.92.13.4Four risk factors18.716.020.6Three risk factors51.456.248.0Two risk factors24.222.225.5One risk factor
Number of risk factors
OV E R W E I G H T OR OB E S E (b)(c)
6 394.63 741.22 653.5Total ('000)100.0100.0100.0Total
3.53.43.6No risk factor
96.596.696.4Total with risk factors
12.010.314.5Nutrition, smoking and
exercise
42.545.837.9Nutrition and exercise19.117.920.7Nutrition only
Selected risk factors
3.73.14.6Four risk factors17.415.719.6Three risk factors50.753.347.1Two risk factors24.724.525.1One risk factor
Number of risk factors
UN D E R W E I G H T OR NO R M A L (b)(c)
%%%
All adultsWomenMen
LIFESTYLE RISK FACTORS (a)4.1OV E R V I E W continued
24 A B S • OV E R W E I G H T A N D OB E S I T Y I N A D U L T S • 4 7 1 9 . 0 • 2 0 0 4 – 0 5
C H A P T E R 4 . L I F E S T Y L E R I S K F A C T O R S continued
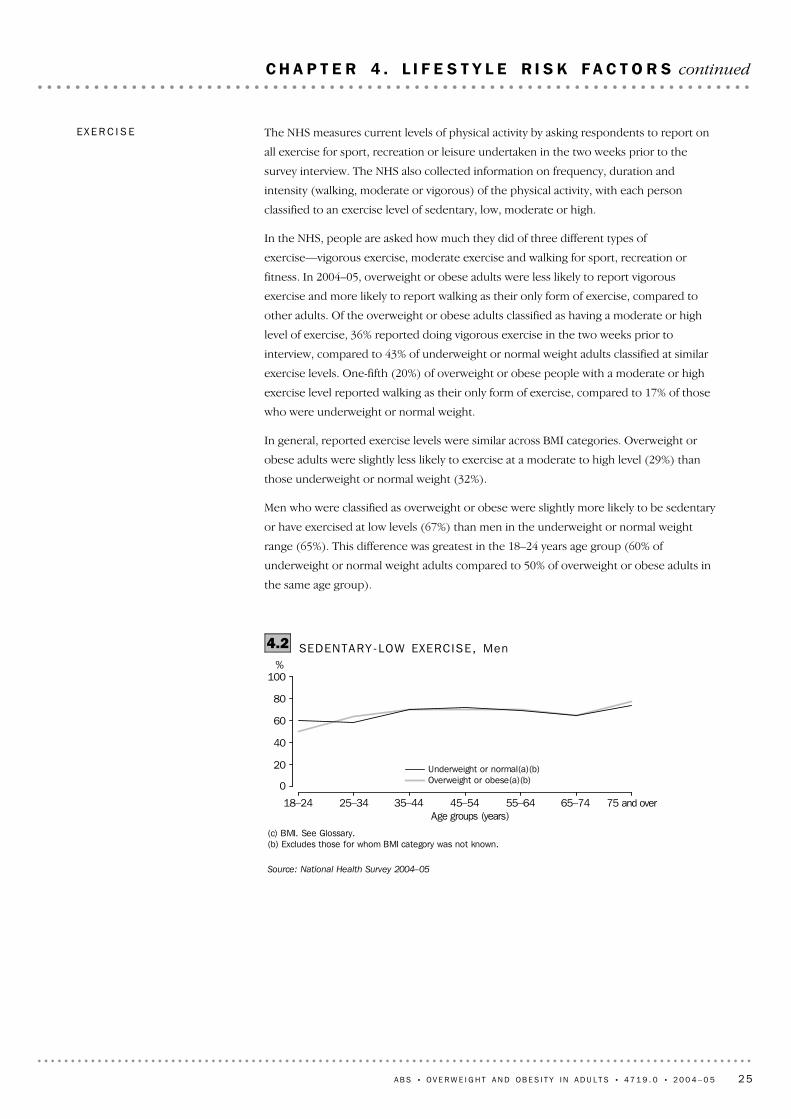
(c) BMI. See Glossary.(b) Excludes those for whom BMI category was not known.
Source: National Health Survey 2004–05
18–24 25–34 35–44 45–54 55–64 65–74 75 and overAge groups (years)
%
0
20
40
60
80
100
Underweight or normal(a)(b)Overweight or obese(a)(b)
SEDENTARY-LOW EXERCISE, Men4.2
The NHS measures current levels of physical activity by asking respondents to report on
all exercise for sport, recreation or leisure undertaken in the two weeks prior to the
survey interview. The NHS also collected information on frequency, duration and
intensity (walking, moderate or vigorous) of the physical activity, with each person
classified to an exercise level of sedentary, low, moderate or high.
In the NHS, people are asked how much they did of three different types of
exercise—vigorous exercise, moderate exercise and walking for sport, recreation or
fitness. In 2004–05, overweight or obese adults were less likely to report vigorous
exercise and more likely to report walking as their only form of exercise, compared to
other adults. Of the overweight or obese adults classified as having a moderate or high
level of exercise, 36% reported doing vigorous exercise in the two weeks prior to
interview, compared to 43% of underweight or normal weight adults classified at similar
exercise levels. One-fifth (20%) of overweight or obese people with a moderate or high
exercise level reported walking as their only form of exercise, compared to 17% of those
who were underweight or normal weight.
In general, reported exercise levels were similar across BMI categories. Overweight or
obese adults were slightly less likely to exercise at a moderate to high level (29%) than
those underweight or normal weight (32%).
Men who were classified as overweight or obese were slightly more likely to be sedentary
or have exercised at low levels (67%) than men in the underweight or normal weight
range (65%). This difference was greatest in the 18–24 years age group (60% of
underweight or normal weight adults compared to 50% of overweight or obese adults in
the same age group).
EX E R C I S E
A B S • OV E R W E I G H T A N D OB E S I T Y I N A D U L T S • 4 7 1 9 . 0 • 2 0 0 4 – 0 5 25
C H A P T E R 4 . L I F E S T Y L E R I S K F A C T O R S continued

Adults' diets should be low in fat, especially saturated fat, because it is more easily
deposited as fat tissue than unsaturated fat (Better Health Channel 2006). Although milk
is a good source of protein and calcium, it does contain saturated fat. Reduced fat or
skim milk provides a healthier alternative, contributing to a healthy diet.
SKIM OR REDUCED FAT
MILK
A majority of adults (90%) did not consume the recommended amount of fruit (2 or
more serves) or vegetables (5 or more serves). This proportion was similar regardless of
body weight (refer to Glossary for recommended intake of fruit or vegetables).
Age is related to fruit or vegetable intake. Older adults are more likely to consume an
adequate amount of fruit or vegetables compared to young adults. Adults aged 55–64
years were the most likely to consume inadequate fruit or vegetables (85%) compared to
95% of the 18–24 years age group.
D I E T A R Y BE H A V I O U R
FRUIT OR VEGETABLES
Of overweight or obese women, 76% were sedentary or exercised at low levels, more
than women who were not overweight (70%). For overweight or obese women, this
lifestyle risk factor was lowest among 18–24 year olds (66%) and increased in the older
age groups. In contrast, for women in the underweight or normal weight range,
sedentary and low exercise levels were lowest among 55–64 year olds (62%), and the
difference between the two groups of women in terms of the proportion with this
lifestyle risk factor was also greatest in this age group (62% compared to 74%).
A perception of being overweight was related to a tendency to exercise less. Of all adults
aged 18 years and over who considered themselves to be overweight, just over
one-quarter (26%) engaged in moderate to high levels of exercise, compared with 33% of
adults who thought they were underweight or acceptable weight. Of adults who were
overweight or obese and considered themselves to be overweight, 26% exercised at
moderate to high levels, compared with 34% of overweight or obese who thought they
were underweight or acceptable weight. This pattern was the same for adults who had an
underweight or normal weight BMI (table 4.8).
(a) BMI. See Glossary.(b) Excludes those for whom BMI category not known.
Source: National Health Survey 2004–05
18–24 25–34 35–44 45–54 55–64 65–74 75 and overAge groups (years)
%
0
20
40
60
80
100
Underweight or normal(a)(b)Overweight or obese(a)(b)
SEDENTARY-LOW EXERCISE, Women4.3EX E R C I S E continued
26 A B S • OV E R W E I G H T A N D OB E S I T Y I N A D U L T S • 4 7 1 9 . 0 • 2 0 0 4 – 0 5
C H A P T E R 4 . L I F E S T Y L E R I S K F A C T O R S continued

Whether people perceived they were overweight was related to whether they reported
usually consuming skim or reduced fat milk. Of all adults who thought they were
overweight, 54% used skim or reduced fat milk, compared to 42% of people who
thought their weight was underweight or acceptable weight. Of all adults who were
classified as overweight or obese and also considered themselves to be overweight, 54%
used skim or reduced fat milk, but this dropped to 45% for those who were overweight
or obese and thought that their weight was underweight or acceptable weight. This
pattern was repeated in both men and women, with the most pronounced difference
among men aged 18 to 24 years. In this age group, skim or reduced fat milk was used by
only 28% of overweight men who believed they were underweight or acceptable weight,
increasing to 47% among those who thought they were overweight.
(a) BMI. See Glossary.(b) Excludes those for whom BMI category not known
Source: National Health Survey 2004–05
18–24 25–34 35–44 45–54 55–64 65–74 75 and overAge groups (years)
%
0
20
40
60
80
Underweight or normal (a)(b)Overweight or obese (a)(b)
SKIM OR REDUCED FAT MILK CONSUMPTION4.4
Approximately 50% of people who were overweight or obese reported consuming skim
or reduced fat milk, compared to 41% of people who were underweight or had normal
weight. Overall, women (52%) were more likely than men (40%) to consume skim or
reduced fat milk, however both males and females were more likely to use skim or
reduced fat if they were overweight or obese. Skim or reduced fat milk was used by 59%
of overweight or obese women (compared to 47% of underweight or normal weight
women) and 44% of overweight or obese men (compared to 33% underweight or
normal weight men).
Consumption of skim or reduced fat milk generally increased with age, however in all
age groups, skim or reduced fat milk use was higher in overweight or obese people. The
greatest difference in the consumption of skim or reduced fat milk between overweight
or obese and underweight or normal weight men and women was in the 55–64 years and
45–54 years age group. Almost two-third (66%) of overweight or obese women aged
45–54 years reported using skim or reduced fat milk, compared to 50% of women in the
same age group who were underweight or had normal weight. Just over half (53%) of
overweight or obese men aged 55–64 years used skim or reduced fat milk, compared to
38% of men in the underweight or normal weight range.
SKIM OR REDUCED FAT
MILK continued
A B S • OV E R W E I G H T A N D OB E S I T Y I N A D U L T S • 4 7 1 9 . 0 • 2 0 0 4 – 0 5 27
C H A P T E R 4 . L I F E S T Y L E R I S K F A C T O R S continued

Overall, people who were overweight or obese were no more likely to be daily smokers
than those who were underweight or normal weight (20% and 22% respectively).
However, younger people who were overweight or obese were more likely to report
daily smoking than their non-overweight counterparts.
Almost one third (30%) of overweight or obese adults aged 18–24 years were daily
smokers, compared to less than one quarter (24%) of underweight or normal weight
18–24 year olds. In the age group 35–44 years proportions of smoking were similar
across BMI categories. However from age 45 onwards the pattern reversed, with
proportion of smoking among overweight or obese adults lower than underweight or
normal weight people. Some 14% of overweight or obese persons aged 45 years and over
were daily smokers, compared to 18% of underweight or normal weight people.
This pattern was apparent in both male and female smokers, however it was most
apparent in men. Of overweight or obese men aged 45 years and over 15% were daily
smokers, lower than the proportion of those who were underweight or normal weight
(22%). The proportion of smokers among overweight or obese women aged 45 years
and over was 12%, similar to those who were underweight or normal weight (15%).
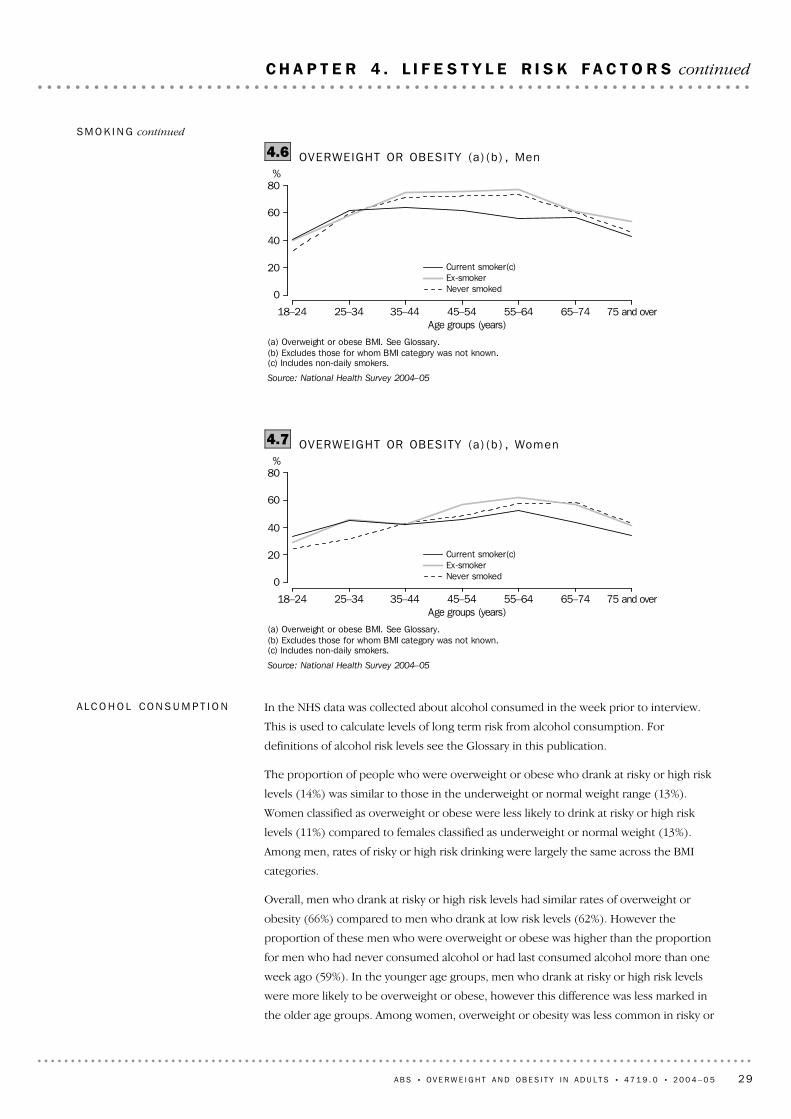
Many studies have reported links between the cessation of smoking and the likelihood of
being overweight (Lahti-Koski et al. 2002). In the 2004–05 NHS, male ex-smokers were
more likely to be overweight or obese (67%) than men who had never smoked (60%) or
who currently smoke (57%). In almost all age groups a high proportion of male
ex-smokers were overweight or obese compared to current smokers and those who had
never smoked. The proportion of male ex-smokers who were overweight or obese was
highest at 55–64 years (77%), while among current smokers the age group with the
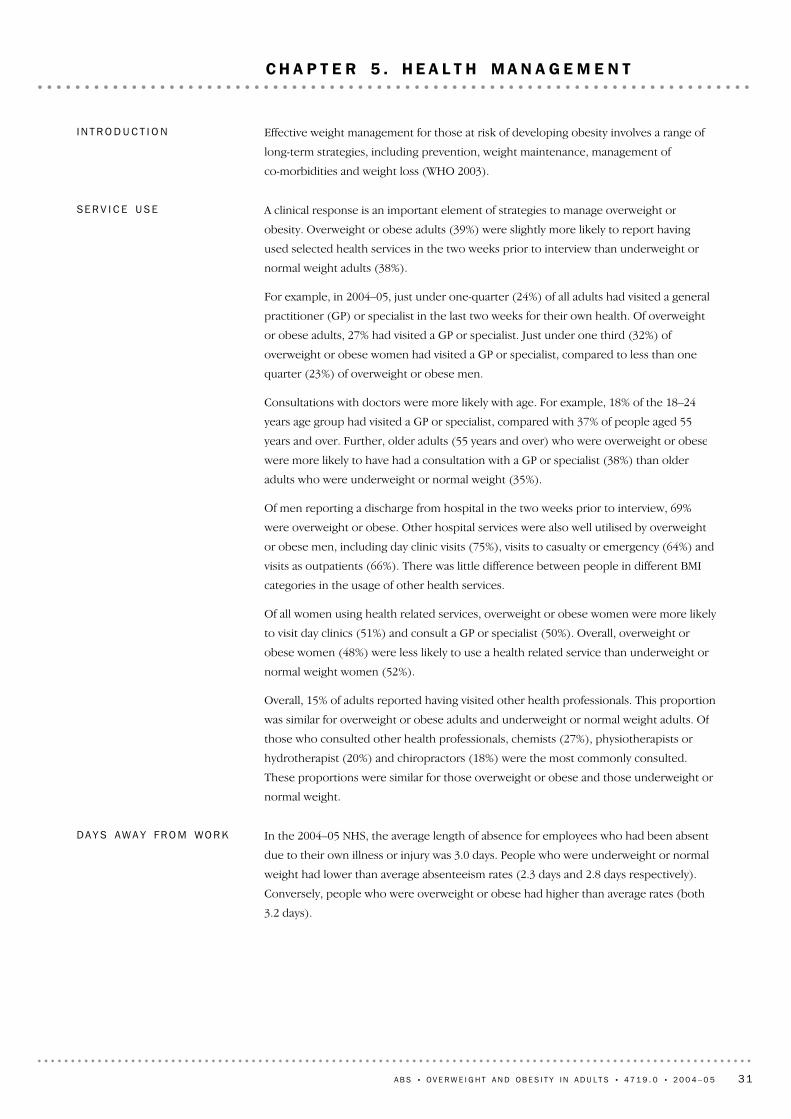
highest proportion was the 35–44 year age group at 64%. Female ex-smokers were also
more likely to be overweight or obese (50%) than current smokers (44%) and women
who had never smoked (43%). However for age groups less than 35–44 years,
proportions of people who were overweight or obese were similar among ex-smokers
and current smokers. The proportion of overweight female ex-smokers was highest in
the age group 55–64 years at 62% (table 4.8).
SM O K I N G
(a) BMI. See Glossary.(b) Excludes those for whom BMI category was not known.
Source: National Health Survey 2004–05
Underweight or normal
Overweight or obese
BMI(a)(b)
0 15 30 45 60%
Acceptable or underweight self-perceptionOverweight self-perception
CONSUMPTION OF SKIM OR REDUCED FAT MILK4.5SKIM OR REDUCED FAT
MILK continued
28 A B S • OV E R W E I G H T A N D OB E S I T Y I N A D U L T S • 4 7 1 9 . 0 • 2 0 0 4 – 0 5
C H A P T E R 4 . L I F E S T Y L E R I S K F A C T O R S continued
In the NHS data was collected about alcohol consumed in the week prior to interview.
This is used to calculate levels of long term risk from alcohol consumption. For
definitions of alcohol risk levels see the Glossary in this publication.
The proportion of people who were overweight or obese who drank at risky or high risk
levels (14%) was similar to those in the underweight or normal weight range (13%).
Women classified as overweight or obese were less likely to drink at risky or high risk
levels (11%) compared to females classified as underweight or normal weight (13%).
Among men, rates of risky or high risk drinking were largely the same across the BMI
categories.
Overall, men who drank at risky or high risk levels had similar rates of overweight or
obesity (66%) compared to men who drank at low risk levels (62%). However the
proportion of these men who were overweight or obese was higher than the proportion
for men who had never consumed alcohol or had last consumed alcohol more than one
week ago (59%). In the younger age groups, men who drank at risky or high risk levels
were more likely to be overweight or obese, however this difference was less marked in
the older age groups. Among women, overweight or obesity was less common in risky or
AL C O H O L CO N S U M P T I O N
(a) Overweight or obese BMI. See Glossary.(b) Excludes those for whom BMI category was not known.(c) Includes non-daily smokers.
Source: National Health Survey 2004–05
18–24 25–34 35–44 45–54 55–64 65–74 75 and overAge groups (years)
%
0
20
40
60
80
Current smoker(c)Ex-smokerNever smoked
OVERWEIGHT OR OBESITY (a) (b ) , Women4.7
(a) Overweight or obese BMI. See Glossary.(b) Excludes those for whom BMI category was not known.(c) Includes non-daily smokers.
Source: National Health Survey 2004–05
18–24 25–34 35–44 45–54 55–64 65–74 75 and overAge groups (years)
%
0
20
40
60
80
Current smoker(c)Ex-smokerNever smoked
OVERWEIGHT OR OBESITY (a) (b ) , Men4.6SM O K I N G continued
A B S • OV E R W E I G H T A N D OB E S I T Y I N A D U L T S • 4 7 1 9 . 0 • 2 0 0 4 – 0 5 29
C H A P T E R 4 . L I F E S T Y L E R I S K F A C T O R S continued

(a) BMI. See Glossary.(b) Excludes those for whom BMI category was not known.(c) Inadequate fruit or vegetable consumption. See Glossary.Source: National Health Survey 2004–05
* estimate has a relative standard error of 25% to 50% and should beused with caution
** estimate has a relative standard error greater than 50% and isconsidered too unreliable for general use
89.586.691.687.186.085.488.091.493.595.1Overweight or obese89.885.993.188.785.685.488.791.693.597.9Obese89.787.091.086.586.285.487.591.393.694.2Overweight89.488.891.289.082.884.287.391.492.793.8Underweight or normal89.788.691.188.982.984.387.091.392.493.9Normal92.491.994.589.9*79.4*81.895.393.597.792.7Underweight
Inadequate fruit or vegetableconsumption(c)
70.775.967.081.469.771.673.372.168.056.9Overweight or obese77.480.874.381.177.075.878.578.576.673.5Obese67.372.963.881.566.069.270.268.863.951.7Overweight68.270.365.281.766.764.570.070.763.566.2Underweight or normal67.569.464.980.666.664.369.870.362.864.7Normal79.780.476.790.9*69.2*73.977.578.475.981.1Underweight
Sedentary/low exercise level
14.010.716.45.89.314.616.014.214.518.4Overweight or obese12.18.815.13.89.113.613.213.010.616.1Obese15.011.916.96.59.515.217.614.816.319.1Overweight13.413.213.65.112.018.415.414.812.612.4Underweight or normal13.613.613.85.411.918.815.015.113.012.8Normal
9.09.18.8**1.9**15.3**3.5*27.9*10.3**5.7*8.6UnderweightRisky/high risk alcohol consumption
20.217.821.93.88.213.619.724.929.830.3Overweight or obese20.117.222.64.24.212.419.626.331.928.9Obese20.318.121.63.610.114.319.724.128.830.7Overweight21.718.326.55.010.621.725.827.222.923.8Underweight or normal21.718.026.75.210.621.525.127.122.824.1Normal22.222.620.2**3.010.326.945.930.224.420.5Underweight
Current daily smoker%%%%%%%%%%
All
adultsWomenMen
75 and
over65–7455–6445–5435–4425–3418–24
BODY MASS INDEX (a) (b ) , Li fes ty le r isk fac to rs4.8
high risk drinkers (40%) and low risk drinkers (43%) than among women who had never
consumed alcohol or last consumed alcohol more than one week ago (48%). This
pattern was strongest in the older age groups (table 4.8).
AL C O H O L CO N S U M P T I O N
continued
30 A B S • OV E R W E I G H T A N D OB E S I T Y I N A D U L T S • 4 7 1 9 . 0 • 2 0 0 4 – 0 5
C H A P T E R 4 . L I F E S T Y L E R I S K F A C T O R S continued
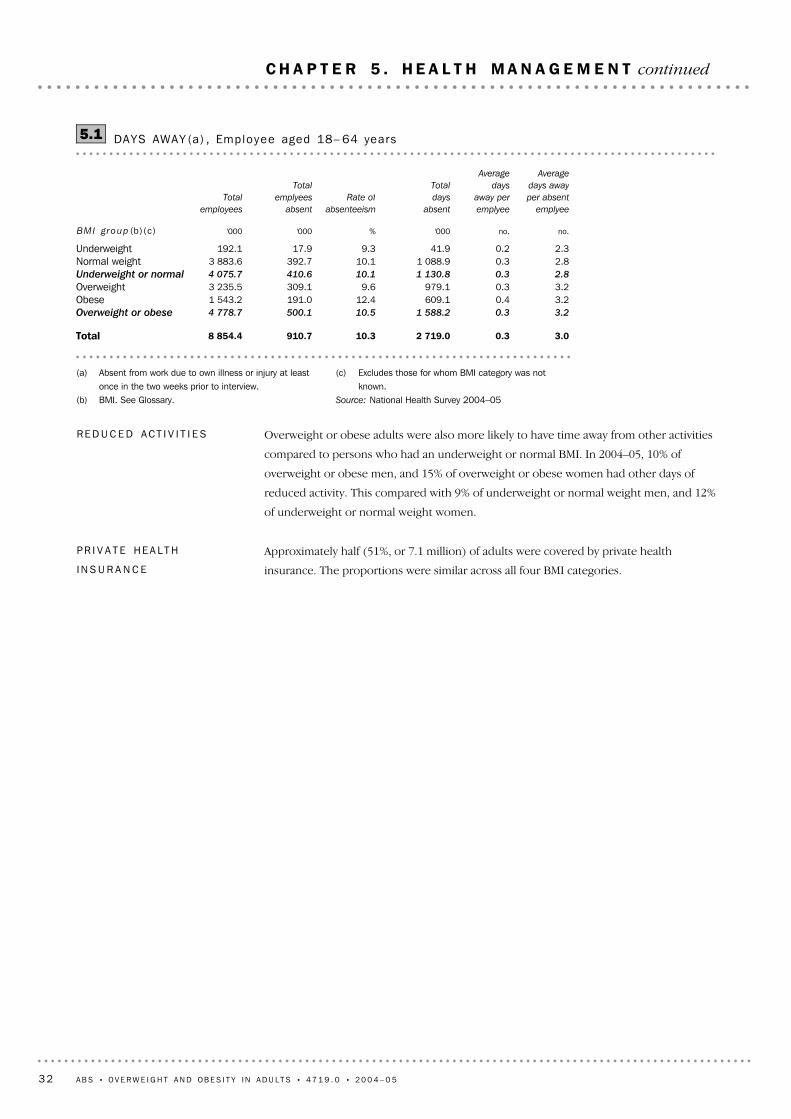
In the 2004–05 NHS, the average length of absence for employees who had been absent
due to their own illness or injury was 3.0 days. People who were underweight or normal
weight had lower than average absenteeism rates (2.3 days and 2.8 days respectively).
Conversely, people who were overweight or obese had higher than average rates (both
3.2 days).
DA Y S AW A Y FR O M WO R K
A clinical response is an important element of strategies to manage overweight or
obesity. Overweight or obese adults (39%) were slightly more likely to report having
used selected health services in the two weeks prior to interview than underweight or
normal weight adults (38%).
For example, in 2004–05, just under one-quarter (24%) of all adults had visited a general
practitioner (GP) or specialist in the last two weeks for their own health. Of overweight
or obese adults, 27% had visited a GP or specialist. Just under one third (32%) of
overweight or obese women had visited a GP or specialist, compared to less than one
quarter (23%) of overweight or obese men.
Consultations with doctors were more likely with age. For example, 18% of the 18–24
years age group had visited a GP or specialist, compared with 37% of people aged 55
years and over. Further, older adults (55 years and over) who were overweight or obese
were more likely to have had a consultation with a GP or specialist (38%) than older
adults who were underweight or normal weight (35%).
Of men reporting a discharge from hospital in the two weeks prior to interview, 69%
were overweight or obese. Other hospital services were also well utilised by overweight
or obese men, including day clinic visits (75%), visits to casualty or emergency (64%) and
visits as outpatients (66%). There was little difference between people in different BMI
categories in the usage of other health services.
Of all women using health related services, overweight or obese women were more likely
to visit day clinics (51%) and consult a GP or specialist (50%). Overall, overweight or
obese women (48%) were less likely to use a health related service than underweight or
normal weight women (52%).
Overall, 15% of adults reported having visited other health professionals. This proportion
was similar for overweight or obese adults and underweight or normal weight adults. Of
those who consulted other health professionals, chemists (27%), physiotherapists or
hydrotherapist (20%) and chiropractors (18%) were the most commonly consulted.
These proportions were similar for those overweight or obese and those underweight or
normal weight.
SE R V I C E US E
Effective weight management for those at risk of developing obesity involves a range of
long-term strategies, including prevention, weight maintenance, management of
co-morbidities and weight loss (WHO 2003).
I N T R O D U C T I O N
A B S • OV E R W E I G H T A N D OB E S I T Y I N A D U L T S • 4 7 1 9 . 0 • 2 0 0 4 – 0 5 31
C H A P T E R 5 . H E A L T H M A N A G E M E N T
Approximately half (51%, or 7.1 million) of adults were covered by private health
insurance. The proportions were similar across all four BMI categories.
PR I V A T E HE A L T H
IN S U R A N C E
Overweight or obese adults were also more likely to have time away from other activities
compared to persons who had an underweight or normal BMI. In 2004–05, 10% of
overweight or obese men, and 15% of overweight or obese women had other days of
reduced activity. This compared with 9% of underweight or normal weight men, and 12%
of underweight or normal weight women.
RE D U C E D AC T I V I T I E S
(c) Excludes those for whom BMI category was notknown.
Source: National Health Survey 2004–05
(a) Absent from work due to own illness or injury at leastonce in the two weeks prior to interview.
(b) BMI. See Glossary.
3.00.32 719.010.3910.78 854.4Total
3.20.31 588.210.5500.14 778.7Overweight or obese
3.20.4609.112.4191.01 543.2Obese3.20.3979.19.6309.13 235.5Overweight2.80.31 130.810.1410.64 075.7Underweight or normal
2.80.31 088.910.1392.73 883.6Normal weight2.30.241.99.317.9192.1Underweight
no.no. '000% '000 '000
Average
days away
per absent
emplyee
Average
days
away per
emplyee
Total
days
absent
Rate of
absenteeism
Total
emplyees
absent
Total
employees
BMI group (b)(c)
DAYS AWAY (a) , Employee aged 18– 64 years5.1
32 A B S • OV E R W E I G H T A N D OB E S I T Y I N A D U L T S • 4 7 1 9 . 0 • 2 0 0 4 – 0 5
C H A P T E R 5 . H E A L T H M A N A G E M E N T continued

The 2004 NSW Schools Physical Activity and Nutrition Survey (SPANS) provided an
insight into overweight or obesity in children aged 5–16 years in NSW. SPANS measured
the height, weight and waist of all participating students. It was conducted by the NSW
Department of Health.
Overall, 25% of boys and 23% of girls were classified as overweight or obese. For boys,
the rate of overweight or obesity was related to age, reaching a peak in 11–12 year olds
before declining again. For girls, the highest rate of overweight or obesity was in 9–10
year olds.
Measured height and weight were last collected nationally for all people aged 25 years or
more in the Australian Diabetes, Obesity and Lifestyle Study (AusDiab) in 1999–2000.
AusDiab was the first national Australian longitudinal population based study, spanning
five years. Respondents underwent a detailed physical examination by health
professionals, which included measuring height, weight and blood pressure.
(a) BMI. See Glossary.(b) Reported CATI survey results for Victoria and reported NHS results have been adjusted for
missing values.(c) Data collected through the 2004 Filling the Gaps Survey by DoHA, to provide national coverage
of health data.Source: National Health Survey 2004–05 and Australia's health, AIHW 2006
41.538.445.242.545.142.842.543.1Median age
(years)
52.8na55.752.855.452.953.353.8NHS48.251.550.651.855.351.849.449.5CATI
%%%%%%%%
ACT(c)NT(c)Tas.(c)WASAQld(c)Vic.(b)NSW
Sur ve y s
OVERWEIGHT AND OBESE (a) , Adu l t s —20046.1
Self reported information relating to the body mass of adults is also collected in state
health surveillance programs which are undertaken in several jurisdictions. The surveys
are conducted using Computer Assisted Telephone Interviewing (CATI) methodology,
whereas the NHS uses personal interviews to collect information.
The table below shows data for 2004, when BMI data were collected in all jurisdictions.
Note that responses may be influenced by the differing age profiles of the states and
territories. For example, South Australia and Tasmania have slightly older populations.
OT H E R DA T A SO U R C E S
The NHS is currently one of the key sources of national information on body mass in
Australia. The most recent national data based on self reported height and weight come
from the 2004–05 NHS. However, there are other collections which collect direct
measures of height and weight and from different populations such as children. The
2007 NHS will present data based on both self report and direct measures.
I N T R O D U C T I O N
A B S • OV E R W E I G H T A N D OB E S I T Y I N A D U L T S • 4 7 1 9 . 0 • 2 0 0 4 – 0 5 33
C H A P T E R 6 . O T H E R D A T A S O U R C E S

Around 55% of people who completed the survey questionnaire also provided physical
measurements, but this figure does not include people who refused to participate in the
study, suggesting that the true response rate is much lower. Adjustments to the sample
were made in the weighting process to account for the fact that young males were
under-represented in the physical examination (IDI, 2001).
In the AusDiab survey, almost 60% of Australians aged 25 years and over were classified
as either overweight or obese, 2.5 times more than in 1980, according to the Risk Factor
Prevalence Study run by the National Heart Foundation (Cameron et al. 2003).
OT H E R DA T A SO U R C E S
continued
34 A B S • OV E R W E I G H T A N D OB E S I T Y I N A D U L T S • 4 7 1 9 . 0 • 2 0 0 4 – 0 5
C H A P T E R 6 . O T H E R D A T A S O U R C E S continued

! ABS Australian Bureau of Statistics
! AIHA Australian Institute of Health and Welfare
! BMI Body Mass Index
! BHC Better Health Channel
! cm Centimetre
! DoHA Department of Health and Ageing
! kg Kilogram
! K10 Kessler Psychological Distress Scale
! na not available
! NHMRC National Health and Medical Research Council
! NHS National Health Survey
! no. Number
! OHP Other health professional
! SEIFA Socio-Economic Indexes for Areas
! WHO World Health Organization
! % Per cent
! '000 Thousands
ABBREVIATIONS AND
SYMBOLS
3 Although height and weight was collected of all persons aged 15 years and over in
the NHS, this publication represents the adult population only (aged 18 years and over).
NHS respondents in the age group 15–17 years could, with the approval of a parent or
guardian, answer survey questions themselves or have questions answered by proxy,
usually by a parent or guardian.
4 In 65% of cases information about height, weight and reported body mass for
persons aged 15–17 years was usually reported by proxy and the child may or may not
have been consulted. Greater variance of BMI was realised when height and weight was
reported by a proxy (ABS 1995). As a result, data for this age group should be interpreted
with care and is not used in this publication.
5 For a variety of reasons, approximately 8% of respondents aged 18 years and over did
not provide their weight or height information. As a result, they were excluded from data
presented in this publication as their BMI scores were not able to be calculated.
DA T A IN TH I S PU B L I C A T I O N
2 This publication also contains Indigenous information obtained from the National
Aboriginal and Torres Strait Islander Health Survey (NATSIHS) which was conducted at
the same time as the 2004–05 NHS. Information about that survey, and summary results
are available in the National Aboriginal and Torres Strait Islander Health Survey 2004–05:
Summary of Results, Australia (cat. no. 4715.0) (ABS Web site <www.abs.gov.au>).
NA T I O N A L AB O R I G I N A L AN D
TO R R E S S T R A I T I S L A N D E R
HE A L T H SU R V E Y
1 Information about the survey design and methodology, the quality and interpretation
of results, and information about the range of publications and other available data
services is in the Explanatory Notes of the National Health Survey 2004–05: Summary of
Results, Australia (cat. no. 4364.0). Detailed information about the survey is also available
in the National Health Survey 2004–05 : Users' Guide (cat. no. 4363.0.55.001)
(ABS Website <www.abs.gov.au>).
NA T I O N A L HE A L T H SU R V E Y
A B S • OV E R W E I G H T A N D OB E S I T Y I N A D U L T S • 4 7 1 9 . 0 • 2 0 0 4 – 0 5 35
E X P L A N A T O R Y N O T E S

(a) See BMI in Glossary.(b) Excludes those for whom BMI category was not known.Source: National Health Survey 2004–05
13 760.6951.31 243.81 968.52 506.72 719.72 643.2Total7 366.0440.3727.11 280.61 522.11 535.51 308.5Overweight or obese
2 478.0112.5242.1469.3564.6533.1423.9Obese4 888.0327.8485.0811.3957.51 002.4884.6Overweight6 394.6511.0516.7687.9984.61 184.21 334.7Underweight or normal
6 037.0459.4497.2669.9955.41 127.61 262.8Normal357.751.619.518.029.256.671.9Underweight
AL L AD U L T S ( ' 0 0 0 )
6 796.3524.3611.9949.41 233.71 344.11 295.6Total3 055.1222.7345.4551.7624.9576.4502.2Overweight or obese
1 154.466.0131.8229.3250.8222.2186.2Obese1 900.7156.7213.6322.5374.1354.2316.0Overweight3 741.2301.6266.5397.7608.8767.7793.4Underweight or normal
3 453.2265.9249.9382.6584.0720.2729.1Normal288.035.716.615.124.847.564.3Underweight
WO M E N ( ' 0 0 0 )
6 964.4427.0631.91 019.11 273.01 375.51 347.6Total4 310.9217.6381.6728.9897.2959.1806.3Overweight or obese
1 323.546.5110.3240.1313.8310.9237.7Obese2 987.3171.1271.4488.9583.4648.2568.5Overweight2 653.5209.4250.2290.2375.8416.5541.4Underweight or normal
2 583.7193.5247.3287.3371.4407.4533.7Normal69.715.83.02.94.49.07.6Underweight
ME N ( ' 0 0 0 )
Total
75 and
over65–7455–6445–5435–4425–34
AGE GROUP (YEARS)
Group
BODY MASS INDEX (a) (b) , Est imatesA1.1
36 A B S • OV E R W E I G H T A N D OB E S I T Y I N A D U L T S • 4 7 1 9 . 0 • 2 0 0 4 – 0 5
A P P E N D I X 1
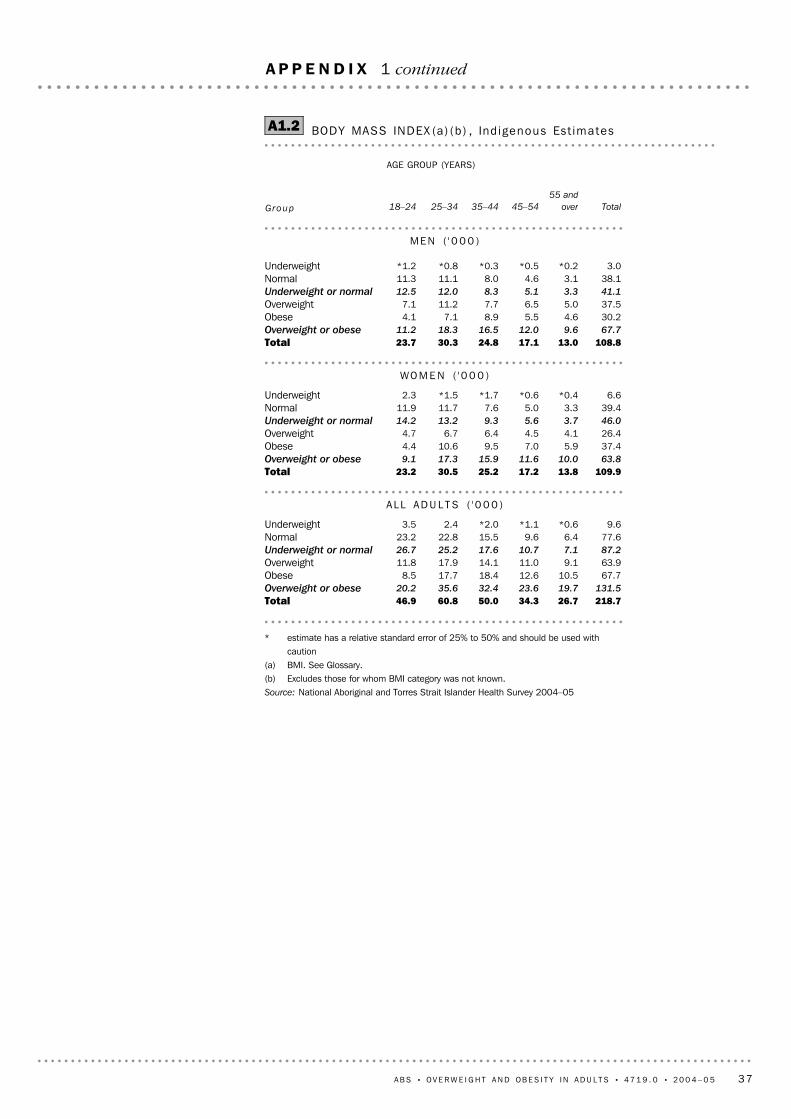
* estimate has a relative standard error of 25% to 50% and should be used withcaution
(a) BMI. See Glossary.(b) Excludes those for whom BMI category was not known.Source: National Aboriginal and Torres Strait Islander Health Survey 2004–05
218.726.734.350.060.846.9Total131.519.723.632.435.620.2Overweight or obese
67.710.512.618.417.78.5Obese63.99.111.014.117.911.8Overweight87.27.110.717.625.226.7Underweight or normal
77.66.49.615.522.823.2Normal9.6*0.6*1.1*2.02.43.5Underweight
AL L AD U L T S ( ' 0 0 0 )
109.913.817.225.230.523.2Total63.810.011.615.917.39.1Overweight or obese
37.45.97.09.510.64.4Obese26.44.14.56.46.74.7Overweight46.03.75.69.313.214.2Underweight or normal
39.43.35.07.611.711.9Normal6.6*0.4*0.6*1.7*1.52.3Underweight
WO M E N ( ' 0 0 0 )
108.813.017.124.830.323.7Total67.79.612.016.518.311.2Overweight or obese
30.24.65.58.97.14.1Obese37.55.06.57.711.27.1Overweight41.13.35.18.312.012.5Underweight or normal
38.13.14.68.011.111.3Normal3.0*0.2*0.5*0.3*0.8*1.2Underweight
ME N ( ' 0 0 0 )
Total
55 and
over45–5435–4425–3418–24
AGE GROUP (YEARS)
Group
BODY MASS INDEX (a) (b) , Ind igenous Est imatesA1.2
A B S • OV E R W E I G H T A N D OB E S I T Y I N A D U L T S • 4 7 1 9 . 0 • 2 0 0 4 – 0 5 37
A P P E N D I X 1 continued
This topic refers primarily to those persons ever told by a doctor or nurse that they haveone or more heart or circulatory conditions, and who consider they currently have oneor more such conditions.
The following predefined condition categories were included on the questionnaire, withprovision for interviewers to record three additional write-in conditions if required:! Rheumatic heart disease;! Heart attack;! Stroke (including after effects);
Circulatory conditions
30.0 and greaterObese
25.0 to less than 30.0Overweight
18.5 to less than 25.0Normal range
Less than 18.5Underweight
2004–05
BODY MASS INDEX
Calculated from reported height and weight information, using the formula weight (kg)divided by the square of height (m). To produce a measure of the prevalence ofoverweight or obesity in adults, BMI values are grouped according to the table belowwhich allows categories to be reported against both the World Health Organisation(WHO) and NHMRC guidelines. Not stated categories in height and weight are excludedfrom estimates in this publication.
Body Mass Index (BMI)
It should be noted that risk levels as defined by the NHMRC are based on regularconsumption levels of alcohol, whereas indicators derived in the National Aboriginal andTorres Strait Islander Health Survey (NATSIHS) do not take into account whetherconsumption in the reference week was more, less or the same as usual.
Drinking status information was also collected for those who did not consume anyalcohol in the 7 days prior to interview. Categorised as:! Last consumed more than one week to less than 12 months ago;! Last consumed 12 months or more ago; and! Never consumed.
(a) One standard drink contains 12.5 ml of alcohol.
More than 50 mlsMore than 75 mlsHigh risk
More than 25 mls, up to 50 mls More than 50 mls, up to 75 mlsRisky
25 mls or less50 mls or lessLow risk
WomenMen
CONSUMPTION PER DAY
Ri sk
le ve l
ALCOHOL RISK LEVEL (a)
Alcohol risk levels were derived from the average daily consumption of alcohol in theseven days prior to interview and were grouped into relative risk levels as defined by theNational Health and Medical Research Council (NHMRC) as follows:
Alcohol consumption risk level
A method of removing the influence of age when comparing populations with differentage structures. Where appropriate, estimates in this publication are age standardised tothe age composition of the total estimated resident population (ERP) of Australia as at 30June 2001. The age standardised rate is that which would have prevailed if the studiedpopulation had the same age composition as the standard population. See Chapter 7,page 157 of the 2004–05 National Health Survey: Users' Guide (cat. no. 4363.0.55.001).
Age standardisation
38 A B S • OV E R W E I G H T A N D OB E S I T Y I N A D U L T S • 4 7 1 9 . 0 • 2 0 0 4 – 0 5
G L O S S A R Y

Based on frequency, intensity (i.e. walking, moderate exercise and vigorous exercise)and duration of exercise (for recreation, sport or fitness) in the two weeks prior to theinterview. From these components, an exercise score was derived using factors torepresent the intensity of the exercise. Scores were grouped into the following fourcategories:
Exercise level
A chronic condition in which blood glucose levels become too high due to the bodyproducing little or no insulin, or not using insulin properly.
There are three main types of diabetes mellitus:! Type 1: is characterised by little or no insulin production and is likely to develop
before 18 years of age. Treatment generally involves insulin injections and carefuldietary control. It is also known as insulin-dependent diabetes.
! Type 2: is characterised by resistance in the body's ability to use insulin and is likely todevelop after 40 years of age. Lifestyle factors such as diet, obesity and exercise arestrongly associated with Type 2 diabetes. It is also known as non-insulin dependentdiabetes mellitus.
! Gestational diabetes mellitus: occurs during pregnancy in about 3–8% of females notpreviously diagnosed with diabetes. This form of diabetes usually resolves afterpregnancy. Unlike Type 1 and Type 2 diabetes, gestational diabetes is not defined as along-term condition in the NHS and is excluded from the analysis of diabetes in thispublication.
Diabetes mellitus
Refers to days the respondent was away from work for at least half the day, due to illnessor injury in the two weeks prior to the interview. For further information on days awaysee Chapter 5, page 115 and 116 of the 2004–05 National Health Survey: Users' Guide(cat. no. 4363.0.55.001).
Days away from work
A current daily smoker is an adult who reported that they regularly smoked one or morecigarettes, cigars or pipes per day at the time of the survey.
The extent to which an adult was smoking at the time of interview, and refers to regularsmoking of tobacco, including manufactured (packet) cigarettes, roll-your-owncigarettes, cigars and pipes, but excludes chewing tobacco and smoking of non-tobaccoproducts.
Current daily smoker
See Long-term medical condition.Conditions
! Angina;! High blood pressure/hypertension;! Hardening of the arteries/atherosclerosis/arteriosclerosis;! Fluid problems/fluid retention/oedema;! High cholesterol;! Rapid or irregular heartbeat/tachycardia/palpitations;! Heart murmur/heart valve disorder;! Haemorrhoids; and! Varicose veins.
Further information can be found in the 2004–05 National Health Survey: Users' Guide(cat. no. 4363.0.55.001).
Circulatory conditionscontinued
A B S • OV E R W E I G H T A N D OB E S I T Y I N A D U L T S • 4 7 1 9 . 0 • 2 0 0 4 – 0 5 39
G L O S S A R Y continued

An accident, harmful incident, exposure to harmful factors or other incident whichresulted in an injury. The injury must have occurred in the four weeks prior to the surveyand have resulted in one or more of the following actions being taken:! consultation with a health professional;! sought medical advice;! received medical treatment;
Injury event
This is one of four Socio Economic Indexes for Areas (SEIFAs) compiled by ABSfollowing each Census of Population and Housing. The indexes are compiled fromvarious characteristics of persons resident in particular areas; the index of disadvantagesummarises attributes such as low income, low educational attainment, highunemployment and jobs in relatively unskilled occupations. As shown in this publicationQuintile 1 refers to the most disadvantaged group, while Quintile 5 refers to the mostadvantaged group. For further information on SEIFA 2001 see Chapter 6 of the 2004–05National Health Survey: Users' Guide (cat. no. 4363.0.55.001).
Index of disadvantage
Refers to the intake of less than two serves of fruit or less than five serves of vegetablesper day for adults. See 'fruit (usual daily serves)' and 'vegetables (usual daily serves)' inthe Glossary.
Inadequate fruit or vegetables
Derived as the sum of the reported personal cash incomes of all household membersaged 15 years and over. Household incomes were then divided into quintiles; 1st quintilelowest income, 5th quintile highest income. Cases where household income could notbe derived are excluded before quintiles are created.
Household income
A household is defined as one or more persons, at least one of whom is at least 15 yearsof age, usually resident in the same private dwelling. This publication reportsproportions for persons aged 18 years and older.
Household
Refers to the following health-related services respondents reported they had used in thetwo weeks prior to interview:! Discharged from a stay in hospital (as an admitted patient);! Visit to casualty/emergency units at hospitals;! Visit to outpatients department at hospital;! Visit to day clinics;! Consultation with general practitioner (GP) and/or specialist;! Dental consultation; and! Consultation with other health professionals (OHP): see separate entry in this
Glossary.
Health services
Employed persons who usually worked 35 hours or more a week (in all jobs) and thosewho, although usually working less than 35 hours a week, worked 35 hours or moreduring the reference week.
Full-time workers
Refers to the number of serves of fruit (excluding drinks and beverages) usuallyconsumed each day, as reported by the respondent. A serve is approximately 150 gramsof fresh fruit or 50 grams of dried fruit. The National Health and Medical ResearchCouncil (NHMRC) has recommended a minimum of two serves of fruit per day.
Fruit (usual daily serves)
(a) See Chapter 4 of the 2004–05 National Health Survey: Users' Guide (cat. no.4363.0.55.001) for more information.
(b) Sedentary refers to sitting in one place for extended periods of time.
More than 3200 and 2 hours or more of vigorous exerciseHigh
1600–3200, or more than 3200 but less than 2 hours of moderate exerciseModerate
100 to less than 1600Low
Less than 100 (includes no exercise)Sedentary(b)
SCORES
EXERCISE LEVEL (a)Exercise level continued
40 A B S • OV E R W E I G H T A N D OB E S I T Y I N A D U L T S • 4 7 1 9 . 0 • 2 0 0 4 – 0 5
G L O S S A R Y continued

Includes consultation, for own health reasons, in the two weeks prior to interview withone or more of the following:! Aboriginal health worker;! Accredited counsellor;! Acupuncturist;! Alcohol and drug worker;! Audiologist/audiometrist;! Chemist;! Chiropodist/podiatrist;! Chiropractor;! Dietitian/nutritionist;
Other health professionals
Persons aged 18–64 years who are not employed or unemployed as defined, includingpersons who:! are retired;! no longer work;! do not intend to work in the future;! are permanently unable to work; and! have never worked and never intend to work.
Not in the labour force
Diseases of the musculoskeletal system and connective tissue manifest in many forms ofjoint problems and disorders of the bones and muscles and their attachments, includingarthritis, osteoporosis, rheumatism, back pain and disc disorders. Persons reportingarthritis and osteoporosis were asked if they were told by a doctor or nurse, all otherconditions were not. Conditions included in Musculoskeletal system and connectivetissue were:! Arthritis;! Gout;! other arthropathies;! Rheumatism;! Other soft tissue disorders;! Sciatica;! Back disorders;! Back pain;! Curvature of the spine;! Osteoporosis;! Other diseases of the musculoskeletal system and connective tissue; and! Symptoms of the musculoskeletal system and connective tissue.
Further information can be found in the 2004–5 National Health Survey: Users' Guide(cat. no. 4363.0.55.001).
Musculoskeletal system andconnective tissue
A medical condition (illness, injury or disability) which has lasted at least six months, orwhich the respondent expects to last for six months or more. Some reported conditionswere assumed to be long-term, including asthma, arthritis, cancer, osteoporosis,diabetes, rheumatic heart disease, heart attack and stroke.
Long-term medical condition
Refers to the composition of the household to which the respondent belonged.Households are categorised as single person, couple only, one adult and child(ren),couple and child(ren), other households.
Living arrangements
Persons aged 15–64 years who were actively employed in the four weeks prior to thesurvey. Proportions in this publication represent persons aged 18–64 years who areemployed full-time, employed part-time, unemployed (see also Unemployed) and not inthe labour force (see also Not in the labour force).
Labour force status
! reduced usual activities; and! other treatment of injury (i.e. took medications, used a bandage/band aid, or heat or
ice pack).
Injury event continued
A B S • OV E R W E I G H T A N D OB E S I T Y I N A D U L T S • 4 7 1 9 . 0 • 2 0 0 4 – 0 5 41
G L O S S A R Y continued
The year in which a person, reporting a country of birth other than Australia, first arrivedin Australia to live for a period of one year or more.
Year of arrival
Refers to the number of serves of vegetables (excluding drinks and beverages) usuallyconsumed each day, as reported by the respondent. A serve is approximately half a cupof cooked vegetables or one cup of salad vegetables — equivalent to approximately 75grams. The National Health and Medical Research Council (NHMRC) has recommendeda minimum of five serves of vegetables per day.
Vegetables (usual daily serves)
Persons aged 15–64 years who were not employed and actively looking for work in thefour weeks prior to the survey, and were available to start work in the week prior to thesurvey. See also Labour force status.
Unemployed
All reported long-term medical conditions were coded to a classification developed bythe ABS for use in the National Health Survey, which is based on the tenth revision of theInternational Classification of Diseases and Health Related Problems (ICD-10). Furtherinformation can be found in the 2004–05 National Health Survey: Users' Guide (cat. no. 4363.0.55.001).
Type of conditions
Levels of fat in milk products are as follows:! whole milk 8 g of fat;! 1% reduced milk: 4.5 g of fat;! 2% reduced milk: 2.5 g of fat; and! skim milk: 0.9 g of fat.
Skim or reduced fat milk
A person's general assessment of their own health against a five status point scale fromexcellent through to poor.
Self–assessed health status
Derived from the Kessler Psychological Distress Scale - 10 items (K10). This is a scale ofnon-specific psychological distress based on 10 questions about negative emotionalstates in the 4 weeks prior to interview. The K10 is scored from 10 to 50, with higherscores indicating a higher level of distress; low scores indicate a low level of distress. Inthis publication, scores are grouped as follows:! Low 10–15;! Moderate 16–21;! High 22–29; and! Very high 30–50.
Psychological distress
Refers to the private health insurance status at the time of the survey. The category 'Withcover' includes those with hospital and/or ancillary cover, and those with cover but thetype of cover was unknown.
Private health insurance
Employed persons who usually worked less than 35 hours a week (in all jobs) and eitherdid so during the reference week, or were not at work in the reference week
Part-time workers
! Herbalist;! Hypnotherapist;! Naturopath;! Nurse;! Occupational therapist;! Optician/optometrist;! Osteopath;! Physiotherapist/hydrotherapist;! Psychologist;! Social worker/welfare officer;! Speech therapist/pathologist; and! Traditional healer.
Other health professionalscontinued
42 A B S • OV E R W E I G H T A N D OB E S I T Y I N A D U L T S • 4 7 1 9 . 0 • 2 0 0 4 – 0 5
G L O S S A R Y continued

Access Economics 2006, The Economic Costs of Obesity, Access Economics, Canberra.
Australian Bureau of Statistics 1995, How Australians Measure Up, cat. no. 4359.0, ABS,
Canberra.
Australian Bureau of Statistics 2004–05, National Aboriginal and Torres Strait Islander
Health Survey, ABS, Canberra.
Australian Bureau of Statistics 2004–05, National Health Survey: Summary of Results,
cat. no. 4364.0, ABS, Canberra.
Australian Bureau of Statistics 2007, Overweight and obesity, in Australian Social Trends
2007, cat. no. 4102.0, pp 71–75, ABS, Canberra.
Australian Institute of Health and Welfare 2007, Young Australians: their health and
wellbeing, <http://www.aihw.gov.au/publications/aus/yathaw07/yathaw07.pdf>,
accessed 22 November 2007.
Australian Institute of Health and Welfare 2006, Australia's health,<http://www.aihw.gov.au/publications/aus/ah06/ah06.pdf>, accessed 18
November 2007
Australian Institute of Health and Welfare 2004, Australia's health,
<http://www.aihw.gov.au/publications/aus/ah04/ah04-050222.pdf>, accessed 22
November 2007
Australian Institute of Health and Welfare 2003, The Burden of Disease and Injury in
Australia,
<http://www.aihw.gov.au/publications/hwe/bodaiia03/bodaiia03.pdf>, accessed
22 November 2007.
Better Health Channel 2006, Healthy Eating Tips,
<http://www.betterhealth.vic.gov.au/BHCV2/ bhcarticles.nsf/pages/Healthy
eating_for_children_and_adults>, accessed 20 November 2007.
Cameron, A et al. 2003, 'Overweight and Obesity in Australia: the 1999–2000 Australian
Diabetes, Obesity and Lifestyle Study (AusDiab)', The Medical Journal of
Australia, vol. 178, no. 9, pp. 437–432.
Komlos, J and Lauderdale, B 2007, 'Underperformance in Affluence: The Remarkable
Relative Decline in U.S. Heights in the Second Half of the 20th Century', Social
Science Quarterly, vol. 88, no. 2.
NSW Health 2004, NSW Schools Physical Activity and Nutrition Survey (SPANS):
Summary Report,
<http://www.health.nsw.gov.au/pubs/2006/pdf/spans_report.pdf>, accessed 21
November 2007.
Lahti-Koski, M et al. 2002, 'Associations of body mass index and obesity with physical
activity, food choices, alcohol intake, and smoking in the 1982–1997 FINRISK
Studies', Am J Clin Nutr 2002; no. 75, pp. 809–17.
World Health Organisation 2003, Obesity and Overweight: Global Strategy on Diet,
Physical Activity and Health, WHO, Geneva.
A B S • OV E R W E I G H T A N D OB E S I T Y I N A D U L T S • 4 7 1 9 . 0 • 2 0 0 4 – 0 5 43
B I B L I O G R A P H Y

www.abs.gov.auWEB ADDRESS
All statistics on the ABS website can be downloaded freeof charge.
F R E E A C C E S S T O S T A T I S T I C S
Client Services, ABS, GPO Box 796, Sydney NSW 2001POST
1300 135 211FAX
1300 135 070PHONE
Our consultants can help you access the full range ofinformation published by the ABS that is available free ofcharge from our website, or purchase a hard copypublication. Information tailored to your needs can also berequested as a 'user pays' service. Specialists are on handto help you with analytical or methodological advice.
I N F O R M A T I O N A N D R E F E R R A L S E R V I C E
A range of ABS publications are available from public andtertiary libraries Australia wide. Contact your nearestlibrary to determine whether it has the ABS statistics yourequire, or visit our website for a list of libraries.
LIBRARY
www.abs.gov.au the ABS website is the best place fordata from our publications and information about the ABS.
INTERNET
F O R M O R E I N F O R M A T I O N . . .
2471900013892
RRP $27.00
47
19
.0
•
OV
ER
WE
IG
HT
AN
D
OB
ES
IT
Y IN
A
DU
LT
S,
AU
ST
RA
LI
A
• 2
00
4–
05
© Commonwealth of Australia 2008Produced by the Australian Bureau of Statistics