Embed Size (px)
Citation preview
CS233917-Z
National Center for Chronic Disease Prevention and Health Promotion Division of Nutrition, Physical Activity and Obesity
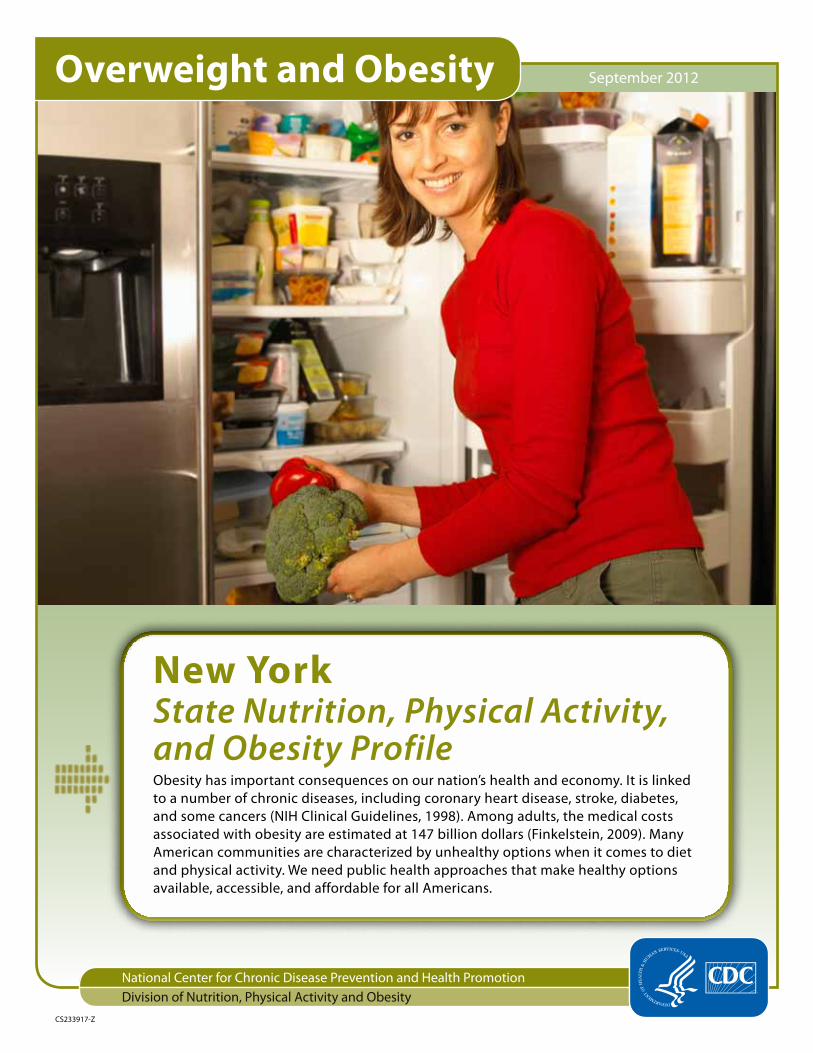
Overweight and Obesity September 2012
New York State Nutrition, Physical Activity, and Obesity ProfileObesity has important consequences on our nation’s health and economy. It is linked to a number of chronic diseases, including coronary heart disease, stroke, diabetes, and some cancers (NIH Clinical Guidelines, 1998). Among adults, the medical costs associated with obesity are estimated at 147 billion dollars (Finkelstein, 2009). Many American communities are characterized by unhealthy options when it comes to diet and physical activity. We need public health approaches that make healthy options available, accessible, and affordable for all Americans.
New York - State Nutrition, Physical Activity, and Obesity Profile
Page 2 of 4
CDC’s Division of Nutrition and Physical, and Obesity (DNPAO) supports the nation’s capacity to address public health in all policies and establish successful and sustainable interventions to support healthy eating and active living. The Division provides support (i.e., implementation and evaluation guidance, technical assistance, training, surveillance and applied research, translation and dissemination, and partnership development) to states, communities and national partners to implement policy, system, and environmental strategies. The goal is to improve dietary quality, increase physical activity and reduce obesity across multiple settings—such as child care facilities, workplaces, hospitals and medical care facilities, schools, and communities.
State Population of New york• Estimated Total Population 2010(1)
= 19,378,102
• Adults age 18 and over(2) = 77.7% of the total population in 2010
• Youth under 18 years of age(1) = 22.3% of the total population in 2010
(1) U.S. Census Bureau. State and County QuickFacts. 2011. Available online at http://quickfacts.census.gov/qfd/index.html
(2) Calculated estimated = 100% minus percent of the total population under 18 years old, using State and County QuickFacts, 2010 data from the U.S. Census.
Adult Overweight and ObesityOverweight and Obesity(3)
• 60.6% were overweight, with a Body Mass Index of 25 or greater.
• 23.9% were obese, with a Body Mass Index of 30 or greater.
Dietary Behaviors(4) • 38.9% of adults reported having consumed fruits
at the recommended level of 2 or more times per day.
• 24.7% of adults reported having consumed vegetables at the recommended level of 3 or more times per day.
Physical Activity(5)
• 44.1% of adults achieved at least 300 minutes a week of moderate-intensity aerobic physical activity or 150 minutes a week of vigorous-intensity aerobic activity (or an equivalent combination).
• 26.4% of New York’s adults reported that during the past month, they had not participated in any physical activity.
Source of Adult Obesity Data:(3) CDC. Behavioral Risk Factor Surveillance System:
Prevalence and Trend Data–Overweight and Obesity, U.S. Obesity Trends, Trends by State 2010. Available online at http://nccd.cdc.gov/NPAO_DTM/
Source of Adult Fruit and Vegetable Data: (4) CDC. MMWR September 2010 State–Specific Trends in
Fruit and Vegetable Consumption Among Adults United States, 2000–2009. Available online at http://www.cdc.gov/mmwr/pdf/wk/mm5935.pdf
Source of Adult Physical Activity Data:(5) CDC. BRFSS Behavioral Risk Factor Surveillance System:
Prevalence and Trend Data–Physical Activity, U.S. Physical Activity Trends by State 2009–2010. Available online at http://nccd.cdc.gov/NPAO_DTM/
Adolescent Overweight and Obesity
Overweight and Obesity(6)
• 15.6% were overweight (≥ 85th and < 95th percentiles for BMI by age and sex, based on reference data)
• 11% were obese (≥95th percentile BMI by age and sex, based on reference data)
Unhealthy Dietary Behaviors(6)
• Fruit consumption: 66.1% ate fruits or drank 100% less than 2 times per day during the 7 days before the survey (100% fruit juice or fruit)
• Vegetable consumption: Data not available in 2010
• Sugar-sweetened beverage consumption: 24.5% drank a can, bottle, or glass of soda or pop (not including diet soda or diet pop) at least one time per day during the 7 days before the survey
New York - State Nutrition, Physical Activity, and Obesity Profile
Page 3 of 4
Physical Activity(6)
• Achieved recommended level of activity: Only 23.1% were physically active* for a total of at least 60 minutes per day on each of the 7 days prior to the survey.
• Participated in daily physical education: 15.4% of adolescents attended daily physical education classes in an average week (when they were in school).
Physical Inactivity(6)
• No activity: 17.0% did not participate in at least 60 minutes of physical activity on any day during the 7 days prior to the survey.
• Television viewing time: 32.7% watched television 3 or more hours per day on an average school day.
The 2010 New york School Health Profiles assessed the school environment, indicating that among high schools(7)
• 38.2% did not sell less nutritious foods and beverages anywhere outside the school food service program.
• 16.9% always offered fruits or non-fried vegetables in vending machines and school stores, canteens, or snack bars, and during celebrations whenever foods and beverages were offered.
• 71.1% prohibited all forms of advertising and promotion of candy, fast food restaurants, or soft drinks in all locations. All school-related locations were defined as in school buildings; on school grounds, including on the outside of the school building, on playing fields, or other areas of the campus; on school buses or other vehicles used to transport students; and in school publications.
Sources of Adolescent Obesity, Fruit and Vegetable, Sugar-sweetened Beverages, and Physical Activity Data:
* Physical activity defined as “any kind of physical activity that increases your heart rate and makes you breathe hard some of the time.”
(6) CDC, Division of Adolescent and School Health. The 2009 Youth Risk Behavior Survey. Available online at http://www.cdc.gov/HealthyYouth/yrbs/index.htm
(7) CDC, Division of Adolescent and School Health. The 2010 School Health Profiles. Available online at http://www.cdc.gov/healthyyouth/profiles/index.htm
Child Overweight and ObesityBreastfeeding(8)
Increasing breastfeeding initiation, duration, and exclusivity is a priority strategy in CDC’s efforts to decrease the rate of childhood obesity throughout the United States. • 78.2% of infants were Ever Breastfed.
• 47.7% of infants were Breastfed for at least 6 months.
Body Mass Index(9)*
Among New york’s children aged 2 years to less than 5 years *• 17% were overweight (85th to < 95th percentile
BMI-for-Age).
• 14.5% were obese (≥ 95th percentile BMI-for-Age).
Sources of Breastfeeding Data:(8) CDC. Division of Nutrition, Physical Activity, and Obesity
Breastfeeding Report Card 2011. Centers for Disease Control and Prevention National Immunization Survey, Provisional Data, 2008births. Available online at http://www.cdc.gov/breastfeeding/data/reportcard2.htm
Sources of Child Obesity Data:(9) CDC. Division of Nutrition, Physical Activity, and Obesity. 2010
Pediatric Nutrition Surveillance System, Table 6 (PedNSS). http://www.cdc.gov/pednss/pednss_tables/tables_health_indicators.htm
* BMI data only includes low-income children from the PedNSS sample and do not represent all children.
* BMI data is based on 2000 CDC growth chart percentiles for BMI-for-age for children 2 years of age and older.
New york’s Response to ObesityCreating Healthy Spaces During the 2010/2011 fiscal year, the Obesity Prevention Program (OPP), in collaboration with the Division of Nutrition’s Eat Well Play Hard Community initiative and the Diabetes Prevention and Control Program funded “Creating Healthy Places” community contractors over five years to implement prescribed policy, system and environmental change strategies to increase physical activity, reduce sedentary behavior, and increase access to and consumption of healthy foods.
New York - State Nutrition, Physical Activity, and Obesity Profile
Page 4 of 4
BMI Measures and Counseling - Medical ProvidersThe NYSDOH awarded a contract to Centers for Best Practices for the Prevention of Childhood Overweight and Obesity to train medical practitioners on the use of recommended obesity screening methods and obesity prevention. Below is a list of activities being conducted: • The Prenatal and Infancy Center recruits, train and
provide on-going technical assistance to at least six family medicine and obstetric and primary care practices to increase awareness, knowledge and skills regarding breastfeeding initiation, duration and exclusivity, and screening and counseling for pre-pregnancy overweight, obesity and excessive weight gain during pregnancy.
• The School-Age Center conducts workshops, grand rounds, and on-going training and technical assistance to three ambulatory care practices.
Eat Well Play Hard in Child Care SettingsAn Obesity Prevention Program Partner, the NYS Child and Adult Care Food Program, administered by the Department of Health, Division of Nutrition is implementing Eat Well Play Hard in Child Care Settings in 210 licensed or registered child care centers serving at least 50 percent of children from Food Stamp eligible households. The intervention provides training for child care staff and a curriculum of ten lessons for children and parents on healthy eating, increasing physical activity and reducing TV/screen time. CACFP will also administer an obesity prevention initiative in 120 low-income family day care homes.
Nutrition and Physical Activity Self-Assessment for Child Care (NAP SACC)The Early Care and Learning Council is implementing the Nutrition and Physical Activity Self-Assessment for Child Care (NAP SACC) in 50 licensed child care centers serving children from low-income households, including a TV-viewing module In addition, the NAP SACC Media Module, developed by NYSDOH, is being implemented in in up to 35 child care centers. The goal is to identify and test approaches to incorporate the media module into the overall NAP SACC intervention and to document the validity of this added resource.
Physical Activity in School, After school, and Childcare ProgramsThe Obesity Prevention Program and its partners in the NYSDOH, including Healthy Heart, Diabetes Prevention, Alliance for Healthier Communities,
and Tobacco Control Program, is providing state funding to a minimum of 70 contractors to improve physical activity in school, after school, and childcare programs in the majority of the 62 counties of the state. Strategies include: increase the quantity and quality of moderate to vigorous intensity physical activity, increase the accessibility of physical activity opportunities, and implement policy and environmental changes to support physical activity.
Healthy Schools New YorkHealthy Schools NY targets children in low-income communities by working with school districts where 50% or more of the students are eligible for free or reduced price school meals. Using state funds and multiple partners, NYSDOH hired contractors to conduct staff training on physical activity-related curricula; provide technical assistance to school and after-school programs; assist schools in assessing and incorporating policy and environmental changes.
Breastfeeding Initiative- Maternity Care The Obesity Prevention Program worked with partner programs in the NYSDOH, other state and local agencies, and with contractors and stakeholders including the NYS Breastfeeding Coalition to develop and implement a Learning Collaborative; to foster policy, Improving environmental and systems change to promote compliance with the Ten Step to Successful Breastfeeding among low performing hospitals; and to increase hospital rates of infants who were fed exclusively fed breast milk.
Contact InformationKyle A. Restina Program Coordinator Bureau of Health Risk Reduction New York State Department of Health Division of Chronic Disease Prevention and Adult Health, Riverview Center, 3 West 150 Broadway, Albany, NY 12204 Ph: 518-408-5126 Fax: 518-474-3356 E-mail: [email protected] Website: www.nyhealth.gov/prevention/obesity
ReferencesNIH. Clinical Guidelines Clinical Guidelines on the Identification, Evaluation, and Treatment of Overweight and Obesity in Adults: The Evidence Report. 1998. Available online at http://www.nhlbi.nih.gov/guidelines/obesity/ob_gdlns.htm
Finkelstein, EA, Trogdon, JG, Cohen, JW, and Dietz, W. Annual medical spending attributable to obesity: Payer- and service-specific estimates. Health Affairs 2009; 28(5): w822-w831.