Embed Size (px)
Citation preview
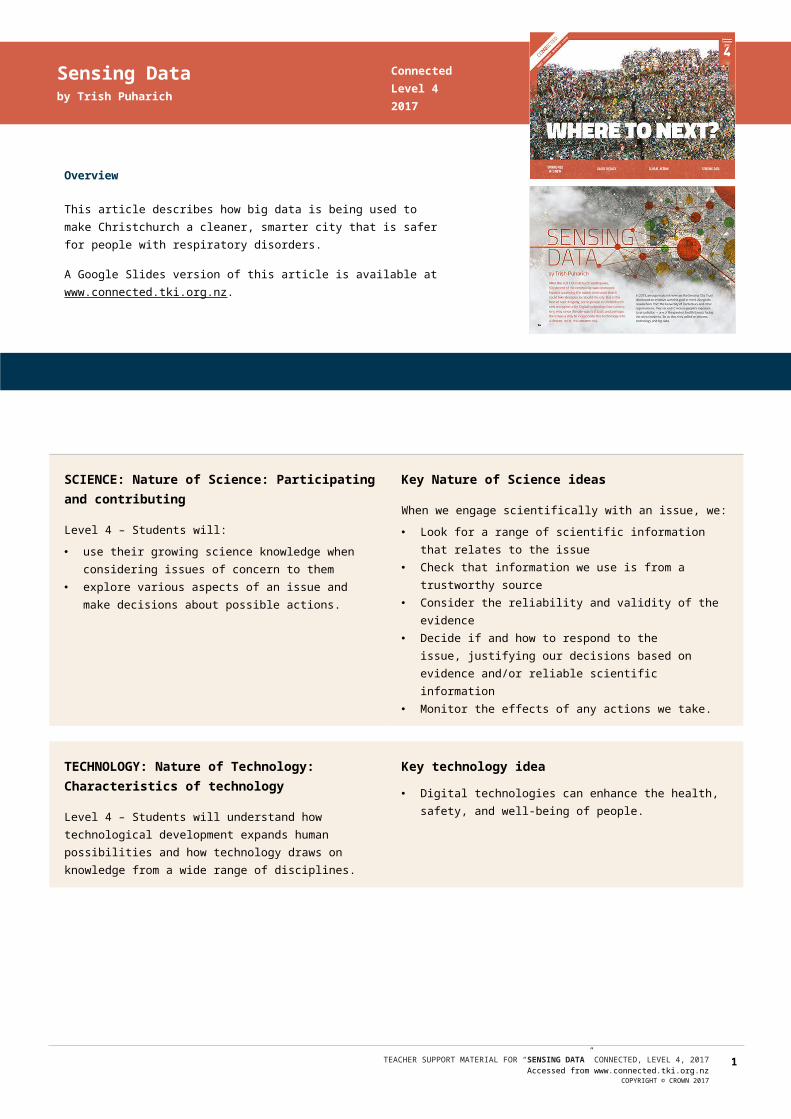
Sensing Databy Trish Puharich
Overview
This article describes how big data is being used to make Christchurch a cleaner, smarter city that is safer for people with respiratory disorders.
A Google Slides version of this article is available at www.connected.tki.org.nz.
Curriculum contexts
SCIENCE: Nature of Science: Participating and contributing
Level 4 – Students will:
use their growing science knowledge when considering issues of concern to them
explore various aspects of an issue and make decisions about possible actions.
Key Nature of Science ideas
When we engage scientifically with an issue, we:
Look for a range of scientific information that relates to the issue
Check that information we use is from a trustworthy source Consider the reliability and validity of the evidence Decide if and how to respond to the issue, justifying our
decisions based on evidence and/or reliable scientific information
Monitor the effects of any actions we take.
TECHNOLOGY: Nature of Technology: Characteristics of technology
Level 4 – Students will understand how technological development expands human possibilities and how technology draws on knowledge from a wide range of disciplines.
Key technology idea
Digital technologies can enhance the health, safety, and well-being of people.
MATHEMATICS and STATISTICS: Statistics: Statistical investigation
Level 4 – Plan and conduct investigations using the statistical enquiry cycle:
determining appropriate variables and data collection methods;
gathering, sorting, and displaying multivariate category, measurement, and time-series data to detect patterns, variations, relationships, and trends;
comparing distributions visually; communicating findings, using appropriate displays.
Key mathematics ideas
Big data can help us understand things in new ways.
TEACHER SUPPORT MATERIAL FOR “SENSING DATA” CONNECTED, LEVEL 4, 2017Accessed from www.connected.tki.org.nz
COPYRIGHT © CROWN 2017
1
ConnectedLevel 42017
ENGLISH: Reading
Level 4 – Ideas: Students will show an increasing understanding of ideas within, across, and beyond texts.
Indicators
Makes meaning of increasingly complex texts by identifying and understanding main and subsidiary ideas and the links between them.
Makes connections by thinking about underlying ideas within and between texts from a range of contexts.
Recognises that there may be more than one reading available within a text.
Makes and supports inferences from texts with increasing independence.
The New Zealand Curriculum
TEACHER SUPPORT MATERIAL FOR “SENSING DATA” CONNECTED, LEVEL 4, 2017Accessed from www.connected.tki.org.nz
COPYRIGHT © CROWN 2017
2
Science capability: engage with science
Capability overview
This capability requires students to use the other capabilities to engage with science in real-life contexts. It requires students to take an interest in science issues, participate in discussions about science, and at times, take action.
The dimensions of this capability can be demonstrated when students engage in discussions about science issues, including those in the media. If these discussions build on the ideas of others, emphasise logical connections, and draw reasonable conclusions, and if the speakers make the evidence behind their claims explicit, then students have the opportunity to practise playing the “game of science” (Resnick, Michaels, & O’Connor, 2010).
This allows them to deepen their understanding of what science is.
Students also need opportunities to be actively engaged in exploring real-life science issues that are relevant to them and their communities. This could involve building new knowledge with others and taking action to address local or global concerns.
More about the capability
The capability in action
Real-life science issues:
may involve a mix of scientific issues and forms of social-science inquiry, including values and ethics
provide opportunities to build awareness of which questions can be investigated and which questions science does not answer
provide opportunities to see science as tentative, that is, developing over time as evidence is gathered or reinterpreted
provide experiences of uncertainty where there is no clear explanation or solution
allow students to gather and interpret data about a local situation or to critique a range of evidence and claims
may generate a range of student views, responses, and possible actions.
Students
Students should have opportunities to:
take an interest in a range of scientific issues participate in discussions about scientific issues use their developing capabilities of gathering and interpreting
data, using and critiquing evidence, and interpreting representations to create a viewpoint, response, or action on scientific issues.
Teachers
Teachers can:
establish a science classroom culture by:‒ taking a personal interest in scientific issues, modelling
questions, explicitly critiquing evidence, and seeking further evidence
‒ maximising everyday opportunities to introduce learning conversations that engage students with science and scientific issues
‒ helping their students to notice and investigate science in their everyday surroundings, such as ice on a puddle, the health of a local stream or river, or what happens as materials are mixed or heated
‒ listening to and discussing socio-scientific items in the news
‒ exploring locally relevant and contentious scientific issues, such as irrigation, intensive farming, or the effects of climate change
support students to identify scientific aspects of an issue provide a range of resources and investigation
opportunities pertaining to scientific issues that require students to use a range of science capabilities
encourage students to seek and critically evaluate a range of scientific evidence, opinions, and actions from a variety of sources about an issue
manage with sensitivity situations where students and their whānau may hold differing and strongly held opinions about a science-related issue, such as irrigation
support students to identify and take appropriate actions in response to science-related issues.
It is important that students are empowered to be hopeful and see opportunities for positive action and change when considering local and global issues.
More activities to develop the capability
TEACHER SUPPORT MATERIAL FOR “SENSING DATA” CONNECTED, LEVEL 4, 2017Accessed from www.connected.tki.org.nz
COPYRIGHT © CROWN 2017
3
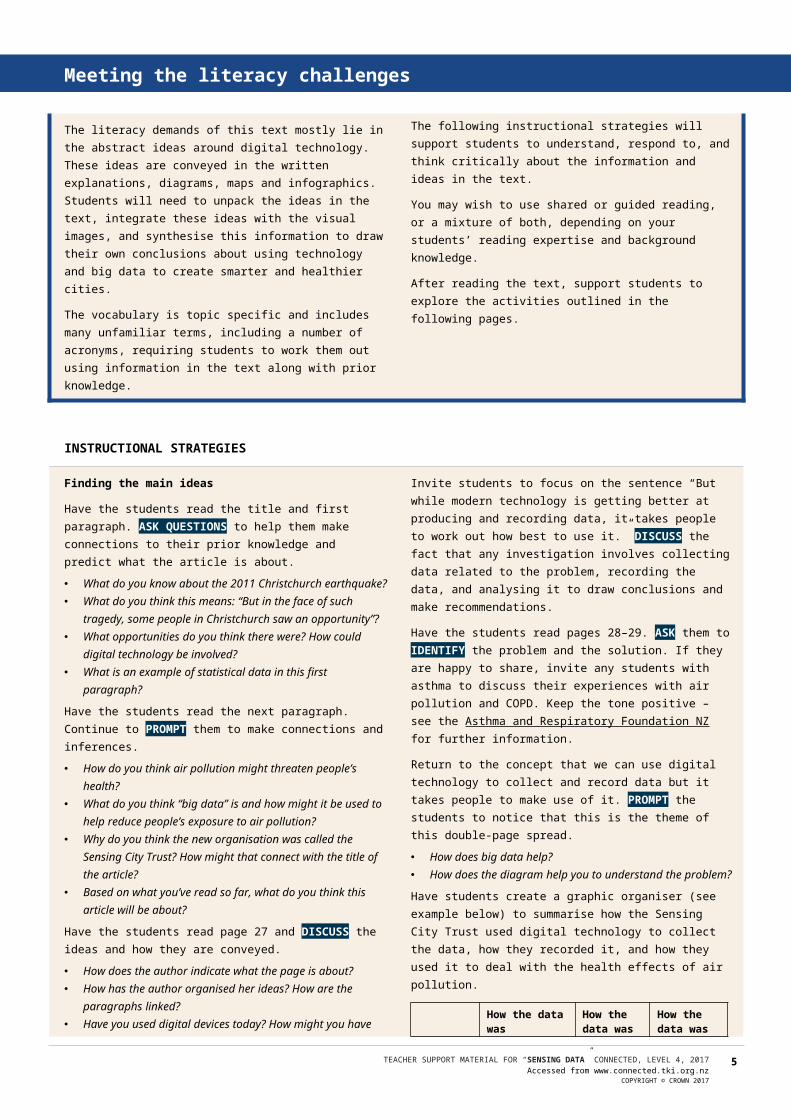
Meeting the literacy challenges
The literacy demands of this text mostly lie in the abstract ideas around digital technology. These ideas are conveyed in the written explanations, diagrams, maps and infographics. Students will need to unpack the ideas in the text, integrate these ideas with the visual images, and synthesise this information to draw their own conclusions about using technology and big data to create smarter and healthier cities.
The vocabulary is topic specific and includes many unfamiliar terms, including a number of acronyms, requiring students to work them out using information in the text along with prior knowledge.
The following instructional strategies will support students to understand, respond to, and think critically about the information and ideas in the text.
You may wish to use shared or guided reading, or a mixture of both, depending on your students’ reading expertise and background knowledge.
After reading the text, support students to explore the activities outlined in the following pages.
INSTRUCTIONAL STRATEGIES
Finding the main ideas
Have the students read the title and first paragraph. ASK QUESTIONS to help them make connections to their prior knowledge and predict what the article is about.
What do you know about the 2011 Christchurch earthquake? What do you think this means: “But in the face of such
tragedy, some people in Christchurch saw an opportunity”? What opportunities do you think there were? How could
digital technology be involved? What is an example of statistical data in this first paragraph?
Have the students read the next paragraph. Continue to PROMPT them to make connections and inferences.
How do you think air pollution might threaten people’s health?
What do you think “big data” is and how might it be used to help reduce people’s exposure to air pollution?
Why do you think the new organisation was called the Sensing City Trust? How might that connect with the title of the article?
Based on what you’ve read so far, what do you think this article will be about?
Have the students read page 27 and DISCUSS the ideas and how they are conveyed.
How does the author indicate what the page is about? How has the author organised her ideas? How are the
paragraphs linked? Have you used digital devices today? How might you have
contributed to the volume of data? What information do you get from the image? Why do you think we need to know about the Internet of
Things? Can you sketch a diagram of the Internet of Things? The author says that some digital devices can be connected
to sensors. Think about the title and the name of the organisation – what do you think the article will be about?
Invite students to focus on the sentence “But while modern technology is getting better at producing and recording data, it takes people to work out how best to use it.” DISCUSS the fact that any investigation involves collecting data related to the problem, recording the data, and analysing it to draw conclusions and make recommendations.
Have the students read pages 28–29. ASK them to IDENTIFY the problem and the solution. If they are happy to share, invite any students with asthma to discuss their experiences with air pollution and COPD. Keep the tone positive – see the Asthma and Respiratory Foundation NZ for further information.
Return to the concept that we can use digital technology to collect and record data but it takes people to make use of it. PROMPT the students to notice that this is the theme of this double-page spread.
How does big data help? How does the diagram help you to understand the problem?
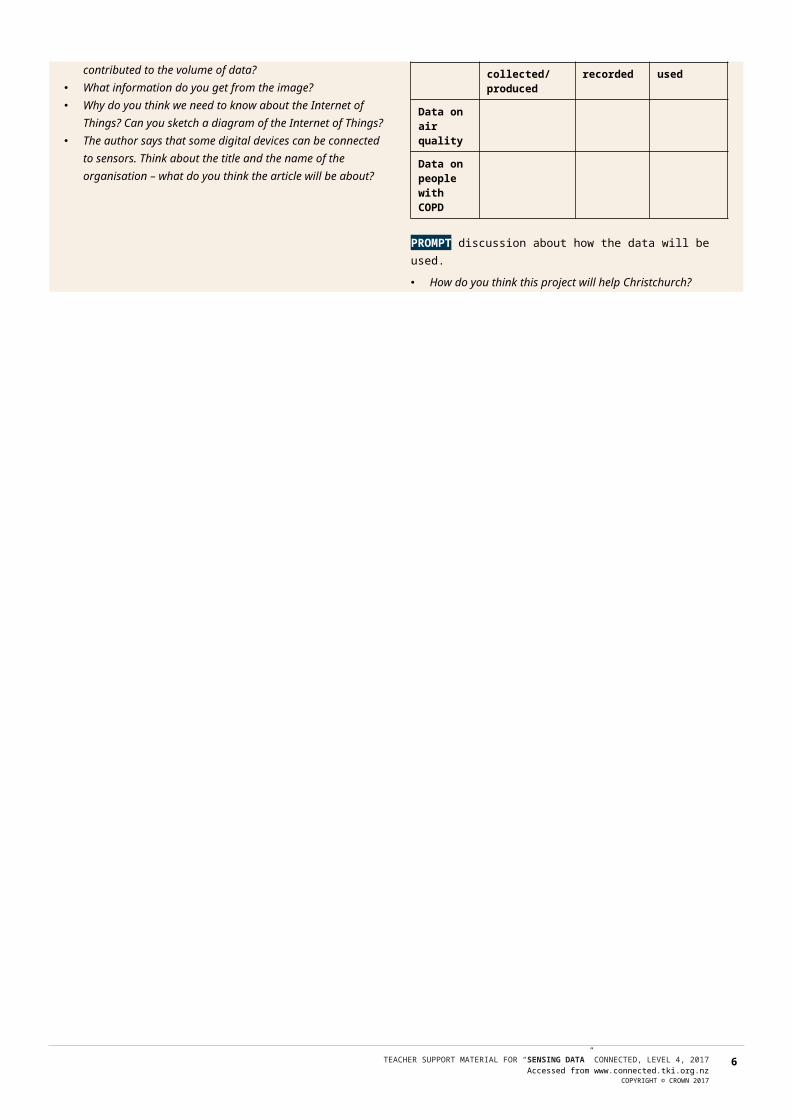
Have students create a graphic organiser (see example below) to summarise how the Sensing City Trust used digital technology to collect the data, how they recorded it, and how they used it to deal with the health effects of air pollution.
How the data was collected/ produced
How the data was recorded
How the data was used
Data on air quality
Data on people with COPD
PROMPT discussion about how the data will be used.
How do you think this project will help Christchurch?
TEACHER SUPPORT MATERIAL FOR “SENSING DATA” CONNECTED, LEVEL 4, 2017Accessed from www.connected.tki.org.nz
COPYRIGHT © CROWN 2017
4
Meeting the literacy challenges
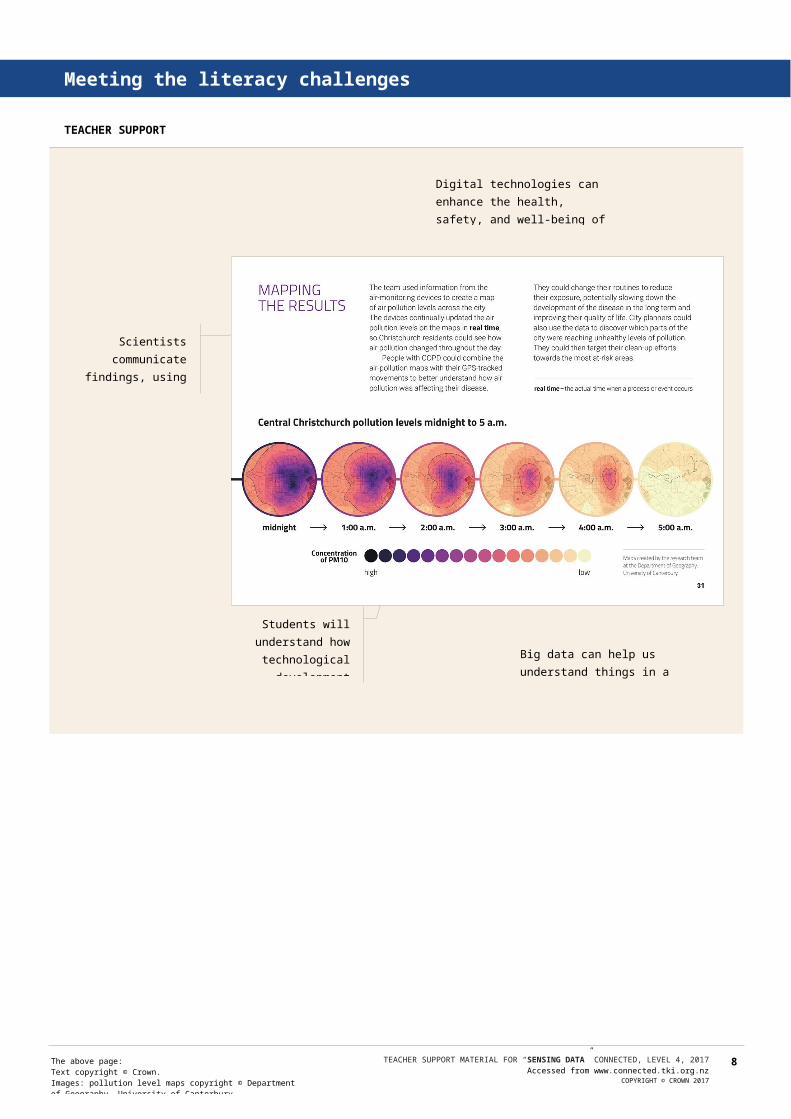
Using design features for deeper understandingHave the students look closely at the maps on pages 30–31.
What information do you need from the key to make sense of each map?
What information do you need from the opening paragraph to make sense of the key on page 30?
Looking at the map on page 31, what inferences can you make about where the air pollution might be most concentrated?
What is the connection between the map on page 30 and the heat (pollution level) maps on page 31?
What statements could you make about the information in the maps?
What questions do these maps make you think of? What do the heat maps tell you about the value of big data?
Have the students look at the infographic on page 32 of a “sensing city”.
Do you know of any “smart city” initiatives that are already in place? How helpful are they?
How might we use big data in our area? What data could be collected and how could it be used?
How do you feel about living in a “smart city”? Is this infographic a good way of engaging readers with
complex ideas and information? How useful was the infographic in helping you to engage with the ideas?
Dealing with unfamiliar vocabularyExplain that this article includes a lot of technical vocabulary related to digital technology. Discuss the idea that for some older people, these words can be difficult to understand. Ask students to think about why this might be. Have them SKIM the text looking for terms that an older relative or friend might struggle to comprehend, then work in pairs to create a glossary to help an older person read and understand this article.
The article also includes a lot of acronyms. EXPLAIN that an acronym is an abbreviation formed from the initial letters of several words that we say as a word, for example, NASA. Give an example of an abbreviation that is not an acronym, for example, NZ and COPD. Have the students SKIM the article, this time looking for the acronyms. ASK QUESTIONS to help them extend their understanding.
Why do you think people use acronyms? How can you work out what an acronym stands for? (Usually
it is explained when it is first introduced. Sometimes, there can be a glossary.)
What other abbreviations are in the text? What are some acronyms you know? How helpful do you find acronyms?
Extending the learningDiscuss the fact that acronyms and other specialised terms can be a barrier to understanding when they are not clearly explained.
When we communicate about special knowledge, we need to be careful that people in our audience are familiar with the specialised language. Think about a topic that interests you, such as a sport or a musical instrument. Do you use words or abbreviations that would only be understood by someone who shares your interest? What would you need to do to talk about your interest with someone who doesn’t have your knowledge?
Have a go at talking about your interest with the people sitting next to you. If you’re the speaker, what information do you need to clarify? If you’re the listener, what do you need to ask?
Reading standard: by the end of year 8
The Literacy Learning Progressions
Effective Literacy Practice: years 5–8
TEACHER SUPPORT MATERIAL FOR “SENSING DATA” CONNECTED, LEVEL 4, 2017Accessed from www.connected.tki.org.nz
COPYRIGHT © CROWN 2017
5
The above page:Text copyright © Crown.Images: pollution level maps copyright © Department of Geography, University of Canterbury.
Meeting the literacy challenges
TEACHER SUPPORT
TEACHER SUPPORT MATERIAL FOR “SENSING DATA” CONNECTED, LEVEL 4, 2017Accessed from www.connected.tki.org.nz
COPYRIGHT © CROWN 2017
6
Scientists communicate findings,
using appropriate displays.
Students will understand how
technological development expands
human possibilities.
Big data can help us understand things in a new way.
Digital technologies can enhance the health, safety, and well-being of people.
Learning activities – Exploring the science, technology,mathematics and statistics
Adapt these activities to support your students’ learning needs.
Activity 1 – Big data: What are the implications?
Have the students read the Connected articles “Global Action” (2017, level 4) and “Captured in Ice” (2017, level 3) to learn about how big data is used to create models of climate change.
Have the students work in groups to investigate a current use of big data. Each group should create a report that includes the data that is being collected, how it is collected and recorded, and what it’s being used for. They might:
investigate other examples of using big data to learn about climate change
investigate the use of GPS data tracking in technologies such as GoogleMaps and FitBit
identify an issue affecting your school or community, for example, transport or drinking water, and research a possible “smart” solution, looking at what others have done
identify an opportunity for using big data to make learning “smart” for your Community of Learning | Kāhui Ako
investigate the positive and negative effects of drones and other kinds of surveillance technology
investigate whether big data is already being collected in your local area
investigate how big data is used to influence our lives (for example, online advertising, Google search results, where items are placed in stores to make customers more likely to buy them).
Have the students read and listen to the Radio New Zealand item “Private eye: Big data, big questions”. As a class, unpack what it says about big data collection. With this in mind, ask each group to review their report and include positive and negative effects.
Have the students present their reports. Use their examples to generate discussion of the ethical issues around big data and its potential benefits and harms.
What are some initiatives we’ve learned about that could be of benefit in our community? How do you know and why do you think this?
What personal data do governments have access to? Is this okay with you? What is more important – our security or our privacy?
How safe are we when we go on the Internet? How can we use the Internet to enhance our lives without compromising our safety?
What might be some “unintended consequences” of collecting big data?
What do you think will happen in the future with big data?
What other sensors could we have in the future? How can we use big data in helpful ways and protect
people’s privacy at the same time? What checks should be in place?
Have each student create a written, oral, or visual text in which they examine one example of the collection and use of big data. They need to take a stand on whether they believe this data should be collected and, if so, how.
What are the potential advantages and disadvantages? How could the data be used to make our lives better without
compromising our privacy? What is your evidence?
Create a set of criteria the students can use to evaluate each other’s texts. The criteria should focus on whether the argument is logical, is supported by evidence, and is well-communicated, not whether the student agrees with the argument.
Extend the learningThe Futures thinking toolkit on the Science Learning Hub can be used to scaffold students’ thinking about possible and preferable future scenarios.
Activity 2 – Investigating air pollution
Have the students go to the Science Learning Hub to learn more about air pollution in Christchurch. They can then research other cities with air pollution problems (for example, Timaru, Beijing).
What is air pollution? How is air pollution affecting the way people live? How is it monitored? What management strategies are in place? How effective are
they?
Have the students carry out the Science Learning Hub activity “Investigating air pollution”. They could then design, produce, and evaluate conceptual designs for filtration systems to combat air pollution.
Extending the learningThe students could read “Testing the Waters” (Connected 2017, level 3) and try monitoring water quality in a local stream.
TEACHER SUPPORT MATERIAL FOR “SENSING DATA” CONNECTED, LEVEL 4, 2017Accessed from www.connected.tki.org.nz
COPYRIGHT © CROWN 2017
7
Learning activities – Exploring the science, technology,mathematics and statistics
RESOURCE LINKS
Connected“Global Action”, Connected 2017, level 4, Where to Next?: http://instructionalseries.tki.org.nz/Instructional-Series/Connected
“Captured in Ice”, Connected 2017, level 3, Mahi Tahi: http://instructionalseries.tki.org.nz/Instructional-Series/Connected
Science Learning HubFutures thinking toolkit: www.sciencelearn.org.nz/resources/2439-futures-thinking-toolkit
Teaching futures thinking: www.sciencelearn.org.nz/resources/2438-teaching-futures-thinking
Investigating air pollution: www.sciencelearn.org.nz/resources/1558-investigating-air-pollution
Air pollution in Christchurch: www.sciencelearn.org.nz/resources/1542-air-pollution-in-christchurch
+plus magazineBig Data: https://plus.maths.org/content/big-data?nl=0
Climate change: Does it all add up?: https://plus.maths.org/content/climate-change-does-it-all-add
StuffChristchurch to be world’s first ‘Sensing City’: www.stuff.co.nz/the-press/news/9480888/Christchurch-to-be-worlds-first-Sensing-City
The internet of Things: Wireless internet for the 100+ hectare farm office: www.stuff.co.nz/business/farming/discovery/93589338/the-internet-of-things-wireless-internet-for-the-100-hectare-farm-office
Other sources
CensusAtSchool: http://new.censusatschool.org.nz/take-part/
NZHerald – Timaru has the ‘worst level of air pollution’ in Australasia, figures reveal: www.nzherald.co.nz/nz/news/article.cfm?c_id=1&objectid=11640427
Asthma and Respiratory Foundation NZ: www.asthmafoundation.org.nz
Radio New Zealand – Private eye: Big data, big questions: www.radionz.co.nz/stories/201818920/private-eye-big-data-big-questions
Sisense – How IoT and big data are driving smart traffic management and smart cities: http://bigdata-madesimple.com/iot-big-data-driving-smart-traffic-management-smart-cities/
Telensa – Traffic analytics: making sense of raw data, small data and big data: www.telensa.com/2017/06/06/smart-cities-making-sense-of-raw-data-small-data-and-big-data/
MAPR – Big Data on the Road: https://mapr.com/blog/big-data-road/
NZ Transport Agency – Smart Motorway: www.nzta.govt.nz/projects/wellington-northern-corridor/smart-motorway/
Forbes – A Simple Explanation Of ‘The Internet of Things’: www.forbes.com/sites/jacobmorgan/2014/05/13/simple-explanation-internet-things-that-anyone-can-understand/#1081094b1d09
Extreme – Is Your School An Internet Of Things Smart School?: https://content.extremenetworks.com/extreme-networks-blog/is-your-school-an-internet-of-things-smart-school
ISBN 978–1–776–69138–8 (WORD) ISBN 978–1–776–69139–5 (PDF)
TEACHER SUPPORT MATERIAL FOR “SENSING DATA” CONNECTED, LEVEL 4, 2017Accessed from www.connected.tki.org.nz
COPYRIGHT © CROWN 2017
8