Embed Size (px)
Citation preview

Overview – Surface analysis
Molecular vibrations and Infrared spectroscopyThe surface selection rule and orientationInfrared reflection-absorption spectroscopy (IRAS)Total internal reflection spectroscopy (TIR)
Electron spectroscopy for surface analysisElementar and chemical analysisThe inelastic mean free pathDepth profiles and molecular orientation
Surface plasmon resonanceBiomolecular interaction analysis (BIA)
Electrochemical analysis of SAMsQuantitative and qualitative measurements
Surface analytical methods that
we have already considered…
STM: Scanning tunneling microscopyBAM: Brewster angle microscopyTPD: Temperature programmed desorptionLEED: Low energy electron diffractionFIM: Field ion microscopyXRD: X-ray diffractionTensiometry (Wilhelmy balance)Contact angle measurements
…
Harmonic and anharmonic
vibrationHarmonic vibration
0 DD E E= +2
ka
D=( )2( )( ) 1 ea r rV r D e− −= −
0,1, 2,...n =
2( )( )
2ek r r
V r−=
1n nE E hcv+ − =
1
2nE hcv n = +
0,1, 2,...n =[ ]2( 1/ 2)1
2 4n
hcv nE hcv n
D
+ = + −
( )2
1 ( 1)2n n
hcvE E hcv n
D+ − = − +
Anharmonic vibration
(Morse potential)
Vibrational energies
• Energies of vibrational transitions lie in the infrared range.
• The frequencies of vibrational transitions depend on the atoms, and the bond strenghts, for the atoms involved in a vibration.→ Basis for chemical identification via infrared spectroscopy!
• Observable vibrational transitions – normal modes – df
• Frequencies and energies in this field are often given inwavenumbers
1
c
ννλ
= =% E h hcν ν= = %[cm-1]

Elementary vibration types
The frequencies of these vary according to ν > δ > γ > τ
In large molecules (polymers) combined vibrations are commonlylabeled separately, e.g. for bending vibrations in CH2 groups:
Rocking, ρ Twist, t Wagging, ω
Vibrational
modes in
CH2 and CH3
(The arrows length’sindicate relative motionamplitudes)
Normal modes in amides
1600-1700 cm-1
Primarily C=O stretching, withcontributions from N–H bending and C–N stretching.
1500-1600 cm-1
Primarily N–H bending, with somecontribution from C–N stretching.
Amide III: About 1230 cm-1 from N–H bending and C–N stretching. DeFlores et al., J. Phys. Chem. B 110, 18973 (2006)
In practice, normal modes (i.e. experimentally accessible vibrations)are combinations of different vibration types.
Identification of unknown
substances
Carbonyls onnext slide!

Carbonyls
R1 C R2
O
R1, R2 aliphaticsubstituents
Carbonyl stretching (Amide I) in
peptide bonds
Tra
nsm
ittan
ceR
efle
ctan
ce
Bulk
Isolated
CH3 NCH3
O
H
CH3
CH3
O
N
H
α-helix1655 ± 3 cm-1
Albumin (55%)
β-sheet1632 ± 3 cm-1
β-Lactoglobulin (45%)
Information content in IR
spectraHydrogen bonding,collective motions
Localized modesin functional groups
Backbone (’skeleton’)vibrations
Modes of metals andheavy elements
Overtonesν1 + ν2
Functional groupsC=O, NH, C≡N...
Backbone modes”fingerprint region”
Heavy elementsH-bonding
Analytical possibilities with IR
spectroscopyExample: Carbonyl stretching ν(C=O)
Methyl ester Acid Carboxylate

Water in IR spectra
-0.010
0.010.020.030.040.050.060.07
10002000300040005000
Wavenumber (1/cm)
Abs
orba
nce
Water
Peptide
CO2
Symmetricstretching, ν1
Asymmetric stretching, ν2
Bending, ν3
H2O (g) 3657 cm-1 3756 cm-1 1595 cm-1
H2O (l) 3490 cm-1 3450 cm-1 1645 cm-1
H2O (s) 3277 cm-1
The details of thewater vib-rotspectrum will alsovary with thetemperature!
Water must be avoided!
Bulk samples: Transmission
methodsGas phase:
10 cm – 10 m (folded beam path)IR-window
Liquid:
Thin film:
5-200 µm
1 mm
Pressed pellet of the sampleground with KBr
Solid:
0.5-50 µm 3 nm ?
Molecular filmsare too thin to give appreciableabsorption in a transmissionexperiment!
or
For surface studies:
Reflection methods
External Reflection Internal reflection
In water:
Light path through thewater layer 0.1-1 mmLarge influence of water!
Light is introduced via anevanescent field, 2-20 µmSmall influence of water!
In air:Multiple reflections
gives high sensitivity!
External reflection from metal
surfaces
Destructive interference at allincidence angles – cancellation!
Constructive interference at highincidence angles – amplification!
500 cm-1
2900 cm-1
At 90° pase shift constructive interference betweenincident and reflected light is obtained; for p-polarizedlight this occurs at 89.6° angle of incidence for500 cm-1, and at 87.7° for 2900 cm-1.
xy
z

Infrared Reflection-Absorption
SpectroscopyA.k.a... RAIR, IRRS, FT-IRAS, RAS, GIR, IR-ERS, ERIR, FT-IRRAS, FTIR/RA... FT = Fourier-transform; virtually all IR data are collected using Fourier methods
The anisotropic electric field at a metal surface
,2 i≈E E
, ,r i⊥ ⊥≈ −E E0⊥ ≈E
Surface active
Surface inactivebecause
With IRAS we can go beyond identification, and study structure! Naselli, J. Chem. Phys., 82, 2136 (1985)
Peak positionsreveal structureand orientation inthe hydrocarbonchains!
νas(CH2)
νs(CH2)
all trans 2918 cm-1
gauche 2927 cm-1
all trans 2849 cm-1
gauche 2856 cm-1
LB-film stability
Structure sensitive vibration modes
νas(CH2) νs(CH2)
2849 cm-1
2918cm-1
2855cm-12925
cm-1
6 monolayers of aracidonic acid stabilized with Cd2+.

Determining molecular orientationCompare IRAS intensities with the transmission of (a) a bulk sample, or
(b) with the transmission of a film on an IR-transparent substrate.
Masν0CH2
Msν3CH2
MsMas ν0COO-ν3COO-
Amide coupling onto thiols
-COOH1740 cm-1
Reaction scheme for a carboxyl thiol.
conversion to an amideor
bindning of polylysine (proteins!)
Amide band
MUA
Amide
MUA = Mercapto-undecanoic acid
*
*
”Layer-by-layer”-deposition
Cheng, J. Phys. Chem. B, 103, 8726 (1999)
Amide I Amide II Carboxylate
LBL: The sample is dipped alternatelyinto different polyelectrolyte solutions.
Elli
pso
met
ry
FT-
IR
C
CH3
O
CH2
CH2
NH2
O
CH2
COO-
NH3+
neutral
Gradient
After Lys + HSAadsorption
C=O methacrylate
COO-
Amide I(C=O)str
Gradient formation IR microscopy
Profile
(+/-) Hydrogel Gradients

COO- str.at 1605 and1585 cm-1
Carboxylation
ProteinImmobilization
Amide I,IIat 1661 and
1548 cm-1
Plain hydrogel Carboxylation and Immobilization
∫C=O at 1730 cm-1
∝ Thickness
C=O, 1730 cm-1
p(PEGMA-co-HEMA) Gradient
COO- str.at 1605 and1585 cm-1
Carboxylation
ProteinImmobilization
Amide I,IIat 1661 and
1548 cm-1
Plain hydrogel Carboxylation and Immobilization
C=O, 1730 cm-1
p(PEGMA-co-HEMA) Gradient
ATR – Attenuated Total
Reflectance
ATR crystal(or IRE, ”Internalreflection element”)
Adsorption of IgG onto
polystyrene

Doping-dedoping in composite
lignin/polypyrrole electrodes
Theoretical calculations of IR
spectra
Malysheva, J. Phys. Chem. A, 109, 7788 (2005)
3h2h
OEG-SAMs
Summary – IR spectroscopy
Extremely sensitive and non-destructive methods for molecular films and adsorbates.
- Submonolayer sensitivity
ATR
- Requires IR-transparent substrates- Enables measurements in aqueous solutions, since the influcence
of the bulk is small
IRAS
- Ideal for studies of molecular films and thin layers on metals. - Can be used to determine the orientation of molecules on surfaces.- Polarization dependence a problem with unknown substances.
Electronic structure and
chemical analysis
X-ray photoelectron spectroscopy (XPS), orElectron spectroscopy for chemical analysis (ESCA)
Inelastic mean free pathElemental analysisChemical shiftsDepth profilesMolecular orientation

Determination of the bindning
energy
B kE h Eν= − Φ −
Photon energy Work function - energy required to bring anelectron from the Fermi to the vacuum level.
Kinetic energy(measured)
Koopman’s theorem: EB ≈ orbital energy, ε
This assumption means that the energy of the photoemitted electrons is unaffected by the resulting electron hole, which is never true!
During an experiment, electrons are brought from the sample, and if these are not returned there will be a successive charging of the sample. To avoid this, the sample is grounded to the spectrometer, and thus adjusted to the Fermi level of the spectrometer, which means that the work function must be corrected:
B sp kE h Eν= − Φ −
Ionize atoms withX-ray photons:
X-ray photoelectron spectroscopy
Samplehν
Electron detector(counter)
Energy analyser(”hemispherical
analyser”)Too high Eki
Too lowEki
Monochromator
X-ray source
Detector
XPS-system from Omicron
UHV-system, 10-10 – 10-12 Torr
Characteristic features of
ESCA/XPS• Binding energies are unique for different elements; of particular interest is
that e.g. C, S, O and N have unique binding energies.
• The intensity of a band is proportional to the concentration of the element ⇒ quantitative composition analysis.
• The exact binding energy is affected by the local electron environment ⇒Chemical shifts reflecting the structure of the material (cf NMR).
Survey spectrumof a SAM on gold.
Inelastically scatteredelectrons.
”Survey scan”
(Polyurethane)
Work flow: Acquire a survey scan ⇒ zoom inon interesting features and peaks.
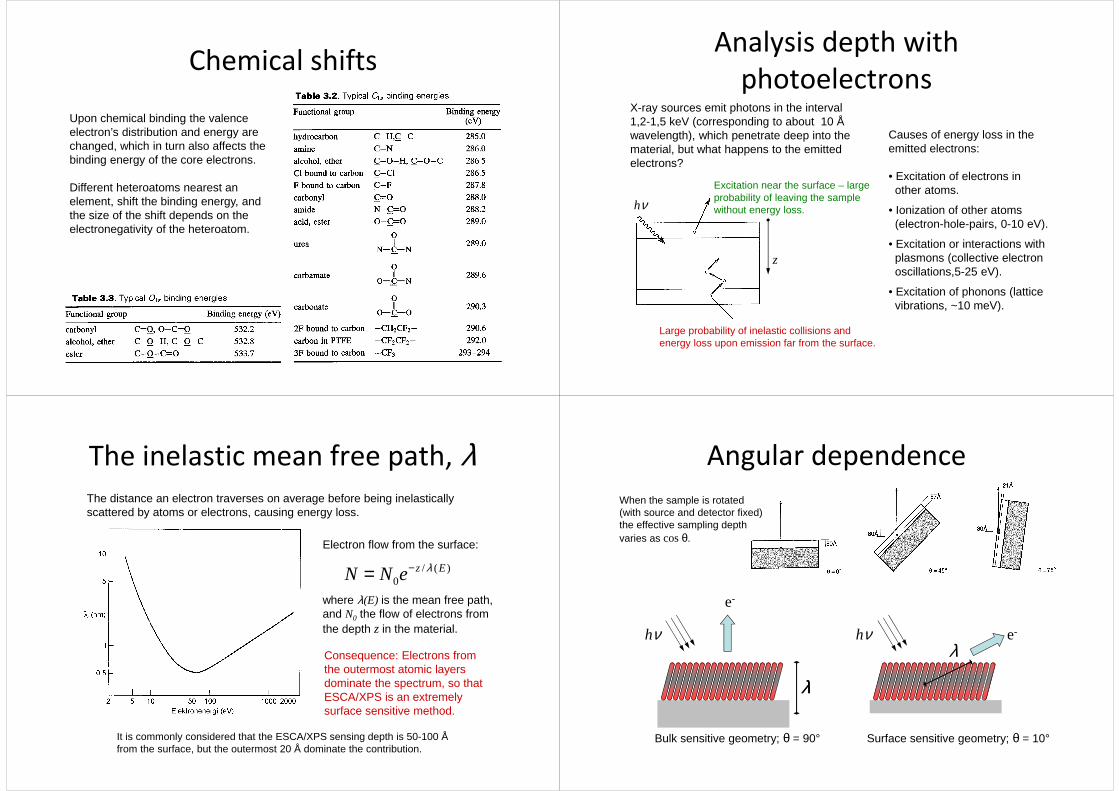
Chemical shifts
Upon chemical binding the valence electron’s distribution and energy are changed, which in turn also affects the binding energy of the core electrons.
Different heteroatoms nearest an element, shift the binding energy, and the size of the shift depends on the electronegativity of the heteroatom.
Analysis depth with
photoelectronsX-ray sources emit photons in the interval1,2-1,5 keV (corresponding to about 10 Åwavelength), which penetrate deep into thematerial, but what happens to the emittedelectrons?
Causes of energy loss in the emitted electrons:
• Excitation of electrons inother atoms.
• Ionization of other atoms (electron-hole-pairs, 0-10 eV).
• Excitation or interactions withplasmons (collective electronoscillations,5-25 eV).
• Excitation of phonons (latticevibrations, ~10 meV).
Excitation near the surface – large probability of leaving the sample without energy loss.hν
Large probability of inelastic collisions andenergy loss upon emission far from the surface.
z
The inelastic mean free path, λThe distance an electron traverses on average before being inelastically scattered by atoms or electrons, causing energy loss.
It is commonly considered that the ESCA/XPS sensing depth is 50-100 Å from the surface, but the outermost 20 Å dominate the contribution.
Electron flow from the surface:
where λ(E) is the mean free path,and N0 the flow of electrons fromthe depth z in the material.
/ ( )0
z EN N e λ−=
Consequence: Electrons from the outermost atomic layers dominate the spectrum, so that ESCA/XPS is an extremely surface sensitive method.
Angular dependence
When the sample is rotated(with source and detector fixed)the effective sampling depthvaries as cos θ.
hν
λ
e-
Bulk sensitive geometry; θ = 90°
hνλ
e-
Surface sensitive geometry; θ = 10°
λ

Molecular
orientation
S2p
≈ 164 & 165 eV
S-Au ≈ 162,5 eVS S-S-S
? S
S
S-Au
Liedberg, J. Phys. Chem. B, 101, 5961 (1997)
S 2p3/2
S 2p1/2
Survey spectrum of HS-(CH2)11-T3-H on goldobtained at a take-off angle (TOA) of 90°
Different ratios of S(Au) and S(T) peaksat 10 and 90° indicate upright conformationof the molecule!
Additional data
Cyclic voltammetric current response vs potential for HS-(CH2)11-T3-H/Au and bare Au electrodes in 1mM K3Fe(CN)6in 0.1 M KNO3 solution at pH 7.0. The scan rate is 100 mV/s.
Evolution of the C-H stretching peaks for HS-(CH2)11-T3-H on gold in the 2800-3100 cm-1 region as a function of substratetemperature (27-175 °C).
Disordering of the alkyl chains at 175 °C.
Molecular orientation – conclusions
α = (±)14°
β = 33°
Liedberg, J. Phys. Chem. B, 101, 5961 (1997)
Surface plasmon resonance (SPR)
Biacore 3000(now part of GE Healthcare)
SPR instruments are used to characterize affinity and kinetics of biomolecular interactions, such as protein-protein binding.

What is a surface plasmon?
An electromagnetic excitation confined to, and propagating along, the interface between a metal and a dielectric.
~45 nm gold film(semitransparent)
k||
k┴
Excitation, λ
θ
θ is greater than the critical angle → total internal reflectionHowever, excitation of surface plasmons reduces the reflected intensity for certain wavevectors k||, i.e. [λ, θ ] combinations.
Water
Gold
Glass
Only p-polarized light will excite surface plasmons!
m dsp
m d
kc
ε εωε ε
⋅=+
Surface plasmon resonance
Set up the system with [λ, θ ] such that excitation of surface plasmons is maximized (and reflection minimized).
Adsorption changes the resonance condition ⇒ change in SPR angle, wavelength or intensity.
(Pictures from Olle Andersson’s PhD thesis)
The ’Kretschmann configuration’
For excitation of surface plasmons withTM-polarized light. Resonance condition:
2sin Rep spn k
π φλ
=
SPR for surface analysis
Probe depth:Into dielectric: 100-300 nmInto metal: 1-10 nm
Propagation length:Lsp : 1-30 µm
Adsorption to the surface changes the refractive index, andthe refractive index change causes a shift in reflectivity:
analyte
nn c
c
∂∆ = ∆∂
Adsorption, or binding to ligandson the surface, can be measured accurately!

Hydrogel Biochip Technology(Carboxylated)
Dextran Hydrogel~200 nm thick
LinkerC16OH SAM
Gold film (~50nm)Glass slide
Recognition molecule
• Low level of non-specific binding.
• With the hydrogel more recognition molecules can bebound per unit area (”area enlargement”; 2D → 3D).
Johnsson et al., Anal. Biochem. 198, 268 (1991).
Screening for protein resistant SAMs
Electrochemical surface analysis
e-
Red Ox
Red Ox
�
Cyclic Voltammetry
Reaction atdefects!
e-
i/µA*cm-2
+
-
-60
-40
-20
0
20
40
60
-0.4 -0.2 0 0.2 0.4 0.6
E/V vs. Ag/AgCl
Pure AuHS-(CH2)15-COOH
Electrochemical studies of
nanoporous SAMsThiocholesterol
(TC)Mercapto undecanoic acid
(MUA)

CV in K3Fe(CN)6Bare goldelectrodes
Mixed SAMs fordifferent TCsolution fractions
100% TC
100% MUA100 mM KNO3,1 mM K3Fe(CN)6,pH 7, Scan rate 100 mV/s.
Behaviour characteristic of masstransfer limited reactions atultramicroelectrodes (differentdiffusion characteristics).
Behaviour characteristic oftunneling through the film.
Planar vs microelectrodes
Saturation due to masstransport limitations willdepend on the geometryof the electrodes!
Evidence of ”nanoporosity”IRAS characterization
Filled symbols: incubation of TC SAMs in solution of 5 µM MUA + 100 µM TC.
Open symbols: incubation of TC SAMs in solution of 100 µM MUA only.
TC area fractions
MUA area fractions
MDUA = perdeuterated MUA, to separateC-H stretch vibrations in MUA and TC!
The order of formation is important! Compare TC+MDUA vs MDUA+TC
C-H stretchC-D stretch
CV in HClO4Integratedreductionpeak area
Mixed SAMs,different TCfractions
100% TC
30% TC
1 M HClO4, pH 7, Scan rate 100 mV/s.
10% TC0% TC
Gold oxidationGold reduction
Inert electrolyte to probe thestability of the surfaces.