Embed Size (px)
Citation preview

Overview Summary of Future Grid Analysis Proposals
August 4, 2020 NEPOOL Markets and Reliability Committee Meeting
DAY PITNEY LLP
02020 Day Pitney LLP © 2020 Day Pitney LLP
Overview Summary of Future Grid Analysis Proposals
August 4, 2020 NEPOOL Markets and Reliability Committee Meeting
Overview
■ This presentation provides a summary of the nine Future Grid Analysis Proposals received and their key features.
■ We have reserved our high level observations until committee members have had more of a chance to review the proposals.
■ The contents of this presentation are intended to provide a one-stop shop for the substance of the proposals and to enable easier comparing and contrasting of the proposals.
■ In most cases, the summaries are not verbatim due to space constraints on the slides but are intended to portray accurately all of the key features of the proposals. The proponents reviewed the summaries of their respective proposals, and we have included any edits from them.
■ This presentation should help assist in the further refinement and consolidation of the proposals.
Page 2 17/3172020 I Summary of Analysis Proposal Form Submissions ®DAY PITNEY LLP Page 2 | 7/31/2020 | Summary of Analysis Proposal Form Submissions
This presentation provides a summary of the nine Future Grid Analysis Proposals received and their key features.
We have reserved our high level observations until committee members have had more of a chance to review the proposals.
The contents of this presentation are intended to provide a one-stop shop for the substance of the proposals and to enable easier comparing and contrasting of the proposals.
In most cases, the summaries are not verbatim due to space constraints on the slides but are intended to portray accurately all of the key features of the proposals. The proponents reviewed the summaries of their respective proposals, and we have included any edits from them.
This presentation should help assist in the further refinement and consolidation of the proposals.
Overview
Proposals Submitted
■ American Petroleum Institute ("API") ■ Anbaric Development Partners ■ Energy Market Advisors ("EMA") on behalf of multiple public power
entities. ■ Eversource Energy ■ FirstLight Power Management (only provided suggestions to Base Case
Input Assumptions) ■ Multi-Sector Group A (Acadia Center, Advanced Energy Economy,
Brookfield Renewables, Conservation Law Foundation, Energy New England, Natural Resource Defense Council, and PowerOptions)
■ Multi-Sector Group B (Advanced Energy Economy, Borrego Solar, Conservation Law Foundation, Energy New England, ENGIE, Natural Resources Defense Council, Power Options)
■ National Grid ■ NextEra Energy and Dominion Energy To access the forms, please click here.
Page 3 17/31/2020 I Summary of Analysis Proposal Form Submissions Nil DAY PITNEY LLP Page 3 | 7/31/2020 | Summary of Analysis Proposal Form Submissions
Proposals Submitted
American Petroleum Institute (“API”)
Anbaric Development Partners
Energy Market Advisors (“EMA”) on behalf of multiple public power entities.
Eversource Energy
FirstLight Power Management (only provided suggestions to Base Case Input Assumptions)
Multi-Sector Group A (Acadia Center, Advanced Energy Economy, Brookfield Renewables, Conservation Law Foundation, Energy New England, Natural Resource Defense Council, and PowerOptions)
Multi-Sector Group B (Advanced Energy Economy, Borrego Solar, Conservation Law Foundation, Energy New England, ENGIE, Natural Resources Defense Council, Power Options)
National Grid
NextEra Energy and Dominion Energy To access the forms, please click here.

Summaries of Proposals ■ The following slides summarize the following information from each
proposal ■ Request Details
■ Objective ■ Base Case Description ■ Additional Scenarios ■ Associated Prior/Ongoing Study
■ Outputs and Deliverables ■ Metrics to Develop and Examine ■ Deliverable(s)
■ Proposal Technical Summary ■ Analysis Type ■ Proposed Modeling Tool(s) ■ Proposed Modeling Approach
Page 4 I 713112020 I Summary of Analysis Proposal Form Submissions In DAY PITNEY LLP Page 4 | 7/31/2020 | Summary of Analysis Proposal Form Submissions
The following slides summarize the following information from each proposal
Request Details Objective Base Case Description Additional Scenarios Associated Prior/Ongoing Study
Outputs and Deliverables Metrics to Develop and Examine Deliverable(s)
Proposal Technical Summary Analysis Type Proposed Modeling Tool(s) Proposed Modeling Approach
Summaries of Proposals

API Objective: How will the future grid in New England balance policy goals with other reliability, affordability, and energy access objectives Base Case: An evaluation that assumes typical load using most current assumptions for regional natural gas and renewable costs. Use AEO 2020 Reference Case prices for natural gas prices; if necessary, could use a backward-looking weighted average differential from Henry Hub to Algonquin. Use EIAAEO 2020 LCOE cost components for new builds. No extensions to PTC or ITC tax credits and no changes to planned phasedowns Addition Scenarios: Assume no constraints on building new economic natural gas infrastructure Other Studies: Over the past decade there have been several studies and reports released by the ISO that show that natural gas infrastructure can further economic and reliability objectives in the region
Metrics to Develop: Regional demand projections (including seasonal variations), wholesale power prices, technology cost assumptions, reserve margins, commodity cost assumptions, power generation fleet assumptions, consumer expenditures in the region (via BLS CEX), state-level expenditures by energy source (via EIASEDS), and emissions factors (via EIA monthly or annual figures) to understand people's willingness to continue paying relatively high rates on gas and electricity, how much states may be saving almady by incorporating more gas and less coal/liquids/wood into the electricity mix, how incorporating more gas into the mix has already brought power sector and total emissions down in the region overall. Deliverables: Modeled output and corresponding report provide insight into energy transition pathways for ISO-NE, reflective of state policy goals and technological innovation and feasibility. The report should specify how ISO-NE plans to achieve its objectives for reliability and ratepayer protection, while increasing its integration of variable energy resources.
Analysis Type: Regional supply/demand projections, engineering/feasibility analysis of generation technologies, hourly power dispatch projections Modeling Tool: No preference
Page 5 17/31/2020 I Summary of Analysis Proposal Form Submissions NI DAY PITNEY LLP Page 5 | 7/31/2020 | Summary of Analysis Proposal Form Submissions
Objective: How will the future grid in New England balance policy goals with other reliability, affordability, and energy access objectives Base Case: An evaluation that assumes typical load using most current assumptions for regional natural gas and renewable costs. Use AEO 2020 Reference Case prices for natural gas prices; if necessary, could use a backward-looking weighted average differential from Henry Hub to Algonquin. Use EIA AEO 2020 LCOE cost components for new builds. No extensions to PTC or ITC tax credits and no changes to planned phasedownsAddition Scenarios: Assume no constraints on building new economic natural gas infrastructureOther Studies: Over the past decade there have been several studies and reports released by the ISO that show that natural gas infrastructure can further economic and reliability objectives in the region
Metrics to Develop: Regional demand projections (including seasonal variations), wholesale power prices, technology cost assumptions, reserve margins, commodity cost assumptions, power generation fleet assumptions, consumer expenditures in the region (via BLS CEX), state-level expenditures by energy source (via EIA SEDS), and emissions factors (via EIA monthly or annual figures) to understand people’s willingness to continue paying relatively high rates on gas and electricity, how much states may be saving already by incorporating more gas and less coal/liquids/wood into the electricity mix, how incorporating more gas into the mix has already brought power sector and total emissions down in the region overall.Deliverables: Modeled output and corresponding report provide insight into energy transition pathways for ISO-NE, reflective of state policy goals and technological innovation and feasibility. The report should specify how ISO-NE plans to achieve its objectives for reliability and ratepayer protection, while increasing its integration of variable energy resources.
Analysis Type: Regional supply/demand projections, engineering/feasibility analysis of generation technologies, hourly power dispatch projectionsModeling Tool: No preference
API

Anbaric Objective: Identify an onshore and offshore Grid of the Future blueprint for a power system that is carbon free by 2035, inline with the Joe Biden July 2020 energy plan and build upon Other Studies Base Case: Current grid within the planning horizon Additional Scenarios: Scenarios will be levels of storage, PV, and on-shore and off-shore wind needed to enable a carbon-free New England grid by 2035; sensitivities would also include varying_ levels of nuclear and electrification in-line with the Brattle Sept. 2019 study, adjusted to meet a 2035 target Other Studies: ISO-NE's 2019 Economic Study Offshore Wind Transmission Interconnection Analysis; 2020 BrattlelGE/CHA study; Sept. 2019 study regarding system needs to meet MA's 2050 goals
Metrics to Develop: Informed by the Other Studies and should develop a picture of what is needed in terms of design and supply on that grid to meet the 2035 Biden zero carbon energy plan Deliverables: An overview of the best ways (cost effective, fewer cables/lower environmental impact, maximize existing grid, provide resiliency, reliability, and controllability for system operators) to develop the transmission system to interconnect offshore wind, PV, battery storage, onshore wind and other distributed or zero carbon resources; resulting document would be a blueprint for a Grid of the Future (onshore and offshore) reflecting what transmission and resources need to be constructed to meet the Biden 2035 zero carbon energy system target while providing reliable electrical service; an output will build upon Brattle and other work to realistically identify the level and location of storage needed for a zero carbon power system that is in-line with the Biden energy plan target and provides the capabilities to meet electric system needs for ramping, intermittent power changes, and contingencies.
Analysis Type: Power Syysstems Analysis Modeling Tool: Steady-State Power Flow (PSS/E, TARA, PowerWorld, PSATNSAT, etc.)
Page 6 17/31/2020 I Summary of Analysis Proposal Form Submissions Is DAY PITNEY LLP Page 6 | 7/31/2020 | Summary of Analysis Proposal Form Submissions
Objective: Identify an onshore and offshore Grid of the Future blueprint for a power system that is carbon free by 2035, inline with the Joe Biden July 2020 energy plan and build upon Other StudiesBase Case: Current grid within the planning horizonAdditional Scenarios: Scenarios will be levels of storage, PV, and on-shore and off-shore wind needed to enable a carbon-free New England grid by 2035; sensitivities would also include varying levels of nuclear and electrification in-line with the Brattle Sept. 2019 study, adjusted to meet a 2035 targetOther Studies: ISO-NE’s 2019 Economic Study Offshore Wind Transmission Interconnection Analysis; 2020 Brattle/GE/CHA study; Sept. 2019 study regarding system needs to meet MA’s 2050 goals
Metrics to Develop: Informed by the Other Studies and should develop a picture of what is needed in terms of design and supply on that grid to meet the 2035 Biden zero carbon energy planDeliverables: An overview of the best ways (cost effective, fewer cables/lower environmental impact, maximize existing grid, provide resiliency, reliability, and controllability for system operators) to develop the transmission system to interconnect offshore wind, PV, battery storage, onshore wind and other distributed or zero carbon resources; resulting document would be a blueprint for a Grid of the Future (onshore and offshore) reflecting what transmission and resources need to be constructed to meet the Biden 2035 zero carbon energy system target while providing reliable electrical service; an output will build upon Brattle and other work to realistically identify the level and location of storage needed for a zero carbon power system that is in-line with the Biden energy plan target and provides the capabilities to meet electric system needs for ramping, intermittent power changes, and contingencies.
Analysis Type: Power Systems AnalysisModeling Tool: Steady-State Power Flow (PSS/E, TARA, PowerWorld, PSAT/VSAT, etc.)
Anbaric

EMA Objective: Provide information about implications of the two interconnection options defined in the Tariff available to new resources to address State policy objectives Base Case: Not defined Additional Scenarios: Two Condition Interconnection Cases would be applied to whatever base case is used: • Capacity Interconnection Case: New resources added to address State
energy/environmental policies and interconnected based on the Capacity Network Resource Interconnection Service (CNRIS) standard; participate in the Capacity, Energy, and Ancillary Service markets, as applicable
• Minimum Interconnection Case: New resources added to address State energy/environmental policies and interconnected based on the Network Resource Interconnection Service (NRIS) standard; participate in the Energy and Ancillary Service markets as applicable but not in the Capacity market
Metrics to Develop: NESCOE 2019 Economic Study metrics; develop FCM clearing prices under the various resource mix configurations Deliverable: Similar to NESCOE 2019 Economic Study plus forecasted FCM prices, revenues, and costs
Modeling Approach: NESCOE 2019 Economic Study's approach to evaluate market and system operation impacts; need to develop an FCM pricing model to evaluate FCM prices, revenues, and costs
Page 7 17/31/2020 I Summary of Analysis Proposal Form Submissions NI DAY PITNEY LLP Page 7 | 7/31/2020 | Summary of Analysis Proposal Form Submissions
EMAObjective: Provide information about implications of the two interconnection options defined in the Tariff available to new resources to address State policy objectivesBase Case: Not definedAdditional Scenarios: Two Condition Interconnection Cases would be applied to whatever base case is used: Capacity Interconnection Case: New resources added to address State
energy/environmental policies and interconnected based on the Capacity Network Resource Interconnection Service (CNRIS) standard; participate in the Capacity, Energy, and Ancillary Service markets, as applicable
Minimum Interconnection Case: New resources added to address State energy/environmental policies and interconnected based on the Network Resource Interconnection Service (NRIS) standard; participate in the Energy and Ancillary Service markets as applicable but not in the Capacity market
Metrics to Develop: NESCOE 2019 Economic Study metrics; develop FCM clearing prices under the various resource mix configurationsDeliverable: Similar to NESCOE 2019 Economic Study plus forecasted FCM prices, revenues, and costs
Modeling Approach: NESCOE 2019 Economic Study’s approach to evaluate market and system operation impacts; need to develop an FCM pricing model to evaluate FCM prices, revenues, and costs

Eversource 1 Objective: For each case, provide LOLE, other related reliability metrics, market prices, total cost to load, a narrative of how the supply mix could potentially develop under current market rules and a qualitative assessment of how likely it is for such a supply mix is to develop Base Case: Consistent with the current system, e.g., loads from 2020 CELT & existing capacity • Supply Mix t Mixed Portfolio to meet 80% economy-wide emission reduction by 2050 state goals • Supply Mix 2: High Offshore Wind Portfolio to meet 80% economy-wide emission reduction by 2050 state
goals • Supply Mix 3 High Solar Portfolio to meet 80% economy-wide emission reduction by 2050 state goals
Additional Scenarios: • Scenario A: Assume all resources participate in capacity market under current capacity market rules • Scenario B: Assume no renewable resources obtain CSOs in the capacity market
Other Studies: Eversource Grid of the Future Study
Metrics to Develop: LOLE based on initial supply mix, emissions from initial supply mix, total cost of supply, clearing prices and total cost to load Deliverable: Report out all modeling metrics (LOLE, emissions, total cost of supply, clearing prices and total cost to load); a qualitative assessment of how each supply mix provided in the Supply Resource Mix Base Case Input Assumptions could develop under current or proposed market rules
Analysis Type: Power Systems Analysis & Market Analysis Modeling Tools: Resource Adequacy (GE MARS, etc.) & Production Cost (e.g., Gridview) Modeling Approach: Run GE MARS to determine resource adequacy of the proposed supply mix and whatever else is needed to provide deliverables (e.g., hourly market simulations in Gridview)
Page 8 17/31/2020 I Summary of Analysis Proposal Form Submissions H DAY PITNEY LLP Page 8 | 7/31/2020 | Summary of Analysis Proposal Form Submissions
Objective: For each case, provide LOLE, other related reliability metrics, market prices, total cost to load, a narrative of how the supply mix could potentially develop under current market rules and a qualitative assessment of how likely it is for such a supply mix is to developBase Case: Consistent with the current system, e.g., loads from 2020 CELT & existing capacity Supply Mix 1: Mixed Portfolio to meet 80% economy-wide emission reduction by 2050 state goals Supply Mix 2: High Offshore Wind Portfolio to meet 80% economy-wide emission reduction by 2050 state
goals Supply Mix 3: High Solar Portfolio to meet 80% economy-wide emission reduction by 2050 state goals
Additional Scenarios: Scenario A: Assume all resources participate in capacity market under current capacity market rules Scenario B: Assume no renewable resources obtain CSOs in the capacity market
Other Studies: Eversource Grid of the Future Study
Metrics to Develop: LOLE based on initial supply mix, emissions from initial supply mix, total cost of supply, clearing prices and total cost to loadDeliverable: Report out all modeling metrics (LOLE, emissions, total cost of supply, clearing prices and total cost to load); a qualitative assessment of how each supply mix provided in the Supply Resource Mix Base Case Input Assumptions could develop under current or proposed market rules
Analysis Type: Power Systems Analysis & Market AnalysisModeling Tools: Resource Adequacy (GE MARS, etc.) & Production Cost (e.g., Gridview) Modeling Approach: Run GE MARS to determine resource adequacy of the proposed supply mix and whatever else is needed to provide deliverables (e.g., hourly market simulations in Gridview)
Eversource 1
Eversource 2 Objective: Identify total installed nameplate capacity of a future system where LOLE meets the NPCC standard of 1 day in 10 years, assuming state environmental goals are met, electrification occurs as proposed in Eversource 1, but no renewables built with out of market PPAs ever clear as new in the primary or substitution auctions; provide installed capacity by resource type. Additional Scenarios: Use the demand and electrification forecasts provided in Eversource 1 for a capacity expansion model that outputs a supply mix with adequate supply to meet decarbonization goals and resource adequacy metrics Other Studies: Demand forecast determined by Eversource's Grid of the Future Study scenarios with 80% economy-wide emissions reduction by 2050
Metrics to Develop: System installed nameplate capacity by resource, LOLE, electric sector emissions, reliability metrics
Analysis Type: Power Systems Analysis Modeling Tools: Resource Adequacy (GE MARS, etc.) Modeling Approach: Run GE MARS to determine resource adequacy of the proposed supply mix and whatever else is needed to provide deliverables
Page 9 17/31/2020 I Summary of Analysis Proposal Form Submissions NI DAY PITNEY LLP Page 9 | 7/31/2020 | Summary of Analysis Proposal Form Submissions
Eversource 2
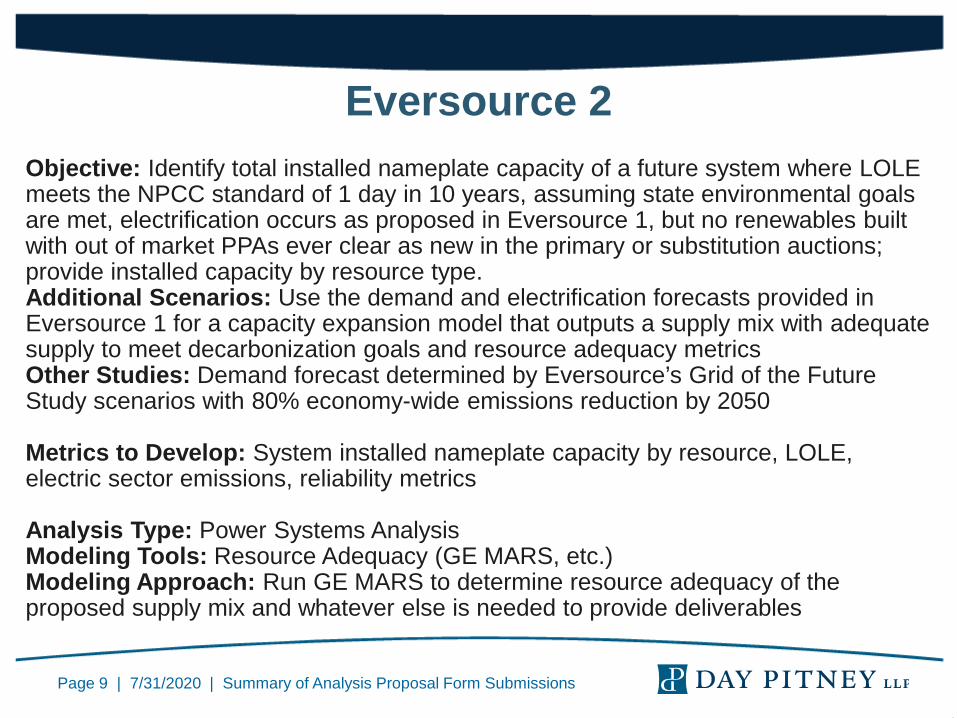
Objective: Identify total installed nameplate capacity of a future system where LOLE meets the NPCC standard of 1 day in 10 years, assuming state environmental goals are met, electrification occurs as proposed in Eversource 1, but no renewables built with out of market PPAs ever clear as new in the primary or substitution auctions; provide installed capacity by resource type. Additional Scenarios: Use the demand and electrification forecasts provided in Eversource 1 for a capacity expansion model that outputs a supply mix with adequate supply to meet decarbonization goals and resource adequacy metricsOther Studies: Demand forecast determined by Eversource’s Grid of the Future Study scenarios with 80% economy-wide emissions reduction by 2050
Metrics to Develop: System installed nameplate capacity by resource, LOLE, electric sector emissions, reliability metrics
Analysis Type: Power Systems AnalysisModeling Tools: Resource Adequacy (GE MARS, etc.)Modeling Approach: Run GE MARS to determine resource adequacy of the proposed supply mix and whatever else is needed to provide deliverables

FirstLight
Supply Resource Mix: In order to avoid understating the potential future reliability service shortfalls (if any) in the existing design, the base scenarios should not assume significant new electric storage entry. ■ Instead, addition of new electric storage entry should be based on as-
modelled market prices. ■ Electric storage modelling of energy discharge/charging prices (i.e.,
generator energy offer prices and Dispatchable Asset Related Demand prices) should consider both round-trip efficiency and variable O&M costs.
Cycling Impacts on Storage: Important to model full variable O&M costs. ■ All storage cycling consumes useful life of some components but the life
of components, as well as their costs, are quite different. ■ For example, lithium battery cycling consumes battery cell life while
pumped storage cycling impacts wear on a different set of equipment.
Page 10 W31/2020 I Summary of Analysis Proposal Forth Submissions In DAY PITNEY LLB Page 10 | 7/31/2020 | Summary of Analysis Proposal Form Submissions
Supply Resource Mix: In order to avoid understating the potential future reliability service shortfalls (if any) in the existing design, the base scenarios should not assume significant new electric storage entry.
Instead, addition of new electric storage entry should be based on as-modelled market prices.
Electric storage modelling of energy discharge/charging prices (i.e., generator energy offer prices and Dispatchable Asset Related Demand prices) should consider both round-trip efficiency and variable O&M costs.
Cycling Impacts on Storage: Important to model full variable O&M costs.
All storage cycling consumes useful life of some components but the life of components, as well as their costs, are quite different.
For example, lithium battery cycling consumes battery cell life while pumped storage cycling impacts wear on a different set of equipment.
FirstLight

Multi-Sector Group A
Objective: Update and extend the 2016 PAC Economic Study on Reserves (not operating reserves) to assess the possible need of or benefit from ramping, regulation, or load-following resources as the system decarbonizes
Base Case: Reflect best information about the system in 2030 to (1) allow a comparison to the 2016 study and (2) provide a snapshot 10-years hence to identify any gaps that would require immediate attention. Similar to the 2016 study's "2030 Scenario 2 (ISO Queue)," update to reflect the current ISO queue, including off-shore wind, NECEC, planned retirements, and probable retirements from the At Risk Generator list. Updates should be made to ensure that the supply mix meets state policy goals for GHG emissions and assumptions for load should include the ISO's electrification forecast that was included in CELT 2020 for the year 2029, extrapolated out to 2030.
Page 11 17/31/202) I Summary of Analysis Proposal Form Submissions In DAY PITNEY ILP Page 11 | 7/31/2020 | Summary of Analysis Proposal Form Submissions
Multi-Sector Group A
Objective: Update and extend the 2016 PAC Economic Study on Reserves (not operating reserves) to assess the possible need of or benefit from ramping, regulation, or load-following resources as the system decarbonizes
Base Case: Reflect best information about the system in 2030 to (1) allow a comparison to the 2016 study and (2) provide a snapshot 10-years hence to identify any gaps that would require immediate attention. Similar to the 2016 study’s “2030 Scenario 2 (ISO Queue),” update to reflect the current ISO queue, including off-shore wind, NECEC, planned retirements, and probable retirements from the At Risk Generator list. Updates should be made to ensure that the supply mix meets state policy goals for GHG emissions and assumptions for load should include the ISO’s electrification forecast that was included in CELT 2020 for the year 2029, extrapolated out to 2030.

Multi-Sector Group A Additional Scenarios:
■ End State Zero Carbon Generation: Technical outputs from MA's 80-by-50 study (Central Case) for the year 2050 appears to capture a carbon-free system of this sort; the Eversource/LE 1 2040 Aggressive Decarbonization" scenario appears close to this goal
■ Mid-Point: Directional information about the system in flux. ■ Scenarios not necessarily simple interpolations between 2030 rims and end-state
rims, nor assign any particular year to this midpoint. Data from MA's 80-by-50 study (Central Case) for the year 2040 or Eversource/LE I 2040 Balanced Portfolio" capture a system in transition. Scenarios proposed because reflect technical attributes of a system in the process of decarbonizing.
■ For all scenarios, do not presuppose the date of if/when such a scenario might occur. Scenarios may require interpolation or scaling to translate the hourly data from these models into minute-level data required for the EPECS Simulator (additional analysis required, perhaps an additional interim step using a production cost model).
■ Assume 20% flexible demand is available to absorb renewable generation surplus or any needs for ramping, peak loads, etc. before fossil generation is dispatched.
■ If MA EEA 2050 Roadmap data on load and supply is available, then it appears this would meet the intent of request.
Page 12 I 7/31/2020 I Summary of Analysis Proposal Form Submissions H DAY PITNEY LLP Page 12 | 7/31/2020 | Summary of Analysis Proposal Form Submissions
Additional Scenarios: End State Zero Carbon Generation: Technical outputs from MA’s 80-by-50 study
(Central Case) for the year 2050 appears to capture a carbon-free system of this sort; the Eversource/LEI “2040 Aggressive Decarbonization” scenario appears close to this goal
Mid-Point: Directional information about the system in flux. Scenarios not necessarily simple interpolations between 2030 runs and end-state
runs, nor assign any particular year to this midpoint. Data from MA’s 80-by-50 study (Central Case) for the year 2040 or Eversource/LEI “2040 Balanced Portfolio” capture a system in transition. Scenarios proposed because reflect technical attributes of a system in the process of decarbonizing.
For all scenarios, do not presuppose the date of if/when such a scenario might occur. Scenarios may require interpolation or scaling to translate the hourly data from these models into minute-level data required for the EPECS Simulator (additional analysis required, perhaps an additional interim step using a production cost model).
Assume 20% flexible demand is available to absorb renewable generation surplus or any needs for ramping, peak loads, etc. before fossil generation is dispatched.
If MA EEA 2050 Roadmap data on load and supply is available, then it appears this would meet the intent of request.
Multi-Sector Group A

Multi-Sector Group A
Other Studies: PAC 2016 Economic Study Phase II - Regulation, Ramping, and Reserves (Amro M. Farid)
Metrics to Develop: PAC 2016 Economic Study Phase II metrics Deliverable: 2016 Economic Study Phase II deliverables: (1) simulated Operating Reserves: Load Following, Ramping and Curtailment Performance; (2) Simulated Interface & tie-line Performance; (3) Simulated Regulation Performance; (4) Simulated Balancing Performance; and (5) Time series data outputs on the most granular time-scale (e.g., 1- or 10-minute data) for each kind of assessed reserve.
Analysis Type: MarketAnalysis Modeling Tools: EPECS Simulator (Dartmouth) Modeling Approach: PAC 2016 Economic Study Phase II
Page 13 17131!2020 I Summary of Analysis Proposal Form Submissions In DAY PITNEY LLP Page 13 | 7/31/2020 | Summary of Analysis Proposal Form Submissions
Other Studies: PAC 2016 Economic Study Phase II - Regulation, Ramping, and Reserves (Amro M. Farid)
Metrics to Develop: PAC 2016 Economic Study Phase II metricsDeliverable: 2016 Economic Study Phase II deliverables: (1) simulated Operating Reserves: Load Following, Ramping and Curtailment Performance; (2) Simulated Interface & tie-line Performance; (3) Simulated Regulation Performance; (4) Simulated Balancing Performance; and (5) Time series data outputs on the most granular time-scale (e.g., 1- or 10-minute data) for each kind of assessed reserve.
Analysis Type: Market AnalysisModeling Tools: EPECS Simulator (Dartmouth)Modeling Approach: PAC 2016 Economic Study Phase II
Multi-Sector Group A

Multi-Sector Group B Objective: Develop a long-term transmission system assessment to identify the limitations in the transmission system to implementing a net zero carbon future; identify new transmission investments needed to solve any identified limitations that are potentially more economical than the upgrades that would be considering near-term transmission
•tem needs; and identify whether distribution system generation, mobile and stationary storage, increased energy efficiency, or flexible demand could reduce the need for any new transmission infrastructure. Base Case: End state Scenario: A zero-carbon generation scenario; base case would reflect best information about the system when decarboniz;3tion goals have been achieved. Requestors do not presuppose the date of iftwhen such a scenario might occur. Additional Scenarios: Mid-Point Scenario: Providing directional information about the system in flux; scenarios are not necessarily simple interpolations between 2030 runs and end-state runs nor assign any particular year to this midpoint; data from MA's 80-by-50 study (Central Case) for the year 2040 or Eversource/LEI `2040 Balanced Portfolio" capture a system in transition. Other Studies: MA 2050 Roadmap Study; Eversource/LEI `2040 Aggressive Decarbonization" scenario; 2019 NESCOE Offshore Wind Economic Study
Metrics to Develop: List of system limitations, including interface transfer limit constraints, thermal and/or voltage constraints, stability concerns (system inertia) and bottlenecks. Specifically, voltage violations on an N-0 and N-1-scale. Costs in $/bn. Deliverable: Identify potential constraints in the transmission system to accommodate the net zero carbon emissions resource mix and identify necessary transmission upgrades and additions, as well as potential non-transmission alternatives to those upgrades and additions
Analysis Type: Power Systems Analysis Modeling Tools: Steady-State_ P er Flow (PSS/E, TARA, PovverWorld, PSAT/VSAT, etc.) Modeling Approach: Transmission planning models, accounting for location of interconnection of new generation, anticipated increased load from heating and transportation electrification, whether distributed generation will interconnect at the distribution or bulk electric system level, the technology mix, retirements, etaPossibly consider similar methodology to the Needs Assessments and Cluster Studies adding new supply and demand profiles pursuant to the MA 80-by-50 study to assess voltage needs given contingencies.
Page 14 I 7/31/2020 I Summary of Analysis Proposal Form Submissions H DAY PITNEY LLP Page 14 | 7/31/2020 | Summary of Analysis Proposal Form Submissions
Objective: Develop a long-term transmission system assessment to identify the limitations in the transmission system to implementing a net zero carbon future; identify new transmission investments needed to solve any identified limitations that are potentially more economical than the upgrades that would be considering near-term transmission system needs; and identify whether distribution system generation, mobile and stationary storage, increased energy efficiency, or flexible demand could reduce the need for any new transmission infrastructure. Base Case: End-state Scenario: A zero-carbon generation scenario; base case would reflect best information about the system when decarbonization goals have been achieved. Requestors do not presuppose the date of if/when such a scenario might occur. Additional Scenarios: Mid-Point Scenario: Providing directional information about the system in flux; scenarios are not necessarily simple interpolations between 2030 runs and end-state runs nor assign any particular year to this midpoint; data from MA’s 80-by-50 study (Central Case) for the year 2040 or Eversource/LEI “2040 Balanced Portfolio” capture a system in transition. Other Studies: MA 2050 Roadmap Study; Eversource/LEI “2040 Aggressive Decarbonization” scenario; 2019 NESCOE Offshore Wind Economic Study
Metrics to Develop: List of system limitations, including interface transfer limit constraints, thermal and/or voltage constraints, stability concerns (system inertia) and bottlenecks. Specifically, voltage violations on an N-0 and N-1 scale. Costs in $/bn. Deliverable: Identify potential constraints in the transmission system to accommodate the net zero carbon emissions resource mix and identify necessary transmission upgrades and additions, as well as potential non-transmission alternatives to those upgrades and additions
Analysis Type: Power Systems AnalysisModeling Tools: Steady-State Power Flow (PSS/E, TARA, PowerWorld, PSAT/VSAT, etc.)Modeling Approach: Transmission planning models, accounting for location of interconnection of new generation, anticipated increased load from heating and transportation electrification, whether distributed generation will interconnect at the distribution or bulk electric system level, the technology mix, retirements, etc. Possibly consider similar methodology to the Needs Assessments and Cluster Studies adding new supply and demand profiles pursuant to the MA 80-by-50 study to assess voltage needs given contingencies.
Multi-Sector Group B

National Grid Objective: Determine (1) impact of bi-directional controllable transmission to external regions, in particular Quebec, on use and spillage of intermittent resources, emissions, and LMPs; (2) extent of transmission system upgrades needed for a future resource mix under a fully decarbonized economy, & (3) if (current) market outcomes under high renewable/storage penetration cases would provide revenues to cover expected capital and/or operationallmaintenance costs for resources (by resource type) Base Case: National Grid 2020 Economic Stidy's Bi-directional Transmission 1 Scenario (with Base Case Input Assumptions) Additional Scenarios: Differences in exports to Quebec and the threshold prices outlined in the 2020 Economic Study (with Base Case Input Assumptions); sensitivities increasing battery storage to 5,000 MW, as well as further retiring oil units and 50% of the natural gas-fired units Other Studies: National Grid 2020 Economic Study
Metrics to Develop: (1) National Grid 2020 Economic Study metrics; (2) detailed transmission analysis; & (3) forecasted FCA clearing prices by unit type Deliverable: (1) National Grid 2020 Economic Study Request deliverables with a more detailed transmission analysis; (2) contingency and upgrade analysis; & (3) forecasted FCA clearing prices by unit type as one revenue source when assessing if current market outcomes cover capital/expenses
Analysis Type: (1) Market Analysis; (2) Power System Analysis; and (3) Market Analysis Modeling Tools: (1) Grid View; (2) Steady-State Power Flow, and (3) FCA MCE Modeling Approach: (1) Simulate economic operation of power system chronologically-, (2) simulate the FCA for capability year 2035; & (3) simulate the FCA for capability year 2035
Page 15 I 7/31/2020 I Summary of Analysis Proposal Form Submissions H DAY PITNEY LLP Page 15 | 7/31/2020 | Summary of Analysis Proposal Form Submissions
Objective: Determine (1) impact of bi-directional controllable transmission to external regions, in particular Quebec, on use and spillage of intermittent resources, emissions, and LMPs; (2) extent of transmission system upgrades needed for a future resource mix under a fully decarbonized economy; & (3) if (current) market outcomes under high renewable/storage penetration cases would provide revenues to cover expected capital and/or operational/maintenance costs for resources (by resource type)Base Case: National Grid 2020 Economic Study’s Bi-directional Transmission 1 Scenario (with Base Case Input Assumptions)Additional Scenarios: Differences in exports to Quebec and the threshold prices outlined in the 2020 Economic Study (with Base Case Input Assumptions); sensitivities increasing battery storage to 5,000 MW, as well as further retiring oil units and 50% of the natural gas-fired unitsOther Studies: National Grid 2020 Economic Study
Metrics to Develop: (1) National Grid 2020 Economic Study metrics; (2) detailed transmission analysis; & (3) forecasted FCA clearing prices by unit typeDeliverable: (1) National Grid 2020 Economic Study Request deliverables with a more detailed transmission analysis; (2) contingency and upgrade analysis; & (3) forecasted FCA clearing prices by unit type as one revenue source when assessing if current market outcomes cover capital/expenses
Analysis Type: (1) Market Analysis; (2) Power System Analysis; and (3) Market AnalysisModeling Tools: (1) Grid View; (2) Steady-State Power Flow; and (3) FCA MCEModeling Approach: (1) Simulate economic operation of power system chronologically; (2) simulate the FCA for capability year 2035; & (3) simulate the FCA for capability year 2035
National Grid

NextEra/Dominion Objective: Determine how the loss of the Seabrook and Millstone nuclear power plants would impact or change system operations; determine how the loss of the Seabrook and Millstone nuclear power plants impacts state RPS targets and decarbonization goals; determine market outcomes under the loss of the Seabrook and Millstone nuclear power plants Base Case: Base case assumptions similar to other base cases that will be used as part of this "Transition to the Future Grid" analysis, important to keep assumptions consistent; model loss of the Seabrook and Millstone nuclear power plants in year 2030 Additional Scenarios: Loss of the Seabrook and Millstone nuclear power plants should be considered with additional scenarios requested by stakeholders, such as variants in meeting state RPS goals and/or decarbonization of the economy to reflect the impact across likely scenarios
Metrics to Develop: No preference Deliverable: No preference
Analysis Type: Production Cost Model; Primary Frequency Model; Network Reliability
Page 18 I 7/31/2020 I Summary of Analysis Proposal Form Submissions H DAY PITNEY LLP Page 16 | 7/31/2020 | Summary of Analysis Proposal Form Submissions
Objective: Determine how the loss of the Seabrook and Millstone nuclear power plants would impact or change system operations; determine how the loss of the Seabrook and Millstone nuclear power plants impacts state RPS targets and decarbonization goals; determine market outcomes under the loss of the Seabrook and Millstone nuclear power plantsBase Case: Base case assumptions similar to other base cases that will be used as part of this “Transition to the Future Grid” analysis, important to keep assumptions consistent; model loss of the Seabrook and Millstone nuclear power plants in year 2030Additional Scenarios: Loss of the Seabrook and Millstone nuclear power plants should be considered with additional scenarios requested by stakeholders, such as variants in meeting state RPS goals and/or decarbonization of the economy to reflect the impact across likely scenarios
Metrics to Develop: No preferenceDeliverable: No preference
Analysis Type: Production Cost Model; Primary Frequency Model; Network Reliability
NextEra/Dominion

Base Case Input Assumptions
■ The following slides summarize the following seven assumptions specified in each proposal:
■ Transmission Network ■ Study Year(s)/Timeframes ■ Supply Resource Mix (New and Retired) ■ Wholesale Net Load (Gross, EE, Btm PV, Utility PV) ■ Electrification Forecasts (Heating and Transportation) ■ Battery and Other Storage Additions ■ Other
Page 17 17131/2020 I Summary of Analysts Proposal Forth Submissions In DAY PITNEY LLP Page 17 | 7/31/2020 | Summary of Analysis Proposal Form Submissions
Base Case Input Assumptions
The following slides summarize the following seven assumptions specified in each proposal:
Transmission Network
Study Year(s)/Timeframes
Supply Resource Mix (New and Retired)
Wholesale Net Load (Gross, EE, Btm PV, Utility PV)
Electrification Forecasts (Heating and Transportation)
Battery and Other Storage Additions
Other

L a
Timeframe: 2020-2040
Supply Resource Mix: For all generation technologies, utilize most recent assumptions for technological cost and operational performance
Wholesale Net Load: Ensure the model requires demand be met on at least an hourly basis to most accurately reflect grid dynamics
Battery & Other Storage: Utilize recent assumptions from publicly available sources such as EIA
Page 18 I 7/31/2020 I Summary of Analysis Proposal Form Submissions H DAY PITNEY LLp Page 18 | 7/31/2020 | Summary of Analysis Proposal Form Submissions
Timeframe: 2020–2040
Supply Resource Mix: For all generation technologies, utilize most recent assumptions for technological cost and operational performance
Wholesale Net Load: Ensure the model requires demand be met on at least an hourly basis to most accurately reflect grid dynamics
Battery & Other Storage: Utilize recent assumptions from publicly available sources such as EIA
API

Anbaric
Transmission Network: Current grid as starting point that changes (retirements of fossil, additions of significant PV, storage, offshore wind, etc.) to meet 2035 zero carbon target limeframe: 2035 Supply Resource Mix:
■ Retire current fossil fuel generation fleet for 2035; replace and adjust for electrification with PV, storage, offshore wind resources, and other non-carbon resources
■ Scenario analysis is with and without Millstone Wholesale Net Load Gross and Electrification Forecasts: Brattie projections and other sources of policy target input to adjust 2035 load to account for electrification Battery & Other Storage: Significant grid scale and distributed battery storage should be assumed to help provide for ramping and system contingencies Other: Discussion regarding the type and kind of resources should help fill-in resource blanks in terms of what do the States and system operations staff want to see in the 2035 zero carbon resource mix to provide necessary reactive power, ramping capability, contingency coverage, and firm energy requirements for load. Transmission Adequacy and Reliability Assessment may be the best if only one is utilized.
Page 19 I 7/31/2020 I Summary of Analysis Proposal Form Submissions H DAY PITNEY.. Page 19 | 7/31/2020 | Summary of Analysis Proposal Form Submissions
Transmission Network: Current grid as starting point that changes (retirements of fossil, additions of significant PV, storage, offshore wind, etc.) to meet 2035 zero carbon targetTimeframe: 2035Supply Resource Mix: Retire current fossil fuel generation fleet for 2035; replace and adjust for electrification
with PV, storage, offshore wind resources, and other non-carbon resources Scenario analysis is with and without Millstone
Wholesale Net Load Gross and Electrification Forecasts: Brattle projections and other sources of policy target input to adjust 2035 load to account for electrificationBattery & Other Storage: Significant grid scale and distributed battery storage should be assumed to help provide for ramping and system contingenciesOther: Discussion regarding the type and kind of resources should help fill-in resource blanks in terms of what do the States and system operations staff want to see in the 2035 zero carbon resource mix to provide necessary reactive power, ramping capability, contingency coverage, and firm energy requirements for load. Transmission Adequacy and Reliability Assessment may be the best if only one is utilized.
Anbaric

EMA
Thinsmission Network: FCA 14 topology (but use FCA 15 if available), plus upgrades needed to interconnect new resources to meet State energy/environmental policies (evaluated by CNRIS and NRIS) and to meet reliability requirements Tlmeframe: Minimum 10 years Supply Resource Mix: Meets State energy/environmental policy objectives developed through the stakeholder process; consider using a capacity resource optimization model to identify potential resource retirements and additional new resource additions to address reliability "gaps" Wholesale Net Load: 2020 CELT forecast models; if timeframe is beyond 10 years, then extend the base forecast models, including assumptions about additional EV and ASHP penetration Other: Analytical framework rather than specific resource mix, load forecast, and commodity price assumptions. Assuming the proposed "Condition Case" structure incorporated, EMA comfortable with using the major assumptions proposed by NESCOE and other stakeholders. Develop explicit estimates of FCM prices, revenues, and costs that are typically not done in economic studies. Evaluate implications of the impact of new resources added to meet State energy/environmental policy objectives. Develop a more structured (model-based) methodology to look at likely resource retirements, as well as any other new resources that might be needed to meet resource adequacy, economic, and system operation needs.
Page 20 I 7/31/2020 I Summary of Analysis Proposal Form Submissions H DAY PITNEY LLP Page 20 | 7/31/2020 | Summary of Analysis Proposal Form Submissions
Transmission Network: FCA 14 topology (but use FCA 15 if available), plus upgrades needed to interconnect new resources to meet State energy/environmental policies (evaluated by CNRIS and NRIS) and to meet reliability requirementsTimeframe: Minimum 10 yearsSupply Resource Mix: Meets State energy/environmental policy objectives developed through the stakeholder process; consider using a capacity resource optimization model to identify potential resource retirements and additional new resource additions to address reliability “gaps”Wholesale Net Load: 2020 CELT forecast models; if timeframe is beyond 10 years, then extend the base forecast models, including assumptions about additional EV and ASHP penetrationOther: Analytical framework rather than specific resource mix, load forecast, and commodity price assumptions. Assuming the proposed “Condition Case” structure incorporated, EMA comfortable with using the major assumptions proposed by NESCOE and other stakeholders. Develop explicit estimates of FCM prices, revenues, and costs that are typically not done in economic studies. Evaluate implications of the impact of new resources added to meet State energy/environmental policy objectives. Develop a more structured (model-based) methodology to look at likely resource retirements, as well as any other new resources that might be needed to meet resource adequacy, economic, and system operation needs.
EMA

Eversource 1 Transmission Network: Existing planning transmission topology Timeframe: Base Case: 2020; Supply Mixes 1-3: 2030, 2040, and 2050 Supply Resource Mix Base Case: Existing resources are the generation fleet and demand response and EE resources as of FCA 15, plus: (i) any additional generation operating or under construction but not cleared in an FCA as of April 1, 2020; and (ii) any generation with an approved 1.3.9 and that is still in the interconnection queue as of April 1, 2020. Individual cases will model amounts of capacity and energy-only resources consistent with their respective designs, unless otherwise noted. Wholesale Net Load Base Case: 2020 CELT
Supply Resource Mix: Installed Nameplate Capacity MW (2030/2040/2050)
Supply Mix 1 Supply Mix 2 Supply Mix 3
Offshore Wind 3,134/7,934/11,998 5,630/10,126/15,000 3,314/6,000/7,998
Land-based Wind 2,803/2,803/2,803 1,303/1,303/1,303 1,738/1,738/1,738
Imports 2,149/3,149/4,149 2,149/3,149/3,149 2,149/2,149/2,149
Hydro 3,356/3,356/3,356 3,356/3,356/3,356 3,356/3,356/3,356
BTM PV 5,207/11,899/27,186 5,207/11,899/27,186 7,708/24,401/34,650
Utility PV 3,252/8,820/16,474 3,252/7,320/16,474 3,252/10,119/27,469
Gas 15,931/14,995/11,245 15,931/14,995/11,245 15,931/14,995/11,245
Coal/Oil 0/0/0 0/0/0 0/0/0
Nuclear 3,358/2,482/0 3,358/2,482/0 3,358/2,482/0
Other 1,585/1,300/1,273 1,585/1,300/1,273 1,585/1,300/1,273
Wholesale Net Load Base Supply Mixes 1-3 (2030/2040/2050)
Summer Peak Gross (MW)
Winter Peak Gross (MW)
Annual Gross (GWh)
EE Summer Peak Reduction (MW)
EE Winter Peak Reduction (MW)
EE Annual Reduction (GWh)
*All solar PV (BTM and utility scale) values are included in Supply Resource Mix assumptions
31,303/33,618/36,135
24,788/26,287/27,895
158,915/178,158/199,868
5,661/7,366/9,580
5,280/6,886/8,988
35,617/47,072/62,274
Page 21 I 7/31/2020 I Summary of Analysis Proposal Form Submissions H DAY PITNEY LLP Page 21 | 7/31/2020 | Summary of Analysis Proposal Form Submissions
Transmission Network: Existing planning transmission topologyTimeframe: Base Case: 2020; Supply Mixes 1–3: 2030, 2040, and 2050Supply Resource Mix Base Case: Existing resources are the generation fleet and demand response and EE resources as of FCA 15, plus: (i) any additional generation operating or under construction but not cleared in an FCA as of April 1, 2020; and (ii) any generation with an approved I.3.9 and that is still in the interconnection queue as of April 1, 2020. Individual cases will model amounts of capacity and energy-only resources consistent with their respective designs, unless otherwise noted.Wholesale Net Load Base Case: 2020 CELT
Eversource 1
Eversource 1 Electrification Forecasts Base Case: 2020 CELT
Electrification Forecasts Supply Mixes 1-3 (2030/2040/2050)
EV forecast (total vehicles/annual demand)
Heating forecast (annual demand from residential and commercial heat pumps)
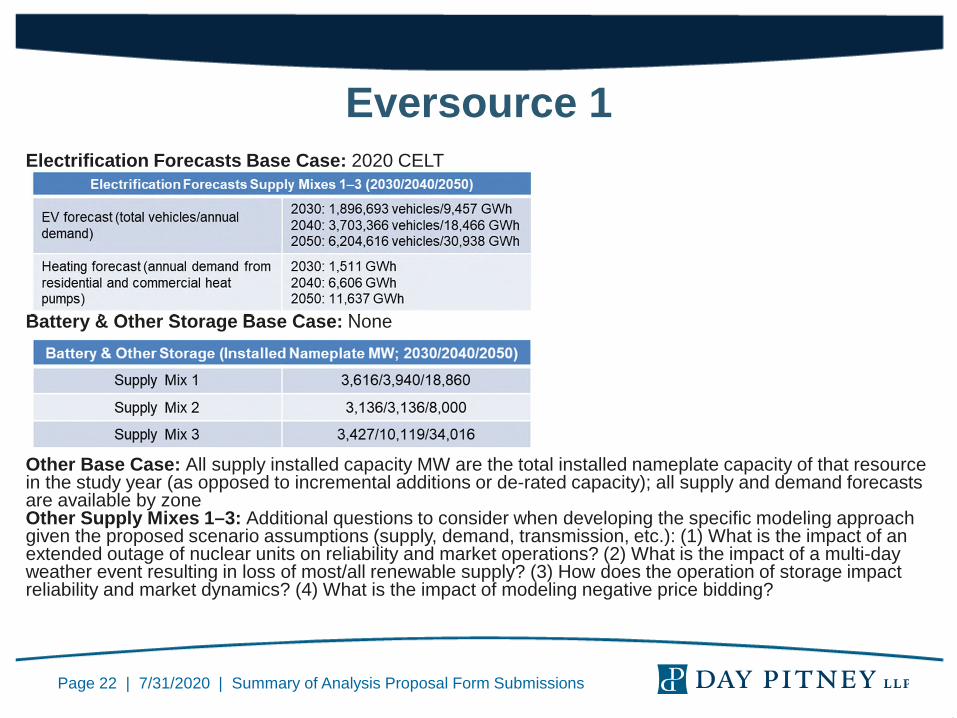
2030: 1,896,693 vehicles/9,457 GWh 2040: 3,703,366 vehicles/18,466 GWh 2050: 6,204,616 vehicles/30,938 GWh
2030: 1,511 GWh 2040: 6,606 GWh 2050: 11,637 GWh
Battery & Other Storage Base Case: None
Battery & Other Storage (Installed Nameplate MW; 2030/2040/2050)
Supply Mix 1 3,616/3,940/18,860
Supply Mix 2 3,136/3,136/8,000
Supply Mix 3 3,427/10,119/34,016
Other Base Case: All supply installed capacity MW are the total installed nameplate capacity of that resource in the study year (as opposed to incremental additions or de-rated capacity); all supply and demand forecasts are available by zone Other Supply Mixes 1-3: Additional questions to consider when developing the specific modeling approach given the proposed scenario assumptions (supply, demand, transmission, etc.): (1) What is the impact of an extended outage of nuclear units on reliability and market operations? (2) What is the impact of a multi-day weather event resulting in loss of most/all renewable supply? (3) How does the operation of storage impact reliability and market dynamics? (4) What is the impact of modeling negative price bidding?
Page 22 I 7/31/2020 I Summary of Analysis Proposal Form Submissions H DAY PITNEY LLP Page 22 | 7/31/2020 | Summary of Analysis Proposal Form Submissions
Electrification Forecasts Base Case: 2020 CELT
Battery & Other Storage Base Case: None
Other Base Case: All supply installed capacity MW are the total installed nameplate capacity of that resource in the study year (as opposed to incremental additions or de-rated capacity); all supply and demand forecasts are available by zoneOther Supply Mixes 1–3: Additional questions to consider when developing the specific modeling approach given the proposed scenario assumptions (supply, demand, transmission, etc.): (1) What is the impact of an extended outage of nuclear units on reliability and market operations? (2) What is the impact of a multi-day weather event resulting in loss of most/all renewable supply? (3) How does the operation of storage impact reliability and market dynamics? (4) What is the impact of modeling negative price bidding?
Eversource 1

Eversource 2 Transmission Network: TBD Supply Resource Mix: TBD as modeling output; installed nameplate BTM PV for demand forecast: 2030 = 5,207 MW; 2040 = 11,899 MW; 2050 = 27,186 MW
Wholesale Net Load Base Case (203012040/2050)
Summer Peak Gross (MW) 31,303/33,618/36,135
Winter Peak Gross (MW) 24,788/26,287/27,895
Annual Gross (GWh) 158,915/178,158/199,868
EE Summer Peak Reduction (MW) 5,661/7,366/9,580
EE Winter Peak Reduction (MW) 5,280/6,886/8,988
EE Annual Reduction (GWh) 35,617/47,072/62,274
Electrification Forecasts
EV forecast (total vehicles/annual demand)
Heating forecast (annual demand from residential and commercial heat pumps)
2030: 1,896,693 vehicles/9,457 GWh 2040: 3,703,366 vehicles/18,466 GWh 2050: 6,204,616 vehicles/30,938 GWh
2030: 1,511 GWh 2040: 6,606 GWh 2050: 11,637 GWh
Battery & Other Storage: TBD as modeling output
Page 23 I 7/31/2020 I Summary of Analysis Proposal Form Submissions H DAY PITNEY LLP Page 23 | 7/31/2020 | Summary of Analysis Proposal Form Submissions
Eversource 2Transmission Network: TBDSupply Resource Mix: TBD as modeling output; installed nameplate BTM PV for demand forecast: 2030 = 5,207 MW; 2040 = 11,899 MW; 2050 = 27,186 MW
Battery & Other Storage: TBD as modeling output

Multi-Sector Group A
Transmission Network: NESCOE 2019 Economic Study (Report Figure 5.1), unless meaningful variation between proposed queue interconnection for OSW and the 2019 Study assumptions. Timeframe: Note that these nominal years are indicative only as an end state and a mid-point. With that caveat, 2030 (Base Case), 2050 (End State), and 2040 (Mid-Point) Supply Resource Mi:c Base Case: Existing resources will be the generation fleet and DR as of FCA 15, less At Risk resources, plus EE forecast, additional renewables, proportional to existing + queue required to meet the state RPS requirements (should the queue be insufficient). Assume battery energy storage fills in any shortfall. Wholesale Net Load: Base Case, End State, and Mid-Point cases per Mass EEA data, if available; additional scenario assumes at least 20% of demand is flexible to absorb surplus or reduce demand Electrification Forecasts: Per Mass EEA data, if available Battery & Other Storage: At a minimum: Base Case (2030): 4 GW/8 GWh; End State (2050): 20 GW/80 GWh; Mid-Point (2040): 10 GW/30 GWh Other: When adding bulk enemy storage to avoid shortfalls, location will first be assumed to be at the location of retired units and then at the Hub. When adding renewable/clean energy resources, their locations will be at locations consistent with resources in the current interconnection queue as of July 1, 2020 with the same relative proportion of MW at those locations (Le., first include generation in the current queue and then add generation, if needed, proportionally based on current locations of generation in the queue); except that Offshore wind resources will be added at the ISO interconnection points closest to federally-designated Wind Energy Areas. Should there be an energy shortfall, work with stakeholders to specify and locate gas-fired generation resources (retain existing units). Resource capital and operating costs should decline with currently avai►able trends or forecasts. Fuel price forecasts will come from the EIA data for New England. The impact of alternative fuel prices can be determined exogenously unless they affect the dispatch order of resources. Use high and low fuel price sensitivities to determine effect on dispatch order. After initial runs are done, determine if any fine tuning of EIA prices should be done to recognize seasonal price or basis differentials. Further discussion with stakeholders on how to model imports. Assume prices for RGGI allowances and prices for other environmental emission allowances. Specific assumptions of prices will be developed through further discussion with stakeholders and determine if there is a need to create sensitivities for high and low emissions prices.
Page 24 I 7/31/2020 I Summary of Analysis Proposal Form Submissions H DAY PITNEY LLP Page 24 | 7/31/2020 | Summary of Analysis Proposal Form Submissions
Multi-Sector Group A
Transmission Network: NESCOE 2019 Economic Study (Report Figure 5.1), unless meaningful variation between proposed queue interconnection for OSW and the 2019 Study assumptions. Timeframe: Note that these nominal years are indicative only as an end state and a mid-point. With that caveat, 2030 (Base Case), 2050 (End State), and 2040 (Mid-Point)Supply Resource Mix: Base Case: Existing resources will be the generation fleet and DR as of FCA 15, less At Risk resources, plus EE forecast, additional renewables, proportional to existing + queue required to meet the state RPS requirements (should the queue be insufficient). Assume battery energy storage fills in any shortfall. Wholesale Net Load: Base Case, End State, and Mid-Point cases per Mass EEA data, if available; additional scenario assumes at least 20% of demand is flexible to absorb surplus or reduce demandElectrification Forecasts: Per Mass EEA data, if availableBattery & Other Storage: At a minimum: Base Case (2030): 4 GW/8 GWh; End State (2050): 20 GW/80 GWh; Mid-Point (2040): 10 GW/30 GWhOther: When adding bulk energy storage to avoid shortfalls, location will first be assumed to be at the location of retired units and then at the Hub. When adding renewable/clean energy resources, their locations will be at locations consistent with resources in the current interconnection queue as of July 1, 2020 with the same relative proportion of MW at those locations (i.e., first include generation in the current queue and then add generation, if needed, proportionally based on current locations of generation in the queue); except that Offshore wind resources will be added at the ISO interconnection points closest to federally-designated Wind Energy Areas. Should there be an energy shortfall, work with stakeholders to specify and locate gas-fired generation resources (retain existing units). Resource capital and operating costs should decline with currently available trends or forecasts. Fuel price forecasts will come from the EIA data for New England. The impact of alternative fuel prices can be determined exogenously unless they affect the dispatch order of resources. Use high and low fuel price sensitivities to determine effect on dispatch order. After initial runs are done, determine if any fine tuning of EIA prices should be done to recognize seasonal price or basis differentials. Further discussion with stakeholders on how to model imports. Assume prices for RGGI allowances and prices for other environmental emission allowances. Specific assumptions of prices will be developed through further discussion with stakeholders and determine if there is a need to create sensitivities for high and low emissions prices.

Multi-Sector Group B
Transmission Network: NESCOE 2019 Economic Study (Report Figure 5.1), unless there is meaningful variation between proposed queue interconnection for OSW and the 2019 Study assumptions. To the extent the model finds this inadequate, note the gap and assume sufficient transmission to serve load Timeframe: Any future year where the New England states achieve their carbon reduction goals or net zero carbon by 2050 Supply Resource Mix: Resource mix needed to achieve net zero carbon emissions per technical outputs of the MA 2050 Roadmap Study or the Eversource/LEI "2040 Aggressive Decarbonization" scenario Wholesale Net Load & Electrification Forecasts: MA 2050 Roadmap Study Battery & Other Storage: At a minimum for net zero carbon: 20 GW/80 GWh Other: Sensitivities should assess the role of non-transmission alternatives in reducing the need for new transmission infrastructure; sensitivities should assess the role of optimized DER deployment, mobile storage with managed charging, increased energy efficiency, and flexible demand in reducing bulk transmission needs to achieve state goals; sensitivities should also consider the role of grid-enhancing technologies (e.g., dynamic line rating) in reducing the need for new transmission infrastructure
Page 25 I 7/31/2020 I Summary of Analysis Proposal Form Submissions H DAY PITNEY LLP Page 25 | 7/31/2020 | Summary of Analysis Proposal Form Submissions
Transmission Network: NESCOE 2019 Economic Study (Report Figure 5.1), unless there is meaningful variation between proposed queue interconnection for OSW and the 2019 Study assumptions. To the extent the model finds this inadequate, note the gap and assume sufficient transmission to serve loadTimeframe: Any future year where the New England states achieve their carbon reduction goals or net zero carbon by 2050Supply Resource Mix: Resource mix needed to achieve net zero carbon emissions per technical outputs of the MA 2050 Roadmap Study or the Eversource/LEI “2040 Aggressive Decarbonization” scenarioWholesale Net Load & Electrification Forecasts: MA 2050 Roadmap StudyBattery & Other Storage: At a minimum for net zero carbon: 20 GW/80 GWhOther: Sensitivities should assess the role of non-transmission alternatives in reducing the need for new transmission infrastructure; sensitivities should assess the role of optimized DER deployment, mobile storage with managed charging, increased energy efficiency, and flexible demand in reducing bulk transmission needs to achieve state goals; sensitivities should also consider the role of grid-enhancing technologies (e.g., dynamic line rating) in reducing the need for new transmission infrastructure
Multi-Sector Group B

National Grid Transmission Network: Topology used in FCA 14, plus upgrades associated with resources that cleared in FCA 14 and any proposed or planned reliability projects on ISO-NE's March 2020 RSP Project List; increase of the Surowiec-South interface limit to 2,500 MW; addition of a bi-directionally capable controllable (DC) line 1,200 MW with Quebec; export capability over PHII and NB ties of 1,200 MW and 550 MW, respectively ilmeframe: 2035 Supply Resource Mix: FCA 14 retirements (Mystic 8 & 9, Millstone 2, NE Coal, and 75% of conventional NE oil including dual-fuel based on performance); to meet state policies (about 62% RPS as a region) include 1,330 MW onshore wind, 8,000 MW offshore wind, 5,400 MW BTM PV, and 6,400 MW utility-scale PV Wholesale Net Load: 2035 values for gross demand and EE are extrapolated from 2020 CELT Forecast (33,112 MW peak demand; 177,762 GWh annual energy; 6,777 MW for EE capacity; and 36,030 GWh for EE energy) Electrification Forecasts: Heating Pump Peak Demand: 5,214 MW; EV Peak Demand: 1,817 MW Battery & Other Storage: 2,000 MW Other: Use REC-inspired threshold prices (some resources at negative prices) to initiate exports and order spillage appropriately; fuel price forecasts will come from the 2020 EIAAnnual Energy Outlook for New England; emissions allowance prices will assume as $4.00/ton for NOR, S2.00/ton for SO2 and S33.52/ton for CO2
Page 28 I 7/31/2020 I Summary of Analysis Proposal Form Submissions H DAY PITNEY LLP Page 26 | 7/31/2020 | Summary of Analysis Proposal Form Submissions
Transmission Network: Topology used in FCA 14, plus upgrades associated with resources that cleared in FCA 14 and any proposed or planned reliability projects on ISO-NE’s March 2020 RSP Project List; increase of the Surowiec-South interface limit to 2,500 MW; addition of a bi-directionally capable controllable (DC) line 1,200 MW with Quebec; export capability over PHII and NB ties of 1,200 MW and 550 MW, respectivelyTimeframe: 2035Supply Resource Mix: FCA 14 retirements (Mystic 8 & 9, Millstone 2, NE Coal, and 75% of conventional NE oil including dual-fuel based on performance); to meet state policies (about 62% RPS as a region) include 1,330 MW onshore wind, 8,000 MW offshore wind, 5,400 MW BTM PV, and 6,400 MW utility-scale PVWholesale Net Load: 2035 values for gross demand and EE are extrapolated from 2020 CELT Forecast (33,112 MW peak demand; 177,762 GWh annual energy; 6,777 MW for EE capacity; and 36,030 GWh for EE energy)Electrification Forecasts:Heating Pump Peak Demand: 5,214 MW; EV Peak Demand: 1,817 MWBattery & Other Storage: 2,000 MWOther: Use REC-inspired threshold prices (some resources at negative prices) to initiate exports and order spillage appropriately; fuel price forecasts will come from the 2020 EIA Annual Energy Outlook for New England; emissions allowance prices will assume as $4.00/ton for NOX, $2.00/ton for SO2 and $33.52/ton for CO2
National Grid

NextEra/Dominion
Transmission Network: No preference
Timeframe: Loss of the Seabrook and Millstone nuclear power plants in year 2030 studied for ten years until 2040
Supply Resource Mix: No preference
Wholesale Net Load: No preference
Electrification Forecasts: No preference
Battery & Other Storage: No preference
Page 27 I 7/31!2020I Summary of Analysts Proposal Forrn submissions In DAY PITNEY LLP Page 27 | 7/31/2020 | Summary of Analysis Proposal Form Submissions
Transmission Network: No preference
Timeframe: Loss of the Seabrook and Millstone nuclear power plants in year 2030 studied for ten years until 2040
Supply Resource Mix: No preference
Wholesale Net Load: No preference
Electrification Forecasts: No preference
Battery & Other Storage: No preference
NextEra/Dominion

Side-by-Side View of Key Features
■ The following slides provide a "side-by-side" view of how each proposal addresses the following features of the study.
■ Base Case Description ■ Associated Prior/Ongoing Study ■ Metrics to Develop and Examine ■ Deliverable(s) ■ Transmission Network ■ Timeframe
Page 28 I 7/31!2020I Summary of Analysts Proposal Forrn Submissions In DAY PITNEY LLP Page 28 | 7/31/2020 | Summary of Analysis Proposal Form Submissions
Side-by-Side View of Key Features
The following slides provide a “side-by-side” view of how each proposal addresses the following features of the study.
Base Case Description
Associated Prior/Ongoing Study
Metrics to Develop and Examine
Deliverable(s)
Transmission Network
Timeframe
Base Case Description
API: An evaluation that assumes typical load using most current assumptions for regional natural gas and renewable costs. Use AEO 2020 Reference Case pnces for natural gas prices; if necessary, could use a backward-looking weighted average differential from Henry Hub to Algonquin. Use EIAAEO 2020 LCOE cost components for new builds. No extensions to PTC or ITC tax credits and no changes to planned phasedowns
Anbarlc: Current grid within the planning horizon
EMA: Not defined
Eversource 1: Consistent with the current system, e.g., loads from 2020 CELT & existing capacity
■ Supply Mix 1: Mixed Portfolio to meet 80% economy-wide emission reduction by 2050 state goals
■ Supply Mix 2: High Offshore Wind Portfolio to meet 80% economy-wide emission reduction by 2050 state goals
■ Supply Mix 3: High Solar Portfolio to meet 80% economy-wide emission reduction by 2050 state goals
Page 29 I 7/31/2020 I Summary of Analysis Proposal Form Submissions H DAY PITNEY .. Page 29 | 7/31/2020 | Summary of Analysis Proposal Form Submissions
API: An evaluation that assumes typical load using most current assumptions for regional natural gas and renewable costs. Use AEO 2020 Reference Case prices for natural gas prices; if necessary, could use a backward-looking weighted average differential from Henry Hub to Algonquin. Use EIA AEO 2020 LCOE cost components for new builds. No extensions to PTC or ITC tax credits and no changes to planned phasedowns
Anbaric: Current grid within the planning horizon
EMA: Not defined
Eversource 1: Consistent with the current system, e.g., loads from 2020 CELT & existing capacity Supply Mix 1: Mixed Portfolio to meet 80% economy-wide emission reduction
by 2050 state goals Supply Mix 2: High Offshore Wind Portfolio to meet 80% economy-wide
emission reduction by 2050 state goals Supply Mix 3: High Solar Portfolio to meet 80% economy-wide emission
reduction by 2050 state goals
Base Case Description

Base Case Description
Multi-Sector Group A: Reflect best information about the system in 2030 to (1) allow a comparison to the 2016 study and (2) provide a snapshot 10-years hence to identify any gaps that would require immediate attention
Multi-Sector Group B: Base case would reflect best information about the system when decarbonization goals have been achieved. Requestors do not presuppose the date of if/when such a scenario might occur. Essentially, an "end-state" zero-carbon generation scenario
National Grid: National Grid 2020 Economic Study's Bi-directional Transmission 1 Scenario (with Base Case Input Assumptions)
NextEra/Dominion: Base case assumptions similar to other base cases that will be used as part of this "Transition to the Future Grid" analysis, important to keep assumptions consistent; model loss of the Seabrook and Millstone nuclear power plants in year 2030
Page 30 I 7/31/2020 I Summary of Analysis Proposal Form Submissions H DAY PITNEY LLp Page 30 | 7/31/2020 | Summary of Analysis Proposal Form Submissions
Multi-Sector Group A: Reflect best information about the system in 2030 to (1) allow a comparison to the 2016 study and (2) provide a snapshot 10-years hence to identify any gaps that would require immediate attention
Multi-Sector Group B: Base case would reflect best information about the system when decarbonization goals have been achieved. Requestors do not presuppose the date of if/when such a scenario might occur. Essentially, an “end-state” zero-carbon generation scenario
National Grid: National Grid 2020 Economic Study’s Bi-directional Transmission 1 Scenario (with Base Case Input Assumptions)
NextEra/Dominion: Base case assumptions similar to other base cases that will be used as part of this “Transition to the Future Grid” analysis, important to keep assumptions consistent; model loss of the Seabrook and Millstone nuclear power plants in year 2030
Base Case Description

Associated Prior/Ongoing Study API: Over the past decade there have been several studies and reports released by the ISO that show that natural gas infrastructure can further economic and reliability objectives in the region
Anbarlc: ISO-NE's 2019 Economic Study Offshore Wind Transmission Interconnection Analysis; 2020 Brattle/GE/CHA study; Sept. 2019 study regarding system needs to meet MA's 2050 goals
Eversource: Eversource Grid of the Future Study
Multi-Sector Group A: PAC 2016 Economic Study Phase II - Regulation, Ramping, and Reserves (Amro M. Farid)
Multi-Sector Group B: MA 2050 Roadmap Study; Eversource/LEI "2040 Aggressive Decarbonization" scenario; 2019 NESCOE Offshore Wind Economic Study
National Grid: National Grid 2020 Economic Study
Page 31 I 7/31/2020 I Summary of Analysis Proposal Form Submissions H DAY PITNEY .. Page 31 | 7/31/2020 | Summary of Analysis Proposal Form Submissions
API: Over the past decade there have been several studies and reports released by the ISO that show that natural gas infrastructure can further economic and reliability objectives in the region
Anbaric: ISO-NE’s 2019 Economic Study Offshore Wind Transmission Interconnection Analysis; 2020 Brattle/GE/CHA study; Sept. 2019 study regarding system needs to meet MA’s 2050 goals
Eversource: Eversource Grid of the Future Study
Multi-Sector Group A: PAC 2016 Economic Study Phase II - Regulation, Ramping, and Reserves (Amro M. Farid)
Multi-Sector Group B: MA 2050 Roadmap Study; Eversource/LEI “2040 Aggressive Decarbonization” scenario; 2019 NESCOE Offshore Wind Economic Study
National Grid: National Grid 2020 Economic Study
Associated Prior/Ongoing Study

Metrics to Develop API: Regional demand projections (including seasonal variations), wholesale power prices, technology cost assumptions, reserve margins, commodity cost assumptions, power generation fleet assumptions, consumer expenditures in the region (via BLS CEX), state-level expenditures by energy source (via EIA SEDS), and emissions factors (via EIA monthly or annual figures) to understand people's willingness to continue paying relatively high rates on gas and electricity, how much states may be saving al ma cly by incorporating more gas and less coal/liquids/wood into the electricity mix, how incorporating more gas into the mix has already brought power sector and total emissions down in the region overall.
Anbaric Informed by the Other Studies and should develop a picture of what is needed in terms of design and supply on that grid to meet the 2035 Biden zero carbon energy plan
EMA: NESCOE 2019 Economic Study metrics; develop FCM clearing prices under the various resource mix configurations
Eversource 1: LOLE based on initial supply mix, emissions from initial supply mix, total cost of supply, clearing prices and total cost to load
Eyersource 2: System installed nameplate capacity by resource, LOLE, electric sector emissions, reliability metrics
Multi-Sector Group A: PAC 2016 Economic Study Phase II metrics
Multi-Sector Group B: List of system limitations, including interface transfer limit constraints, thermal and/or voltage constraints, stability concerns (system inertia) and bottlenecle3. Specifically, voltage violations on an N-0 and N-1 scale. Costs in $/bn
National Grid: (1) National Grid 2020 Economic Study metrics; (2) detailed transmission analysis; & (3) forecasted FCA clearing prices by unit type
Page 32 I 7/31/2020 I Summary of Analysis Proposal Form Submissions H DAY PITNEY LLP Page 32 | 7/31/2020 | Summary of Analysis Proposal Form Submissions
API: Regional demand projections (including seasonal variations), wholesale power prices, technology cost assumptions, reserve margins, commodity cost assumptions, power generation fleet assumptions, consumer expenditures in the region (via BLS CEX), state-level expenditures by energy source (via EIA SEDS), and emissions factors (via EIA monthly or annual figures) to understand people’s willingness to continue paying relatively high rates on gas and electricity, how much states may be saving already by incorporating more gas and less coal/liquids/wood into the electricity mix, how incorporating more gas into the mix has already brought power sector and total emissions down in the region overall.
Anbaric: Informed by the Other Studies and should develop a picture of what is needed in terms of design and supply on that grid to meet the 2035 Biden zero carbon energy plan
EMA: NESCOE 2019 Economic Study metrics; develop FCM clearing prices under the various resource mix configurations
Eversource 1: LOLE based on initial supply mix, emissions from initial supply mix, total cost of supply, clearing prices and total cost to load
Eversource 2: System installed nameplate capacity by resource, LOLE, electric sector emissions, reliability metrics
Multi-Sector Group A: PAC 2016 Economic Study Phase II metrics
Multi-Sector Group B: List of system limitations, including interface transfer limit constraints, thermal and/or voltage constraints, stability concerns (system inertia) and bottlenecks. Specifically, voltage violations on an N-0 and N-1 scale. Costs in $/bn
National Grid: (1) National Grid 2020 Economic Study metrics; (2) detailed transmission analysis; & (3) forecasted FCA clearing prices by unit type
Metrics to Develop

Deliverables
API: Modeled output and corresponding report provide insight into energy transition pathways for ISO-NE, reflective of state policy goals and technological innovation and feasibility. The report should specify how ISO-NE plans to achieve its objectives for reliability and ratepayer protection, while increasing its integration of variable energy resources
Anbaric: An overview of the best ways (cost effective, fewer cables/lower environmental impact, maximize existing grid, provide resiliency, reliability, and controllability for system operators) to develop the transmission system to interconnect offshore wind, PV, battery storage, onshore wind and other distributed or zero carbon resources; resulting document would be a blueprint for a Grid of the Future (onshore and offshore) reflecting what transmission and resources need to be constructed to meet the Biden 2035 zero carbon energy system target while providing reliable electrical service; an output will build upon Brattle and other work to realistically identify the level and location of storage needed for a zero carbon power system that is in-line with the Biden energy plan target and provides the capabilities to meet electric system needs for ramping, intermittent power changes, and contingencies.
EMA: Similar to NESCOE 2019 Economic Study plus forecasted FCM prices, revenues, and costs
Page 33 I 7/31/2020 I Summary of Analysis Proposal Form Submissions H DAY PITNEY LLP Page 33 | 7/31/2020 | Summary of Analysis Proposal Form Submissions
API: Modeled output and corresponding report provide insight into energy transition pathways for ISO-NE, reflective of state policy goals and technological innovation and feasibility. The report should specify how ISO-NE plans to achieve its objectives for reliability and ratepayer protection, while increasing its integration of variable energy resources
Anbaric: An overview of the best ways (cost effective, fewer cables/lower environmental impact, maximize existing grid, provide resiliency, reliability, and controllability for system operators) to develop the transmission system to interconnect offshore wind, PV, battery storage, onshore wind and other distributed or zero carbon resources; resulting document would be a blueprint for a Grid of the Future (onshore and offshore) reflecting what transmission and resources need to be constructed to meet the Biden 2035 zero carbon energy system target while providing reliable electrical service; an output will build upon Brattle and other work to realistically identify the level and location of storage needed for a zero carbon power system that is in-line with the Biden energy plan target and provides the capabilities to meet electric system needs for ramping, intermittent power changes, and contingencies.
EMA: Similar to NESCOE 2019 Economic Study plus forecasted FCM prices, revenues, and costs
Deliverables

Deliverables
Eversource 1: Report out all modeling metrics (COLE, emissions, total cost of supply, clearing prices and total cost to load); a qualitative assessment of how each supply mix provided in the Supply Resource Mix Base Case Input Assumptions could develop under current or proposed market rules
Multi-Sector Group A: 2016 Economic Study Phase II deliverables: (1) simulated Operating Reserves: Load Following, Ramping and Curtailment Performance; (2) Simulated Interface & tie-line Performance; (3) Simulated Regulation Performance; (4) Simulated Balancing Performance; and (5) Time series data outputs on the most granular time-scale (e.g., 1- or 10-minute data) for each kind of assessed reserve.
Multi-Sector Group B: Identify potential constraints in the transmission system to accommodate the net zero carbon emissions resource mix and identify necessary transmission upgrades and additions, as well as potential non-transmission alternatives to those upgrades and additions
National Grid: (1) National Grid 2020 Economic Study Request deliverables with a more detailed transmission analysis; (2) contingency and upgrade analysis; & (3) forecasted FCA clearing prices by unit type as one revenue source when assessing if current market outcomes cover capital/expenses
Page 34 I 7/31/2020 I Summary of Analysis Proposal Form Submissions H DAY PITNEY LLP Page 34 | 7/31/2020 | Summary of Analysis Proposal Form Submissions
Eversource 1: Report out all modeling metrics (LOLE, emissions, total cost of supply, clearing prices and total cost to load); a qualitative assessment of how each supply mix provided in the Supply Resource Mix Base Case Input Assumptions could develop under current or proposed market rules
Multi-Sector Group A: 2016 Economic Study Phase II deliverables: (1) simulated Operating Reserves: Load Following, Ramping and Curtailment Performance; (2) Simulated Interface & tie-line Performance; (3) Simulated Regulation Performance; (4) Simulated Balancing Performance; and (5) Time series data outputs on the most granular time-scale (e.g., 1- or 10-minute data) for each kind of assessed reserve.
Multi-Sector Group B: Identify potential constraints in the transmission system to accommodate the net zero carbon emissions resource mix and identify necessary transmission upgrades and additions, as well as potential non-transmission alternatives to those upgrades and additions
National Grid: (1) National Grid 2020 Economic Study Request deliverables with a more detailed transmission analysis; (2) contingency and upgrade analysis; & (3) forecasted FCA clearing prices by unit type as one revenue source when assessing if current market outcomes cover capital/expenses
Deliverables

Transmission Network
Anbaric: Current grid as starting point that changes (retirements of fossil, additions of significant PV, storage, offshore wind, etc.) to meet 2035 zero carbon target
EMA: FCA 14 topology (but use FCA 15 if available), plus upgrades needed to interconnect new resources to meet State energy/environmental policies (evaluated by CNRIS and NRIS) and to meet reliability requirements
Eversource 1: Existing planning transmission topology
Multi-Sector Group A & Multi-Sector Group B: NESCOE 2019 Economic Study (Report Figure 5.1), unless meaningful variation between proposed queue interconnection for OSW and the 2019 Study assumptions.
National Grid: Topology used in FCA 14, plus upgrades associated with resources that cleared in FCA 14 and any proposed or planned reliability projects on ISO-NE's March 2020 RSP Project List; increase of the Surowiec-South interface limit to 2,500 MW; addition of a bi-directionally capable controllable (DC) line 1,200 MW with Quebec; export capability over PH II and NB ties of 1,200 MW and 550 MW, respectively
Page 35 I 7/31/2020 I Summary of Analysis Proposal Form Submissions H DAY PITNEY LLP Page 35 | 7/31/2020 | Summary of Analysis Proposal Form Submissions
Anbaric: Current grid as starting point that changes (retirements of fossil, additions of significant PV, storage, offshore wind, etc.) to meet 2035 zero carbon target
EMA: FCA 14 topology (but use FCA 15 if available), plus upgrades needed to interconnect new resources to meet State energy/environmental policies (evaluated by CNRIS and NRIS) and to meet reliability requirements
Eversource 1: Existing planning transmission topology
Multi-Sector Group A & Multi-Sector Group B: NESCOE 2019 Economic Study (Report Figure 5.1), unless meaningful variation between proposed queue interconnection for OSW and the 2019 Study assumptions.
National Grid: Topology used in FCA 14, plus upgrades associated with resources that cleared in FCA 14 and any proposed or planned reliability projects on ISO-NE’s March 2020 RSP Project List; increase of the Surowiec-South interface limit to 2,500 MW; addition of a bi-directionally capable controllable (DC) line 1,200 MW with Quebec; export capability over PHII and NB ties of 1,200 MW and 550 MW, respectively
Transmission Network

Timeframe
API: 2020-2040
Anbarlc: 2035
EMA: Minimum 10 years
Eversource 1: Base Case: 2020; Supply Mixes 1-3: 2030,2040, and 2050
Multi-Sector Group A: Note that these nominal years are indicative only as an end state and a mid-point. With that caveat, 2030 (Base Case), 2050 (End State), and 2040 (Mid-Point)
Multi-Sector Group B: Any future year where the New England states achieve their carbon reduction goals or net zero carbon by 2050
National Grid: 2035
NextEra/Dominion: Loss of the Seabrook and Millstone nuclear power plants in year 2030 studied for ten years until 2040
Page 36 I 7/31/2020 I Summary of Analysis Proposal Form Submissions H DAY PITNEY .. Page 36 | 7/31/2020 | Summary of Analysis Proposal Form Submissions
API: 2020–2040
Anbaric: 2035
EMA: Minimum 10 years
Eversource 1: Base Case: 2020; Supply Mixes 1–3: 2030, 2040, and 2050
Multi-Sector Group A: Note that these nominal years are indicative only as an end state and a mid-point. With that caveat, 2030 (Base Case), 2050 (End State), and 2040 (Mid-Point)
Multi-Sector Group B: Any future year where the New England states achieve their carbon reduction goals or net zero carbon by 2050
National Grid: 2035
NextEra/Dominion: Loss of the Seabrook and Millstone nuclear power plants in year 2030 studied for ten years until 2040
Timeframe