Embed Size (px)
Citation preview
Overview of the Special Needs Diversionary Program for Mentally Ill Juvenile Offenders Fiscal Year 2010
Texas Juvenile Probation Commission Vicki Spriggs, Executive Director
4900 North Lamar Boulevard, 5th Floor East
Post Office Box 13547 Austin, TX 78711
Tel 512.424.6700 Fax 512.424.6717 TDD 512.424.4000
www.tjpc.state.tx.us
December 2010
Overview of the Special Needs Diversionary Program
for Mentally Ill Juvenile Offenders Fiscal Year 2010
Texas Juvenile Probation Commission
Vicki Spriggs, Executive Director
4900 North Lamar, 5th Floor East
Post Office Box 13547
Austin, Texas 78711-3547
Telephone (512) 424-6700 / TDD (512) 424-4000
Fax (512) 424-6717
Additional copies of this and other publications
may be found on the TJPC Web Site at www.tjpc.state.tx.us
RPT-OTH-11-02
Published December 2010
The Texas Juvenile Probation Commission, an equal opportunity employer, does not discriminate on the basis of race, color,
national origin, sex, religion, age or disability in employment or the provision of services, programs or activities. In compliance
with the Americans with Disabilities Act, this document may be requested in alternative formats by contacting the Texas
Juvenile Probation Commission at the above address.
Table of Contents
Executive Summary ........................................................................................................................................ i
Background ..................................................................................................................................................... 1
Recent Changes to SNDP ............................................................................................................................ 1
Prevalence of Mentally Ill Juvenile Offenders .......................................................................................... 2
Description of SNDP ....................................................................................................................................... 5
Historical Trends of Juveniles Served in SNDP ........................................................................................... 5
Juveniles Served in SNDP in FY 2010 ........................................................................................................... 7
Mental Health History of Juveniles Served ................................................................................................ 9
Criminal History of Juveniles Served ......................................................................................................... 10
Did Juveniles Served Meet Priority Population Criteria? ....................................................................... 12
Caseload Sizes .............................................................................................................................................. 12
Contacts with the Juvenile ........................................................................................................................ 13
Mental Health Services Provided .............................................................................................................. 14
Probation Services Provided ...................................................................................................................... 15
Aftercare Services Provided ...................................................................................................................... 16
SNDP Outcomes ........................................................................................................................................... 18
Completion Rate in FY 2010 ................................................................................................................ 18
TYC Rate .................................................................................................................................................. 18
Placement Rate .................................................................................................................................... 20
Re-Offense Rate .................................................................................................................................... 21
Statistics for Individual Programs ............................................................................................................... 25

i Overview of the Special Needs Diversionary Program for Mentally Ill Juvenile Offenders, FY 2010
Executive Summary
The Special Needs Diversionary Program (SNDP) was created in 2001 to provide mental health
treatment and specialized supervision in order to rehabilitate juvenile offenders and prevent them
from penetrating further into the criminal justice system. The program is administered in a
collaborative model by TJPC and the Texas Correctional Office on Offenders with Medical and Mental
Impairments (TCOOMMI). It has now been in operation for nine years.
This report examines the prevalence of mentally ill offenders in the juvenile justice system in FY 2008,
the juveniles served and types of services provided in SNDP in FY 2010, and the outcomes of juveniles
starting SNDP in FY 2009. Highlights of this report include the following:
In FY 2008, an estimated 33% of juveniles under supervision were estimated to be mentally ill.
Of those juveniles estimated to be mentally ill only 37% received mental health services in FY
2008.
In FY 2010, SNDP served 1,400 juveniles with 19 programs that included 21 departments and 25
counties in Texas.
The most common diagnoses of juveniles participating in SNDP in FY 2010 were Attention Deficit
Hyperactivity Disorder, Oppositional Defiant Disorder, and Conduct Disorder. A total of 16%
had a dual diagnosis involving mental health and substance abuse.
73% of juveniles discharged from SNDP in FY 2010 successfully completed the program, while
76% of those starting in FY 2009 successfully completed the program.
2% of those starting SNDP in FY 2009 were sent to TYC within one year, while 17% of those
starting were sent to residential placement within one year.
42% of those starting SNDP in FY 2009 re-offended within one year.
36% of those starting SNDP in FY 2009 and successfully completing the program re-offended
within one year.
Juveniles receiving four or more mental health services while in SNDP had a 34% re-offense
rate. Juveniles receiving six or more mental health services while in SNDP had a 30% re-offense
rate.
Juveniles receiving Cognitive Behavior Therapy, Group Therapy, Psychological services, or
Individual Therapy had much lower re-offense rates (28% - 34%) than other juveniles.
Juveniles receiving Vocational or Educational/ Mentor services had much lower re-offense
rates (32% - 33%) than other juveniles.

1 Overview of the Special Needs Diversionary Program for Mentally Ill Juvenile Offenders, FY 2010
Background
tudies by the Criminal Justice Policy Council in 2001 indicated a substantial percentage of juveniles in
the criminal justice system had mental health problems and only a small portion of these juveniles were
receiving mental health services. To address this need for services, the Legislature in 2001 appropriated
$2 million in new funding to the Texas Juvenile Probation Commission (TJPC) and $5 million in new funding to
the Texas Correctional Office on Offenders with Medical and Mental Impairments (TCOOMMI) formerly
known as the Texas Commission on Offenders with Mental Impairments as a part of the Enhanced Mental
Health Services Initiative for the adult and juvenile justice systems.
The intent of this specialized funding was to provide mental health treatment and specialized supervision in
order to rehabilitate juvenile offenders and prevent them from penetrating further into the criminal justice
system. The funding lead to the creation of the Special Needs Diversionary Program (SNDP) administered in
a collaborative model by TJPC and TCOOMMI.
The program involves specialized juvenile probation officers from local juvenile probation departments and
professional mental health staff from the local mental health centers that work together to coordinate
intensive community based case management services. The program offers both mental health services
(including individual and group therapy), probation services (such as life skills, anger management, and
mentoring), and parental support and education. It also requires frequent weekly contact with the juvenile,
involvement with the family, and small specialized caseloads. SNDP began providing services in the 8
urban regions of the State September 2001 (the beginning of FY 2002) and expanded to 11 small and
medium counties in January 2002.
Recent Changes to SNDP
After examining the program a number of changes were made effective September 2009.
The maximum caseload was expanded from 15 to 20 cases.
The duration of the program was changed from 3-6 months to the duration that the clinical team
recommends based on the needs of the juvenile and family.
The number of contacts was changed from three to five per week to a minimum of one face to
face contact per week during the first 30 days in SNDP. The clinical team meets once per month to
set the type and frequency of contacts. These contacts are dependent on the needs of the youth
and family.
Case plans, transition plans, aftercare plans, and discharge plans are now required to address both
family and youth needs.
Weekly documented communications are required between TCOOMMI and SNDP officers.
S
2 Texas Juvenile Probation Commission, December 2010
Prevalence of Mentally Ill Juvenile Offenders
There is no precise way to determine the number of mentally ill juvenile offenders in the community. TJPC has,
however, developed an estimate for juveniles under deferred prosecution or probation supervision. A juvenile is
estimated to be mentally ill if they met one of the following conditions:
Had a registration date with the Texas Department of State Health Services (DSHS) prior to or within
91 days of starting supervision;
Started SNDP prior to or within 91 days of starting supervision;
Started a mental health program (not including counseling) coordinated through local juvenile
probation departments prior to or within 91 days of starting supervision;
Started a mental health placement coordinated through local juvenile probation departments prior
to or within 91 days of starting supervision;
Indicated “Yes” under mental health needs in the monthly data extract sent to TJPC.
This estimate of mental illness does not include mentally ill juveniles who have never been diagnosed; have
only received private mental health services; did not have access to the public mental health system; or
have a history of mental illness that predates records retained in the DSHS CARE computer system.
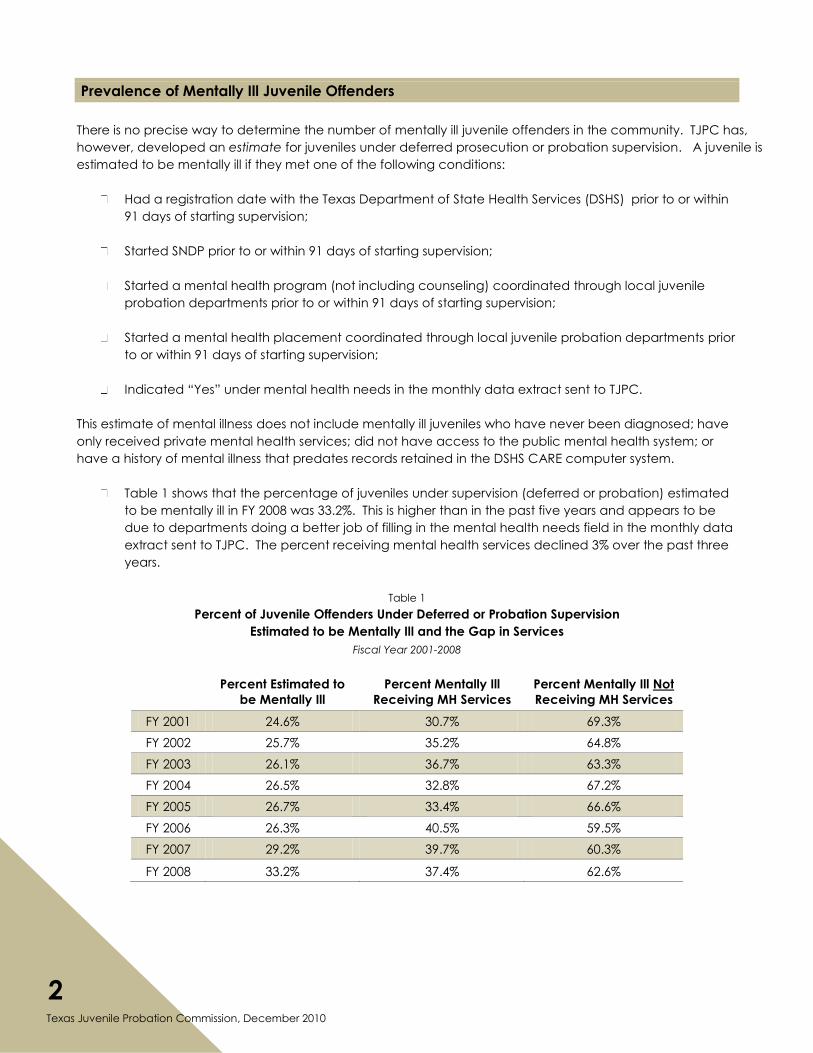
Table 1 shows that the percentage of juveniles under supervision (deferred or probation) estimated
to be mentally ill in FY 2008 was 33.2%. This is higher than in the past five years and appears to be
due to departments doing a better job of filling in the mental health needs field in the monthly data
extract sent to TJPC. The percent receiving mental health services declined 3% over the past three
years.
Table 1
Percent of Juvenile Offenders Under Deferred or Probation Supervision
Estimated to be Mentally Ill and the Gap in Services
Fiscal Year 2001-2008
Percent Estimated to
be Mentally Ill
Percent Mentally Ill
Receiving MH Services
Percent Mentally Ill Not
Receiving MH Services
FY 2001 24.6% 30.7% 69.3%
FY 2002 25.7% 35.2% 64.8%
FY 2003 26.1% 36.7% 63.3%
FY 2004 26.5% 32.8% 67.2%
FY 2005 26.7% 33.4% 66.6%
FY 2006 26.3% 40.5% 59.5%
FY 2007 29.2% 39.7% 60.3%
FY 2008 33.2% 37.4% 62.6%
3 Overview of the Special Needs Diversionary Program for Mentally Ill Juvenile Offenders, FY 2010
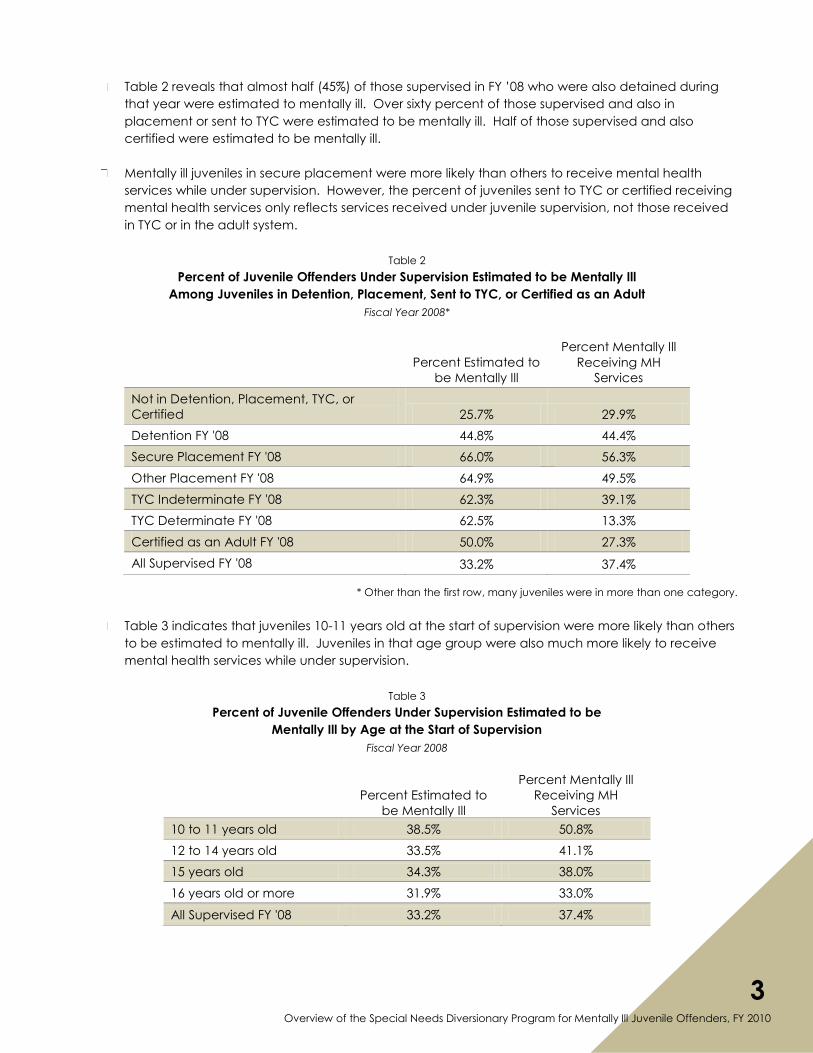
Table 2 reveals that almost half (45%) of those supervised in FY ‟08 who were also detained during
that year were estimated to mentally ill. Over sixty percent of those supervised and also in
placement or sent to TYC were estimated to be mentally ill. Half of those supervised and also
certified were estimated to be mentally ill.
Mentally ill juveniles in secure placement were more likely than others to receive mental health
services while under supervision. However, the percent of juveniles sent to TYC or certified receiving
mental health services only reflects services received under juvenile supervision, not those received
in TYC or in the adult system.
Table 2
Percent of Juvenile Offenders Under Supervision Estimated to be Mentally Ill
Among Juveniles in Detention, Placement, Sent to TYC, or Certified as an Adult
Fiscal Year 2008*
Percent Estimated to
be Mentally Ill
Percent Mentally Ill
Receiving MH
Services
Not in Detention, Placement, TYC, or
Certified 25.7% 29.9%
Detention FY '08 44.8% 44.4%
Secure Placement FY '08 66.0% 56.3%
Other Placement FY '08 64.9% 49.5%
TYC Indeterminate FY '08 62.3% 39.1%
TYC Determinate FY '08 62.5% 13.3%
Certified as an Adult FY '08 50.0% 27.3%
All Supervised FY '08 33.2% 37.4%
* Other than the first row, many juveniles were in more than one category.
Table 3 indicates that juveniles 10-11 years old at the start of supervision were more likely than others
to be estimated to mentally ill. Juveniles in that age group were also much more likely to receive
mental health services while under supervision.
Table 3
Percent of Juvenile Offenders Under Supervision Estimated to be
Mentally Ill by Age at the Start of Supervision
Fiscal Year 2008
Percent Estimated to
be Mentally Ill
Percent Mentally Ill
Receiving MH
Services
10 to 11 years old 38.5% 50.8%
12 to 14 years old 33.5% 41.1%
15 years old 34.3% 38.0%
16 years old or more 31.9% 33.0%
All Supervised FY '08 33.2% 37.4%
4 Texas Juvenile Probation Commission, December 2010
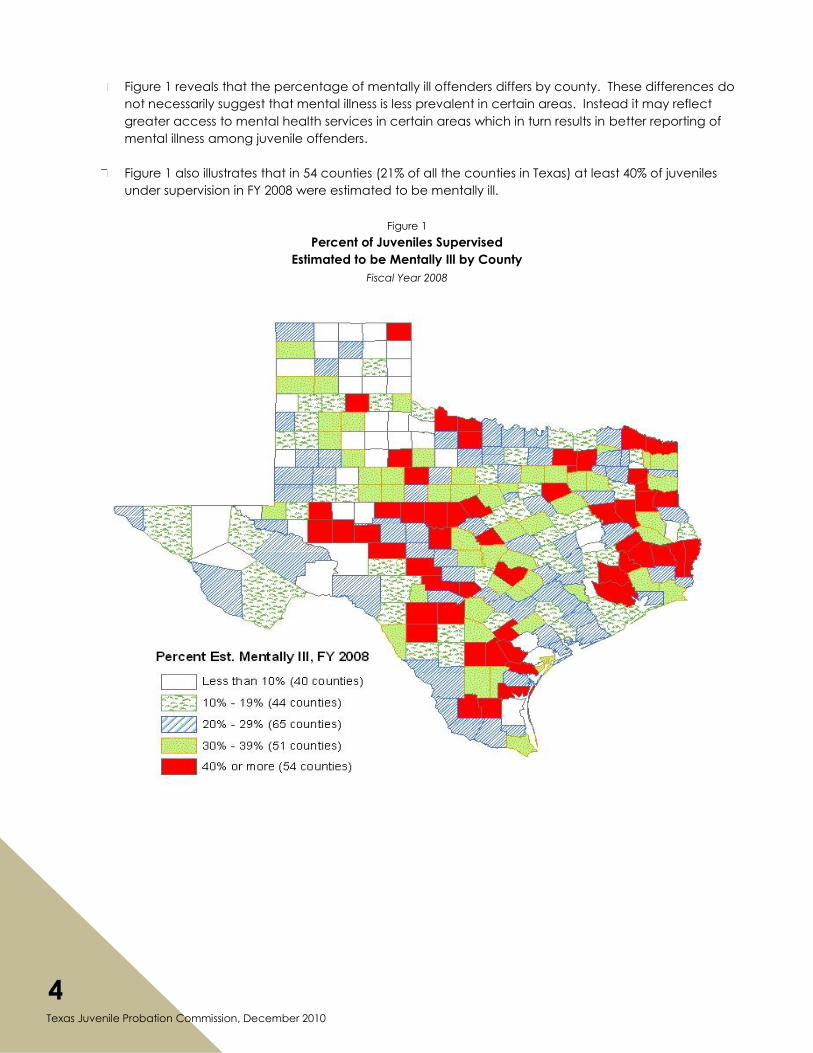
Figure 1 reveals that the percentage of mentally ill offenders differs by county. These differences do
not necessarily suggest that mental illness is less prevalent in certain areas. Instead it may reflect
greater access to mental health services in certain areas which in turn results in better reporting of
mental illness among juvenile offenders.
Figure 1 also illustrates that in 54 counties (21% of all the counties in Texas) at least 40% of juveniles
under supervision in FY 2008 were estimated to be mentally ill.
Figure 1
Percent of Juveniles Supervised
Estimated to be Mentally Ill by County
Fiscal Year 2008
5 Overview of the Special Needs Diversionary Program for Mentally Ill Juvenile Offenders, FY 2010
Description of SNDP
The basic programmatic structure of SNDP includes a specialized juvenile probation officer teamed
with a Mental Health Professional (MHP) carrying a caseload of 12 to 20 youth identified as meeting
DSHS‟s standard for priority population diagnosis. The mental health professional may be either a
Licensed Mental Health Professional (LMHP) or a Qualified Mental Health Professional (QMHP)
depending on the needs of the family and the resources available in the community.
SNDP guidelines require that an initial case plan be completed by the team within 72 hours of the
juvenile‟s enrollment into the program. The plan must be completed with participation and input
from the juvenile, the juvenile‟s parent/guardian, the specialized juvenile probation officer and
MHP, at a minimum. A formal case plan review must be conducted on a monthly basis with input
from the juvenile, parent/guardian, specialized officer and MHP.
Each juvenile‟s case management/treatment plan includes a transition period which should begin
no later than two months prior to the juvenile‟s projected discharge from the program. The intent of
this process is to set up aftercare services and to assist the youth and family to become less reliant
upon the formal supports provided by the probation officer and the MHP and more reliant upon
informal supports available in the community.
Bexar, Cameron, Dallas, El Paso, Harris, Hidalgo, Tarrant and Travis counties, which represent over
50% of the juvenile justice population, were identified to receive the first round of SNPD funding and
began coordinating and providing specialized supervision and mental health services in September
of 2001.
Cameron and Hidalgo provided only specialized supervision in 2001 but began providing mental
health services as well to some juveniles beginning in 2002.
Angelina, Ellis, Ft. Bend, Hale, Jasper, Jefferson, McLennan, Nacogdoches, Randall, San Patricio,
Smith, Tyler and Williamson received the second round of funding and began providing both
specialized supervision and mental health services in calendar year 2002.
Jasper ended its program in FY 2005, and Polk (which is the lead county for San Jacinto and Trinity
counties) began its program in FY 2006. El Paso temporarily suspended its program in 2007 and
resumed in 2008 with a model using a private provider for mental health services and a mental
health court.
Historical Trends of Juvenile Served in SNDP
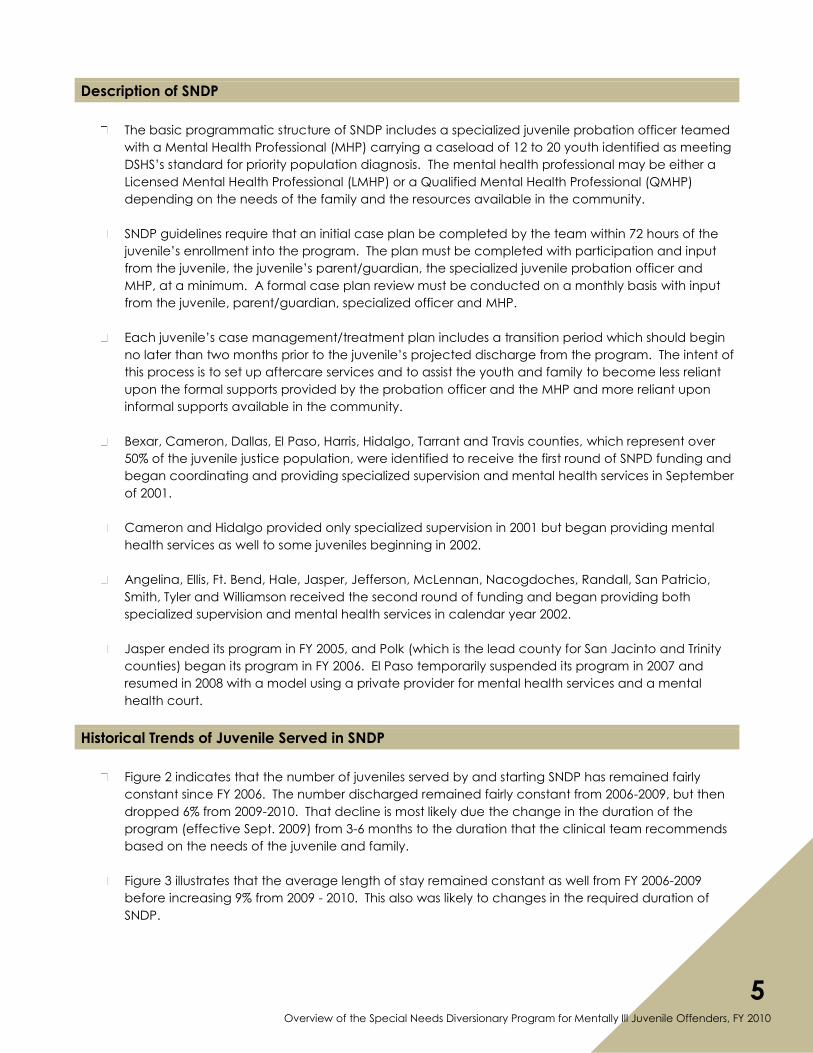
Figure 2 indicates that the number of juveniles served by and starting SNDP has remained fairly
constant since FY 2006. The number discharged remained fairly constant from 2006-2009, but then
dropped 6% from 2009-2010. That decline is most likely due the change in the duration of the
program (effective Sept. 2009) from 3-6 months to the duration that the clinical team recommends
based on the needs of the juvenile and family.
Figure 3 illustrates that the average length of stay remained constant as well from FY 2006-2009
before increasing 9% from 2009 - 2010. This also was likely to changes in the required duration of
SNDP.
6 Texas Juvenile Probation Commission, December 2010
Figure 2
Juveniles Served, Starting and Discharged from SNDP
Fiscal Year 2002-2010
Figure 3
Average Length of Stay (Days) in SNDP
Fiscal Year 2002-2010
764
1,398
1,498 1,514
1,418 1,4021,370 1,389 1,400
764
1,073 1,052
1,062
1,002 988 972
1,002 992
401
949
1,018
1,091
1,002 1,003 978
986
923
300
500
700
900
1100
1300
1500
1700
FY '02 FY '03 FY '04 FY '05 FY '06 FY '07 FY '08 FY '09 FY '10
Served Starting Discharged
130
143 144
154
149
144146
148
161
120
125
130
135
140
145
150
155
160
165
FY '02 FY '03 FY '04 FY '05 FY '06 FY '07 FY '08 FY '09 FY '10
7 Overview of the Special Needs Diversionary Program for Mentally Ill Juvenile Offenders, FY 2010
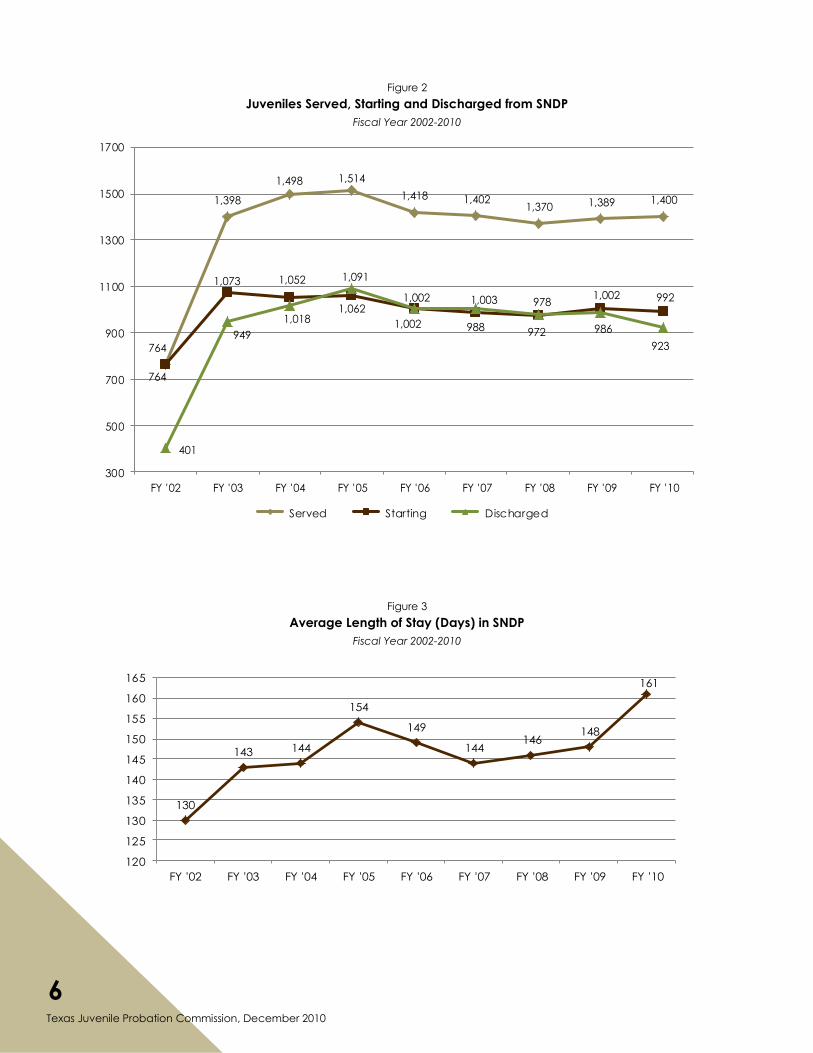
Figure 4 shows that the percent of juveniles successfully completing SNDP has fluctuated around
70% since FY „04, with slightly higher completion rates in FY „09 and FY „10.
Figure 4
Percent of Juveniles Completing SNDP
Fiscal Year 2002-2010
47%
60%
70%
75%
71%
68%67%
77%
73%
40%
45%
50%
55%
60%
65%
70%
75%
80%
FY '02 FY '03 FY '04 FY '05 FY '06 FY '07 FY '08 FY '09 FY '10
Juveniles Served in SNDP in Fiscal Year 2010
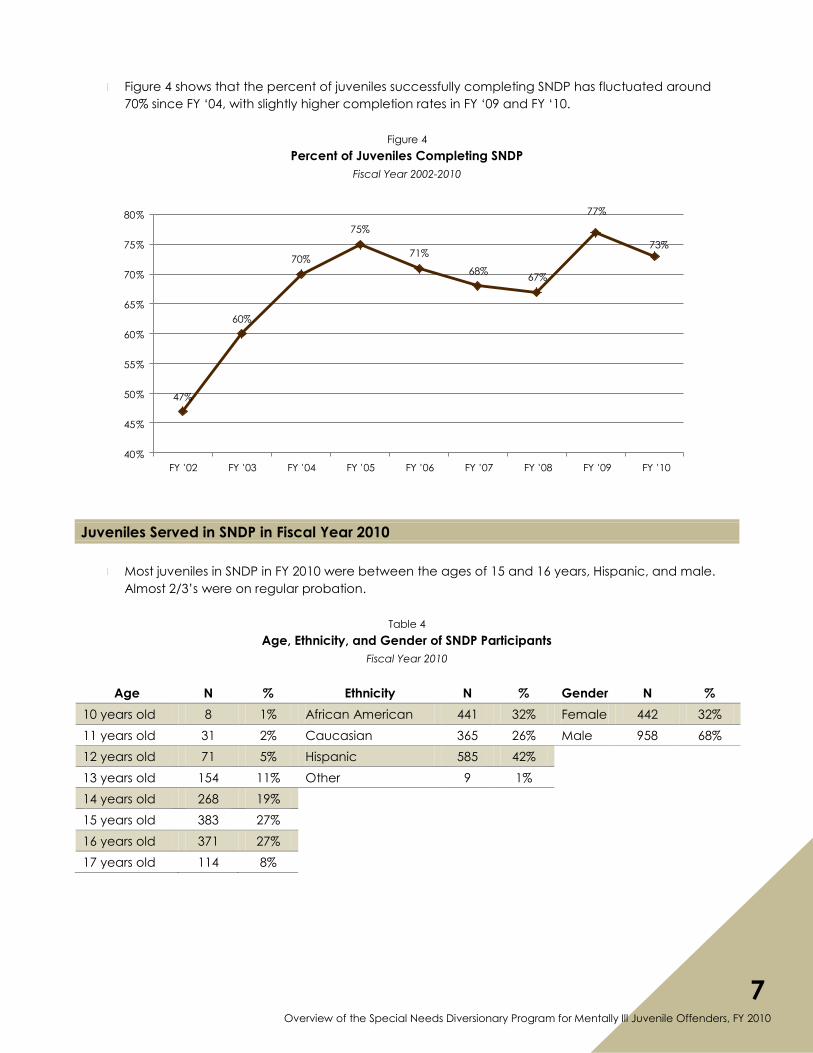
Most juveniles in SNDP in FY 2010 were between the ages of 15 and 16 years, Hispanic, and male.
Almost 2/3‟s were on regular probation.
Table 4
Age, Ethnicity, and Gender of SNDP Participants
Fiscal Year 2010
Age N % Ethnicity N % Gender N %
10 years old 8 1% African American 441 32% Female 442 32%
11 years old 31 2% Caucasian 365 26% Male 958 68%
12 years old 71 5% Hispanic 585 42%
13 years old 154 11% Other 9 1%
14 years old 268 19%
15 years old 383 27%
16 years old 371 27%
17 years old 114 8%
8 Texas Juvenile Probation Commission, December 2010
Table 5
Supervision Status of SNDP Participants of Program Start
Fiscal Year 2010
N %
Deferred Prosecution 181 13%
Regular Probation 917 66%
ISP 163 12%
Temp/ Cond of Release 139 10%
Total 1,400 100%
A total of 42% of juveniles were placed on a waiting list before starting SNDP in FY 2010. That
equates to 421 juveniles out of the 992 who started the program. The average time on the waiting
list was 45 days. Approximately 19% (79 juveniles) of those on the waiting list were on the waiting list
for two weeks or less, while another 24% (99 juveniles) were on the waiting list 60 days or longer.
The average length of stay for the 923 juveniles discharged in FY 2010 was 161 days. A total of 15%
(136) were in the program less than three months; 48% (441) were in the program three to six months;
and 37% (346) were in the program six months or longer.
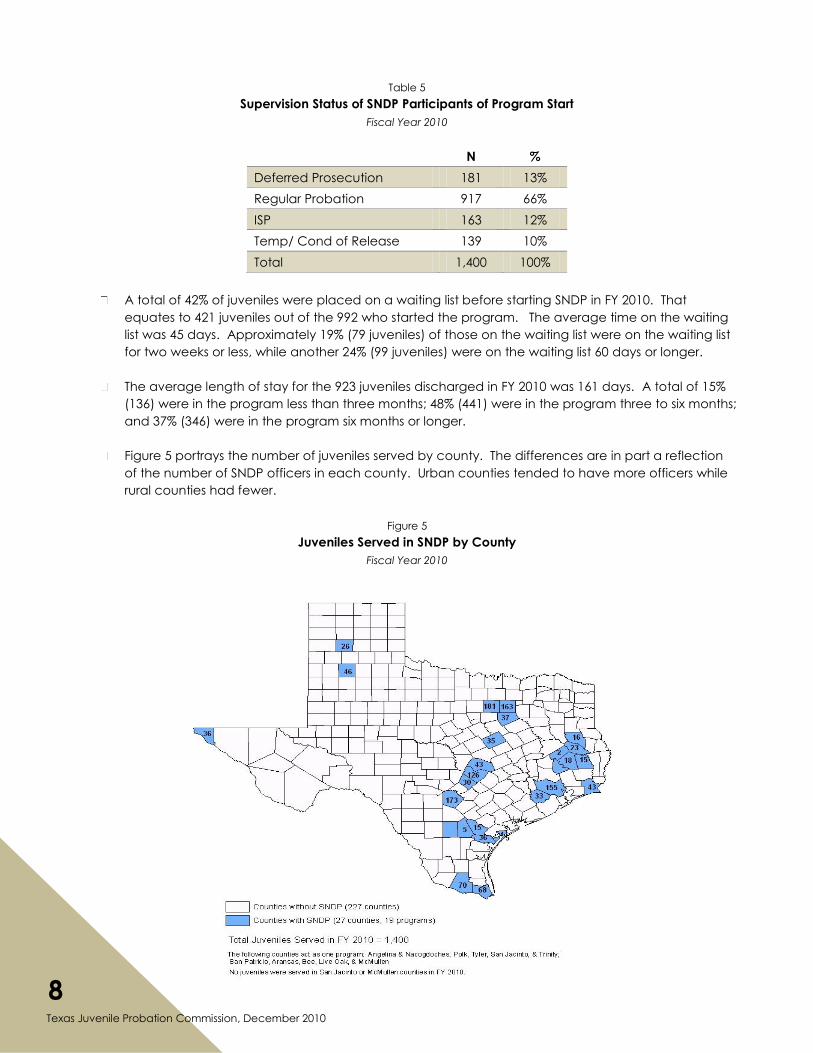
Figure 5 portrays the number of juveniles served by county. The differences are in part a reflection
of the number of SNDP officers in each county. Urban counties tended to have more officers while
rural counties had fewer.
Figure 5
Juveniles Served in SNDP by County
Fiscal Year 2010
9 Overview of the Special Needs Diversionary Program for Mentally Ill Juvenile Offenders, FY 2010
Mental Health History of Juveniles Served
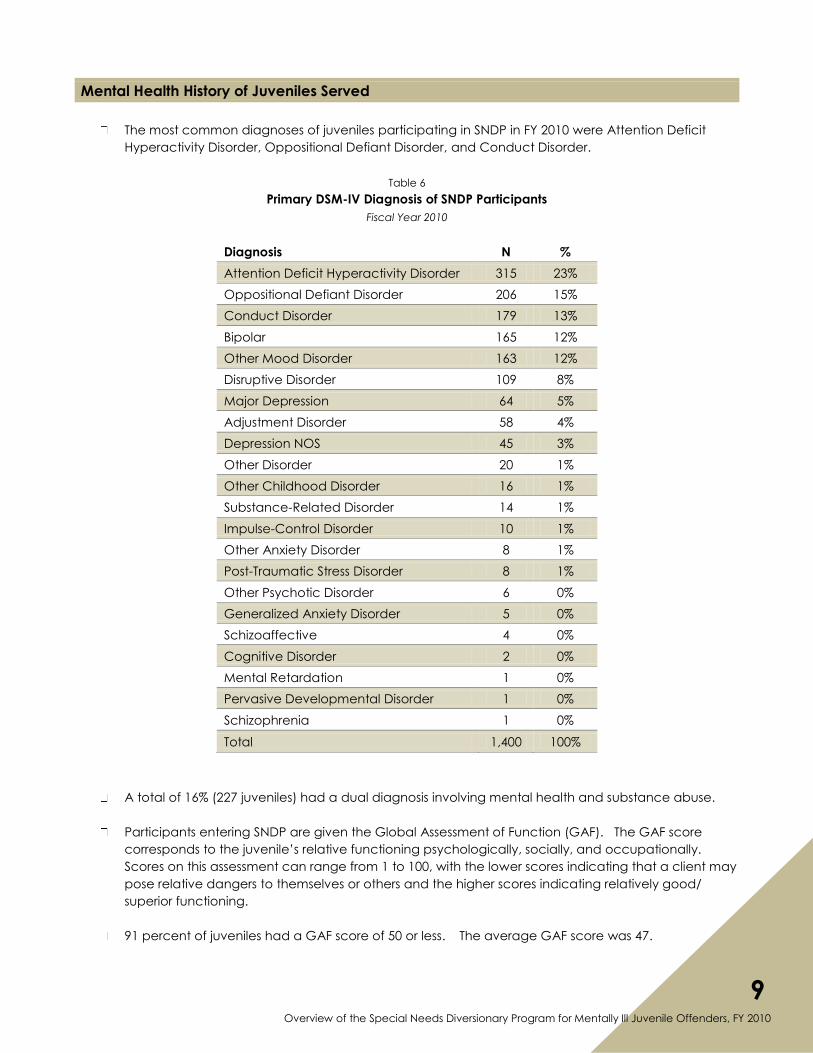
The most common diagnoses of juveniles participating in SNDP in FY 2010 were Attention Deficit
Hyperactivity Disorder, Oppositional Defiant Disorder, and Conduct Disorder.
Table 6
Primary DSM-IV Diagnosis of SNDP Participants
Fiscal Year 2010
Diagnosis N %
Attention Deficit Hyperactivity Disorder 315 23%
Oppositional Defiant Disorder 206 15%
Conduct Disorder 179 13%
Bipolar 165 12%
Other Mood Disorder 163 12%
Disruptive Disorder 109 8%
Major Depression 64 5%
Adjustment Disorder 58 4%
Depression NOS 45 3%
Other Disorder 20 1%
Other Childhood Disorder 16 1%
Substance-Related Disorder 14 1%
Impulse-Control Disorder 10 1%
Other Anxiety Disorder 8 1%
Post-Traumatic Stress Disorder 8 1%
Other Psychotic Disorder 6 0%
Generalized Anxiety Disorder 5 0%
Schizoaffective 4 0%
Cognitive Disorder 2 0%
Mental Retardation 1 0%
Pervasive Developmental Disorder 1 0%
Schizophrenia 1 0%
Total 1,400 100%
A total of 16% (227 juveniles) had a dual diagnosis involving mental health and substance abuse.
Participants entering SNDP are given the Global Assessment of Function (GAF). The GAF score
corresponds to the juvenile‟s relative functioning psychologically, socially, and occupationally.
Scores on this assessment can range from 1 to 100, with the lower scores indicating that a client may
pose relative dangers to themselves or others and the higher scores indicating relatively good/
superior functioning.
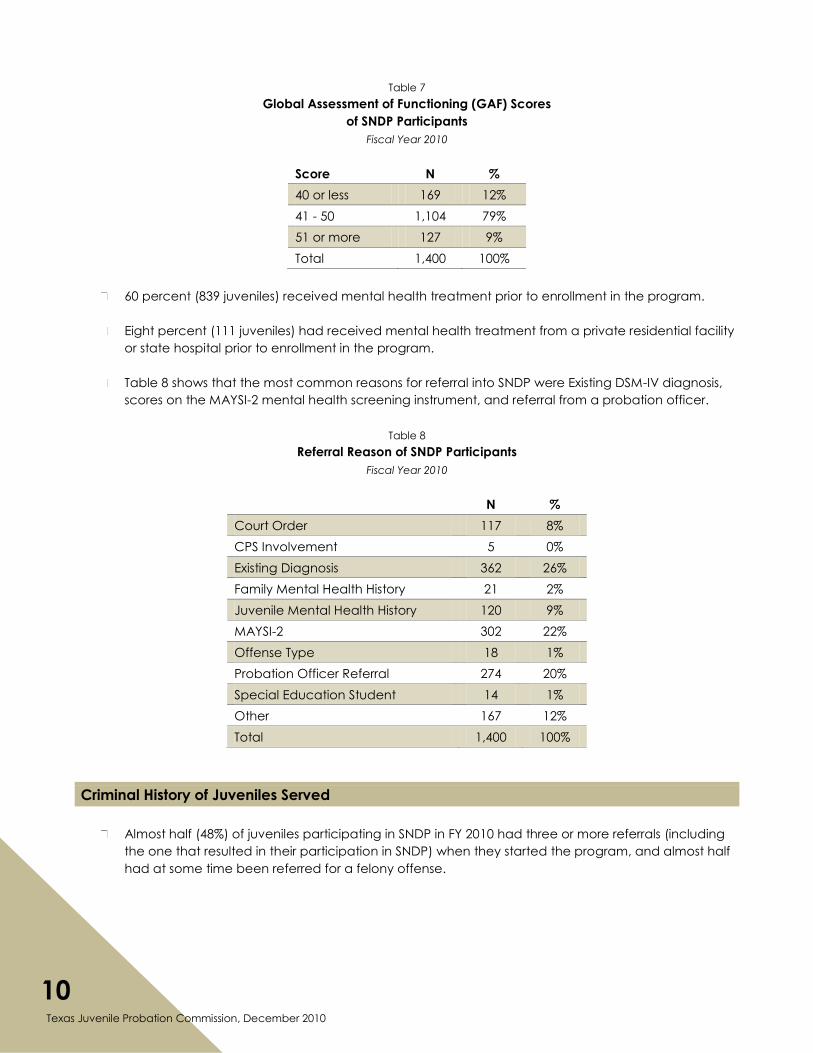
91 percent of juveniles had a GAF score of 50 or less. The average GAF score was 47.
10 Texas Juvenile Probation Commission, December 2010
Table 7
Global Assessment of Functioning (GAF) Scores
of SNDP Participants
Fiscal Year 2010
Score N %
40 or less 169 12%
41 - 50 1,104 79%
51 or more 127 9%
Total 1,400 100%
60 percent (839 juveniles) received mental health treatment prior to enrollment in the program.
Eight percent (111 juveniles) had received mental health treatment from a private residential facility
or state hospital prior to enrollment in the program.
Table 8 shows that the most common reasons for referral into SNDP were Existing DSM-IV diagnosis,
scores on the MAYSI-2 mental health screening instrument, and referral from a probation officer.
Table 8
Referral Reason of SNDP Participants
Fiscal Year 2010
N %
Court Order 117 8%
CPS Involvement 5 0%
Existing Diagnosis 362 26%
Family Mental Health History 21 2%
Juvenile Mental Health History 120 9%
MAYSI-2 302 22%
Offense Type 18 1%
Probation Officer Referral 274 20%
Special Education Student 14 1%
Other 167 12%
Total 1,400 100%
Criminal History of Juveniles Served
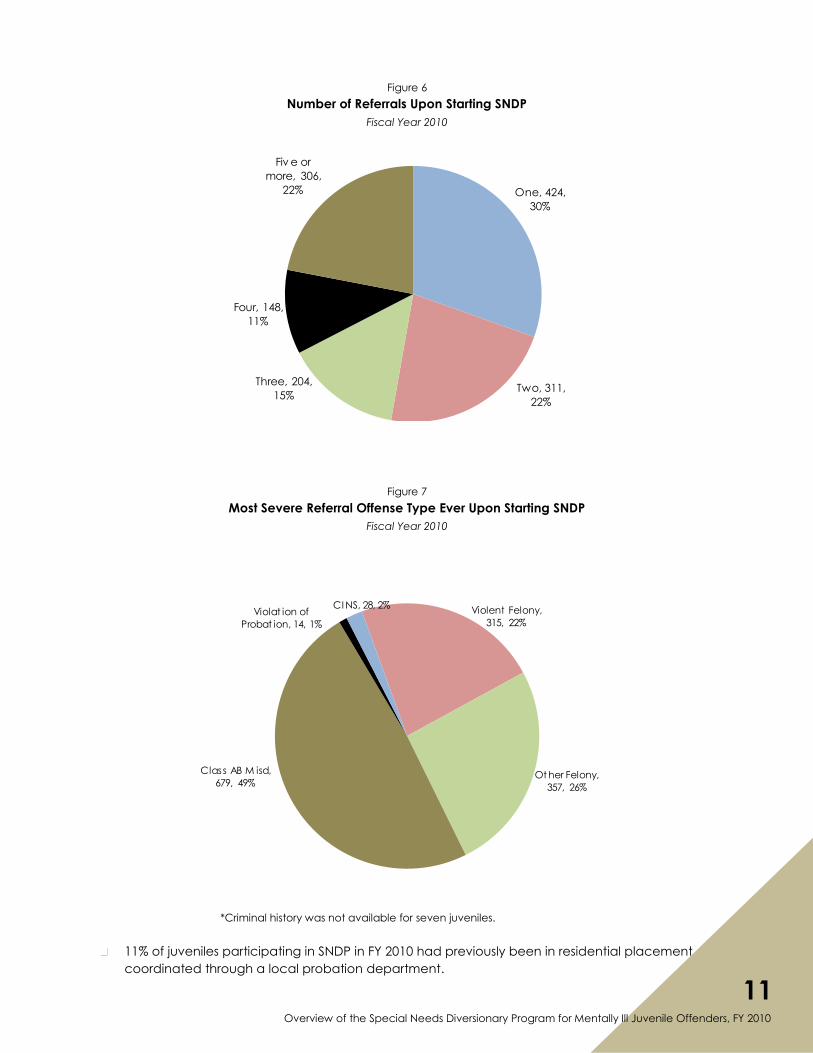
Almost half (48%) of juveniles participating in SNDP in FY 2010 had three or more referrals (including
the one that resulted in their participation in SNDP) when they started the program, and almost half
had at some time been referred for a felony offense.
11 Overview of the Special Needs Diversionary Program for Mentally Ill Juvenile Offenders, FY 2010
Figure 6
Number of Referrals Upon Starting SNDP
Fiscal Year 2010
One, 424,
30%
Two, 311,
22%
Three, 204,
15%
Four, 148,
11%
Fiv e or
more, 306,
22%
Figure 7
Most Severe Referral Offense Type Ever Upon Starting SNDP
Fiscal Year 2010
Violent Felony,
315, 22%
Ot her Felony,
357, 26%
Class AB M isd,
679, 49%
Violat ion of
Probat ion, 14, 1%
CI NS, 28, 2%
*Criminal history was not available for seven juveniles.
11% of juveniles participating in SNDP in FY 2010 had previously been in residential placement
coordinated through a local probation department.
12 Texas Juvenile Probation Commission, December 2010
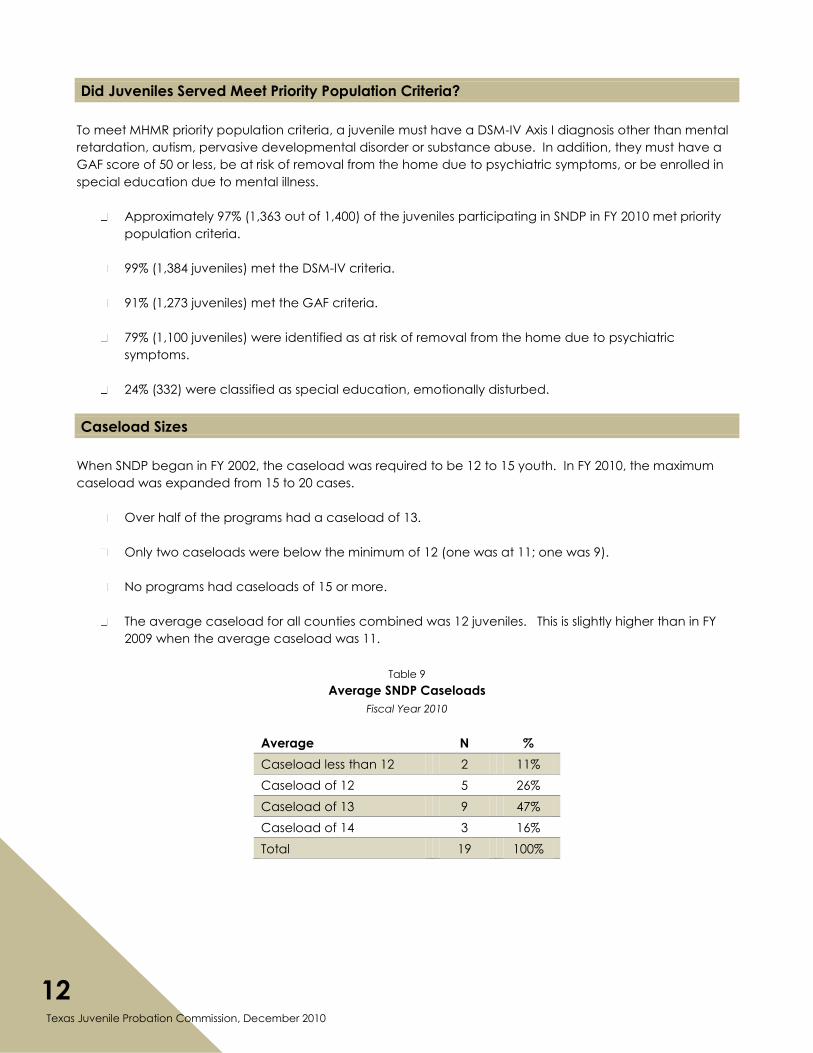
Did Juveniles Served Meet Priority Population Criteria?
To meet MHMR priority population criteria, a juvenile must have a DSM-IV Axis I diagnosis other than mental
retardation, autism, pervasive developmental disorder or substance abuse. In addition, they must have a
GAF score of 50 or less, be at risk of removal from the home due to psychiatric symptoms, or be enrolled in
special education due to mental illness.
Approximately 97% (1,363 out of 1,400) of the juveniles participating in SNDP in FY 2010 met priority
population criteria.
99% (1,384 juveniles) met the DSM-IV criteria.
91% (1,273 juveniles) met the GAF criteria.
79% (1,100 juveniles) were identified as at risk of removal from the home due to psychiatric
symptoms.
24% (332) were classified as special education, emotionally disturbed.
Caseload Sizes
When SNDP began in FY 2002, the caseload was required to be 12 to 15 youth. In FY 2010, the maximum
caseload was expanded from 15 to 20 cases.
Over half of the programs had a caseload of 13.
Only two caseloads were below the minimum of 12 (one was at 11; one was 9).
No programs had caseloads of 15 or more.
The average caseload for all counties combined was 12 juveniles. This is slightly higher than in FY
2009 when the average caseload was 11.
Table 9
Average SNDP Caseloads
Fiscal Year 2010
Average N %
Caseload less than 12 2 11%
Caseload of 12 5 26%
Caseload of 13 9 47%
Caseload of 14 3 16%
Total 19 100%
13 Overview of the Special Needs Diversionary Program for Mentally Ill Juvenile Offenders, FY 2010
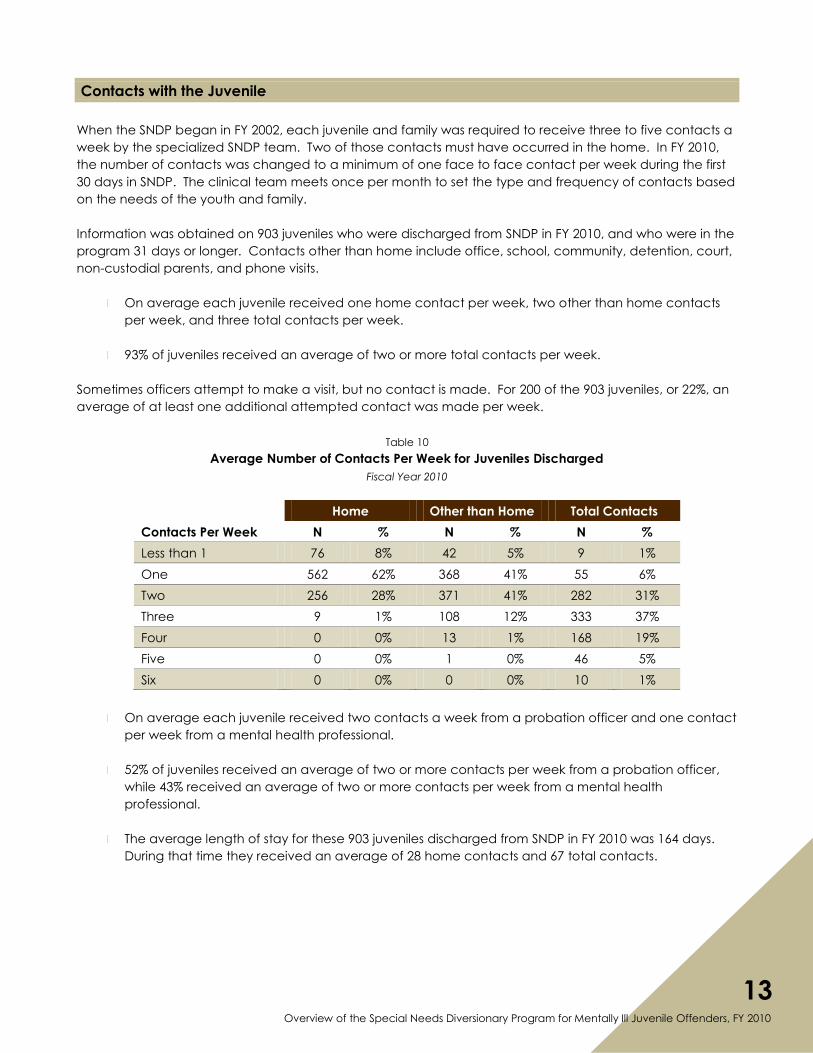
Contacts with the Juvenile
When the SNDP began in FY 2002, each juvenile and family was required to receive three to five contacts a
week by the specialized SNDP team. Two of those contacts must have occurred in the home. In FY 2010,
the number of contacts was changed to a minimum of one face to face contact per week during the first
30 days in SNDP. The clinical team meets once per month to set the type and frequency of contacts based
on the needs of the youth and family.
Information was obtained on 903 juveniles who were discharged from SNDP in FY 2010, and who were in the
program 31 days or longer. Contacts other than home include office, school, community, detention, court,
non-custodial parents, and phone visits.
On average each juvenile received one home contact per week, two other than home contacts
per week, and three total contacts per week.
93% of juveniles received an average of two or more total contacts per week.
Sometimes officers attempt to make a visit, but no contact is made. For 200 of the 903 juveniles, or 22%, an
average of at least one additional attempted contact was made per week.
Table 10
Average Number of Contacts Per Week for Juveniles Discharged
Fiscal Year 2010
Home Other than Home Total Contacts
Contacts Per Week N % N % N %
Less than 1 76 8% 42 5% 9 1%
One 562 62% 368 41% 55 6%
Two 256 28% 371 41% 282 31%
Three 9 1% 108 12% 333 37%
Four 0 0% 13 1% 168 19%
Five 0 0% 1 0% 46 5%
Six 0 0% 0 0% 10 1%
On average each juvenile received two contacts a week from a probation officer and one contact
per week from a mental health professional.
52% of juveniles received an average of two or more contacts per week from a probation officer,
while 43% received an average of two or more contacts per week from a mental health
professional.
The average length of stay for these 903 juveniles discharged from SNDP in FY 2010 was 164 days.
During that time they received an average of 28 home contacts and 67 total contacts.
14 Texas Juvenile Probation Commission, December 2010
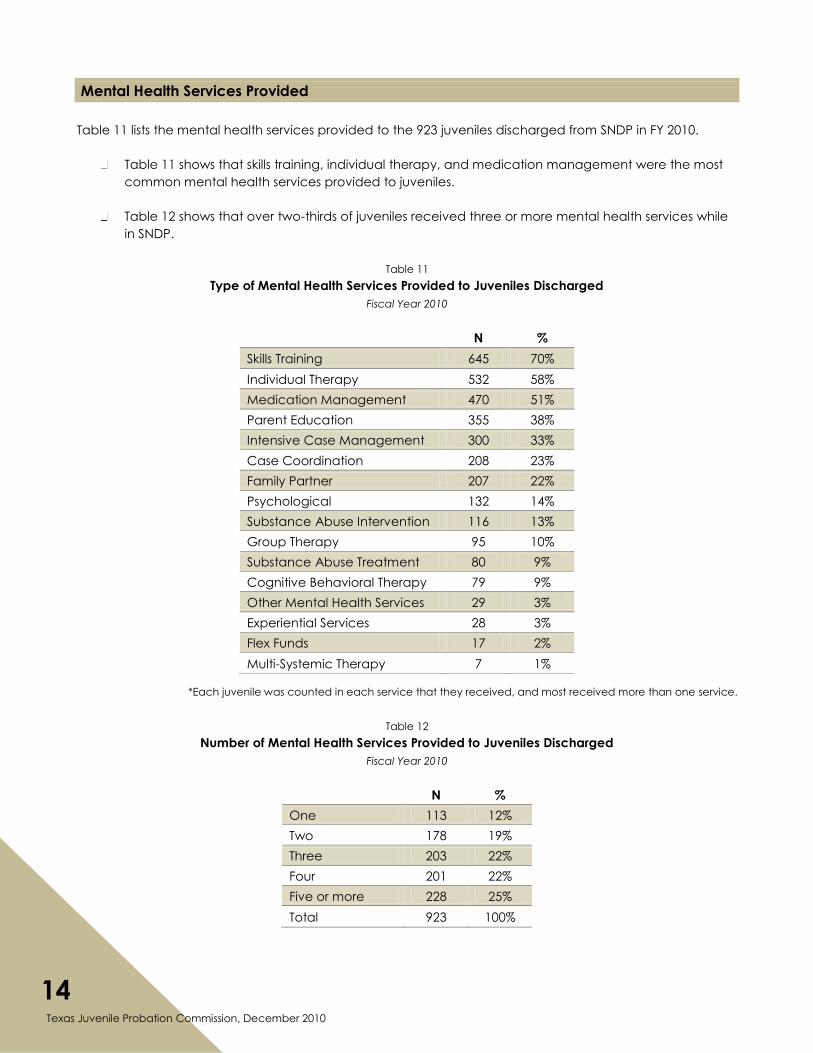
Mental Health Services Provided
Table 11 lists the mental health services provided to the 923 juveniles discharged from SNDP in FY 2010.
Table 11 shows that skills training, individual therapy, and medication management were the most
common mental health services provided to juveniles.
Table 12 shows that over two-thirds of juveniles received three or more mental health services while
in SNDP.
Table 11
Type of Mental Health Services Provided to Juveniles Discharged
Fiscal Year 2010
N %
Skills Training 645 70%
Individual Therapy 532 58%
Medication Management 470 51%
Parent Education 355 38%
Intensive Case Management 300 33%
Case Coordination 208 23%
Family Partner 207 22%
Psychological 132 14%
Substance Abuse Intervention 116 13%
Group Therapy 95 10%
Substance Abuse Treatment 80 9%
Cognitive Behavioral Therapy 79 9%
Other Mental Health Services 29 3%
Experiential Services 28 3%
Flex Funds 17 2%
Multi-Systemic Therapy 7 1%
*Each juvenile was counted in each service that they received, and most received more than one service.
Table 12
Number of Mental Health Services Provided to Juveniles Discharged
Fiscal Year 2010
N %
One 113 12%
Two 178 19%
Three 203 22%
Four 201 22%
Five or more 228 25%
Total 923 100%
15 Overview of the Special Needs Diversionary Program for Mentally Ill Juvenile Offenders, FY 2010
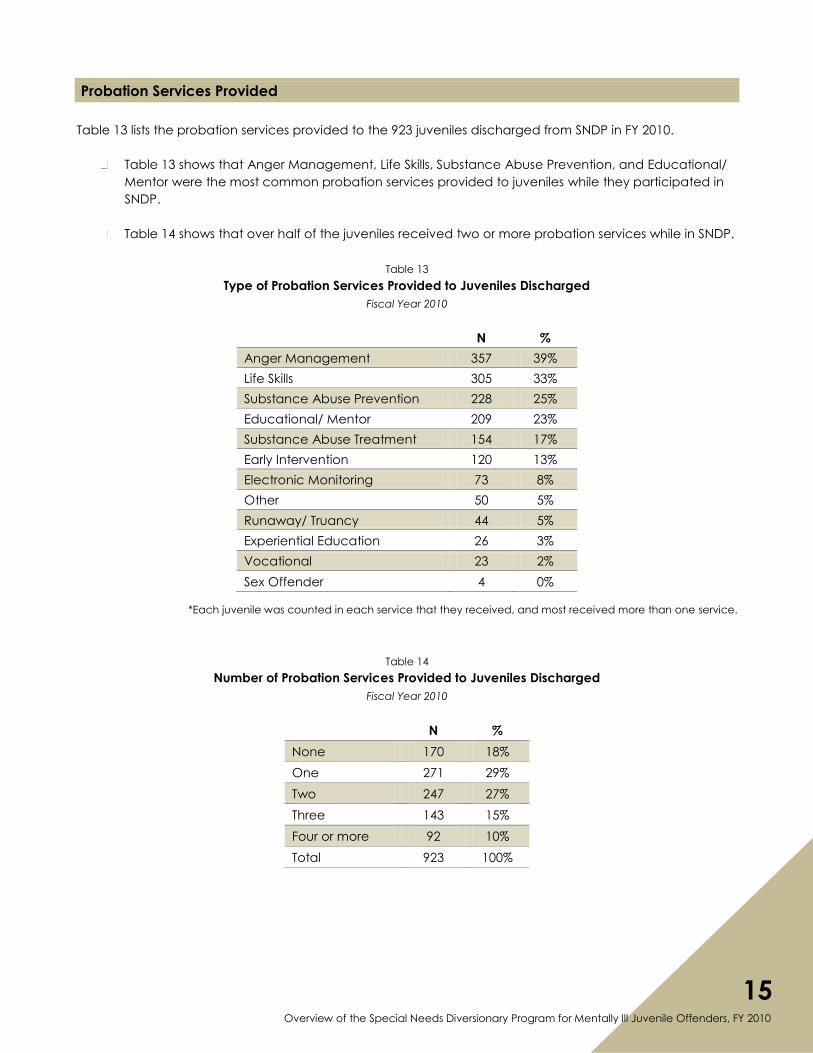
Probation Services Provided
Table 13 lists the probation services provided to the 923 juveniles discharged from SNDP in FY 2010.
Table 13 shows that Anger Management, Life Skills, Substance Abuse Prevention, and Educational/
Mentor were the most common probation services provided to juveniles while they participated in
SNDP.
Table 14 shows that over half of the juveniles received two or more probation services while in SNDP.
Table 13
Type of Probation Services Provided to Juveniles Discharged
Fiscal Year 2010
N %
Anger Management 357 39%
Life Skills 305 33%
Substance Abuse Prevention 228 25%
Educational/ Mentor 209 23%
Substance Abuse Treatment 154 17%
Early Intervention 120 13%
Electronic Monitoring 73 8%
Other 50 5%
Runaway/ Truancy 44 5%
Experiential Education 26 3%
Vocational 23 2%
Sex Offender 4 0%
*Each juvenile was counted in each service that they received, and most received more than one service.
Table 14
Number of Probation Services Provided to Juveniles Discharged
Fiscal Year 2010
N %
None 170 18%
One 271 29%
Two 247 27%
Three 143 15%
Four or more 92 10%
Total 923 100%
16 Texas Juvenile Probation Commission, December 2010
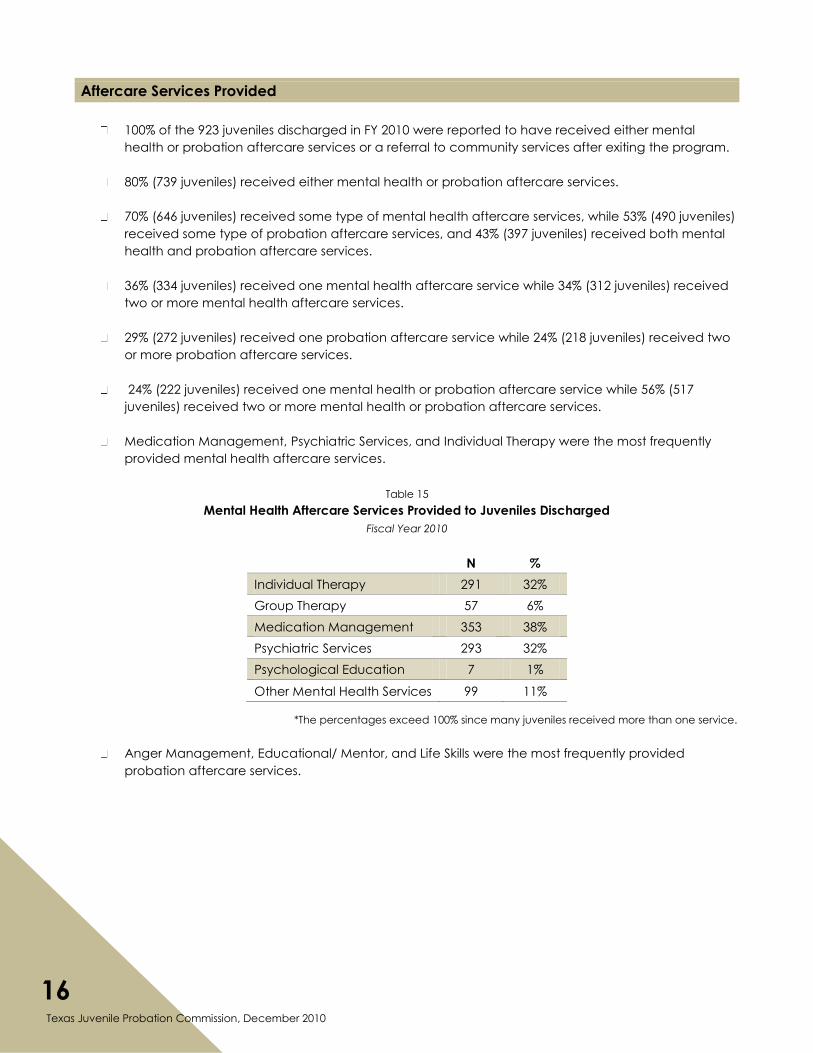
Aftercare Services Provided
100% of the 923 juveniles discharged in FY 2010 were reported to have received either mental
health or probation aftercare services or a referral to community services after exiting the program.
80% (739 juveniles) received either mental health or probation aftercare services.
70% (646 juveniles) received some type of mental health aftercare services, while 53% (490 juveniles)
received some type of probation aftercare services, and 43% (397 juveniles) received both mental
health and probation aftercare services.
36% (334 juveniles) received one mental health aftercare service while 34% (312 juveniles) received
two or more mental health aftercare services.
29% (272 juveniles) received one probation aftercare service while 24% (218 juveniles) received two
or more probation aftercare services.
24% (222 juveniles) received one mental health or probation aftercare service while 56% (517
juveniles) received two or more mental health or probation aftercare services.
Medication Management, Psychiatric Services, and Individual Therapy were the most frequently
provided mental health aftercare services.
Table 15
Mental Health Aftercare Services Provided to Juveniles Discharged
Fiscal Year 2010
N %
Individual Therapy 291 32%
Group Therapy 57 6%
Medication Management 353 38%
Psychiatric Services 293 32%
Psychological Education 7 1%
Other Mental Health Services 99 11%
*The percentages exceed 100% since many juveniles received more than one service.
Anger Management, Educational/ Mentor, and Life Skills were the most frequently provided
probation aftercare services.
17 Overview of the Special Needs Diversionary Program for Mentally Ill Juvenile Offenders, FY 2010
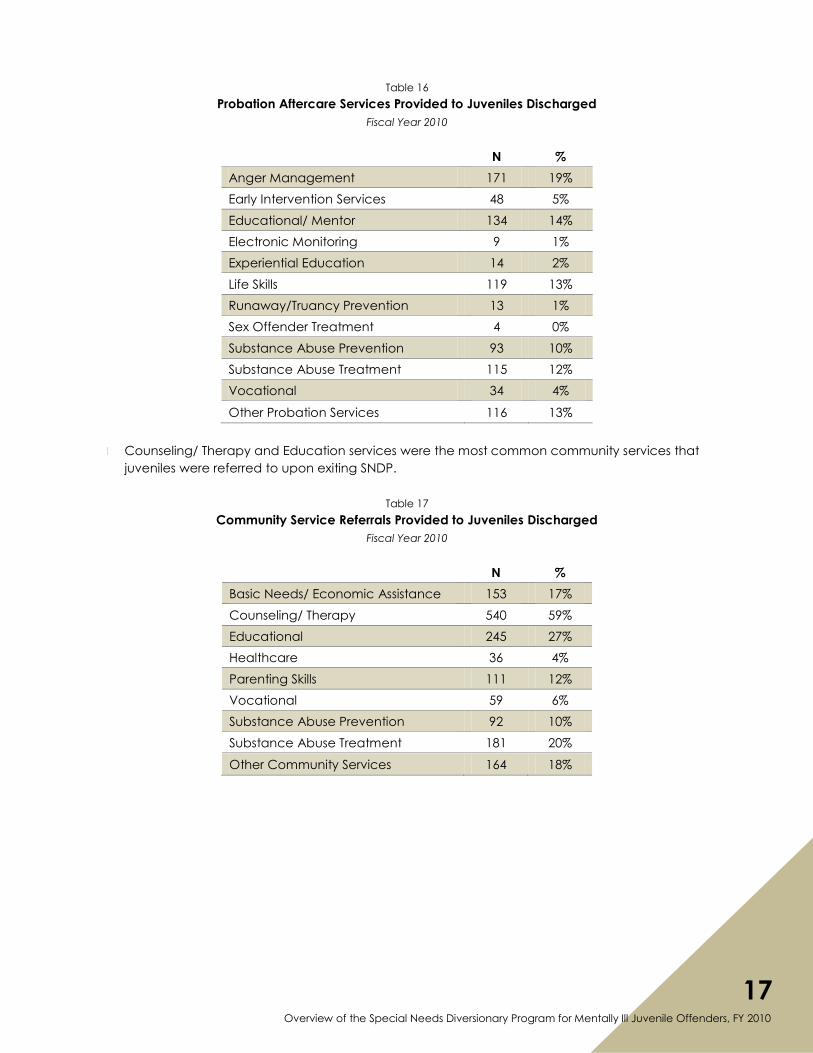
Table 16
Probation Aftercare Services Provided to Juveniles Discharged
Fiscal Year 2010
N %
Anger Management 171 19%
Early Intervention Services 48 5%
Educational/ Mentor 134 14%
Electronic Monitoring 9 1%
Experiential Education 14 2%
Life Skills 119 13%
Runaway/Truancy Prevention 13 1%
Sex Offender Treatment 4 0%
Substance Abuse Prevention 93 10%
Substance Abuse Treatment 115 12%
Vocational 34 4%
Other Probation Services 116 13%
Counseling/ Therapy and Education services were the most common community services that
juveniles were referred to upon exiting SNDP.
Table 17
Community Service Referrals Provided to Juveniles Discharged
Fiscal Year 2010
N %
Basic Needs/ Economic Assistance 153 17%
Counseling/ Therapy 540 59%
Educational 245 27%
Healthcare 36 4%
Parenting Skills 111 12%
Vocational 59 6%
Substance Abuse Prevention 92 10%
Substance Abuse Treatment 181 20%
Other Community Services 164 18%
18 Texas Juvenile Probation Commission, December 2010
SNDP Outcomes
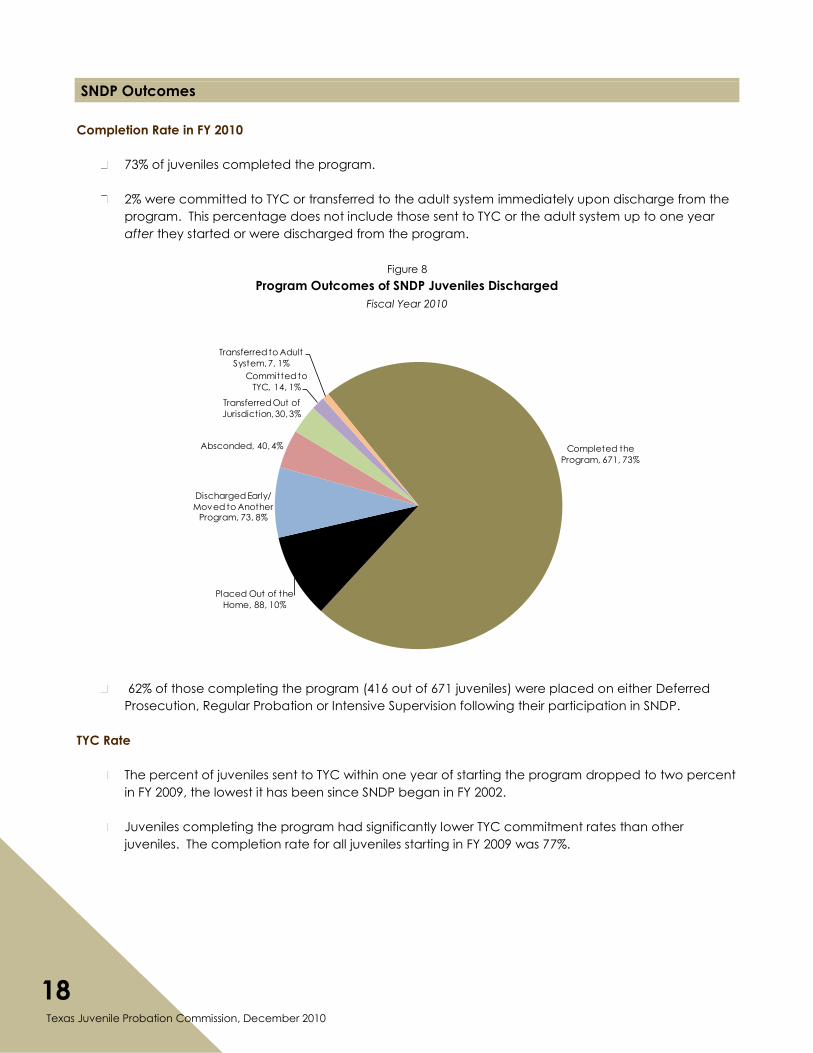
Completion Rate in FY 2010
73% of juveniles completed the program.
2% were committed to TYC or transferred to the adult system immediately upon discharge from the
program. This percentage does not include those sent to TYC or the adult system up to one year
after they started or were discharged from the program.
Figure 8
Program Outcomes of SNDP Juveniles Discharged
Fiscal Year 2010
Completed the
Program, 671, 73%
Placed Out of the
Home, 88, 10%
Discharged Early/
Moved to Another Program, 73, 8%
Absconded, 40, 4%
Transferred Out of
Jurisdiction, 30, 3%
Committed to
TYC, 14, 1%
Transferred to Adult
System, 7, 1%
62% of those completing the program (416 out of 671 juveniles) were placed on either Deferred
Prosecution, Regular Probation or Intensive Supervision following their participation in SNDP.
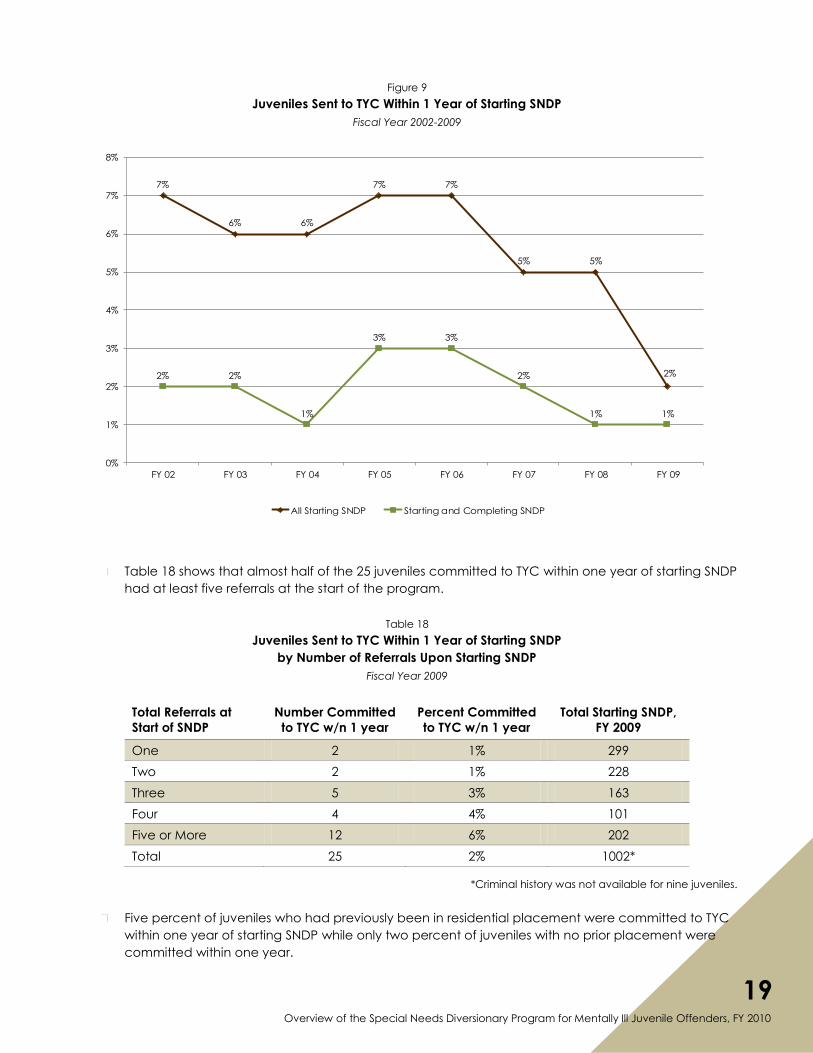
TYC Rate
The percent of juveniles sent to TYC within one year of starting the program dropped to two percent
in FY 2009, the lowest it has been since SNDP began in FY 2002.
Juveniles completing the program had significantly lower TYC commitment rates than other
juveniles. The completion rate for all juveniles starting in FY 2009 was 77%.
19 Overview of the Special Needs Diversionary Program for Mentally Ill Juvenile Offenders, FY 2010
Figure 9
Juveniles Sent to TYC Within 1 Year of Starting SNDP
Fiscal Year 2002-2009
7%
6% 6%
7% 7%
5% 5%
2%2% 2%
1%
3% 3%
2%
1% 1%
0%
1%
2%
3%
4%
5%
6%
7%
8%
FY 02 FY 03 FY 04 FY 05 FY 06 FY 07 FY 08 FY 09
All Starting SNDP Starting and Completing SNDP
Table 18 shows that almost half of the 25 juveniles committed to TYC within one year of starting SNDP
had at least five referrals at the start of the program.
Table 18
Juveniles Sent to TYC Within 1 Year of Starting SNDP
by Number of Referrals Upon Starting SNDP
Fiscal Year 2009
Total Referrals at
Start of SNDP
Number Committed
to TYC w/n 1 year
Percent Committed
to TYC w/n 1 year
Total Starting SNDP,
FY 2009
One 2 1% 299
Two 2 1% 228
Three 5 3% 163
Four 4 4% 101
Five or More 12 6% 202
Total 25 2% 1002*
*Criminal history was not available for nine juveniles.
Five percent of juveniles who had previously been in residential placement were committed to TYC
within one year of starting SNDP while only two percent of juveniles with no prior placement were
committed within one year.
20 Texas Juvenile Probation Commission, December 2010
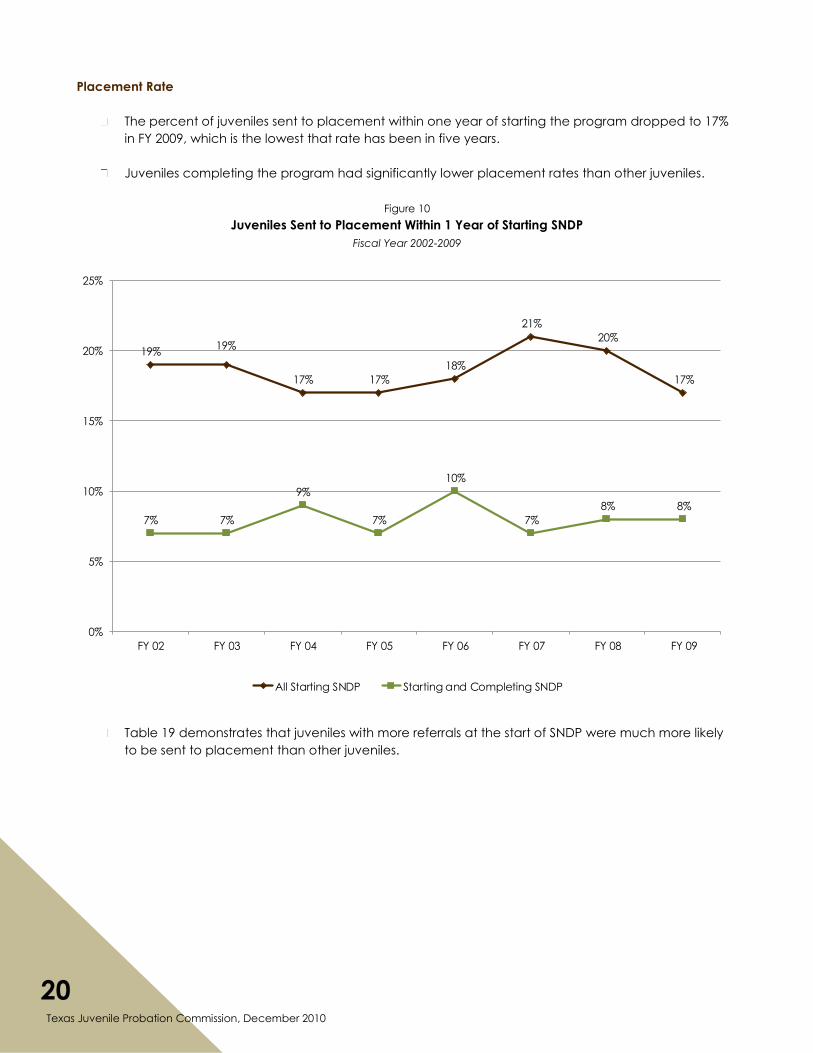
Placement Rate
The percent of juveniles sent to placement within one year of starting the program dropped to 17%
in FY 2009, which is the lowest that rate has been in five years.
Juveniles completing the program had significantly lower placement rates than other juveniles.
Figure 10
Juveniles Sent to Placement Within 1 Year of Starting SNDP
Fiscal Year 2002-2009
19%19%
17% 17%
18%
21%
20%
17%
7% 7%
9%
7%
10%
7%
8% 8%
0%
5%
10%
15%
20%
25%
FY 02 FY 03 FY 04 FY 05 FY 06 FY 07 FY 08 FY 09
All Starting SNDP Starting and Completing SNDP
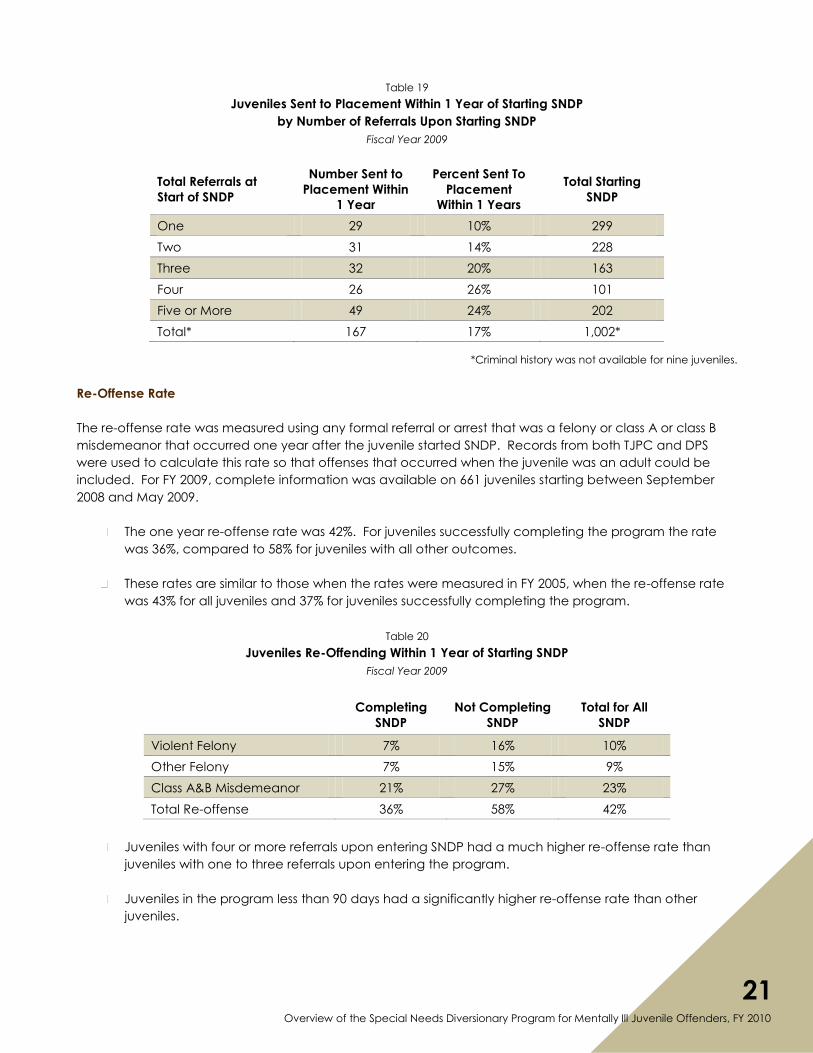
Table 19 demonstrates that juveniles with more referrals at the start of SNDP were much more likely
to be sent to placement than other juveniles.
21 Overview of the Special Needs Diversionary Program for Mentally Ill Juvenile Offenders, FY 2010
Table 19
Juveniles Sent to Placement Within 1 Year of Starting SNDP
by Number of Referrals Upon Starting SNDP
Fiscal Year 2009
Total Referrals at
Start of SNDP
Number Sent to
Placement Within
1 Year
Percent Sent To
Placement
Within 1 Years
Total Starting
SNDP
One 29 10% 299
Two 31 14% 228
Three 32 20% 163
Four 26 26% 101
Five or More 49 24% 202
Total* 167 17% 1,002*
*Criminal history was not available for nine juveniles.
Re-Offense Rate
The re-offense rate was measured using any formal referral or arrest that was a felony or class A or class B
misdemeanor that occurred one year after the juvenile started SNDP. Records from both TJPC and DPS
were used to calculate this rate so that offenses that occurred when the juvenile was an adult could be
included. For FY 2009, complete information was available on 661 juveniles starting between September
2008 and May 2009.
The one year re-offense rate was 42%. For juveniles successfully completing the program the rate
was 36%, compared to 58% for juveniles with all other outcomes.
These rates are similar to those when the rates were measured in FY 2005, when the re-offense rate
was 43% for all juveniles and 37% for juveniles successfully completing the program.
Table 20
Juveniles Re-Offending Within 1 Year of Starting SNDP
Fiscal Year 2009
Completing
SNDP
Not Completing
SNDP
Total for All
SNDP
Violent Felony 7% 16% 10%
Other Felony 7% 15% 9%
Class A&B Misdemeanor 21% 27% 23%
Total Re-offense 36% 58% 42%
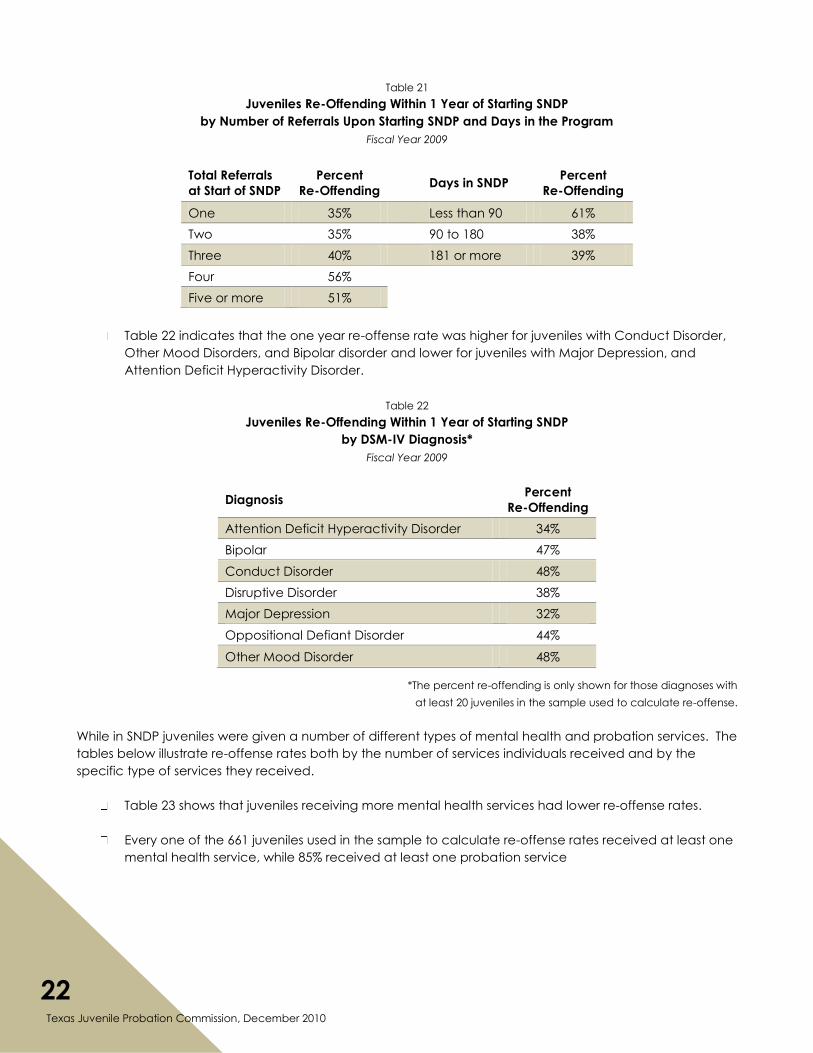
Juveniles with four or more referrals upon entering SNDP had a much higher re-offense rate than
juveniles with one to three referrals upon entering the program.
Juveniles in the program less than 90 days had a significantly higher re-offense rate than other
juveniles.
22 Texas Juvenile Probation Commission, December 2010
Table 21
Juveniles Re-Offending Within 1 Year of Starting SNDP
by Number of Referrals Upon Starting SNDP and Days in the Program
Fiscal Year 2009
Total Referrals
at Start of SNDP
Percent
Re-Offending Days in SNDP
Percent
Re-Offending
One 35%
Less than 90 61%
Two 35%
90 to 180 38%
Three 40%
181 or more 39%
Four 56%
Five or more 51%
Table 22 indicates that the one year re-offense rate was higher for juveniles with Conduct Disorder,
Other Mood Disorders, and Bipolar disorder and lower for juveniles with Major Depression, and
Attention Deficit Hyperactivity Disorder.
Table 22
Juveniles Re-Offending Within 1 Year of Starting SNDP
by DSM-IV Diagnosis*
Fiscal Year 2009
Diagnosis Percent
Re-Offending
Attention Deficit Hyperactivity Disorder 34%
Bipolar 47%
Conduct Disorder 48%
Disruptive Disorder 38%
Major Depression 32%
Oppositional Defiant Disorder 44%
Other Mood Disorder 48%
*The percent re-offending is only shown for those diagnoses with
at least 20 juveniles in the sample used to calculate re-offense.
While in SNDP juveniles were given a number of different types of mental health and probation services. The
tables below illustrate re-offense rates both by the number of services individuals received and by the
specific type of services they received.
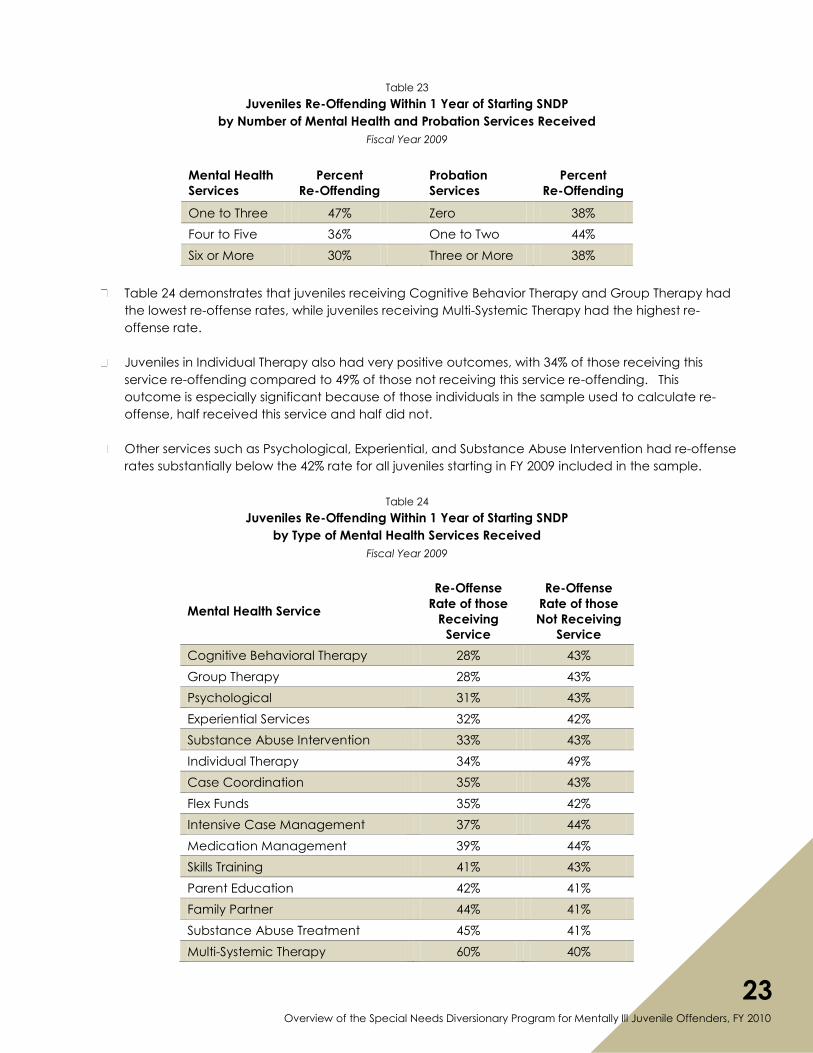
Table 23 shows that juveniles receiving more mental health services had lower re-offense rates.
Every one of the 661 juveniles used in the sample to calculate re-offense rates received at least one
mental health service, while 85% received at least one probation service
23 Overview of the Special Needs Diversionary Program for Mentally Ill Juvenile Offenders, FY 2010
Table 23
Juveniles Re-Offending Within 1 Year of Starting SNDP
by Number of Mental Health and Probation Services Received
Fiscal Year 2009
Mental Health
Services
Percent
Re-Offending
Probation
Services
Percent
Re-Offending
One to Three 47%
Zero 38%
Four to Five 36%
One to Two 44%
Six or More 30%
Three or More 38%
Table 24 demonstrates that juveniles receiving Cognitive Behavior Therapy and Group Therapy had
the lowest re-offense rates, while juveniles receiving Multi-Systemic Therapy had the highest re-
offense rate.
Juveniles in Individual Therapy also had very positive outcomes, with 34% of those receiving this
service re-offending compared to 49% of those not receiving this service re-offending. This
outcome is especially significant because of those individuals in the sample used to calculate re-
offense, half received this service and half did not.
Other services such as Psychological, Experiential, and Substance Abuse Intervention had re-offense
rates substantially below the 42% rate for all juveniles starting in FY 2009 included in the sample.
Table 24
Juveniles Re-Offending Within 1 Year of Starting SNDP
by Type of Mental Health Services Received
Fiscal Year 2009
Mental Health Service
Re-Offense
Rate of those
Receiving
Service
Re-Offense
Rate of those
Not Receiving
Service
Cognitive Behavioral Therapy 28% 43%
Group Therapy 28% 43%
Psychological 31% 43%
Experiential Services 32% 42%
Substance Abuse Intervention 33% 43%
Individual Therapy 34% 49%
Case Coordination 35% 43%
Flex Funds 35% 42%
Intensive Case Management 37% 44%
Medication Management 39% 44%
Skills Training 41% 43%
Parent Education 42% 41%
Family Partner 44% 41%
Substance Abuse Treatment 45% 41%
Multi-Systemic Therapy 60% 40%
24 Texas Juvenile Probation Commission, December 2010
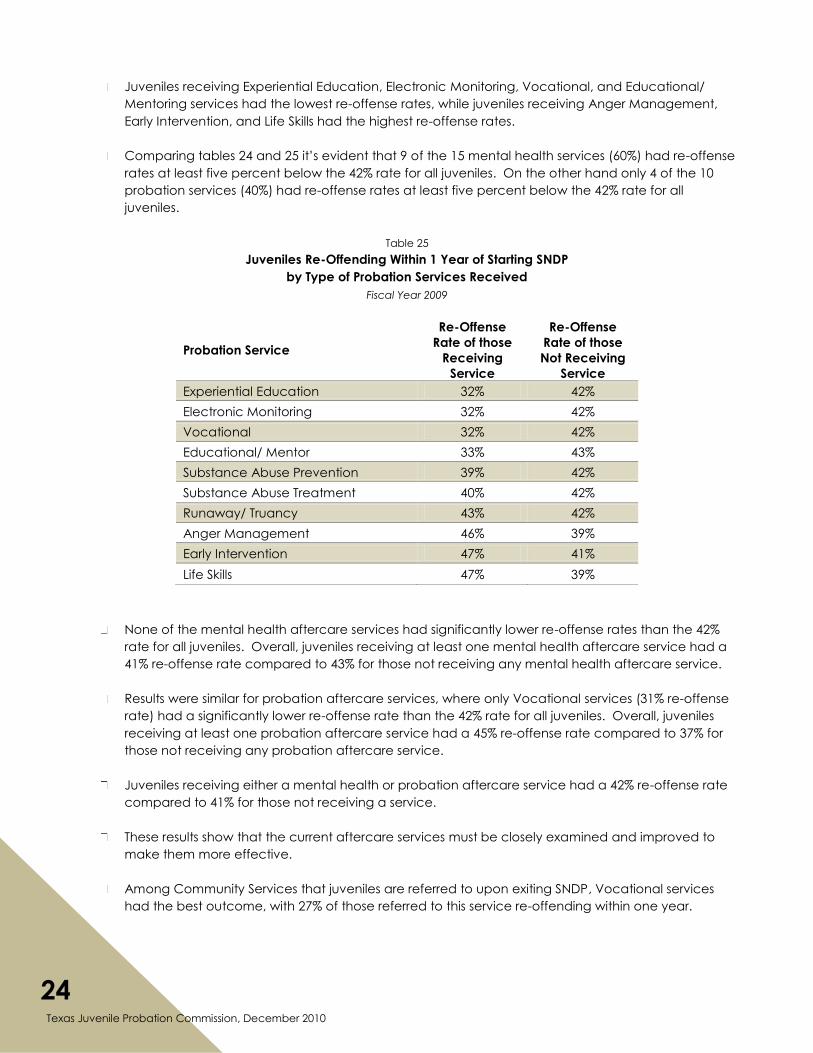
Juveniles receiving Experiential Education, Electronic Monitoring, Vocational, and Educational/
Mentoring services had the lowest re-offense rates, while juveniles receiving Anger Management,
Early Intervention, and Life Skills had the highest re-offense rates.
Comparing tables 24 and 25 it‟s evident that 9 of the 15 mental health services (60%) had re-offense
rates at least five percent below the 42% rate for all juveniles. On the other hand only 4 of the 10
probation services (40%) had re-offense rates at least five percent below the 42% rate for all
juveniles.
Table 25
Juveniles Re-Offending Within 1 Year of Starting SNDP
by Type of Probation Services Received
Fiscal Year 2009
Probation Service
Re-Offense
Rate of those
Receiving
Service
Re-Offense
Rate of those
Not Receiving
Service
Experiential Education 32% 42%
Electronic Monitoring 32% 42%
Vocational 32% 42%
Educational/ Mentor 33% 43%
Substance Abuse Prevention 39% 42%
Substance Abuse Treatment 40% 42%
Runaway/ Truancy 43% 42%
Anger Management 46% 39%
Early Intervention 47% 41%
Life Skills 47% 39%
None of the mental health aftercare services had significantly lower re-offense rates than the 42%
rate for all juveniles. Overall, juveniles receiving at least one mental health aftercare service had a
41% re-offense rate compared to 43% for those not receiving any mental health aftercare service.
Results were similar for probation aftercare services, where only Vocational services (31% re-offense
rate) had a significantly lower re-offense rate than the 42% rate for all juveniles. Overall, juveniles
receiving at least one probation aftercare service had a 45% re-offense rate compared to 37% for
those not receiving any probation aftercare service.
Juveniles receiving either a mental health or probation aftercare service had a 42% re-offense rate
compared to 41% for those not receiving a service.
These results show that the current aftercare services must be closely examined and improved to
make them more effective.
Among Community Services that juveniles are referred to upon exiting SNDP, Vocational services
had the best outcome, with 27% of those referred to this service re-offending within one year.
25 Overview of the Special Needs Diversionary Program for Mentally Ill Juvenile Offenders, FY 2010
Statistics for Individual Programs
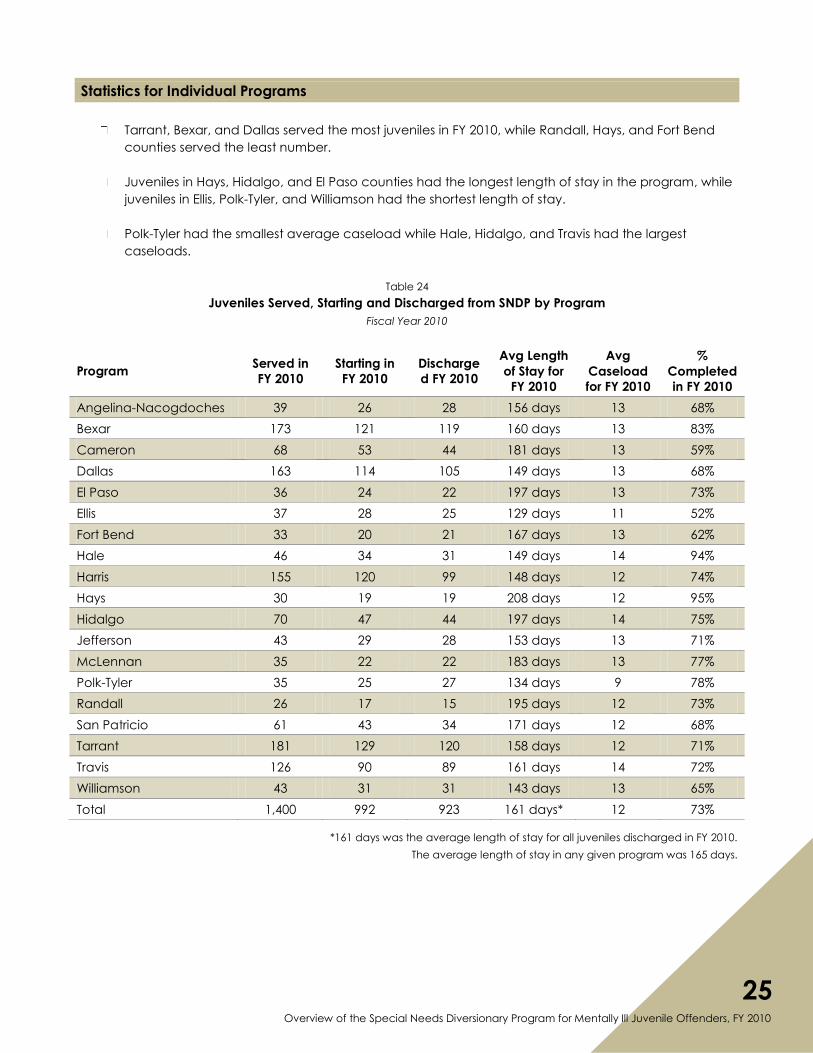
Tarrant, Bexar, and Dallas served the most juveniles in FY 2010, while Randall, Hays, and Fort Bend
counties served the least number.
Juveniles in Hays, Hidalgo, and El Paso counties had the longest length of stay in the program, while
juveniles in Ellis, Polk-Tyler, and Williamson had the shortest length of stay.
Polk-Tyler had the smallest average caseload while Hale, Hidalgo, and Travis had the largest
caseloads.
Table 24
Juveniles Served, Starting and Discharged from SNDP by Program
Fiscal Year 2010
Program Served in
FY 2010
Starting in
FY 2010
Discharge
d FY 2010
Avg Length
of Stay for
FY 2010
Avg
Caseload
for FY 2010
%
Completed
in FY 2010
Angelina-Nacogdoches 39 26 28 156 days 13 68%
Bexar 173 121 119 160 days 13 83%
Cameron 68 53 44 181 days 13 59%
Dallas 163 114 105 149 days 13 68%
El Paso 36 24 22 197 days 13 73%
Ellis 37 28 25 129 days 11 52%
Fort Bend 33 20 21 167 days 13 62%
Hale 46 34 31 149 days 14 94%
Harris 155 120 99 148 days 12 74%
Hays 30 19 19 208 days 12 95%
Hidalgo 70 47 44 197 days 14 75%
Jefferson 43 29 28 153 days 13 71%
McLennan 35 22 22 183 days 13 77%
Polk-Tyler 35 25 27 134 days 9 78%
Randall 26 17 15 195 days 12 73%
San Patricio 61 43 34 171 days 12 68%
Tarrant 181 129 120 158 days 12 71%
Travis 126 90 89 161 days 14 72%
Williamson 43 31 31 143 days 13 65%
Total 1,400 992 923 161 days* 12 73%
*161 days was the average length of stay for all juveniles discharged in FY 2010.
The average length of stay in any given program was 165 days.