Embed Size (px)
Citation preview

Overview of the Sources and Challenges of
Mobile Positioning Data for
Statistics
International Conference on Big Data for Official Statistics
28.10.2014 Beijing Margus Tiru

Agenda
What is Mobile Positioning Data?
What are different sources for the data?
Where can it be used?
What are the challenges of the data?

WHAT IS MOBILE POSITIONING DATA?
What is Mobile Positioning Data?
Tracking the locations of mobile devices in time and space
Collected by Mobile Network Operators (MNOs)
Collected by mobile app developers
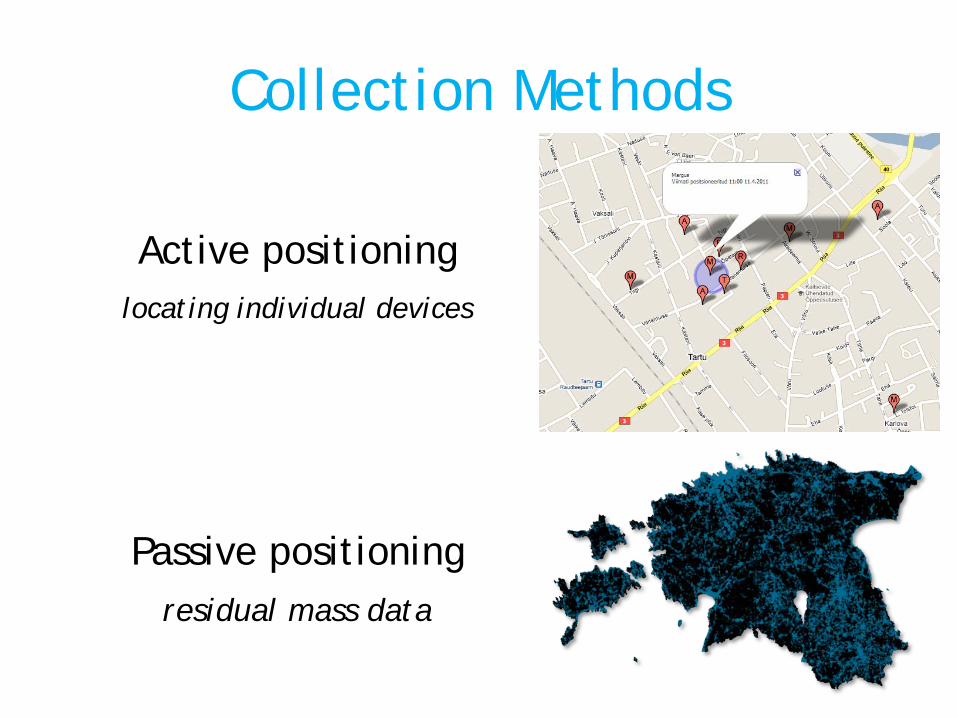
Collection Methods
Active positioning locating individual devices
Passive positioning residual mass data
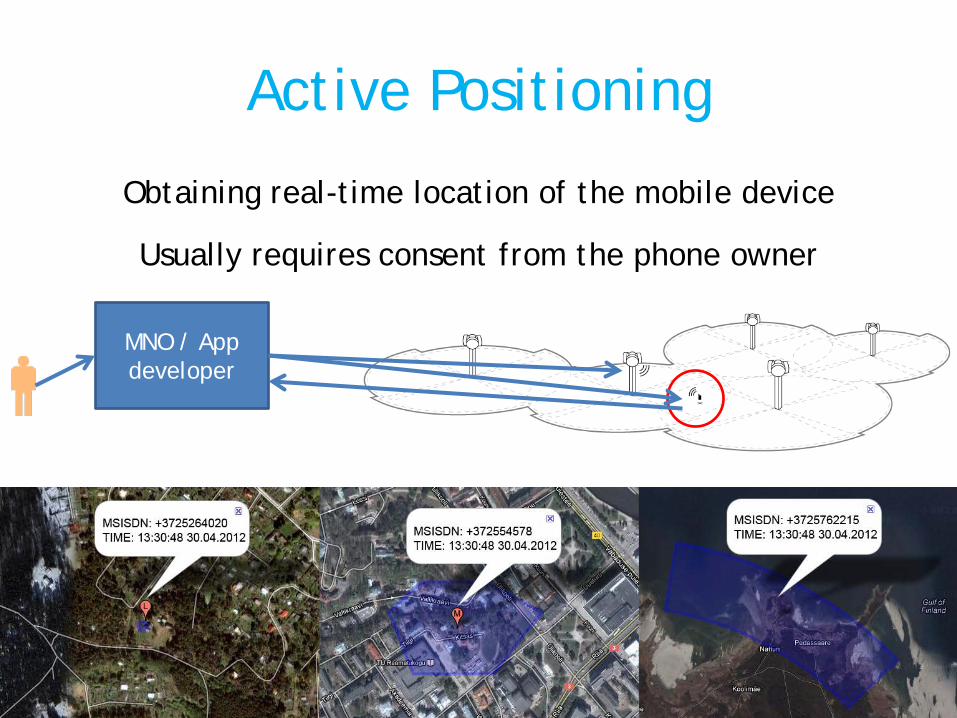
Active Positioning
Obtaining real-time location of the mobile device
Usually requires consent from the phone owner
MNO / App developer
1. Request for the location of the subscriber 2. Consent from the subscriber is requested 3. Consent if given 4. Active locating of the phone takes place 5. Resulting location is provided
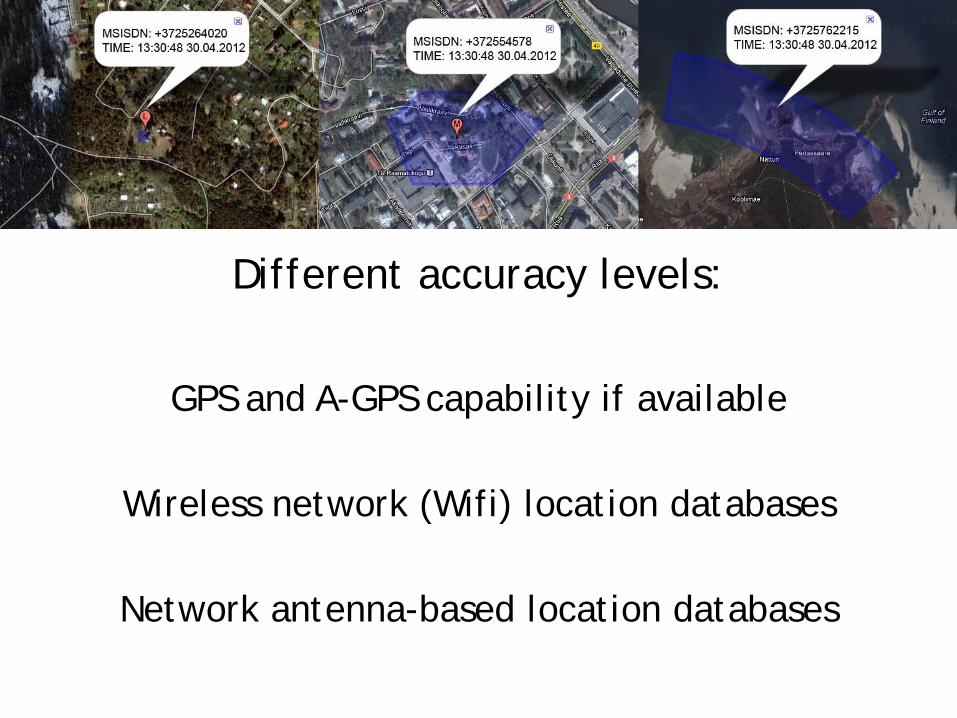
Different accuracy levels:
GPS and A-GPS capability if available
Wireless network (Wifi) location databases
Network antenna-based location databases
Options to Obtain Active Location
Active pinging of the phone via MNO
Terminal-based positioning (apps & GPS)
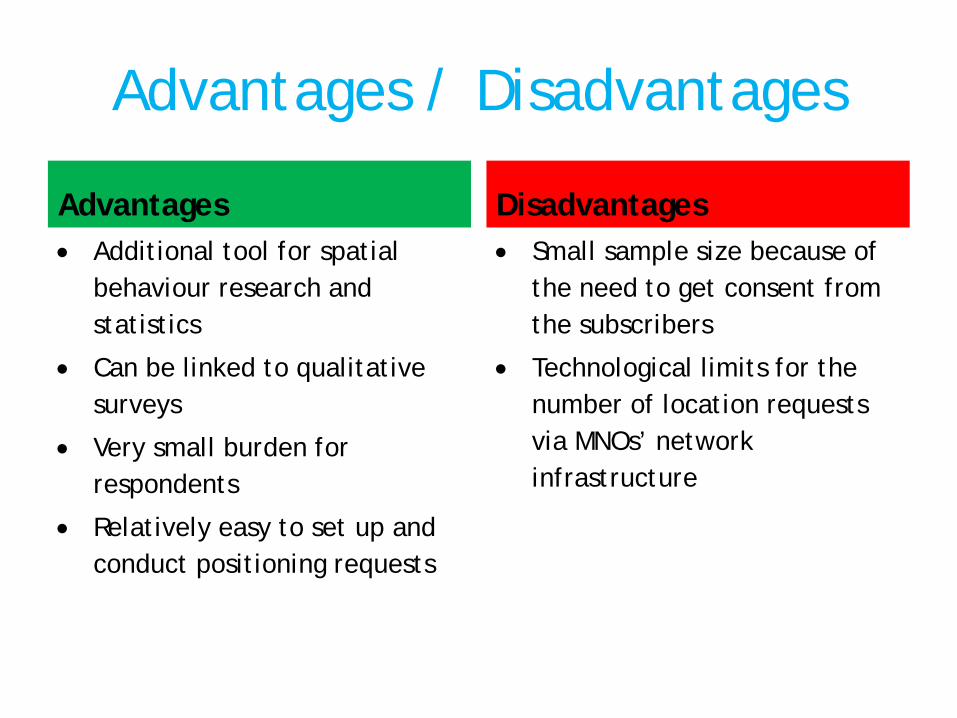
Advantages / Disadvantages
Advantages • Additional tool for spatial
behaviour research and statistics
• Can be linked to qualitative surveys
• Very small burden for respondents
• Relatively easy to set up and conduct positioning requests
Disadvantages • Small sample size because of
the need to get consent from the subscribers
• Technological limits for the number of location requests via MNOs’ network infrastructure
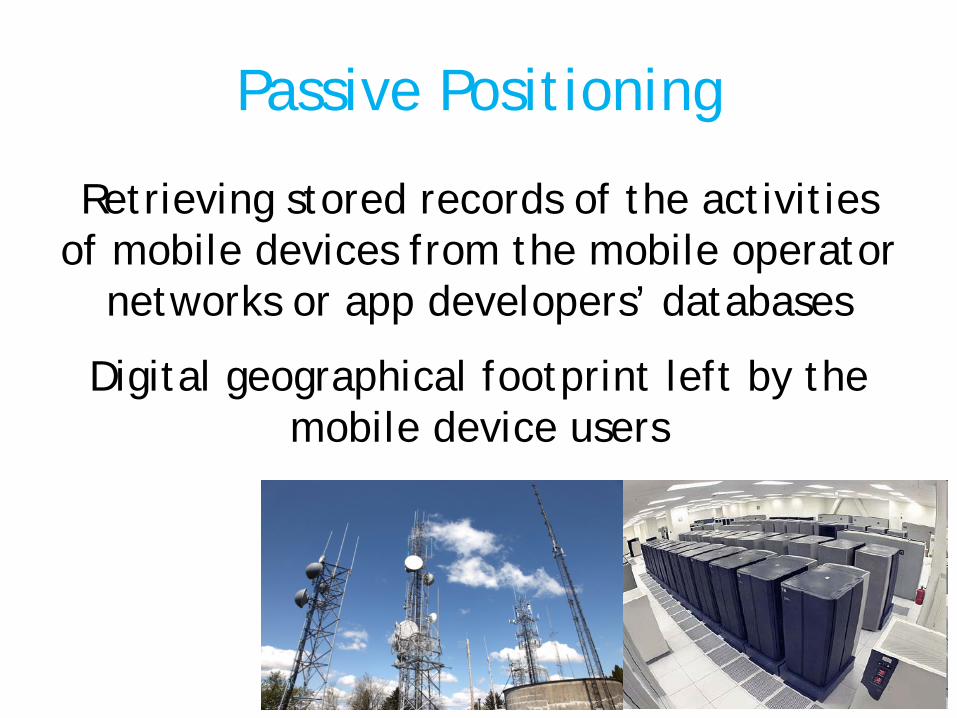
Passive Positioning
Retrieving stored records of the activities of mobile devices from the mobile operator
networks or app developers’ databases
Digital geographical footprint left by the mobile device users
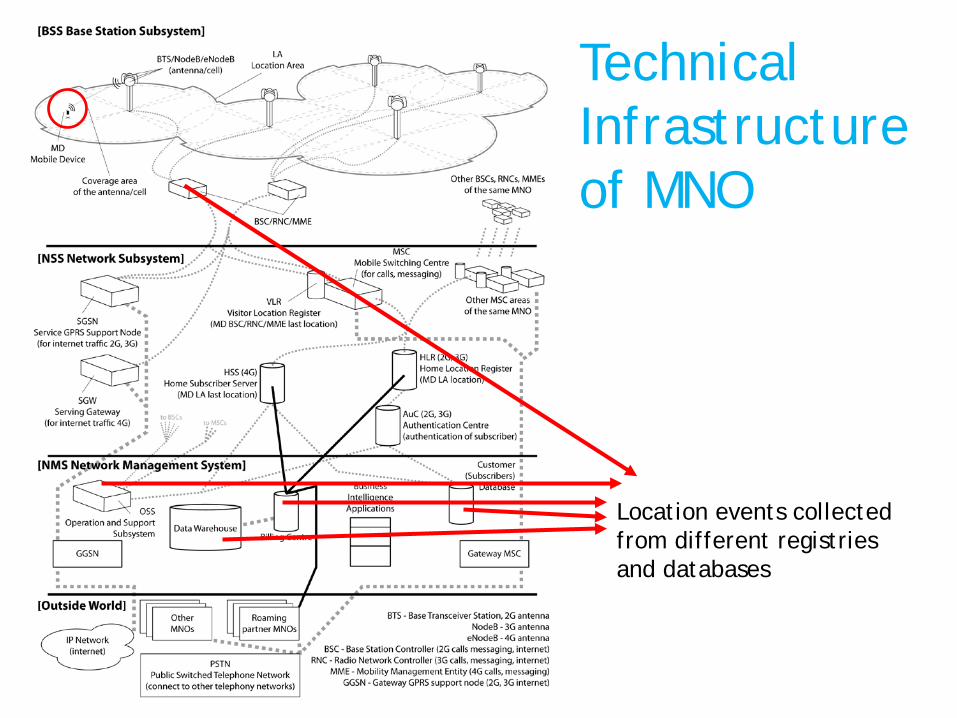
Location events collected from different registries and databases
Technical Infrastructure of MNO

Standards • CDMA (Code Division Multiple Access)
• 15-25 %
• Mostly N-America, Japan
• GSM (Global System for Mobiles)
• 75-85%
• The rest of the World
• Both systems are internally similar but mostly incompatible (roaming)
• Development of LTE (4G) should eliminate the differences
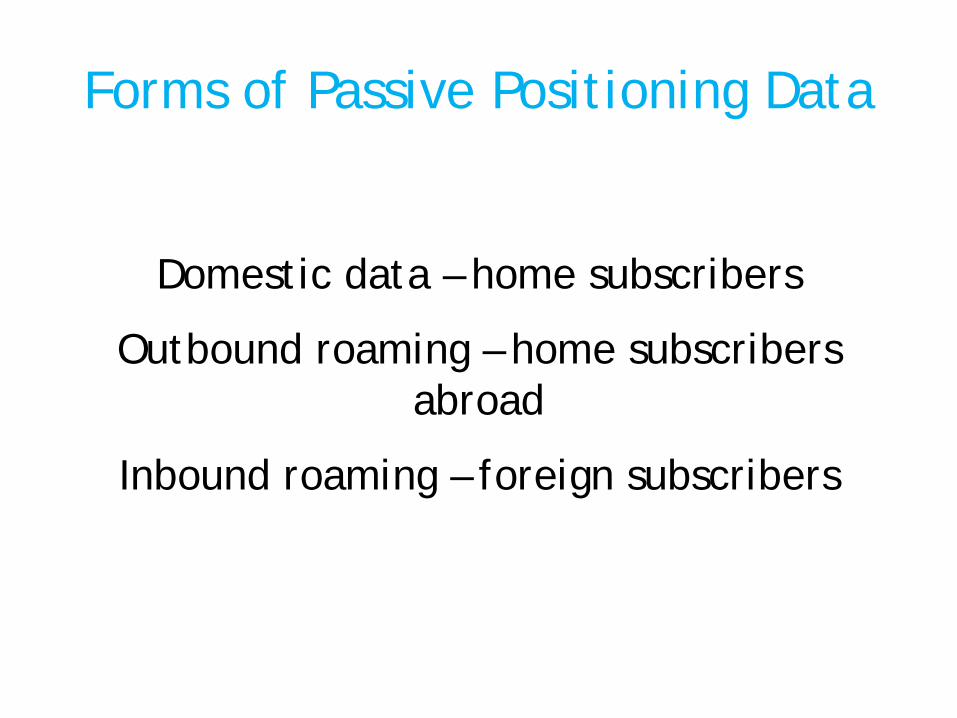
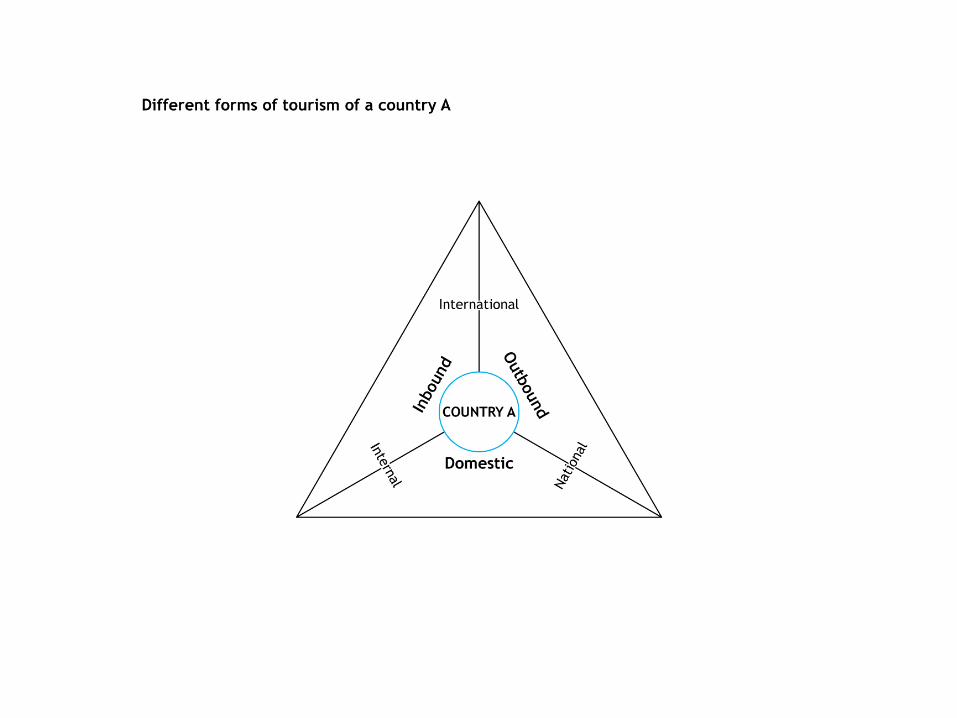
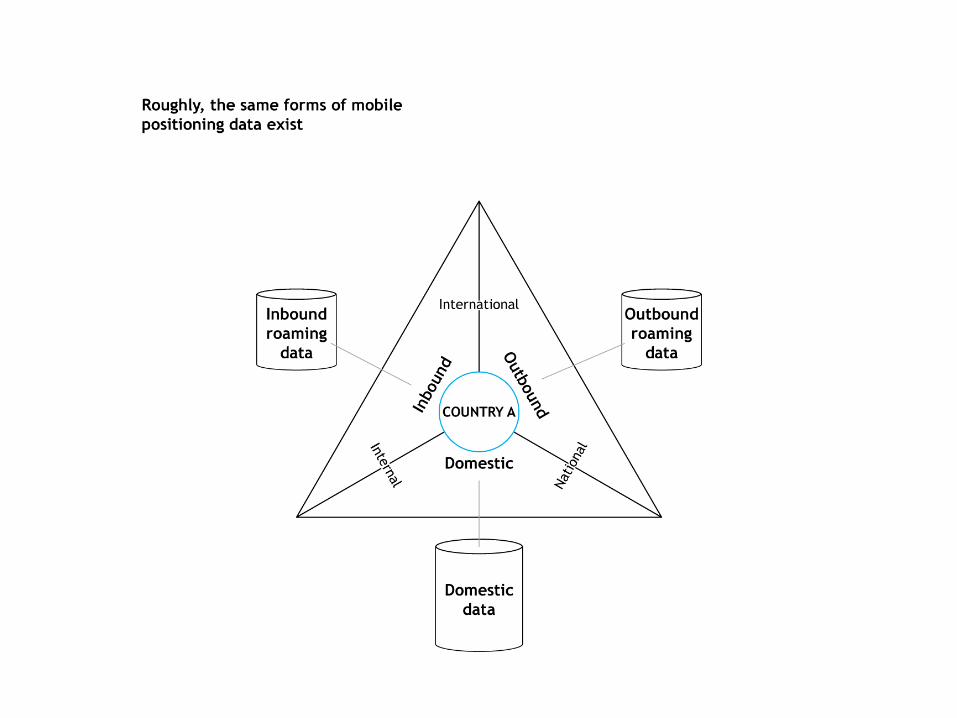
Forms of Passive Positioning Data
Domestic data – home subscribers
Outbound roaming – home subscribers abroad
Inbound roaming – foreign subscribers
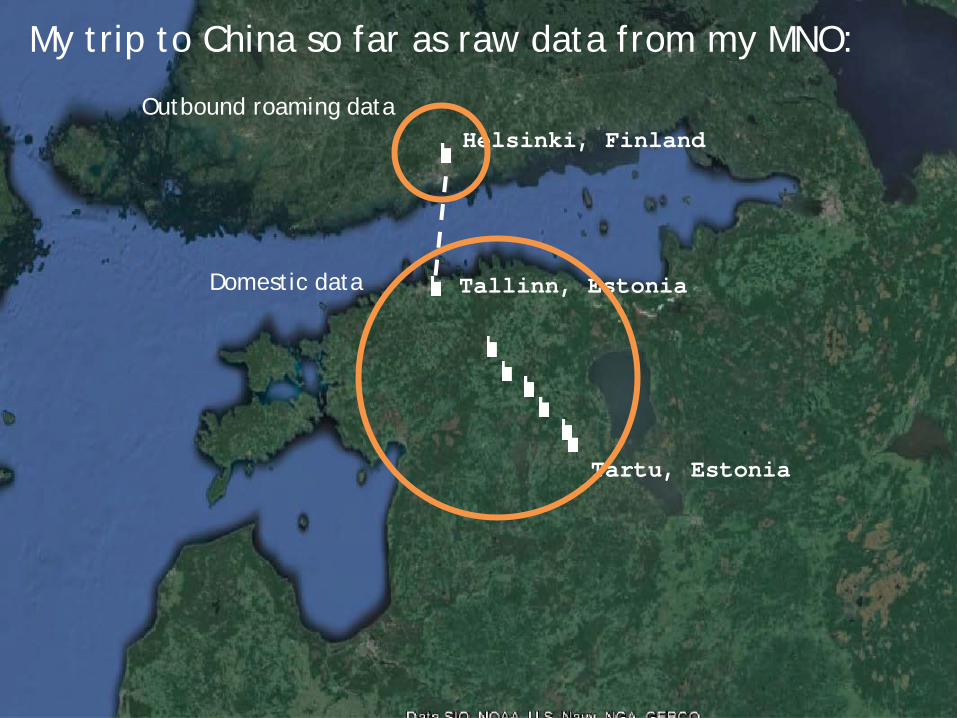
Tartu, Estonia
Tallinn, Estonia
Helsinki, Finland
My trip to China so far as raw data from my MNO:
Domestic data
Outbound roaming data
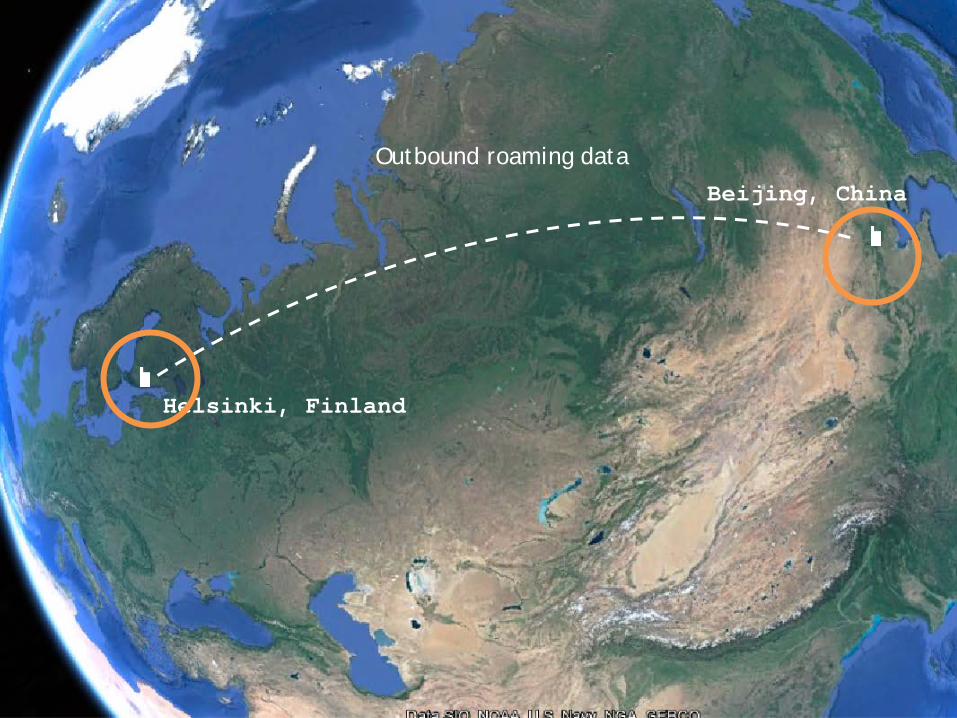
Helsinki, Finland
Beijing, China
Outbound roaming data
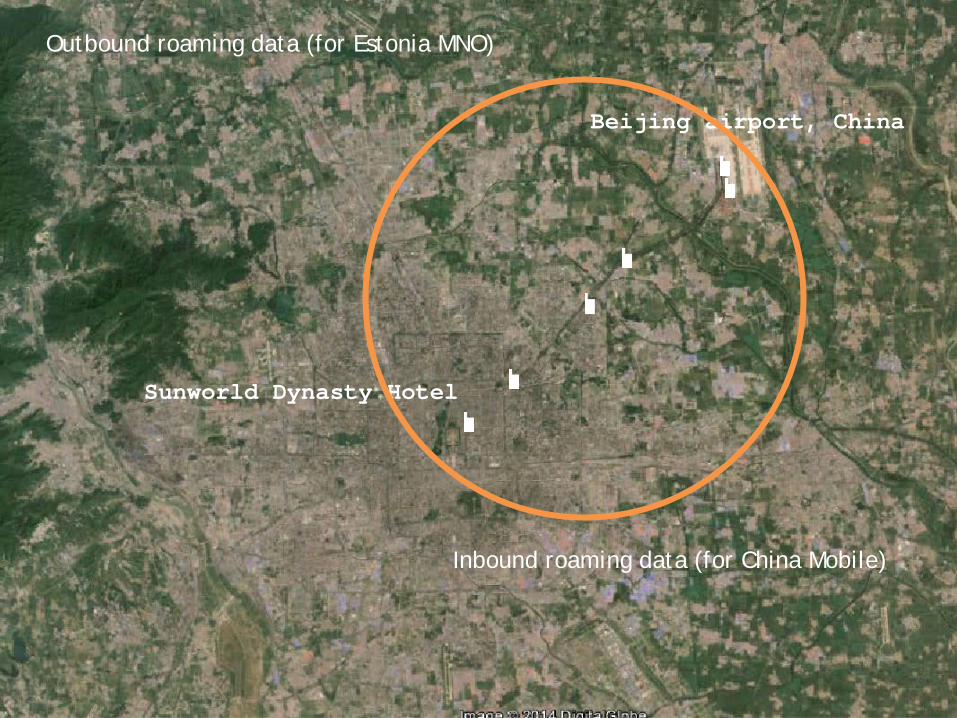
Beijing airport, China
Sunworld Dynasty Hotel
Outbound roaming data (for Estonia MNO)
Inbound roaming data (for China Mobile)
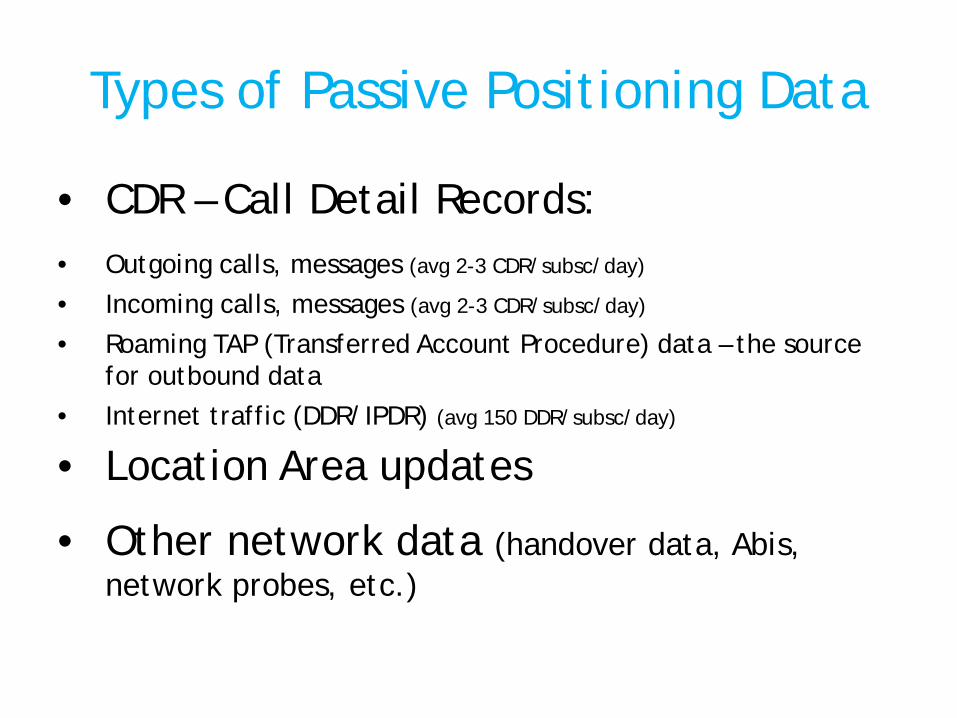
Types of Passive Positioning Data
• CDR – Call Detail Records: • Outgoing calls, messages (avg 2-3 CDR/subsc/day)
• Incoming calls, messages (avg 2-3 CDR/subsc/day)
• Roaming TAP (Transferred Account Procedure) data – the source for outbound data
• Internet traffic (DDR/IPDR) (avg 150 DDR/subsc/day)
• Location Area updates
• Other network data (handover data, Abis, network probes, etc.)
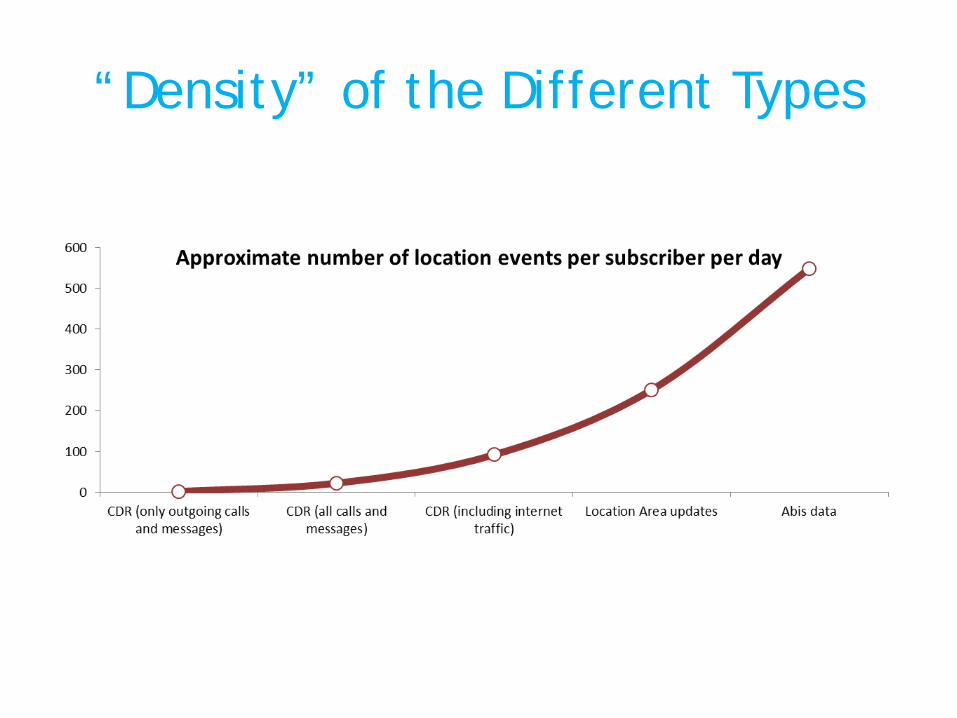
“Density” of the Different Types
ONE MONTH OF DATA 150M records / month
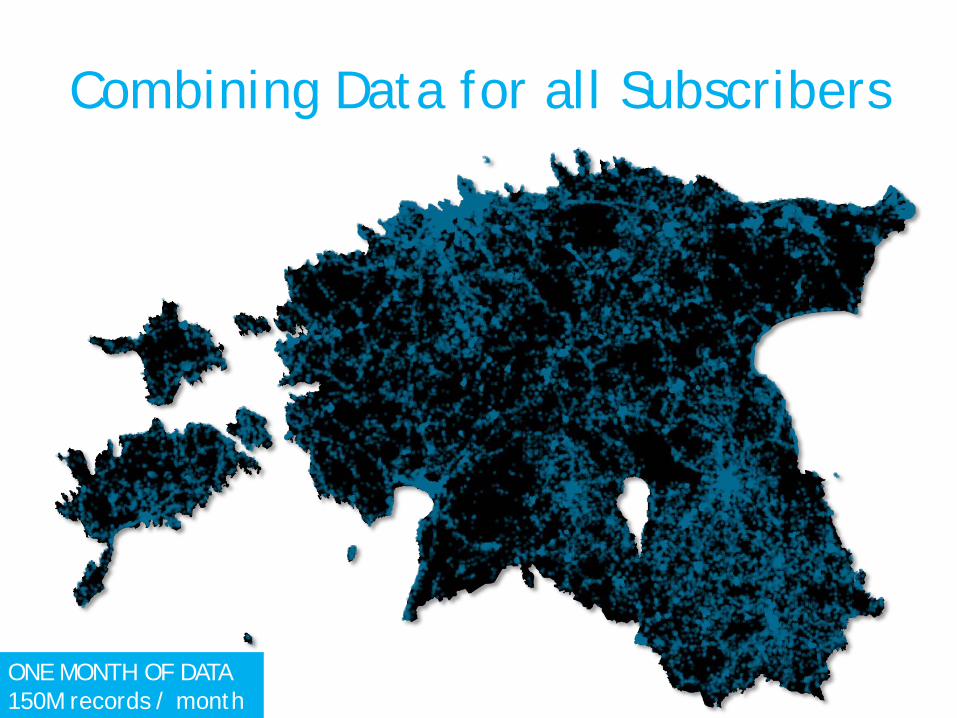
Combining Data for all Subscribers
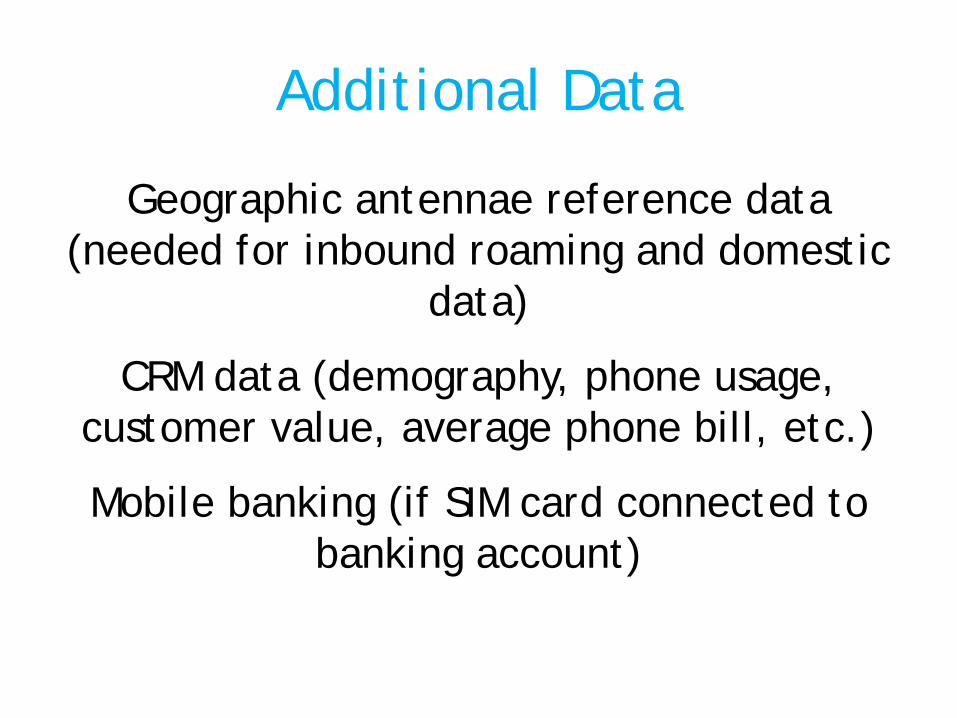
Additional Data
Geographic antennae reference data (needed for inbound roaming and domestic
data)
CRM data (demography, phone usage, customer value, average phone bill, etc.)
Mobile banking (if SIM card connected to banking account)
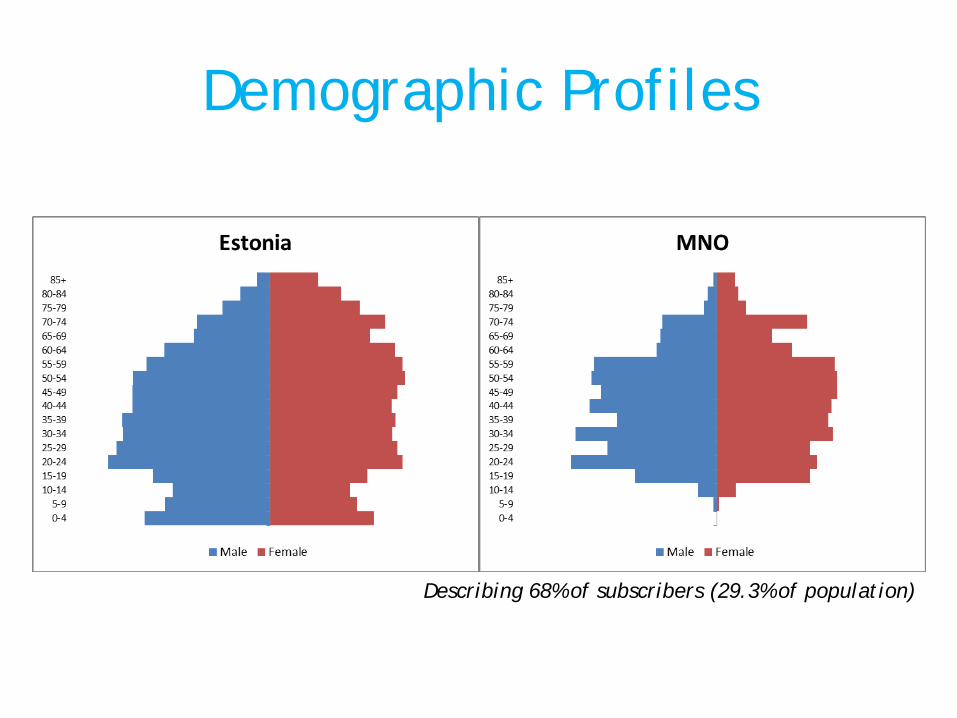
Demographic Profiles
Describing 68% of subscribers (29.3% of population)
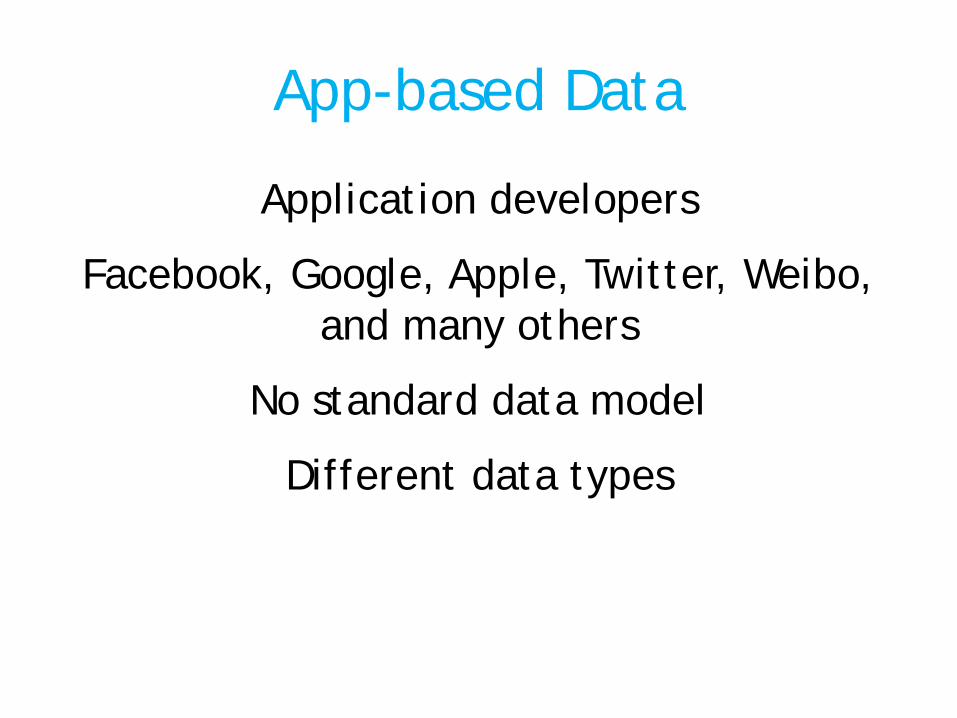
App-based Data
Application developers
Facebook, Google, Apple, Twitter, Weibo, and many others
No standard data model
Different data types
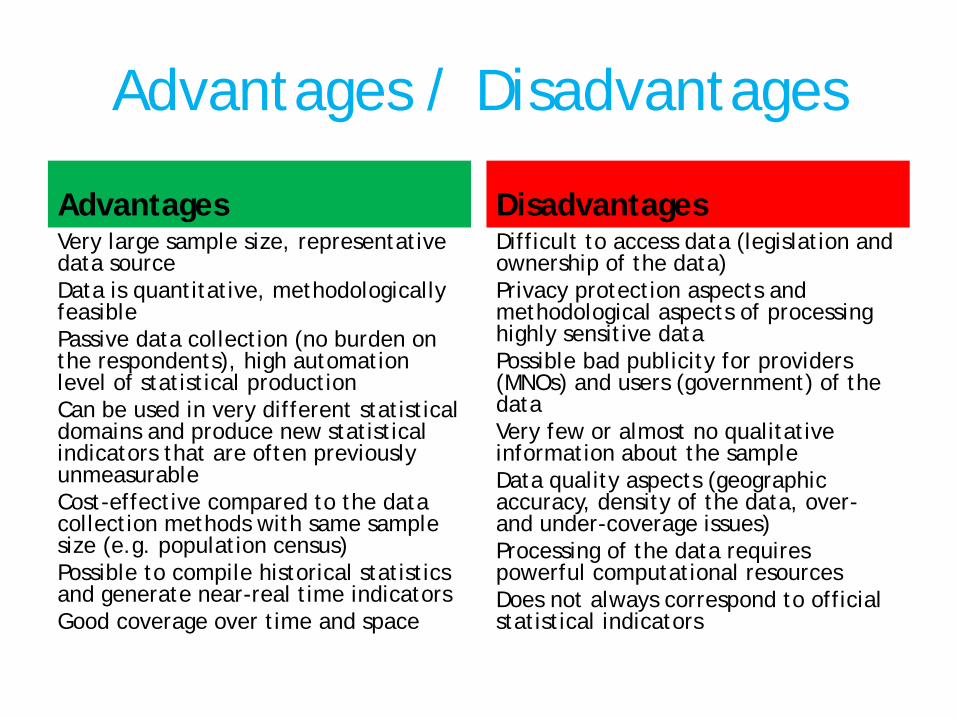
Advantages / Disadvantages
Advantages Very large sample size, representative data source Data is quantitative, methodologically feasible Passive data collection (no burden on the respondents), high automation level of statistical production Can be used in very different statistical domains and produce new statistical indicators that are often previously unmeasurable Cost-effective compared to the data collection methods with same sample size (e.g. population census) Possible to compile historical statistics and generate near-real time indicators Good coverage over time and space
Disadvantages Difficult to access data (legislation and ownership of the data) Privacy protection aspects and methodological aspects of processing highly sensitive data Possible bad publicity for providers (MNOs) and users (government) of the data Very few or almost no qualitative information about the sample Data quality aspects (geographic accuracy, density of the data, over- and under-coverage issues) Processing of the data requires powerful computational resources Does not always correspond to official statistical indicators

APPLICATIONS
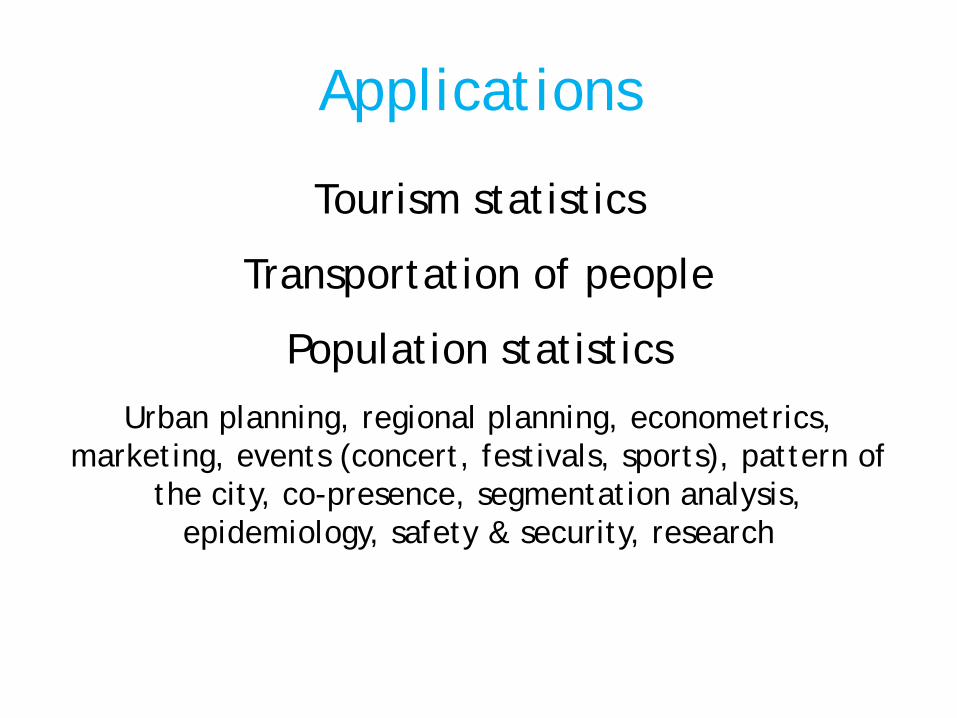
Applications
Tourism statistics
Transportation of people
Population statistics
Urban planning, regional planning, econometrics, marketing, events (concert, festivals, sports), pattern of
the city, co-presence, segmentation analysis, epidemiology, safety & security, research
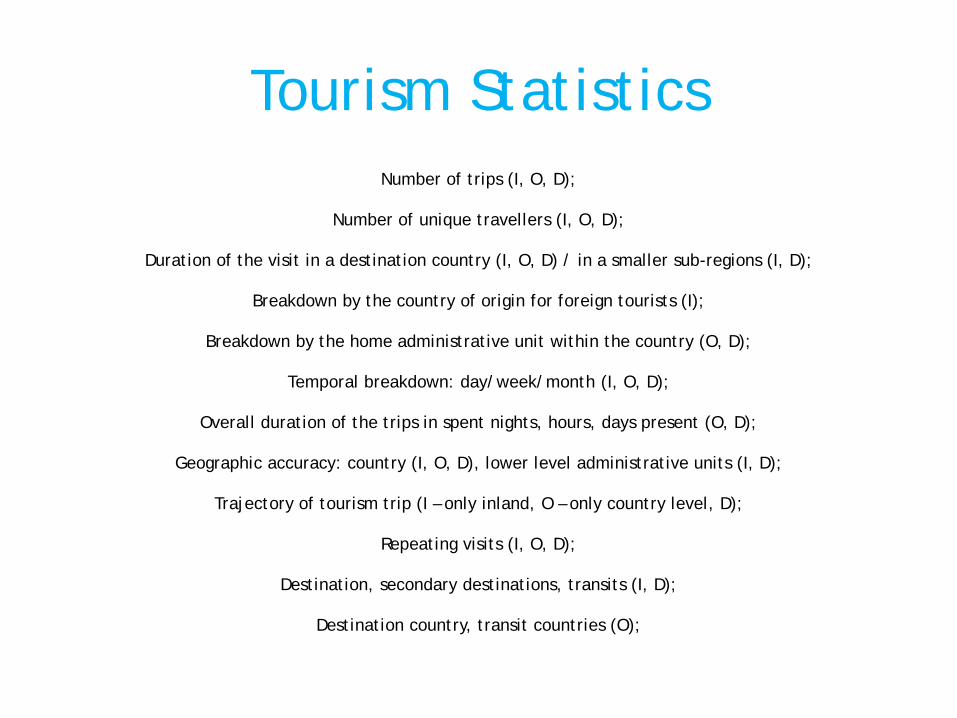
Tourism Statistics Number of trips (I, O, D);
Number of unique travellers (I, O, D);
Duration of the visit in a destination country (I, O, D) / in a smaller sub-regions (I, D);
Breakdown by the country of origin for foreign tourists (I);
Breakdown by the home administrative unit within the country (O, D);
Temporal breakdown: day/week/month (I, O, D);
Overall duration of the trips in spent nights, hours, days present (O, D);
Geographic accuracy: country (I, O, D), lower level administrative units (I, D);
Trajectory of tourism trip (I – only inland, O – only country level, D);
Repeating visits (I, O, D);
Destination, secondary destinations, transits (I, D);
Destination country, transit countries (O);
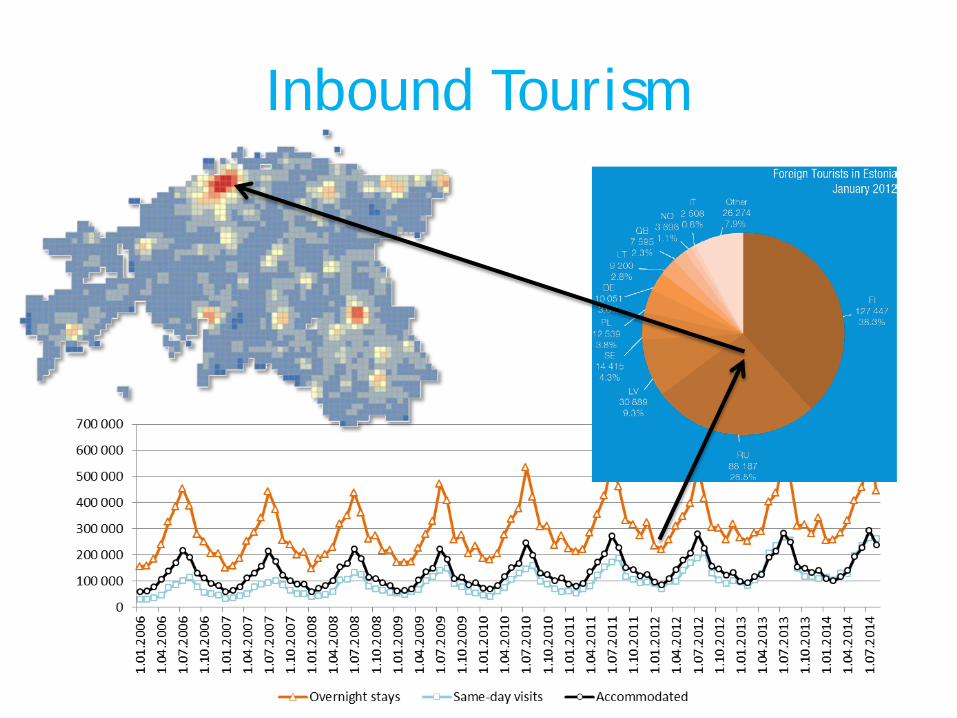
Inbound Tourism
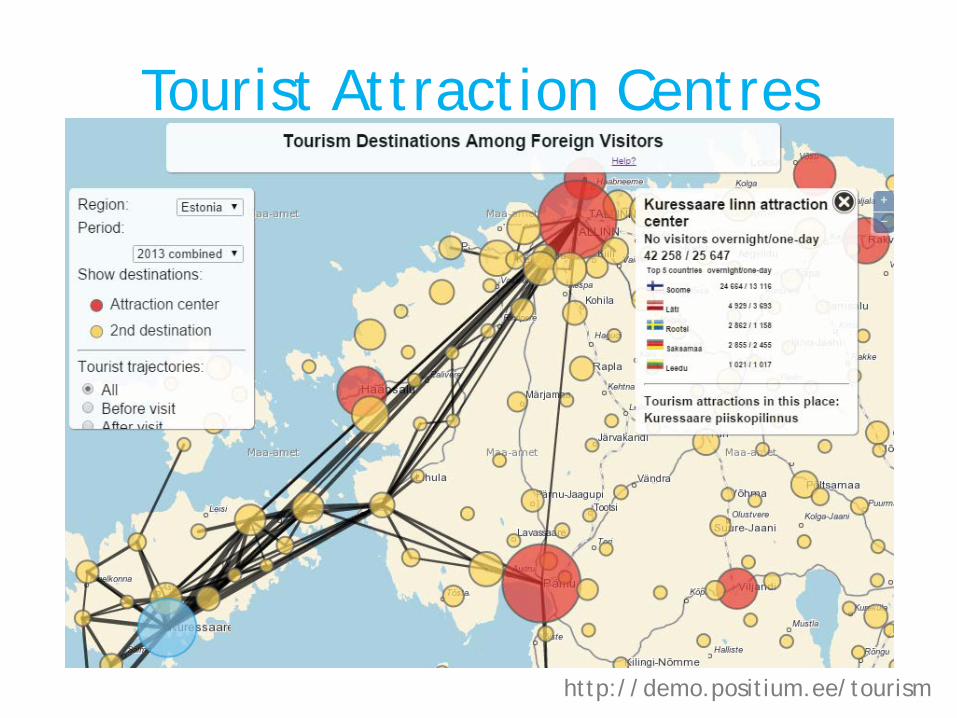
Tourist Attraction Centres
http://demo.positium.ee/tourism

Inbound roaming data
Activity of partners’ subscribers within home network
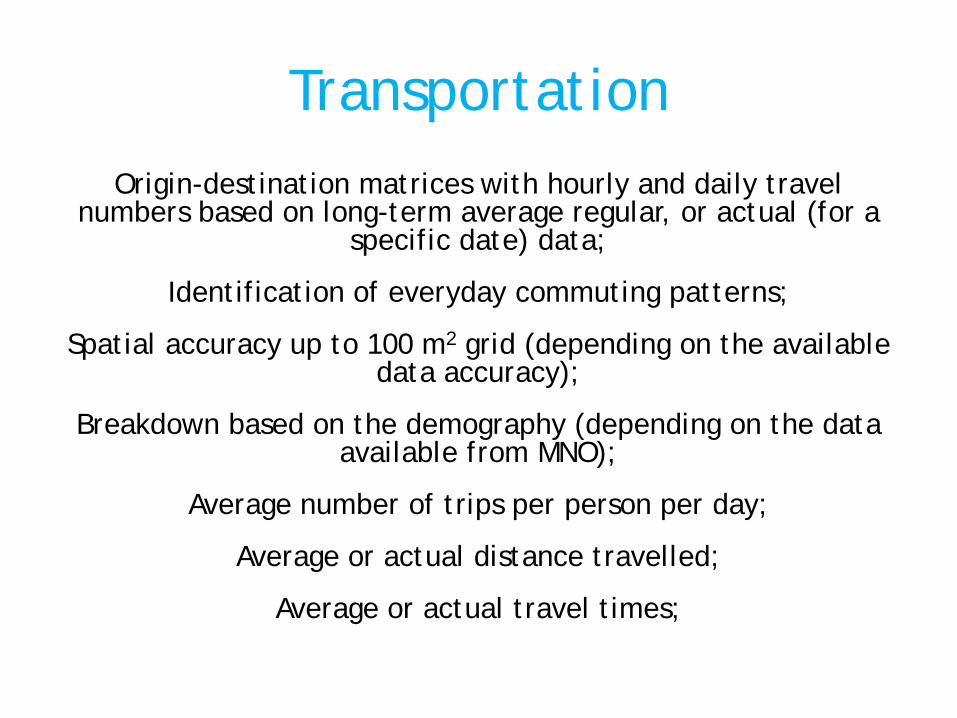
Transportation Origin-destination matrices with hourly and daily travel
numbers based on long-term average regular, or actual (for a specific date) data;
Identification of everyday commuting patterns;
Spatial accuracy up to 100 m2 grid (depending on the available data accuracy);
Breakdown based on the demography (depending on the data available from MNO);
Average number of trips per person per day;
Average or actual distance travelled;
Average or actual travel times;
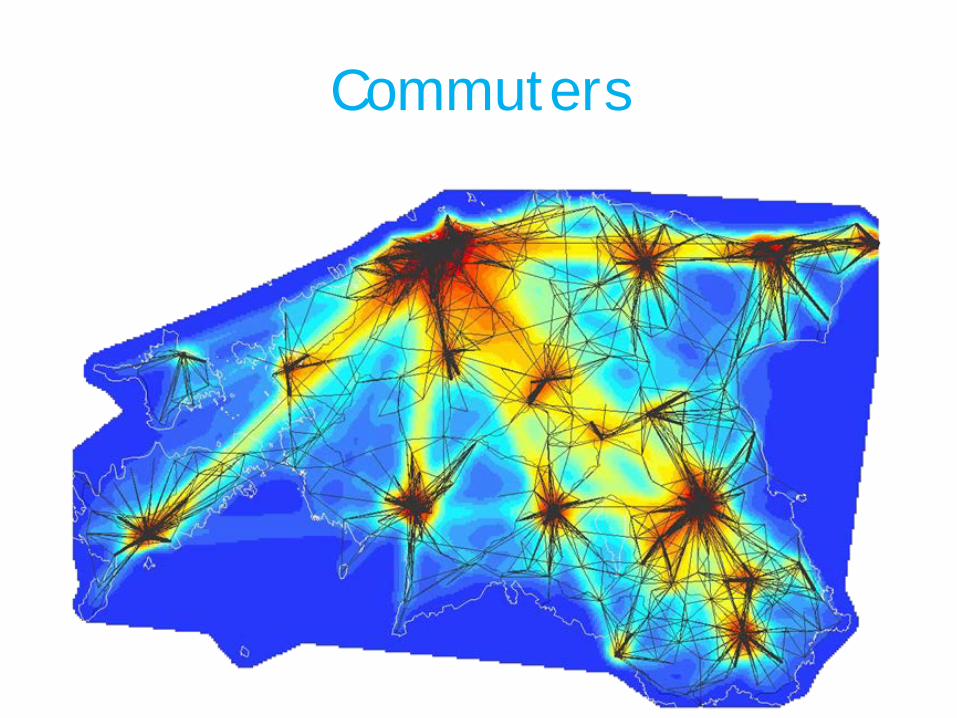
Commuters
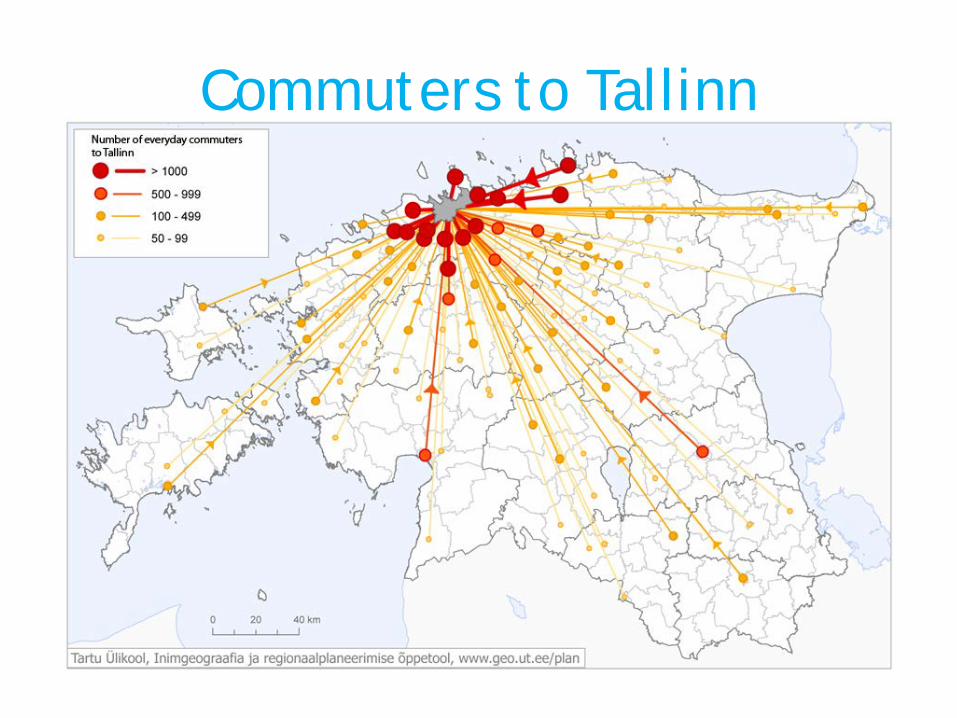
Commuters to Tallinn
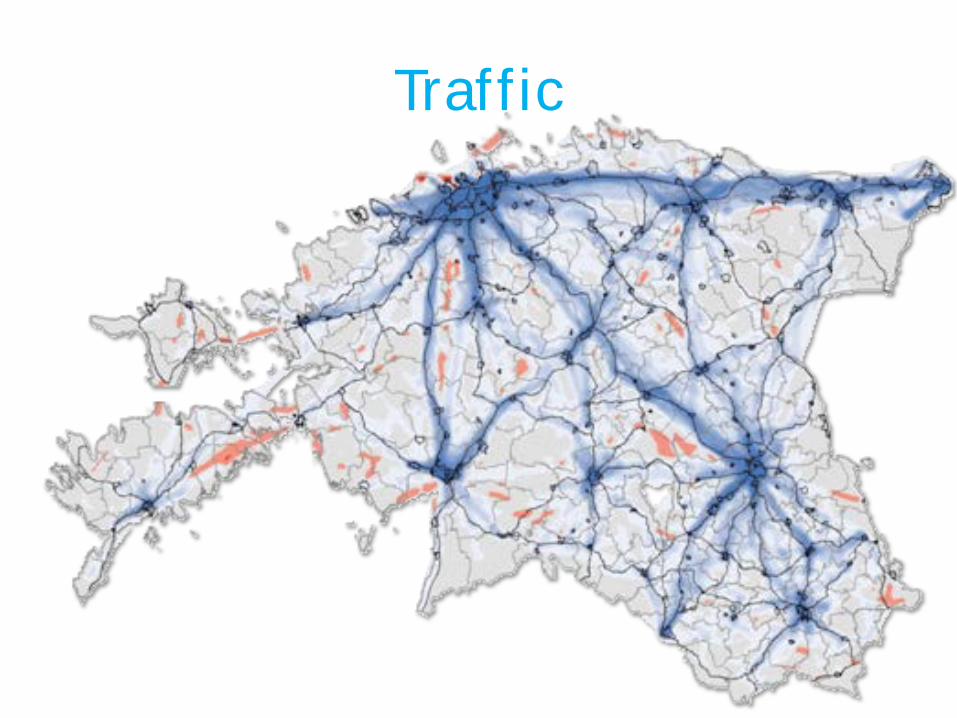
Traffic
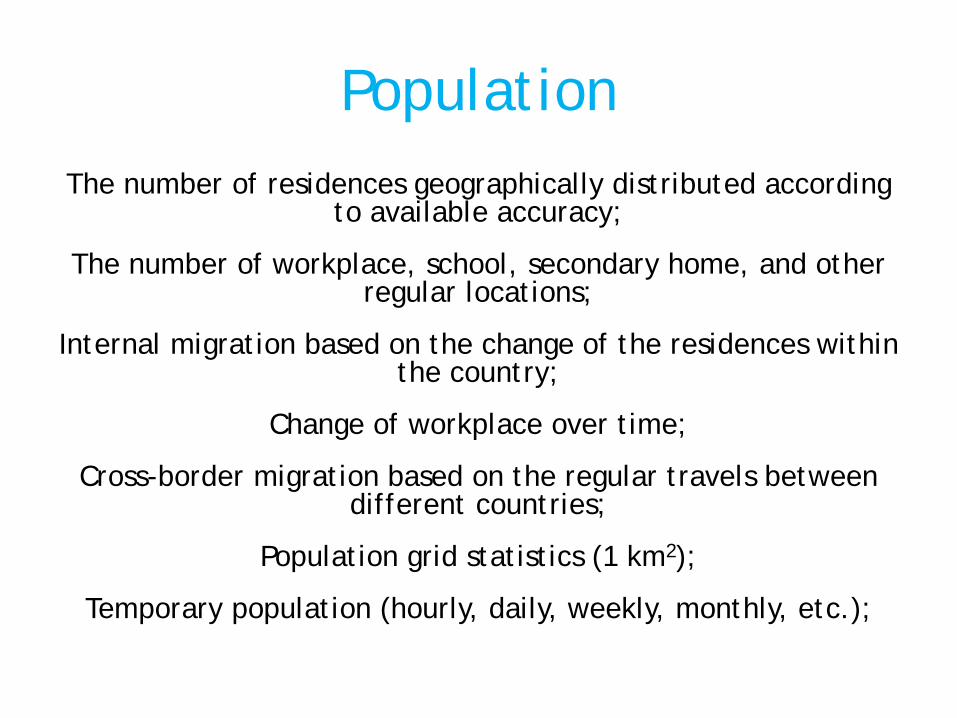
Population The number of residences geographically distributed according
to available accuracy;
The number of workplace, school, secondary home, and other regular locations;
Internal migration based on the change of the residences within the country;
Change of workplace over time;
Cross-border migration based on the regular travels between different countries;
Population grid statistics (1 km2);
Temporary population (hourly, daily, weekly, monthly, etc.);
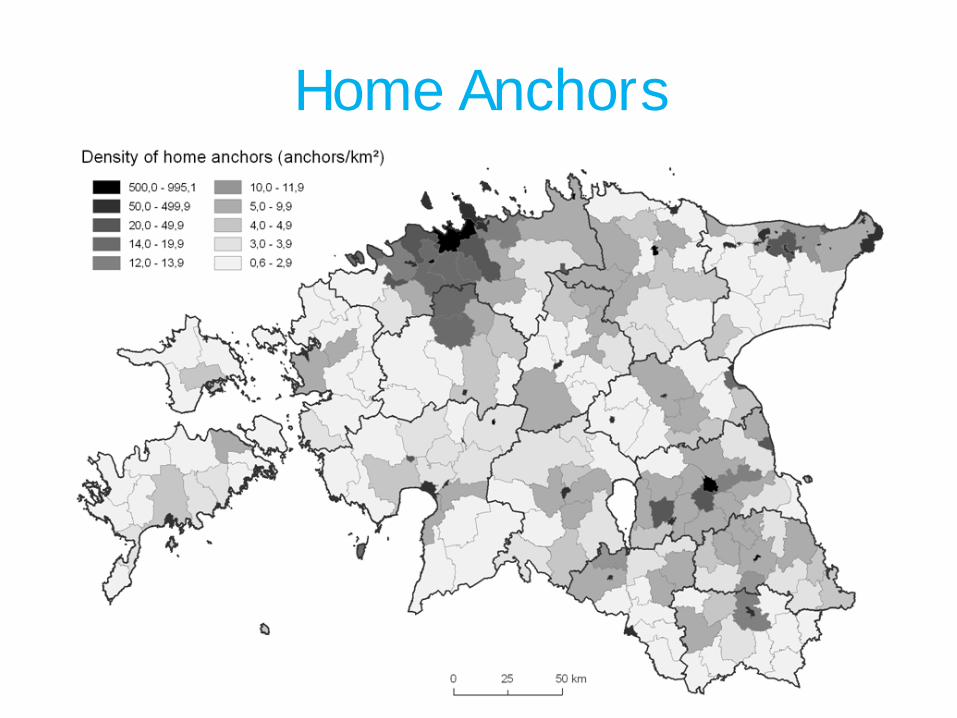
Home Anchors
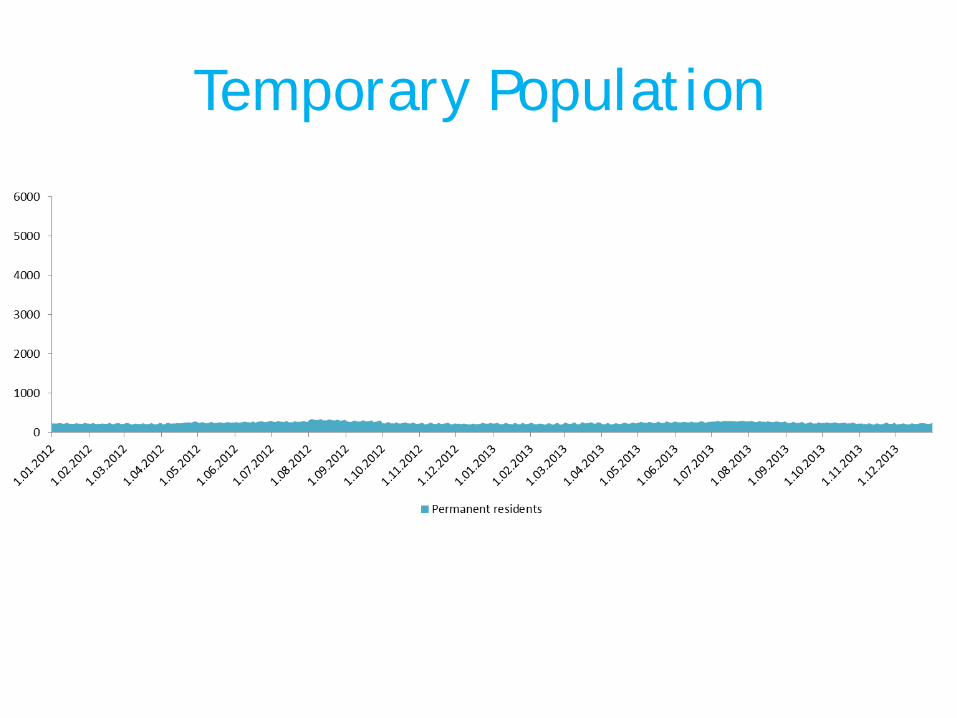
Temporary Population
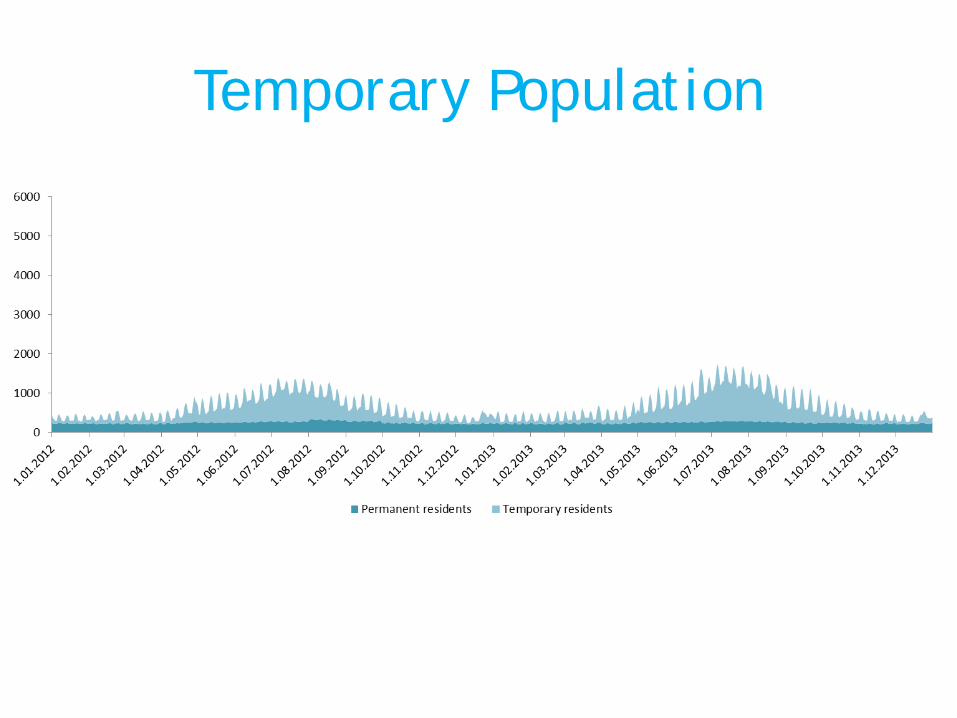
Temporary Population
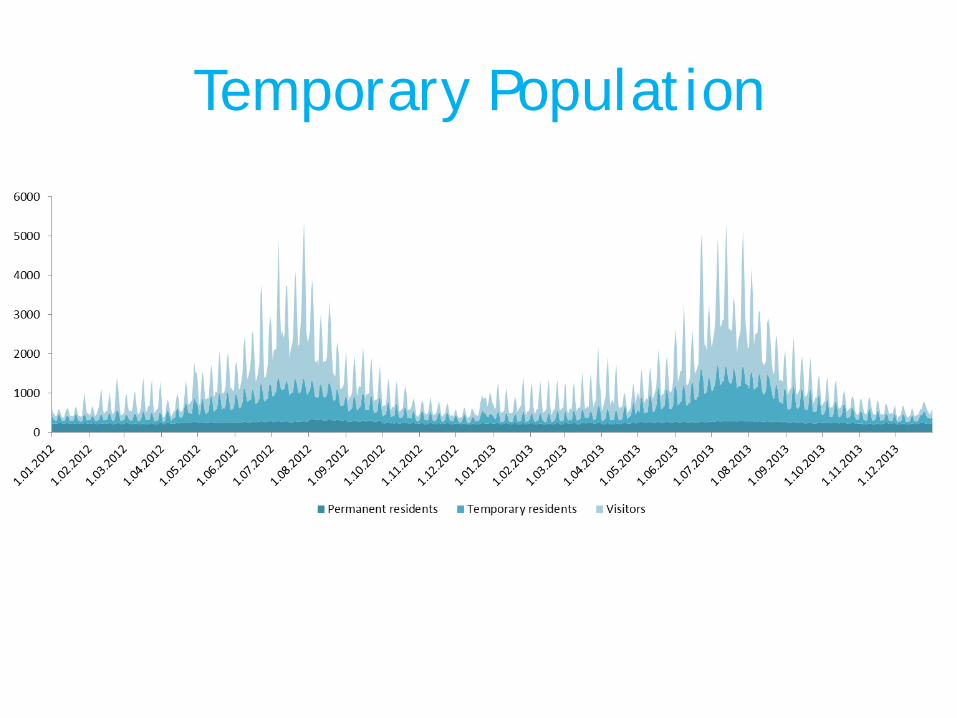
Temporary Population

CHALLENGES
Main Challenges
Access
Technological
Methodological
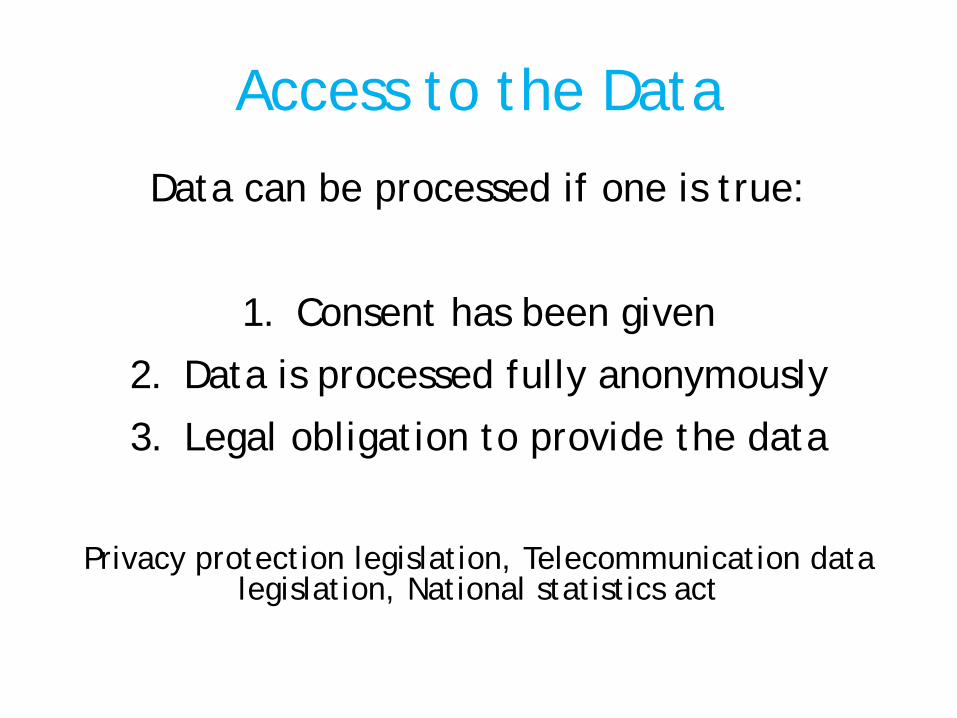
Access to the Data
Data can be processed if one is true:
1. Consent has been given
2. Data is processed fully anonymously
3. Legal obligation to provide the data
Privacy protection legislation, Telecommunication data
legislation, National statistics act

Access to the Data
Business aspect for MNOs
Administrative aspect – who is processing the data?
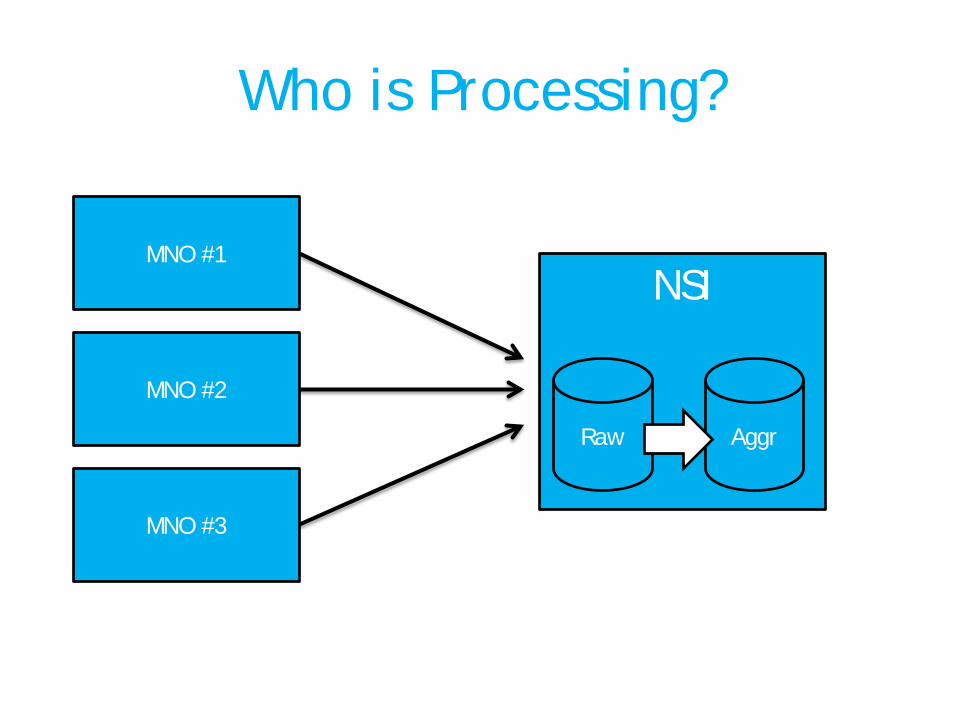
Who is Processing?
MNO #1
MNO #2
MNO #3
NSI
Raw Aggr
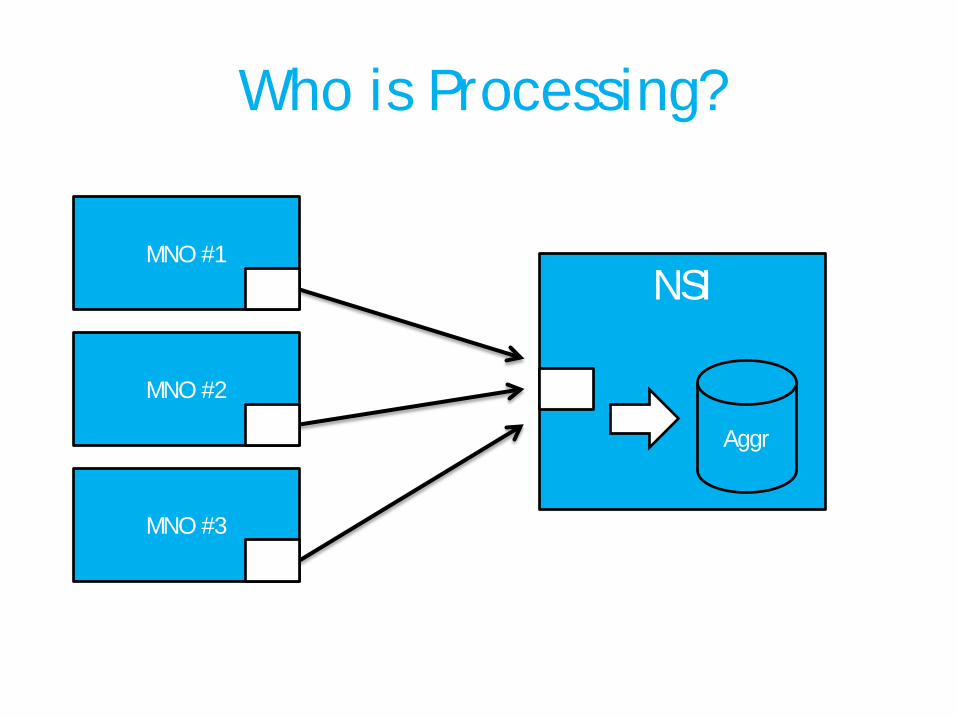
Who is Processing?
MNO #1
MNO #2
MNO #3
NSI
Aggr
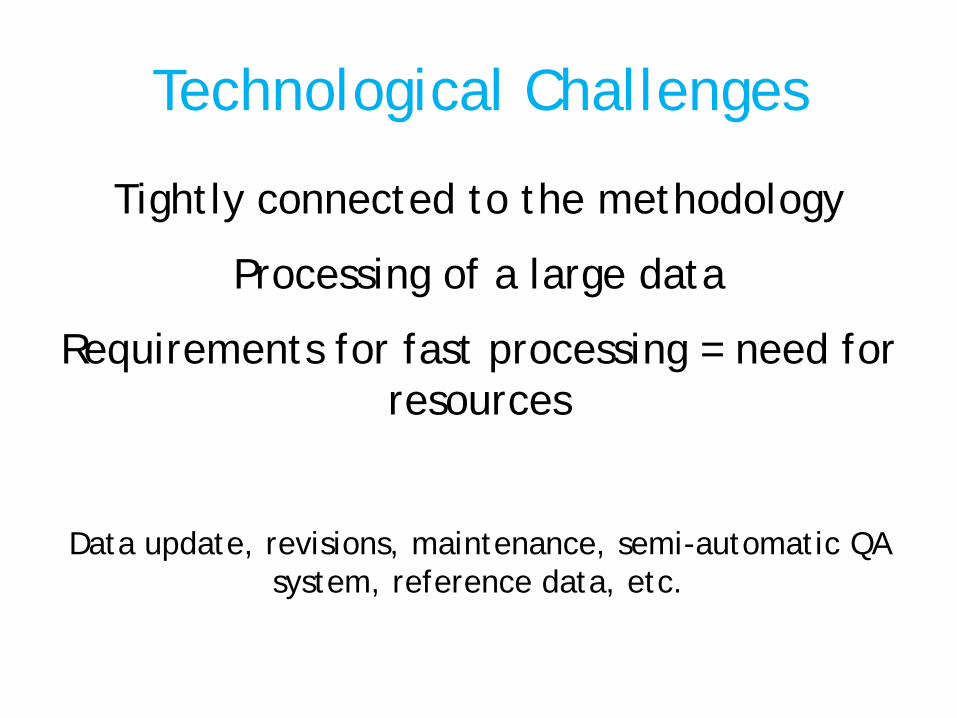
Technological Challenges
Tightly connected to the methodology
Processing of a large data
Requirements for fast processing = need for resources
Data update, revisions, maintenance, semi-automatic QA system, reference data, etc.
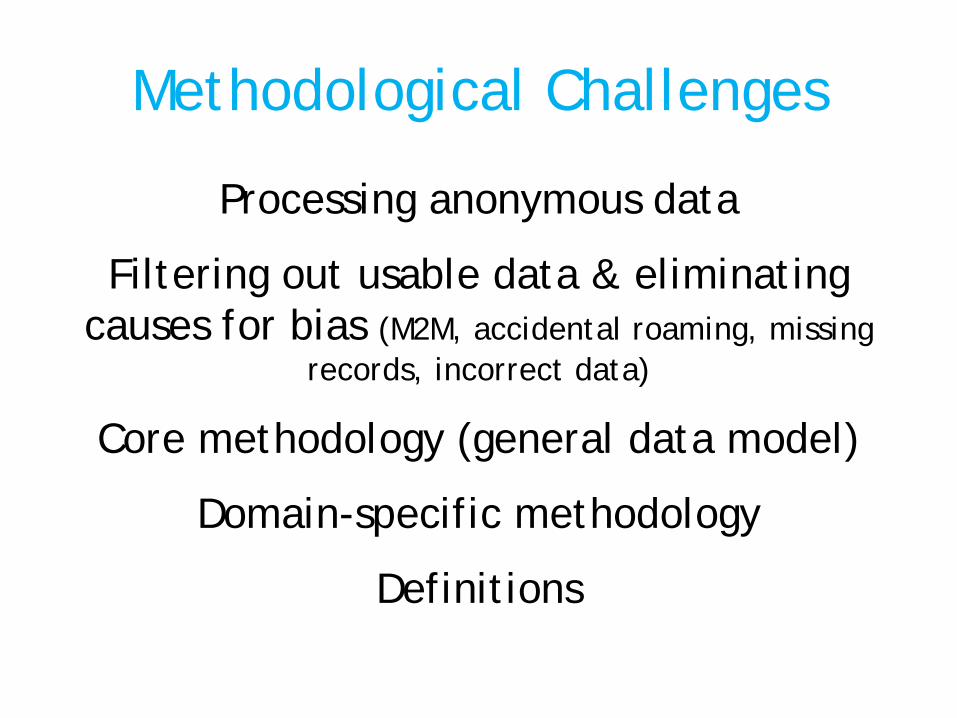
Methodological Challenges
Processing anonymous data
Filtering out usable data & eliminating causes for bias (M2M, accidental roaming, missing
records, incorrect data)
Core methodology (general data model)
Domain-specific methodology
Definitions
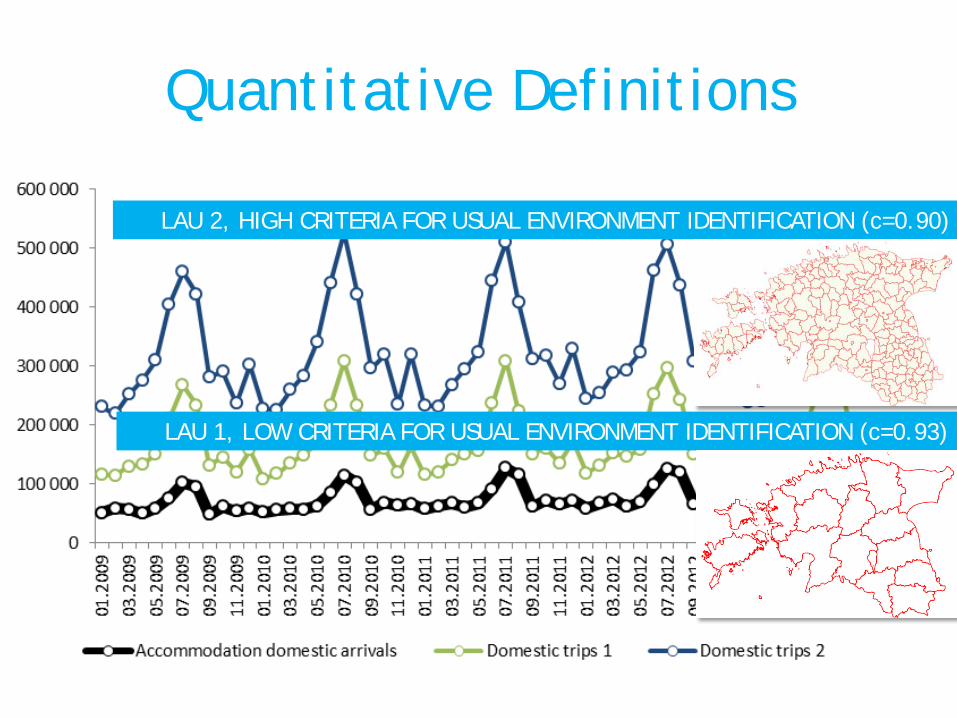
Quantitative Definitions
LAU 1, LOW CRITERIA FOR USUAL ENVIRONMENT IDENTIFICATION (c=0.93)
LAU 2, HIGH CRITERIA FOR USUAL ENVIRONMENT IDENTIFICATION (c=0.90)
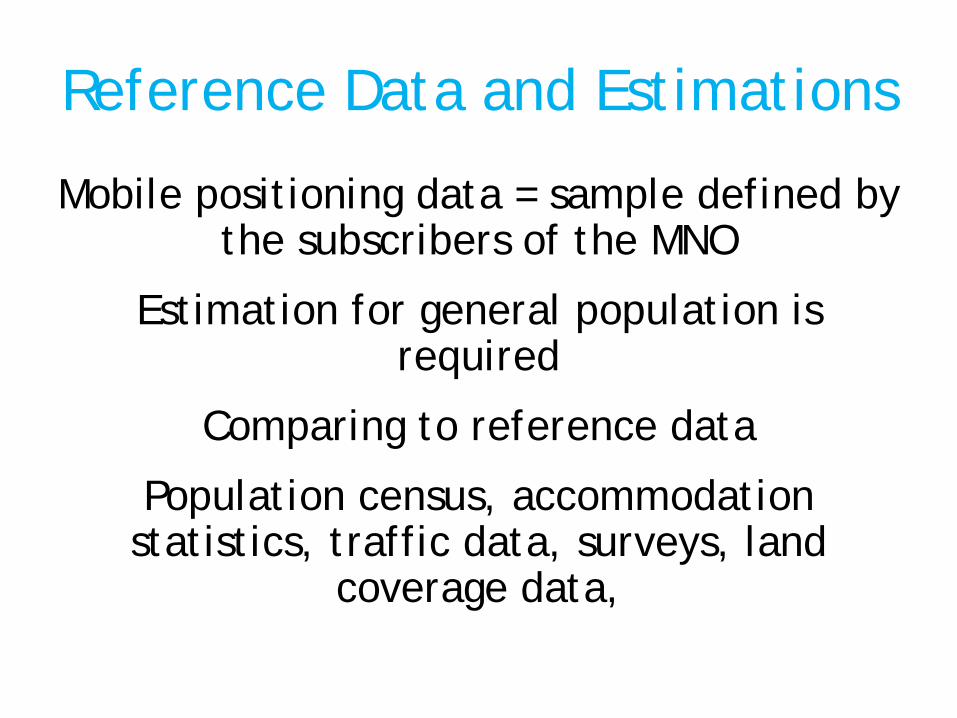
Reference Data and Estimations
Mobile positioning data = sample defined by the subscribers of the MNO
Estimation for general population is required
Comparing to reference data
Population census, accommodation statistics, traffic data, surveys, land
coverage data,
EUROSTAT Feasibility Study on the Use of Mobile Positioning Data for Tourism Statistics
Read the consolidated report or in-depth reports:
http://epp.eurostat.ec.europa.eu/portal/page/portal/tourism/methodology/projects_and_studies