Embed Size (px)
Citation preview
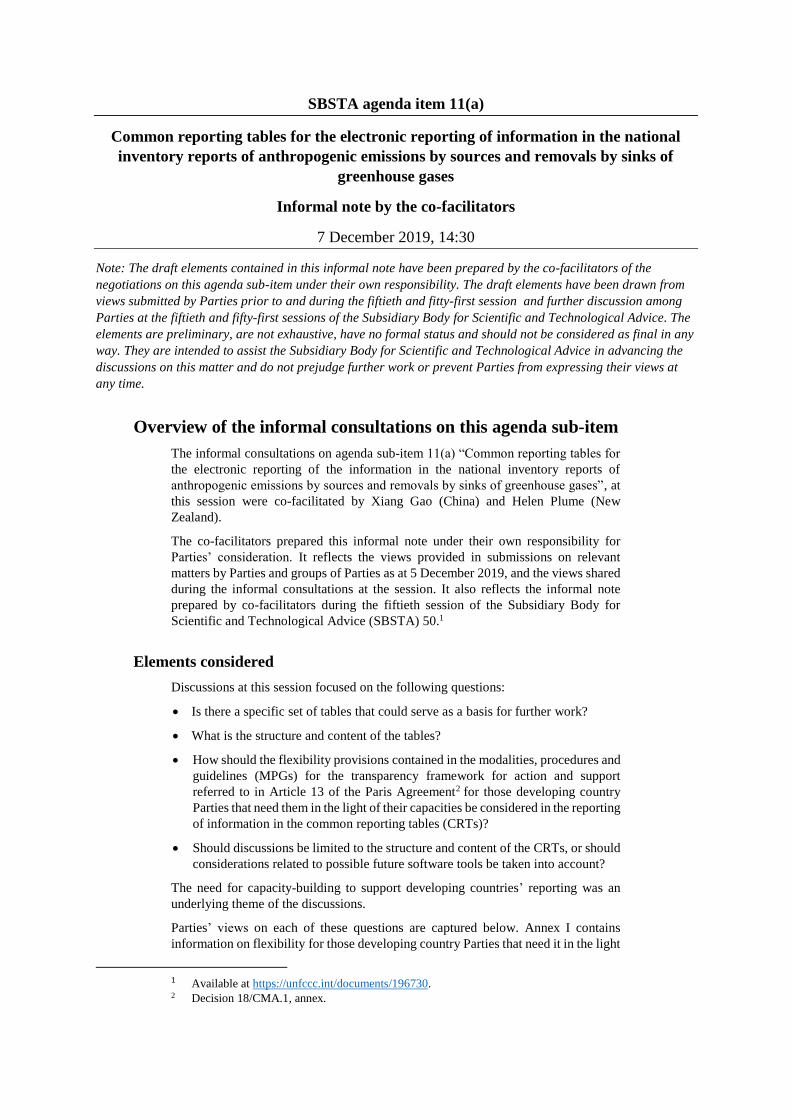
SBSTA agenda item 11(a)
Common reporting tables for the electronic reporting of information in the national
inventory reports of anthropogenic emissions by sources and removals by sinks of
greenhouse gases
Informal note by the co-facilitators
7 December 2019, 14:30
Note: The draft elements contained in this informal note have been prepared by the co-facilitators of the
negotiations on this agenda sub-item under their own responsibility. The draft elements have been drawn from
views submitted by Parties prior to and during the fiftieth and fitty-first session and further discussion among
Parties at the fiftieth and fifty-first sessions of the Subsidiary Body for Scientific and Technological Advice. The
elements are preliminary, are not exhaustive, have no formal status and should not be considered as final in any
way. They are intended to assist the Subsidiary Body for Scientific and Technological Advice in advancing the
discussions on this matter and do not prejudge further work or prevent Parties from expressing their views at
any time.
Overview of the informal consultations on this agenda sub-item
The informal consultations on agenda sub-item 11(a) “Common reporting tables for
the electronic reporting of the information in the national inventory reports of
anthropogenic emissions by sources and removals by sinks of greenhouse gases”, at
this session were co-facilitated by Xiang Gao (China) and Helen Plume (New
Zealand).
The co-facilitators prepared this informal note under their own responsibility for
Parties’ consideration. It reflects the views provided in submissions on relevant
matters by Parties and groups of Parties as at 5 December 2019, and the views shared
during the informal consultations at the session. It also reflects the informal note
prepared by co-facilitators during the fiftieth session of the Subsidiary Body for
Scientific and Technological Advice (SBSTA) 50.1
Elements considered
Discussions at this session focused on the following questions:
• Is there a specific set of tables that could serve as a basis for further work?
• What is the structure and content of the tables?
• How should the flexibility provisions contained in the modalities, procedures and
guidelines (MPGs) for the transparency framework for action and support
referred to in Article 13 of the Paris Agreement2 for those developing country
Parties that need them in the light of their capacities be considered in the reporting
of information in the common reporting tables (CRTs)?
• Should discussions be limited to the structure and content of the CRTs, or should
considerations related to possible future software tools be taken into account?
The need for capacity-building to support developing countries’ reporting was an
underlying theme of the discussions.
Parties’ views on each of these questions are captured below. Annex I contains
information on flexibility for those developing country Parties that need it in the light
1 Available at https://unfccc.int/documents/196730. 2 Decision 18/CMA.1, annex.
2
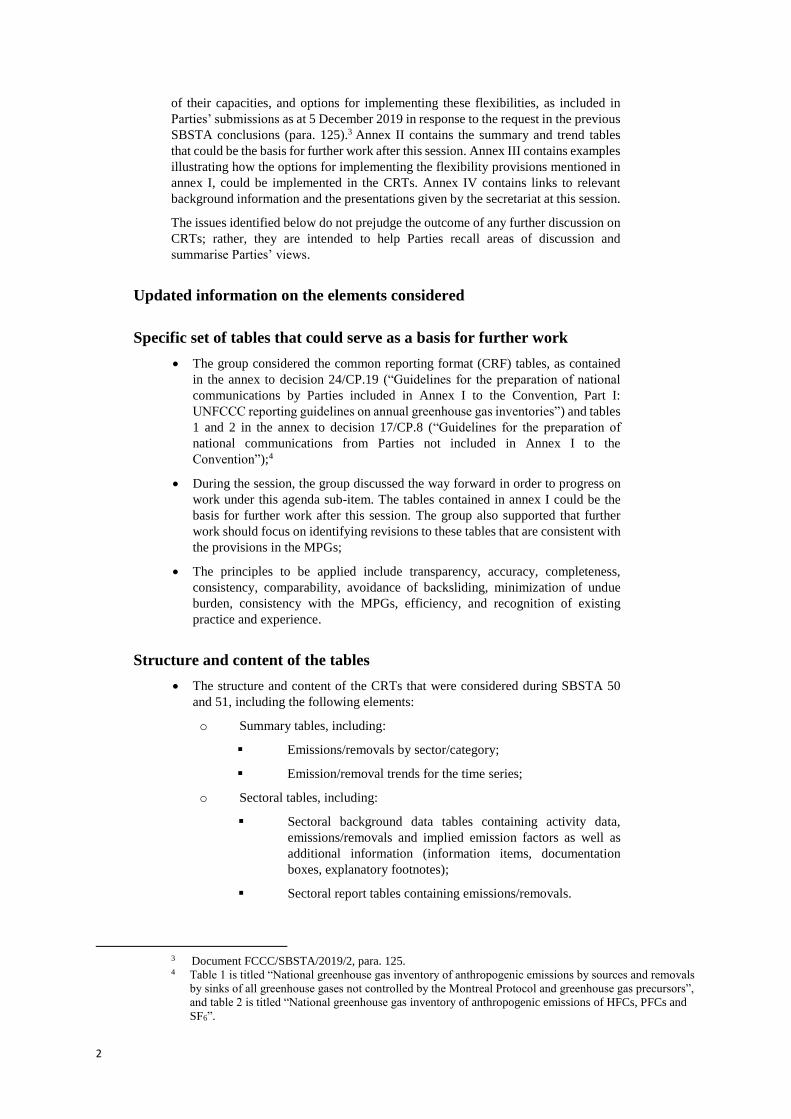
of their capacities, and options for implementing these flexibilities, as included in
Parties’ submissions as at 5 December 2019 in response to the request in the previous
SBSTA conclusions (para. 125).3 Annex II contains the summary and trend tables
that could be the basis for further work after this session. Annex III contains examples
illustrating how the options for implementing the flexibility provisions mentioned in
annex I, could be implemented in the CRTs. Annex IV contains links to relevant
background information and the presentations given by the secretariat at this session.
The issues identified below do not prejudge the outcome of any further discussion on
CRTs; rather, they are intended to help Parties recall areas of discussion and
summarise Parties’ views.
Updated information on the elements considered
Specific set of tables that could serve as a basis for further work
• The group considered the common reporting format (CRF) tables, as contained
in the annex to decision 24/CP.19 (“Guidelines for the preparation of national
communications by Parties included in Annex I to the Convention, Part I:
UNFCCC reporting guidelines on annual greenhouse gas inventories”) and tables
1 and 2 in the annex to decision 17/CP.8 (“Guidelines for the preparation of
national communications from Parties not included in Annex I to the
Convention”);4
• During the session, the group discussed the way forward in order to progress on
work under this agenda sub-item. The tables contained in annex I could be the
basis for further work after this session. The group also supported that further
work should focus on identifying revisions to these tables that are consistent with
the provisions in the MPGs;
• The principles to be applied include transparency, accuracy, completeness,
consistency, comparability, avoidance of backsliding, minimization of undue
burden, consistency with the MPGs, efficiency, and recognition of existing
practice and experience.
Structure and content of the tables
• The structure and content of the CRTs that were considered during SBSTA 50
and 51, including the following elements:
o Summary tables, including:
▪ Emissions/removals by sector/category;
▪ Emission/removal trends for the time series;
o Sectoral tables, including:
▪ Sectoral background data tables containing activity data,
emissions/removals and implied emission factors as well as
additional information (information items, documentation
boxes, explanatory footnotes);
▪ Sectoral report tables containing emissions/removals.
3 Document FCCC/SBSTA/2019/2, para. 125. 4 Table 1 is titled “National greenhouse gas inventory of anthropogenic emissions by sources and removals
by sinks of all greenhouse gases not controlled by the Montreal Protocol and greenhouse gas precursors”,
and table 2 is titled “National greenhouse gas inventory of anthropogenic emissions of HFCs, PFCs and
SF6”.
3
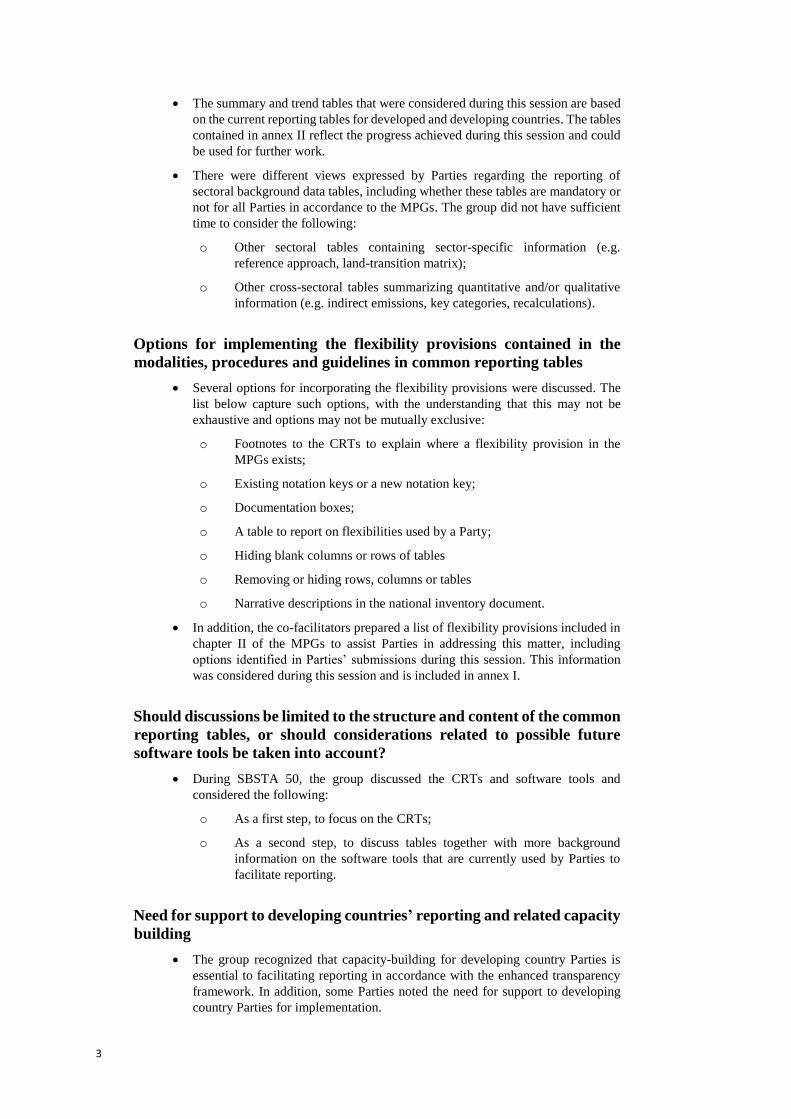
• The summary and trend tables that were considered during this session are based
on the current reporting tables for developed and developing countries. The tables
contained in annex II reflect the progress achieved during this session and could
be used for further work.
• There were different views expressed by Parties regarding the reporting of
sectoral background data tables, including whether these tables are mandatory or
not for all Parties in accordance to the MPGs. The group did not have sufficient
time to consider the following:
o Other sectoral tables containing sector-specific information (e.g.
reference approach, land-transition matrix);
o Other cross-sectoral tables summarizing quantitative and/or qualitative
information (e.g. indirect emissions, key categories, recalculations).
Options for implementing the flexibility provisions contained in the
modalities, procedures and guidelines in common reporting tables
• Several options for incorporating the flexibility provisions were discussed. The
list below capture such options, with the understanding that this may not be
exhaustive and options may not be mutually exclusive:
o Footnotes to the CRTs to explain where a flexibility provision in the
MPGs exists;
o Existing notation keys or a new notation key;
o Documentation boxes;
o A table to report on flexibilities used by a Party;
o Hiding blank columns or rows of tables
o Removing or hiding rows, columns or tables
o Narrative descriptions in the national inventory document.
• In addition, the co-facilitators prepared a list of flexibility provisions included in
chapter II of the MPGs to assist Parties in addressing this matter, including
options identified in Parties’ submissions during this session. This information
was considered during this session and is included in annex I.
Should discussions be limited to the structure and content of the common
reporting tables, or should considerations related to possible future
software tools be taken into account?
• During SBSTA 50, the group discussed the CRTs and software tools and
considered the following:
o As a first step, to focus on the CRTs;
o As a second step, to discuss tables together with more background
information on the software tools that are currently used by Parties to
facilitate reporting.
Need for support to developing countries’ reporting and related capacity
building
• The group recognized that capacity-building for developing country Parties is
essential to facilitating reporting in accordance with the enhanced transparency
framework. In addition, some Parties noted the need for support to developing
country Parties for implementation.
4
• Developing countries noted that they have limited or no experience with CRF
tables for developed countries reporting or the use of the data entry interface
software tool (CRF Reporter), and expressed the need for capacity-building in
that regard. The following options were proposed:
o Sharing of experience by Parties that have experience in reporting CRF
tables;
o Continueing to grant access to CRF Reporter to developing countries that
so request it to enable them to gain experience with the software; SBSTA
50 invited interested developing country Parties to request access to the
CRF Reporter, through the secretariat, in order to familiarize themselves
with the tool.5
5 Document FCCC\SBSTA\2019\2, paras. 127 and 128.
5
Annex I: Flexibility
This annex contains information on the provision of flexibility to those developing
country Parties that need it in the light of their capacities. It includes two parts.
Part 1: general information on the provision of flexibility to those developing country
Parties that need it in the light of their capacities, as contained in decision 18/CMA.1,
annex (“Modalities, procedures and guidelines for the transparency framework for
action and support referred to in Article 13 of the Paris Agreement”), chapter I.C;
Part 2: a list of the specific flexibility provisions in decision 18/CMA.1, annex,
chapter II.
Part 1: General information on the provision of flexibility to those developing
country Parties that need it in the light of their capacities
I.C. Flexibility to those developing country Parties that need it in the light of
their capacities
4. In accordance with Article 13, paragraph 2, of the Paris Agreement, the enhanced
transparency framework shall provide flexibility in the implementation of the
provisions of Article 13 to those developing country Parties that need it in the light
of their capacities, and these modalities, procedures and guidelines (MPGs) shall
reflect such flexibility.
5. These MPGs specify the flexibility that is available to those developing country
Parties that need it in the light of their capacities pursuant to Article 13, paragraph 2,
reflecting flexibility, including in the scope, frequency and level of detail of reporting,
and in the scope of the review, as referred to decision 1/CP.21, paragraph 89.
6. The application of a flexibility provided for in the provisions of these MPGs for
those developing country Parties that need it in the light of their capacities is to be
self-determined. The developing country Party shall clearly indicate the provision to
which flexibility is applied, concisely clarify capacity constraints, noting that some
constraints may be relevant to several provisions, and provide self-determined
estimated time frames for improvements in relation to those capacity constraints.
When a developing country Party applies flexibility provided for in these MPGs, the
technical expert review teams shall not review the Party’s determination to apply such
flexibility or whether the Party possesses the capacity to implement that specific
provision without flexibility.
6
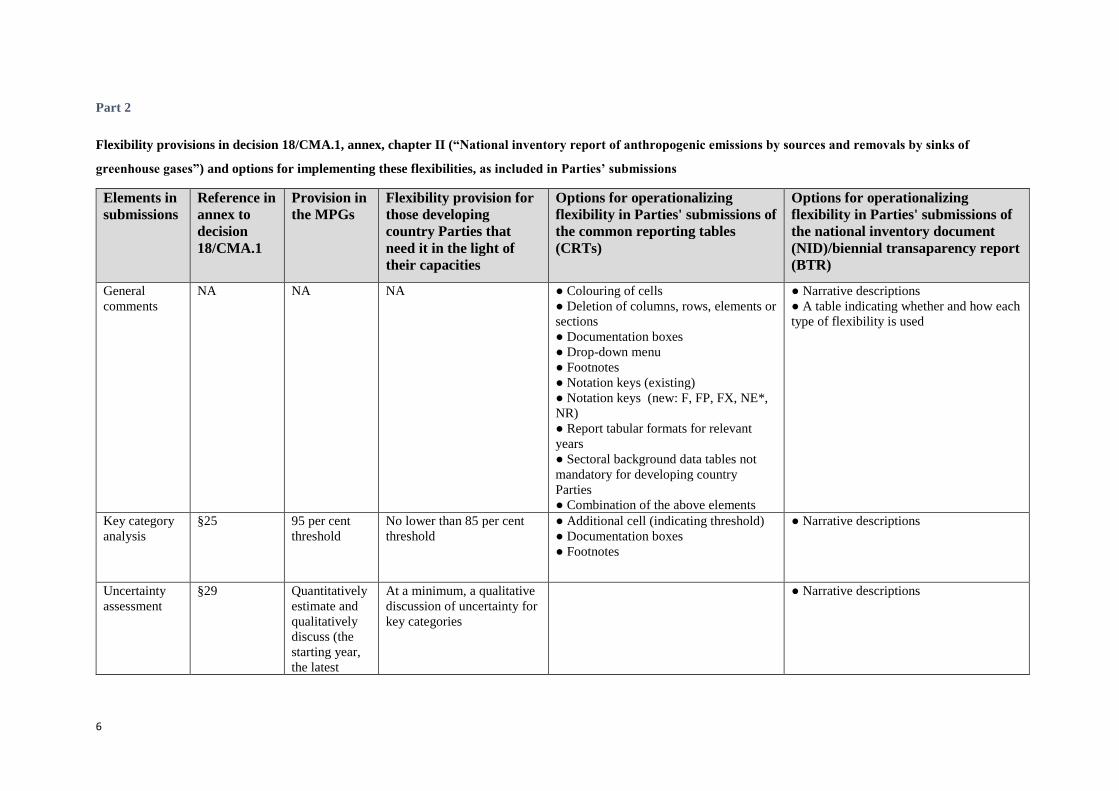
Part 2
Flexibility provisions in decision 18/CMA.1, annex, chapter II (“National inventory report of anthropogenic emissions by sources and removals by sinks of
greenhouse gases”) and options for implementing these flexibilities, as included in Parties’ submissions
Elements in
submissions
Reference in
annex to
decision
18/CMA.1
Provision in
the MPGs
Flexibility provision for
those developing
country Parties that
need it in the light of
their capacities
Options for operationalizing
flexibility in Parties' submissions of
the common reporting tables
(CRTs)
Options for operationalizing
flexibility in Parties' submissions of
the national inventory document
(NID)/biennial transaparency report
(BTR)
General
comments
NA NA NA ● Colouring of cells
● Deletion of columns, rows, elements or
sections
● Documentation boxes
● Drop-down menu
● Footnotes
● Notation keys (existing)
● Notation keys (new: F, FP, FX, NE*,
NR)
● Report tabular formats for relevant
years
● Sectoral background data tables not
mandatory for developing country
Parties
● Combination of the above elements
● Narrative descriptions
● A table indicating whether and how each
type of flexibility is used
Key category
analysis
§25 95 per cent
threshold
No lower than 85 per cent
threshold
● Additional cell (indicating threshold)
● Documentation boxes
● Footnotes
● Narrative descriptions
Uncertainty
assessment
§29 Quantitatively
estimate and
qualitatively
discuss (the
starting year,
the latest
At a minimum, a qualitative
discussion of uncertainty for
key categories
● Narrative descriptions
7
Elements in
submissions
Reference in
annex to
decision
18/CMA.1
Provision in
the MPGs
Flexibility provision for
those developing
country Parties that
need it in the light of
their capacities
Options for operationalizing
flexibility in Parties' submissions of
the common reporting tables
(CRTs)
Options for operationalizing
flexibility in Parties' submissions of
the national inventory document
(NID)/biennial transaparency report
(BTR)
reporting year,
and trend)
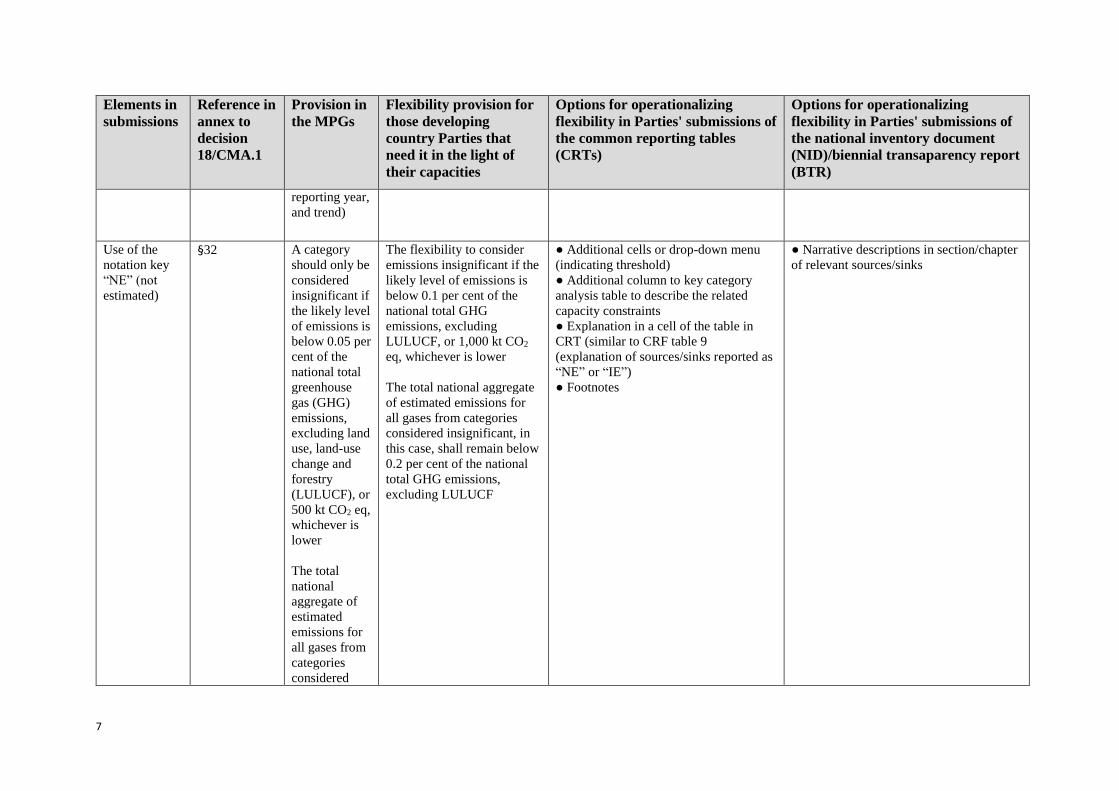
Use of the
notation key
“NE” (not
estimated)
§32 A category
should only be
considered
insignificant if
the likely level
of emissions is
below 0.05 per
cent of the
national total
greenhouse
gas (GHG)
emissions,
excluding land
use, land-use
change and
forestry
(LULUCF), or
500 kt CO2 eq,
whichever is
lower
The total
national
aggregate of
estimated
emissions for
all gases from
categories
considered
The flexibility to consider
emissions insignificant if the
likely level of emissions is
below 0.1 per cent of the
national total GHG
emissions, excluding
LULUCF, or 1,000 kt CO2
eq, whichever is lower
The total national aggregate
of estimated emissions for
all gases from categories
considered insignificant, in
this case, shall remain below
0.2 per cent of the national
total GHG emissions,
excluding LULUCF
● Additional cells or drop-down menu
(indicating threshold)
● Additional column to key category
analysis table to describe the related
capacity constraints
● Explanation in a cell of the table in
CRT (similar to CRF table 9
(explanation of sources/sinks reported as
“NE” or “IE”)
● Footnotes
● Narrative descriptions in section/chapter
of relevant sources/sinks
8
Elements in
submissions
Reference in
annex to
decision
18/CMA.1
Provision in
the MPGs
Flexibility provision for
those developing
country Parties that
need it in the light of
their capacities
Options for operationalizing
flexibility in Parties' submissions of
the common reporting tables
(CRTs)
Options for operationalizing
flexibility in Parties' submissions of
the national inventory document
(NID)/biennial transaparency report
(BTR)
insignificant
shall remain
below 0.1 per
cent of the
national total
GHG
emissions,
excluding
LULUCF
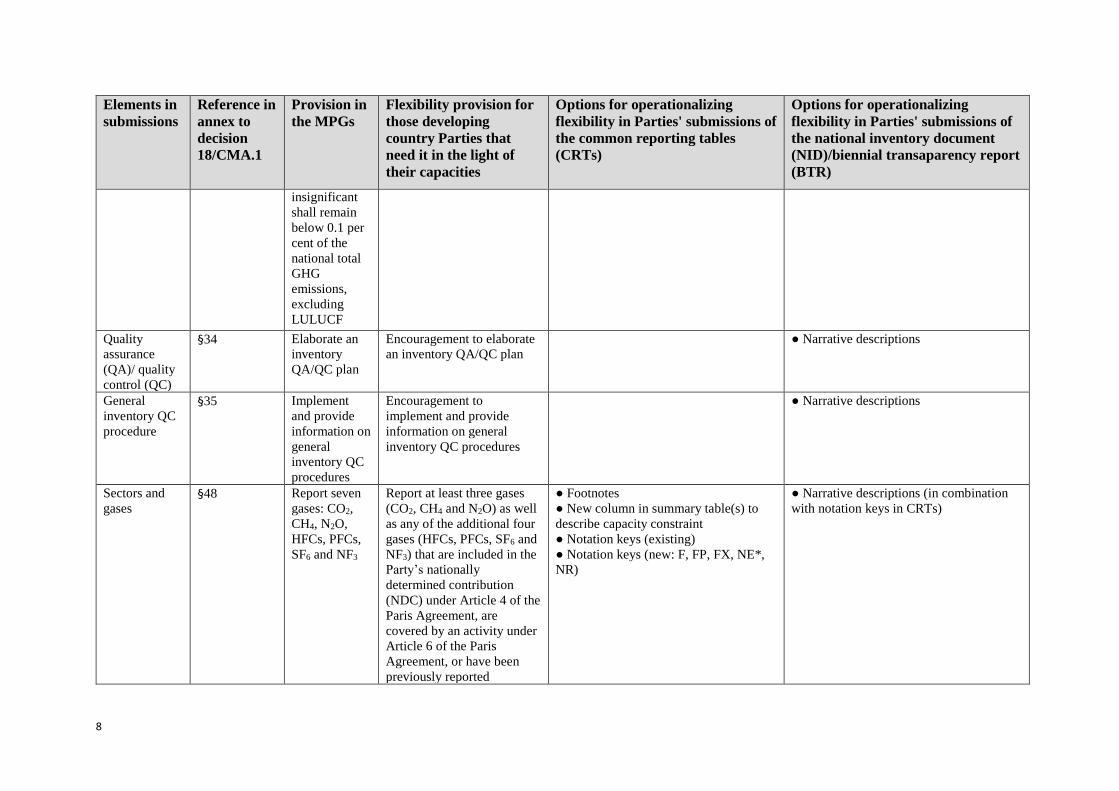
Quality
assurance
(QA)/ quality
control (QC)
§34 Elaborate an
inventory
QA/QC plan
Encouragement to elaborate
an inventory QA/QC plan
● Narrative descriptions
General
inventory QC
procedure
§35 Implement
and provide
information on
general
inventory QC
procedures
Encouragement to
implement and provide
information on general
inventory QC procedures
● Narrative descriptions
Sectors and
gases §48 Report seven
gases: CO2,
CH4, N2O,
HFCs, PFCs,
SF6 and NF3
Report at least three gases
(CO2, CH4 and N2O) as well
as any of the additional four
gases (HFCs, PFCs, SF6 and
NF3) that are included in the
Party’s nationally
determined contribution
(NDC) under Article 4 of the
Paris Agreement, are
covered by an activity under
Article 6 of the Paris
Agreement, or have been
previously reported
● Footnotes
● New column in summary table(s) to
describe capacity constraint
● Notation keys (existing)
● Notation keys (new: F, FP, FX, NE*,
NR)
● Narrative descriptions (in combination
with notation keys in CRTs)
9
Elements in
submissions
Reference in
annex to
decision
18/CMA.1
Provision in
the MPGs
Flexibility provision for
those developing
country Parties that
need it in the light of
their capacities
Options for operationalizing
flexibility in Parties' submissions of
the common reporting tables
(CRTs)
Options for operationalizing
flexibility in Parties' submissions of
the national inventory document
(NID)/biennial transaparency report
(BTR)
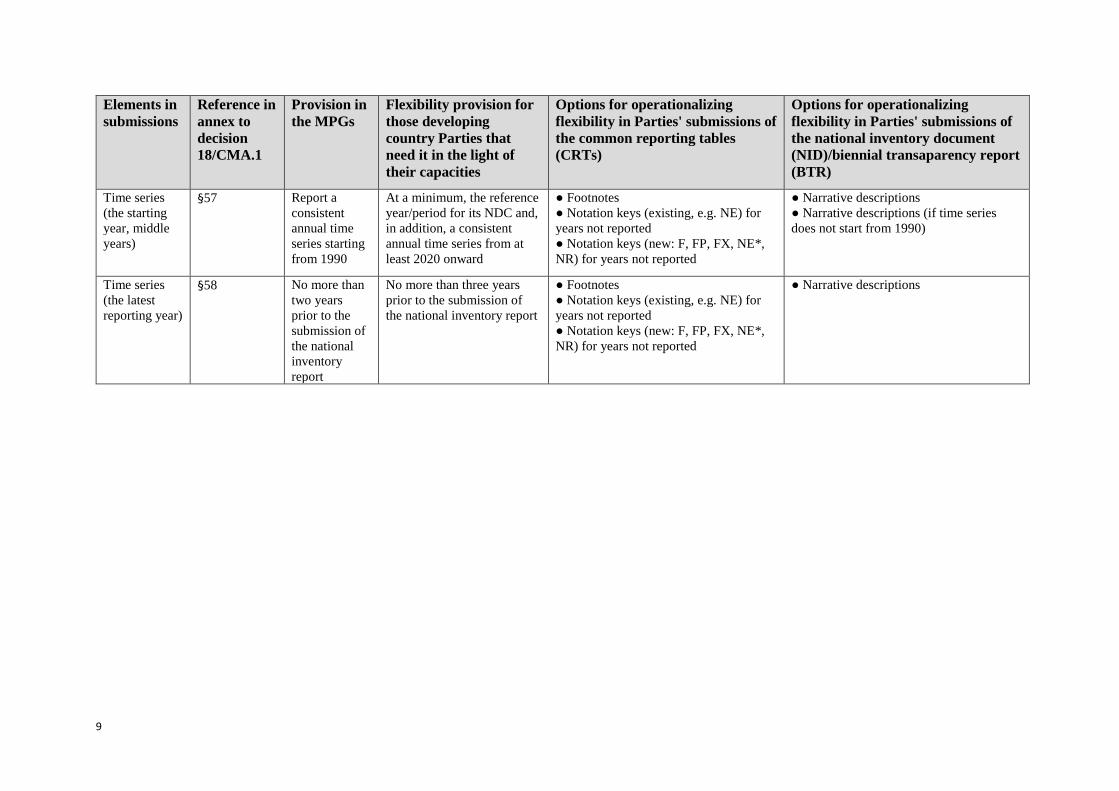
Time series
(the starting
year, middle
years)
§57 Report a
consistent
annual time
series starting
from 1990
At a minimum, the reference
year/period for its NDC and,
in addition, a consistent
annual time series from at
least 2020 onward
● Footnotes
● Notation keys (existing, e.g. NE) for
years not reported
● Notation keys (new: F, FP, FX, NE*,
NR) for years not reported
● Narrative descriptions
● Narrative descriptions (if time series
does not start from 1990)
Time series
(the latest
reporting year)
§58 No more than
two years
prior to the
submission of
the national
inventory
report
No more than three years
prior to the submission of
the national inventory report
● Footnotes
● Notation keys (existing, e.g. NE) for
years not reported
● Notation keys (new: F, FP, FX, NE*,
NR) for years not reported
● Narrative descriptions
10
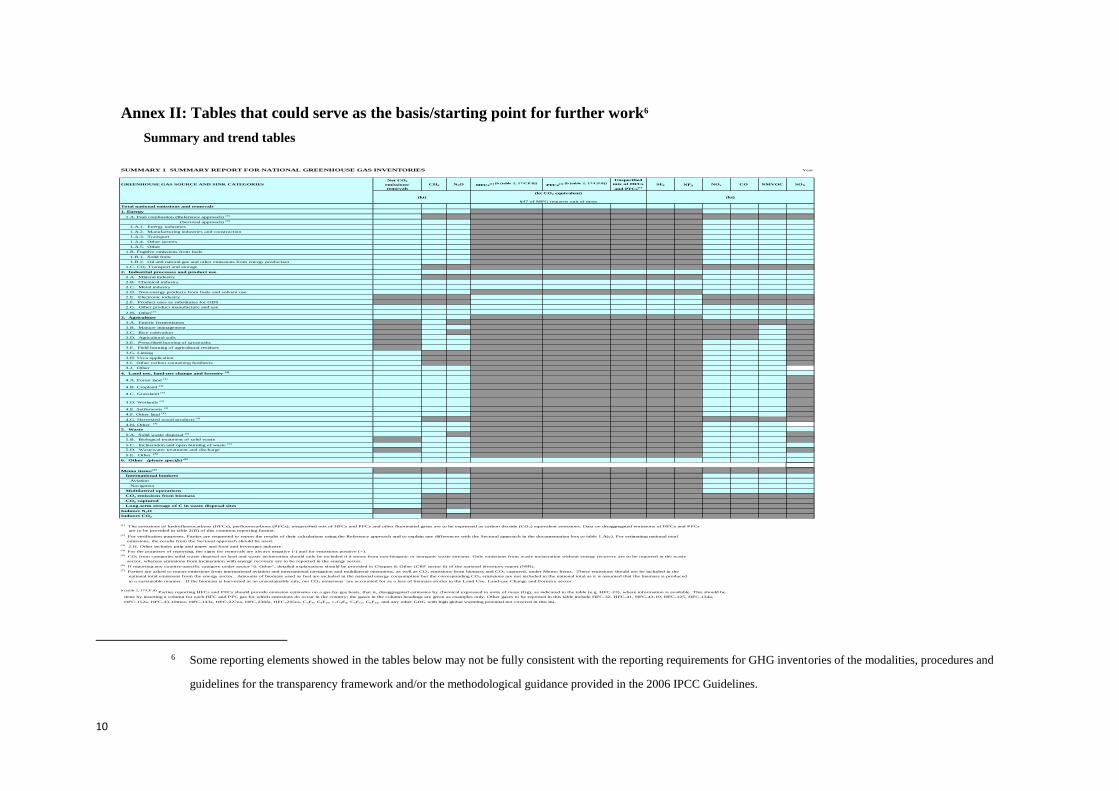
Annex II: Tables that could serve as the basis/starting point for further work6
Summary and trend tables
6 Some reporting elements showed in the tables below may not be fully consistent with the reporting requirements for GHG inventories of the modalities, procedures and
guidelines for the transparency framework and/or the methodological guidance provided in the 2006 IPCC Guidelines.
SUMMARY 1 SUMMARY REPORT FOR NATIONAL GREENHOUSE GAS INVENTORIES Year
GREENHOUSE GAS SOURCE AND SINK CATEGORIES
Net CO2
emissions/
removals
CH4 N2O HFCs(1) (b (table 2, 17/CP.8))
PFCs(1) (b (table 2, 17/CP.8))
Unspecified
mix of HFCs
and PFCs(1)
SF6 NF3 NOx CO NMVOC SOX
(kt)
(kt CO2 equivalent)
§47 of MPG requests unit of mass
(kt)
Total national emissions and removals
1. Energy
1.A. Fuel combustion (Reference approach) (2)
(Sectoral approach) (2)
1.A.1. Energy industries
1.A.2. Manufacturing industries and construction
1.A.3. Transport
1.A.4. Other sectors
1.A.5. Other
1.B. Fugitive emissions from fuels
1.B.1. Solid fuels
1.B.2. Oil and natural gas and other emissions from energy production
1.C. CO2 Transport and storage
2. Industrial processes and product use
2.A. Mineral industry
2.B. Chemical industry
2.C. Metal industry
2.D. Non-energy products from fuels and solvent use
2.E. Electronic industry
2.F. Product uses as substitutes for ODS
2.G. Other product manufacture and use
2.H. Other(3)
3. Agriculture
3.A. Enteric fermentation
3.B. Manure management
3.C. Rice cultivation
3.D. Agricultural soils
3.E. Prescribed burning of savannahs
3.F. Field burning of agricultural residues
3.G. Liming
3.H. Urea application
3.I. Other carbon-containing fertilizers
3.J. Other
4. Land use, land-use change and forestry (4)
4.A. Forest land (4)
4.B. Cropland (4)
4.C. Grassland (4)
4.D. Wetlands (4)
4.E. Settlements (4)
4.F. Other land (4)
4.G. Harvested wood products (4)
4.H. Other (4)
5. Waste
5.A. Solid waste disposal (5)
5.B. Biological treatment of solid waste
5.C. Incineration and open burning of waste (5)
5.D. Wastewater treatment and discharge
5.E. Other (5)
6. Other (please specify)(6)
Memo items:(7)
International bunkers
Aviation
Navigation
Multilateral operations
CO2 emissions from biomass
CO2 captured
Long-term storage of C in waste disposal sites
Indirect N2O
Indirect CO2
(1) The emissions of hydrofluorocarbons (HFCs), perfluorocarbons (PFCs), unspecified mix of HFCs and PFCs and other fluorinated gases are to be expressed as carbon dioxide (CO2) equivalent emissions. Data on disaggregated emissions of HFCs and PFCs
are to be provided in table 2(II) of this common reporting format.
(2) For verification purposes, Parties are requested to report the results of their calculations using the Reference approach and to explain any differences with the Sectoral approach in the documentation box to table 1.A(c). For estimating national total
emissions, the results from the Sectoral approach should be used.
(3) 2.H. Other includes pulp and paper and food and beverages industry.
(4) For the purposes of reporting, the signs for removals are always negative (-) and for emissions positive (+).
(5) CO2 from categories solid waste disposal on land and waste incineration should only be included if it stems from non-biogenic or inorganic waste streams. Only emissions from waste incineration without energy recovery are to be reported in the waste
sector, whereas emissions from incineration with energy recovery are to be reported in the energy sector.
(6) If reporting any country-specific category under sector "6. Other", detailed explanations should be provided in Chapter 8: Other (CRF sector 6) of the national inventory report (NIR).
(7) Parties are asked to report emissions from international aviation and international navigation and multilateral operations, as well as CO2 emissions from biomass and CO2 captured, under Memo Items. These emissions should not be included in the
national total emissions from the energy sector. Amounts of biomass used as fuel are included in the national energy consumption but the corresponding CO2 emissions are not included in the national total as it is assumed that the biomass is produced
in a sustainable manner. If the biomass is harvested at an unsustainable rate, net CO2 emissions are accounted for as a loss of biomass stocks in the Land Use, Land-use Change and Forestry sector.
b (table 2, 17/CP.8) Parties reporting HFCs and PFCs should provide emission estimates on a gas-by-gas basis, that is, disaggregated estimates by chemical expressed in units of mass (Gg), as indicated in the table (e.g. HFC-23), where information is available. This should be
done by inserting a column for each HFC and PFC gas for which emissions do occur in the country; the gases in the column headings are given as examples only. Other gases to be reported in this table include HFC-32, HFC-41, HFC-43-10, HFC-125, HFC-134a,
HFC-152a, HFC-43-10mee, HFC-143a, HFC-227ea, HFC-236fa, HFC-245ca, C3F8, C4F10, c-C4F8, C5F12, C6F14, and any other GHG with high global warming potential not covered in this list.
11
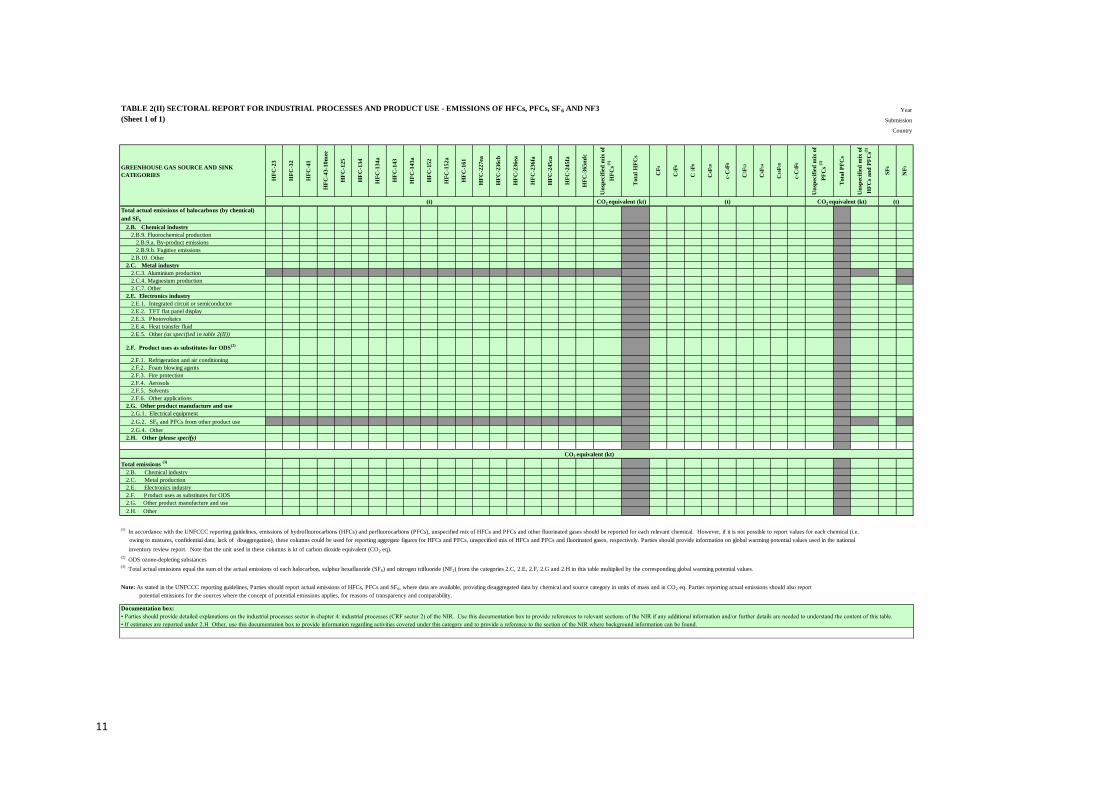
TABLE 2(II) SECTORAL REPORT FOR INDUSTRIAL PROCESSES AND PRODUCT USE - EMISSIONS OF HFCs, PFCs, SF6 AND NF3 Year
(Sheet 1 of 1) Submission
Country
GREENHOUSE GAS SOURCE AND SINK
CATEGORIES
HF
C-2
3
HF
C-3
2
HF
C-4
1
HF
C-4
3-1
0m
ee
HF
C-1
25
HF
C-1
34
HF
C-1
34a
HF
C-1
43
HF
C-1
43a
HF
C-1
52
HF
C-1
52a
HF
C-1
61
HF
C-2
27ea
HF
C-2
36cb
HF
C-2
36ea
HF
C-2
36fa
HF
C-2
45ca
HF
C-2
45fa
HF
C-3
65m
fc
Un
spec
ifie
d m
ix o
f
HF
Cs (
1)
To
tal
HF
Cs
CF
4
C2F
6
C 3
F8
C4F
10
c-C
4F
8
C5F
12
C6F
14
C10F
18
c-C
3F
6
Un
spec
ifie
d m
ix o
f
PF
Cs
(1)
To
tal
PF
Cs
Un
spec
ifie
d m
ix o
f
HF
Cs
an
d P
FC
s(1)
SF
6
NF
3
(t) CO2 equivalent (kt) (t) CO2 equivalent (kt) (t)
Total actual emissions of halocarbons (by chemical)
and SF6
2.B. Chemical industry
2.B.9. Fluorochemical production
2.B.9.a. By-product emissions
2.B.9.b. Fugitive emissions
2.B.10. Other
2.C. Metal industry
2.C.3. Aluminium production
2.C.4. Magnesium production
2.C.7. Other
2.E. Electronics industry
2.E.1. Integrated circuit or semiconductor
2.E.2. TFT flat panel display
2.E.3. Photovoltaics
2.E.4. Heat transfer fluid
2.E.5. Other (as specified in table 2(II))
2.F. Product uses as substitutes for ODS(2)
2.F.1. Refrigeration and air conditioning
2.F.2. Foam blowing agents
2.F.3. Fire protection
2.F.4. Aerosols
2.F.5. Solvents
2.F.6. Other applications
2.G. Other product manufacture and use
2.G.1. Electrical equipment
2.G.2. SF6 and PFCs from other product use
2.G.4. Other
2.H. Other (please specify)
CO2 equivalent (kt)
Total emissions (3)
2.B. Chemical industry
2.C. Metal production
2.E. Electronics industry
2.F. Product uses as substitutes for ODS
2.G. Other product manufacture and use
2.H. Other
(1) In accordance with the UNFCCC reporting guidelines, emissions of hydrofluorocarbons (HFCs) and perfluorocarbons (PFCs), unspecified mix of HFCs and PFCs and other fluorinated gases should be reported for each relevant chemical. However, if it is not possible to report values for each chemical (i.e.
owing to mixtures, confidential data, lack of disaggregation), these columns could be used for reporting aggregate figures for HFCs and PFCs, unspecified mix of HFCs and PFCs and fluorinated gases, respectively. Parties should provide information on global warming potential values used in the national
inventory review report. Note that the unit used in these columns is kt of carbon dioxide equivalent (CO2 eq).
(2) ODS ozone-depleting substances
(3) Total actual emissions equal the sum of the actual emissions of each halocarbon, sulphur hexafluoride (SF6) and nitrogen trifluoride (NF3) from the categories 2.C, 2.E, 2.F, 2.G and 2.H in this table multiplied by the corresponding global warming potential values.
Note: As stated in the UNFCCC reporting guidelines, Parties should report actual emissions of HFCs, PFCs and SF6, where data are available, providing disaggregated data by chemical and source category in units of mass and in CO2 eq. Parties reporting actual emissions should also report
potential emissions for the sources where the concept of potential emissions applies, for reasons of transparency and comparability.
Documentation box:
• Parties should provide detailed explanations on the industrial processes sector in chapter 4: industrial processes (CRF sector 2) of the NIR. Use this documentation box to provide references to relevant sections of the NIR if any additional information and/or further details are needed to understand the content of this table.
• If estimates are reported under 2.H Other, use this documentation box to provide information regarding activities covered under this category and to provide a reference to the section of the NIR where background information can be found.
12
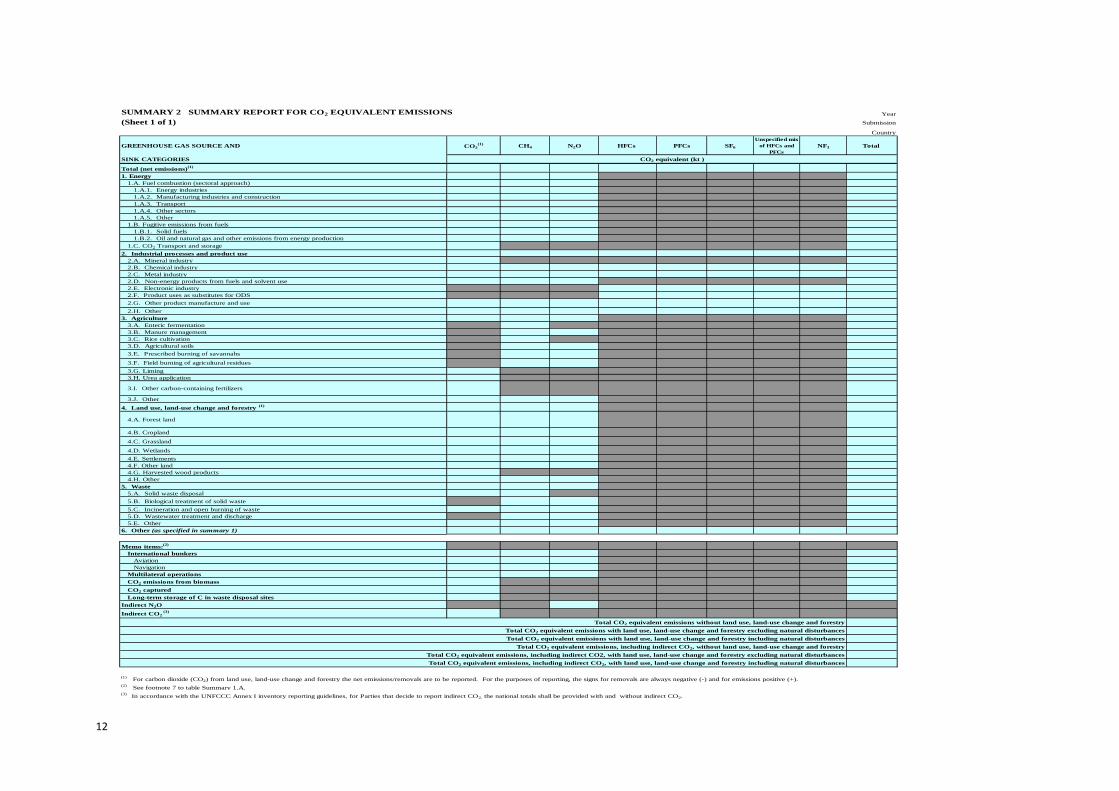
SUMMARY 2 SUMMARY REPORT FOR CO2 EQUIVALENT EMISSIONS Year
(Sheet 1 of 1) Submission
Country
GREENHOUSE GAS SOURCE AND CO2(1) CH4 N2O HFCs PFCs SF6
Unspecified mix
of HFCs and
PFCs
NF3 Total
SINK CATEGORIES CO2 equivalent (kt )
Total (net emissions)(1)
1. Energy
1.A. Fuel combustion (sectoral approach)
1.A.1. Energy industries
1.A.2. Manufacturing industries and construction
1.A.3. Transport
1.A.4. Other sectors
1.A.5. Other
1.B. Fugitive emissions from fuels
1.B.1. Solid fuels
1.B.2. Oil and natural gas and other emissions from energy production
1.C. CO2 Transport and storage
2. Industrial processes and product use
2.A. Mineral industry
2.B. Chemical industry
2.C. Metal industry
2.D. Non-energy products from fuels and solvent use
2.E. Electronic industry
2.F. Product uses as substitutes for ODS
2.G. Other product manufacture and use
2.H. Other
3. Agriculture
3.A. Enteric fermentation
3.B. Manure management
3.C. Rice cultivation
3.D. Agricultural soils
3.E. Prescribed burning of savannahs
3.F. Field burning of agricultural residues
3.G. Liming
3.H. Urea application
3.I. Other carbon-containing fertilizers
3.J. Other
4. Land use, land-use change and forestry (1)
4.A. Forest land
4.B. Cropland
4.C. Grassland
4.D. Wetlands
4.E. Settlements
4.F. Other land
4.G. Harvested wood products
4.H. Other
5. Waste
5.A. Solid waste disposal
5.B. Biological treatment of solid waste
5.C. Incineration and open burning of waste
5.D. Wastewater treatment and discharge
5.E. Other
6. Other (as specified in summary 1)
Memo items:(2)
International bunkers
Aviation
Navigation
Multilateral operations
CO2 emissions from biomass
CO2 captured
Long-term storage of C in waste disposal sites
Indirect N2O
Indirect CO2 (3)
Total CO2 equivalent emissions without land use, land-use change and forestry
Total CO2 equivalent emissions with land use, land-use change and forestry excluding natural disturbances
Total CO2 equivalent emissions with land use, land-use change and forestry including natural disturbances
Total CO2 equivalent emissions, including indirect CO2, without land use, land-use change and forestry
Total CO2 equivalent emissions, including indirect CO2, with land use, land-use change and forestry excluding natural disturbances
Total CO2 equivalent emissions, including indirect CO2, with land use, land-use change and forestry including natural disturbances
(1) For carbon dioxide (CO2) from land use, land-use change and forestry the net emissions/removals are to be reported. For the purposes of reporting, the signs for removals are always negative (-) and for emissions positive (+).
(2) See footnote 7 to table Summary 1.A.
(3) In accordance with the UNFCCC Annex I inventory reporting guidelines, for Parties that decide to report indirect CO2, the national totals shall be provided with and without indirect CO2.

13
TABLE 10 EMISSION TRENDS Year
GHG CO2 eq emissions Submission
(Sheet 1 of 6) Country
GREENHOUSE GAS SOURCE AND SINK CATEGORIES Base year(1) 1990
(Years 1991 to latest reported
year)
Change from base to latest
reported year
(kt CO2 eq) %
Total (net emissions)(2)
1. Energy
1.A. Fuel combustion (sectoral approach)
1.A.1. Energy industries
1.A.2. Manufacturing industries and construction
1.A.3. Transport
1.A.4. Other sectors
1.A.5. Other
1.B. Fugitive emissions from fuels
1.B.1. Solid fuels
1.B.2. Oil and natural gas and other emissions from energy production
1.C. CO2 Transport and storage
2. Industrial processes and product use
2.A. Mineral industry
2.B. Chemical industry
2.C. Metal industry
2.D. Non-energy products from fuels and solvent use
2.E. Electronic industry
2.F. Product uses as substitutes for ODS
2.G. Other product manufacture and use
2.H. Other
3. Agriculture
3.A. Enteric fermentation
3.B. Manure management
3.C. Rice cultivation
3.D. Agricultural soils
3.E. Prescribed burning of savannahs
3.F. Field burning of agricultural residues
3.G. Liming
3.H. Urea application
3.I. Other carbon-containing fertilizers
3.J. Other
4. Land use, land-use change and forestry (2)
4.A. Forest land
4.B. Cropland
4.C. Grassland
4.D. Wetlands
4.E. Settlements
4.F. Other land
4.G. Harvested wood products
4.H. Other
5. Waste
5.A. Solid waste disposal
5.B. Biological treatment of solid waste
5.C. Incineration and open burning of waste
5.D. Wastewater treatment and discharge
5.E. Other
6. Other (please specify)
Memo items:
International bunkers
Aviation
Navigation
Multilateral operations
CO2 emissions from biomass
CO2 captured
Long-term storage of C in waste disposal sites
Indirect N2O
Indirect CO2 (3)
Total CO2 equivalent emissions without land use, land-use change and forestry
Total CO2 equivalent emissions with land use, land-use change and forestry excluding natural disturbances
Total CO2 equivalent emissions with land use, land-use change and forestry including natural disturbances
Total CO2 equivalent emissions, including indirect CO2, without land use, land-use change and forestry
Total CO2 equivalent emissions, including indirect CO2, with land use, land-use change and forestry excluding natural disturbances
Total CO2 equivalent emissions, including indirect CO2, with land use, land-use change and forestry including natural disturbances
Note: All footnotes for this table are given at the end of the table on sheet 6.
14
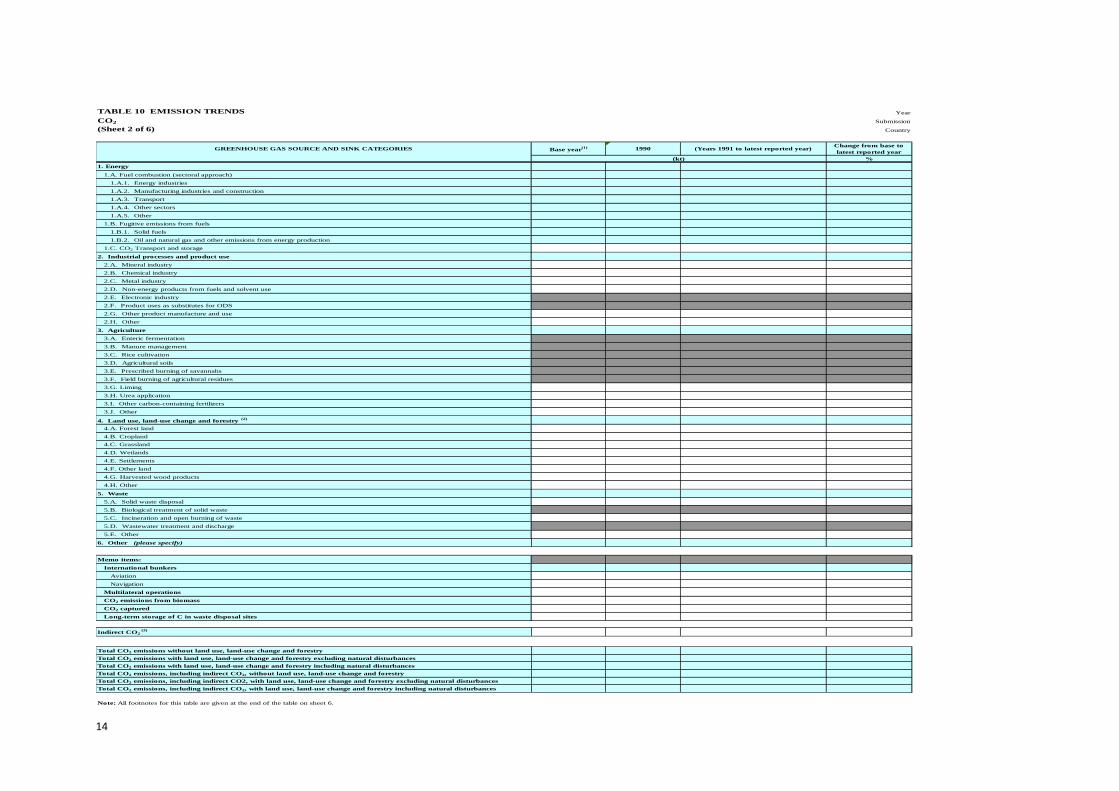
TABLE 10 EMISSION TRENDS Year
CO2 Submission
(Sheet 2 of 6) Country
GREENHOUSE GAS SOURCE AND SINK CATEGORIES Base year(1) 1990 (Years 1991 to latest reported year)
Change from base to
latest reported year
(kt) %
1. Energy
1.A. Fuel combustion (sectoral approach)
1.A.1. Energy industries
1.A.2. Manufacturing industries and construction
1.A.3. Transport
1.A.4. Other sectors
1.A.5. Other
1.B. Fugitive emissions from fuels
1.B.1. Solid fuels
1.B.2. Oil and natural gas and other emissions from energy production
1.C. CO2 Transport and storage
2. Industrial processes and product use
2.A. Mineral industry
2.B. Chemical industry
2.C. Metal industry
2.D. Non-energy products from fuels and solvent use
2.E. Electronic industry
2.F. Product uses as substitutes for ODS
2.G. Other product manufacture and use
2.H. Other
3. Agriculture
3.A. Enteric fermentation
3.B. Manure management
3.C. Rice cultivation
3.D. Agricultural soils
3.E. Prescribed burning of savannahs
3.F. Field burning of agricultural residues
3.G. Liming
3.H. Urea application
3.I. Other carbon-containing fertilizers
3.J. Other
4. Land use, land-use change and forestry (2)
4.A. Forest land
4.B. Cropland
4.C. Grassland
4.D. Wetlands
4.E. Settlements
4.F. Other land
4.G. Harvested wood products
4.H. Other
5. Waste
5.A. Solid waste disposal
5.B. Biological treatment of solid waste
5.C. Incineration and open burning of waste
5.D. Wastewater treatment and discharge
5.E. Other
6. Other (please specify)
Memo items:
International bunkers
Aviation
Navigation
Multilateral operations
CO2 emissions from biomass
CO2 captured
Long-term storage of C in waste disposal sites
Indirect CO2 (3)
Total CO2 emissions without land use, land-use change and forestry
Total CO2 emissions with land use, land-use change and forestry excluding natural disturbances
Total CO2 emissions with land use, land-use change and forestry including natural disturbances
Total CO2 emissions, including indirect CO2, without land use, land-use change and forestry
Total CO2 emissions, including indirect CO2, with land use, land-use change and forestry excluding natural disturbances
Total CO2 emissions, including indirect CO2, with land use, land-use change and forestry including natural disturbances
Note: All footnotes for this table are given at the end of the table on sheet 6.
15
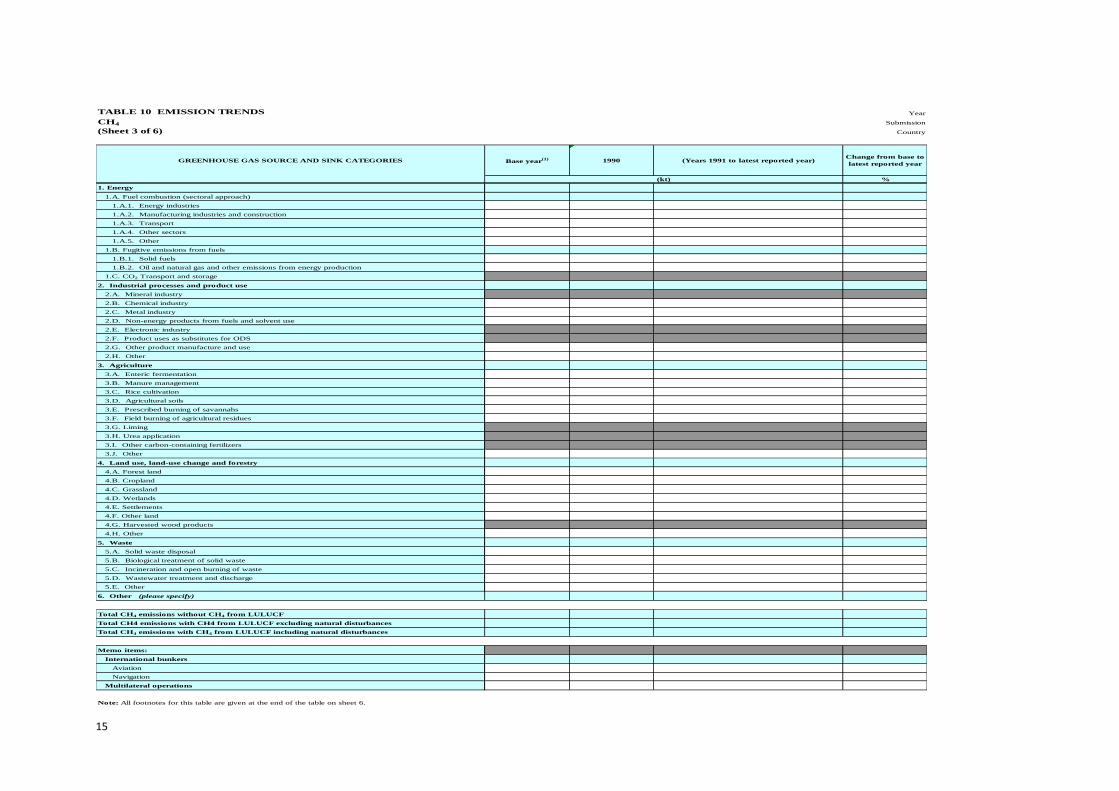
TABLE 10 EMISSION TRENDS Year
CH4 Submission
(Sheet 3 of 6) Country
GREENHOUSE GAS SOURCE AND SINK CATEGORIES Base year(1) 1990 (Years 1991 to latest reported year)
Change from base to
latest reported year
(kt) %
1. Energy
1.A. Fuel combustion (sectoral approach)
1.A.1. Energy industries
1.A.2. Manufacturing industries and construction
1.A.3. Transport
1.A.4. Other sectors
1.A.5. Other
1.B. Fugitive emissions from fuels
1.B.1. Solid fuels
1.B.2. Oil and natural gas and other emissions from energy production
1.C. CO2 Transport and storage
2. Industrial processes and product use
2.A. Mineral industry
2.B. Chemical industry
2.C. Metal industry
2.D. Non-energy products from fuels and solvent use
2.E. Electronic industry
2.F. Product uses as substitutes for ODS
2.G. Other product manufacture and use
2.H. Other
3. Agriculture
3.A. Enteric fermentation
3.B. Manure management
3.C. Rice cultivation
3.D. Agricultural soils
3.E. Prescribed burning of savannahs
3.F. Field burning of agricultural residues
3.G. Liming
3.H. Urea application
3.I. Other carbon-containing fertilizers
3.J. Other
4. Land use, land-use change and forestry
4.A. Forest land
4.B. Cropland
4.C. Grassland
4.D. Wetlands
4.E. Settlements
4.F. Other land
4.G. Harvested wood products
4.H. Other
5. Waste
5.A. Solid waste disposal
5.B. Biological treatment of solid waste
5.C. Incineration and open burning of waste
5.D. Wastewater treatment and discharge
5.E. Other
6. Other (please specify)
Total CH4 emissions without CH4 from LULUCF
Total CH4 emissions with CH4 from LULUCF excluding natural disturbances
Total CH4 emissions with CH4 from LULUCF including natural disturbances
Memo items:
International bunkers
Aviation
Navigation
Multilateral operations
Note: All footnotes for this table are given at the end of the table on sheet 6.
16
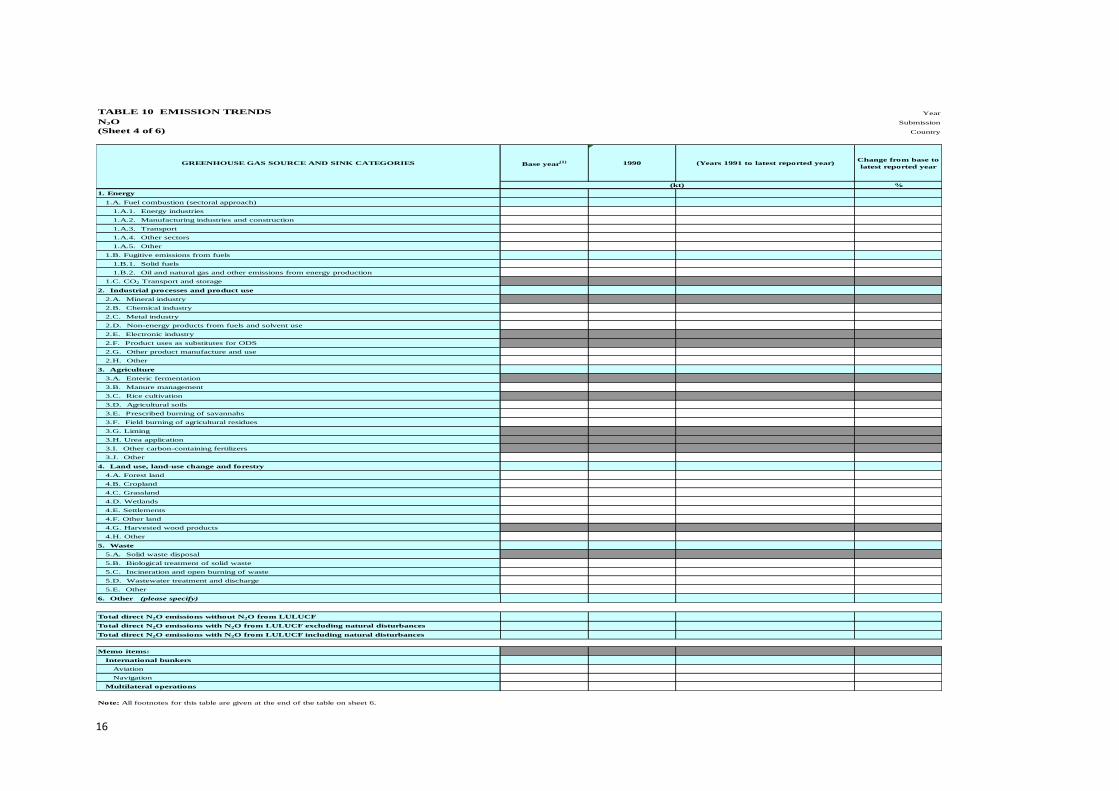
TABLE 10 EMISSION TRENDS Year
N2O Submission
(Sheet 4 of 6) Country
GREENHOUSE GAS SOURCE AND SINK CATEGORIES Base year(1) 1990 (Years 1991 to latest reported year)
Change from base to
latest reported year
(kt) %
1. Energy
1.A. Fuel combustion (sectoral approach)
1.A.1. Energy industries
1.A.2. Manufacturing industries and construction
1.A.3. Transport
1.A.4. Other sectors
1.A.5. Other
1.B. Fugitive emissions from fuels
1.B.1. Solid fuels
1.B.2. Oil and natural gas and other emissions from energy production
1.C. CO2 Transport and storage
2. Industrial processes and product use
2.A. Mineral industry
2.B. Chemical industry
2.C. Metal industry
2.D. Non-energy products from fuels and solvent use
2.E. Electronic industry
2.F. Product uses as substitutes for ODS
2.G. Other product manufacture and use
2.H. Other
3. Agriculture
3.A. Enteric fermentation
3.B. Manure management
3.C. Rice cultivation
3.D. Agricultural soils
3.E. Prescribed burning of savannahs
3.F. Field burning of agricultural residues
3.G. Liming
3.H. Urea application
3.I. Other carbon-containing fertilizers
3.J. Other
4. Land use, land-use change and forestry
4.A. Forest land
4.B. Cropland
4.C. Grassland
4.D. Wetlands
4.E. Settlements
4.F. Other land
4.G. Harvested wood products
4.H. Other
5. Waste
5.A. Solid waste disposal
5.B. Biological treatment of solid waste
5.C. Incineration and open burning of waste
5.D. Wastewater treatment and discharge
5.E. Other
6. Other (please specify)
Total direct N2O emissions without N2O from LULUCF
Total direct N2O emissions with N2O from LULUCF excluding natural disturbances
Total direct N2O emissions with N2O from LULUCF including natural disturbances
Memo items:
International bunkers
Aviation
Navigation
Multilateral operations
Note: All footnotes for this table are given at the end of the table on sheet 6.
17
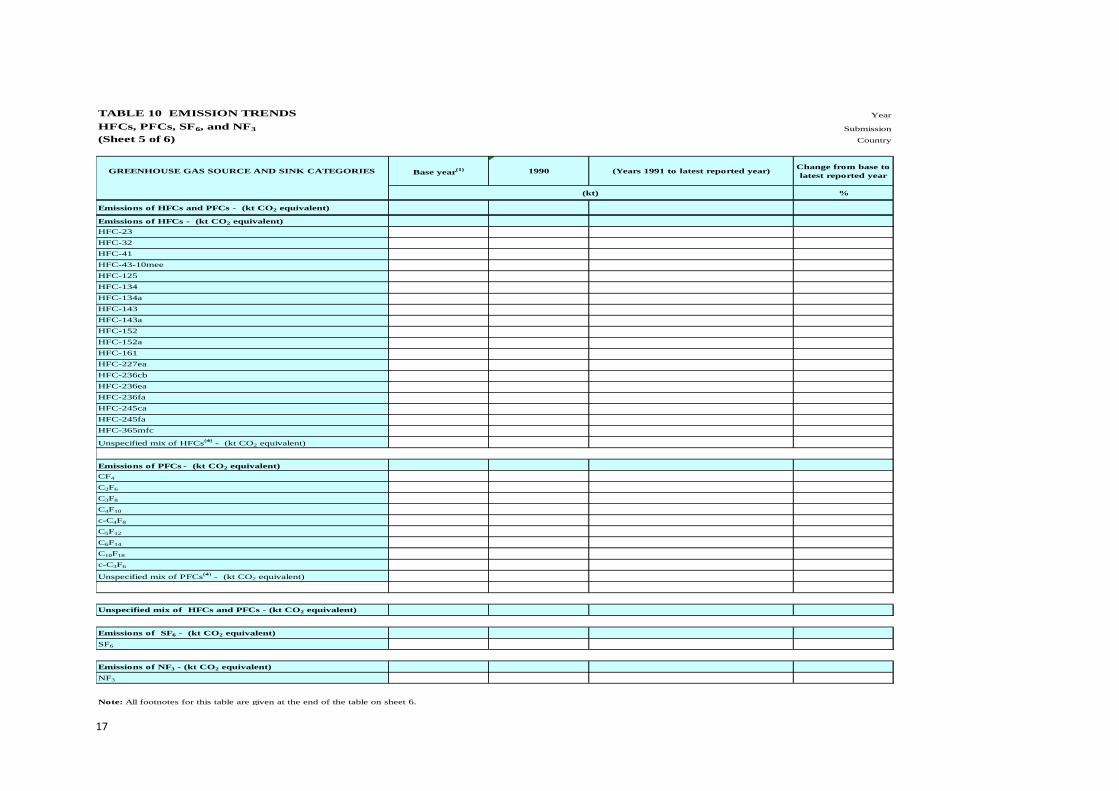
TABLE 10 EMISSION TRENDS Year
HFCs, PFCs, SF6, and NF3 Submission
(Sheet 5 of 6) Country
GREENHOUSE GAS SOURCE AND SINK CATEGORIES Base year(1) 1990 (Years 1991 to latest reported year)
Change from base to
latest reported year
(kt) %
Emissions of HFCs and PFCs - (kt CO2 equivalent)
Emissions of HFCs - (kt CO2 equivalent)
HFC-23
HFC-32
HFC-41
HFC-43-10mee
HFC-125
HFC-134
HFC-134a
HFC-143
HFC-143a
HFC-152
HFC-152a
HFC-161
HFC-227ea
HFC-236cb
HFC-236ea
HFC-236fa
HFC-245ca
HFC-245fa
HFC-365mfc
Unspecified mix of HFCs(4)
- (kt CO2 equivalent)
Emissions of PFCs - (kt CO2 equivalent)
CF4
C2F6
C3F8
C4F10
c-C4F8
C5F12
C6F14
C10F18
c-C3F6
Unspecified mix of PFCs(4)
- (kt CO2 equivalent)
Unspecified mix of HFCs and PFCs - (kt CO2 equivalent)
Emissions of SF6 - (kt CO2 equivalent)
SF6
Emissions of NF3 - (kt CO2 equivalent)
NF3
Note: All footnotes for this table are given at the end of the table on sheet 6.
18
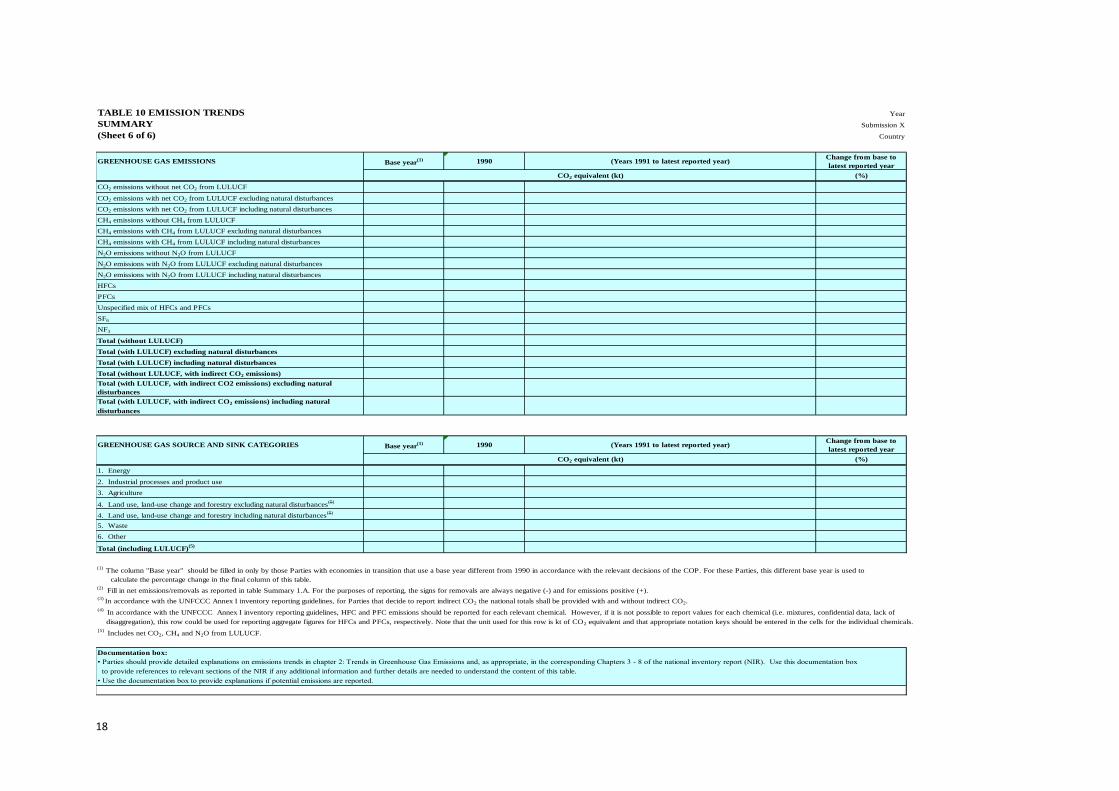
TABLE 10 EMISSION TRENDS Year
SUMMARY Submission X
(Sheet 6 of 6) Country
GREENHOUSE GAS EMISSIONS Base year(1) 1990 (Years 1991 to latest reported year)
Change from base to
latest reported year
CO2 equivalent (kt) (%)
CO2 emissions without net CO2 from LULUCF
CO2 emissions with net CO2 from LULUCF excluding natural disturbances
CO2 emissions with net CO2 from LULUCF including natural disturbances
CH4 emissions without CH4 from LULUCF
CH4 emissions with CH4 from LULUCF excluding natural disturbances
CH4 emissions with CH4 from LULUCF including natural disturbances
N2O emissions without N2O from LULUCF
N2O emissions with N2O from LULUCF excluding natural disturbances
N2O emissions with N2O from LULUCF including natural disturbances
HFCs
PFCs
Unspecified mix of HFCs and PFCs
SF6
NF3
Total (without LULUCF)
Total (with LULUCF) excluding natural disturbances
Total (with LULUCF) including natural disturbances
Total (without LULUCF, with indirect CO2 emissions)
Total (with LULUCF, with indirect CO2 emissions) excluding natural
disturbances
Total (with LULUCF, with indirect CO2 emissions) including natural
disturbances
GREENHOUSE GAS SOURCE AND SINK CATEGORIES Base year(1) 1990 (Years 1991 to latest reported year)
Change from base to
latest reported year
CO2 equivalent (kt) (%)
1. Energy
2. Industrial processes and product use
3. Agriculture
4. Land use, land-use change and forestry excluding natural disturbances(5)
4. Land use, land-use change and forestry including natural disturbances(5)
5. Waste
6. Other
Total (including LULUCF)(5)
(1) The column "Base year" should be filled in only by those Parties with economies in transition that use a base year different from 1990 in accordance with the relevant decisions of the COP. For these Parties, this different base year is used to
calculate the percentage change in the final column of this table. (2)
Fill in net emissions/removals as reported in table Summary 1.A. For the purposes of reporting, the signs for removals are always negative (-) and for emissions positive (+). (3)
In accordance with the UNFCCC Annex I inventory reporting guidelines, for Parties that decide to report indirect CO2 the national totals shall be provided with and without indirect CO2.
(4) In accordance with the UNFCCC Annex I inventory reporting guidelines, HFC and PFC emissions should be reported for each relevant chemical. However, if it is not possible to report values for each chemical (i.e. mixtures, confidential data, lack of
disaggregation), this row could be used for reporting aggregate figures for HFCs and PFCs, respectively. Note that the unit used for this row is kt of CO2 equivalent and that appropriate notation keys should be entered in the cells for the individual chemicals.
(5) Includes net CO2, CH4 and N2O from LULUCF.
Documentation box:
• Parties should provide detailed explanations on emissions trends in chapter 2: Trends in Greenhouse Gas Emissions and, as appropriate, in the corresponding Chapters 3 - 8 of the national inventory report (NIR). Use this documentation box
to provide references to relevant sections of the NIR if any additional information and further details are needed to understand the content of this table.
• Use the documentation box to provide explanations if potential emissions are reported.
19
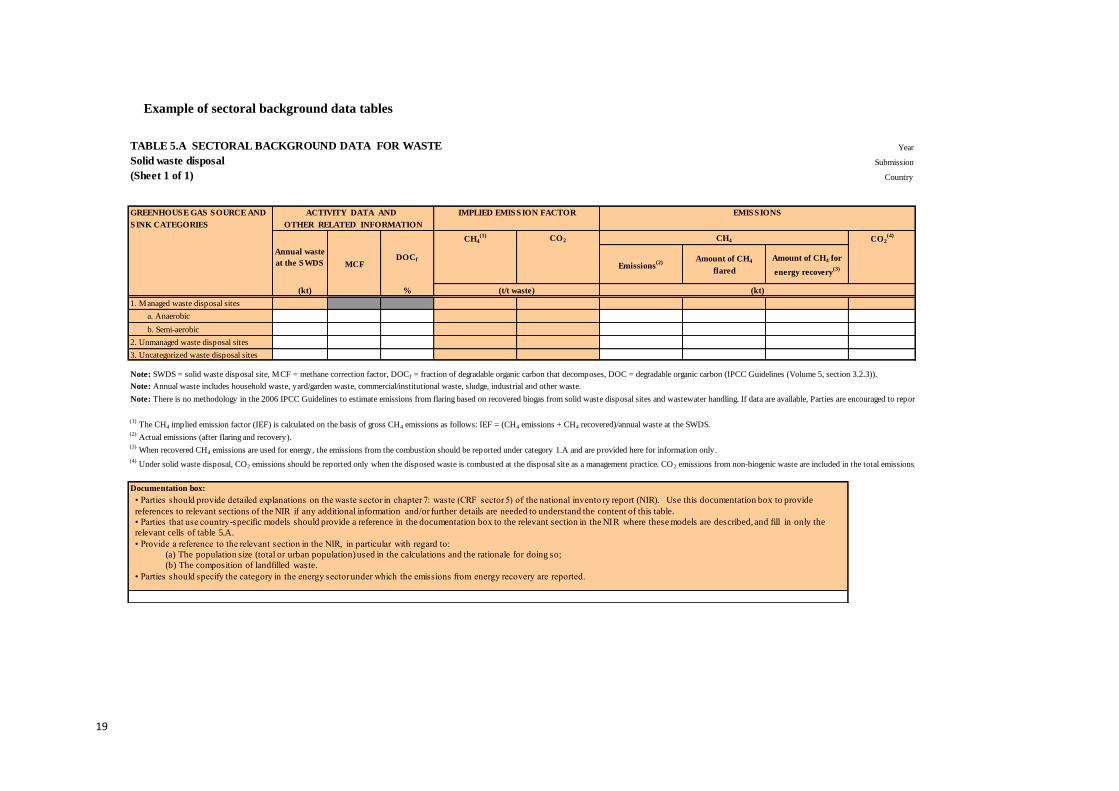
Example of sectoral background data tables
TABLE 5.A SECTORAL BACKGROUND DATA FOR WASTE Year
Solid waste disposal Submission
(Sheet 1 of 1) Country
GREENHOUSE GAS SOURCE AND ACTIVITY DATA AND IMPLIED EMISSION FACTOR EMISSIONS
SINK CATEGORIES OTHER RELATED INFORMATION
CH4(1) CO2 CH4 CO2
(4)
MCF Emissions(2)
Amount of CH4
flared
Amount of CH4 for
energy recovery(3)
(kt) % (t/t waste) (kt)
1. Managed waste disposal sites
a. Anaerobic
b. Semi-aerobic
2. Unmanaged waste disposal sites
3. Uncategorized waste disposal sites
Note: SWDS = solid waste disposal site, MCF = methane correction factor, DOCf = fraction of degradable organic carbon that decomposes, DOC = degradable organic carbon (IPCC Guidelines (Volume 5, section 3.2.3)).
Note: Annual waste includes household waste, yard/garden waste, commercial/institutional waste, sludge, industrial and other waste.
Note: There is no methodology in the 2006 IPCC Guidelines to estimate emissions from flaring based on recovered biogas from solid waste disposal sites and wastewater handling. If data are available, Parties are encouraged to report emissions of methane (CH 4) and nitrous oxide (N2O) under category 5.E.
(1) The CH4 implied emission factor (IEF) is calculated on the basis of gross CH4 emissions as follows: IEF = (CH4 emissions + CH4 recovered)/annual waste at the SWDS.
(2) Actual emissions (after flaring and recovery).
(3) When recovered CH4 emissions are used for energy, the emissions from the combustion should be reported under category 1.A and are provided here for information only.
(4) Under solid waste disposal, CO2 emissions should be reported only when the disposed waste is combusted at the disposal site as a management practice. CO2 emissions from non-biogenic waste are included in the total emissions, whereas the CO2 emissions from biogenic waste are not included in the total emissions.
Documentation box:
Annual waste
at the SWDS DOCf
• Parties should provide detailed explanations on the waste sector in chapter 7: waste (CRF sector 5) of the national invento ry report (NIR). Use this documentation box to provide
references to relevant sections of the NIR if any additional information and/or further details are needed to understand the content of this table.
• Parties that use country-specific models should provide a reference in the documentation box to the relevant section in the NIR where these models are described, and fill in only the
relevant cells of table 5.A.
• Provide a reference to the relevant section in the NIR, in particular with regard to:
(a) The population size (total or urban population) used in the calculations and the rationale for doing so;
(b) The composition of landfilled waste.
• Parties should specify the category in the energy sector under which the emissions from energy recovery are reported.
20
Annex III: Examples illustrating some of the options for implementing the flexibility
provisions7
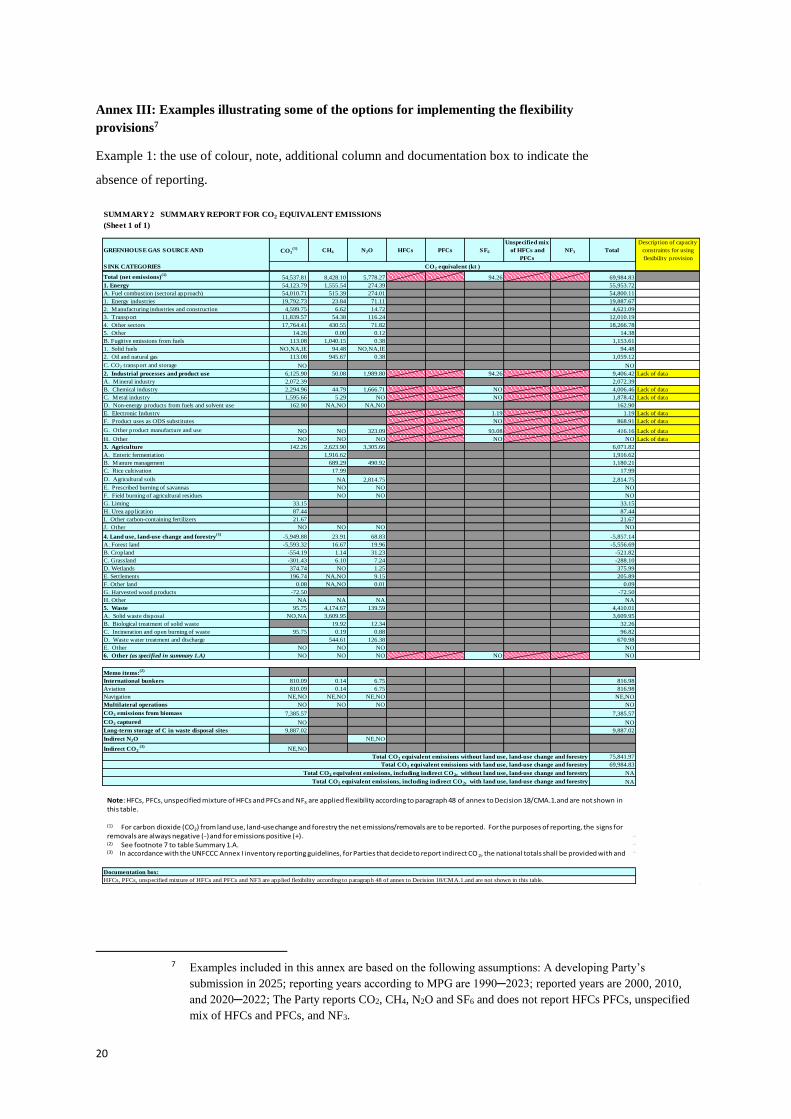
Example 1: the use of colour, note, additional column and documentation box to indicate the
absence of reporting.
7 Examples included in this annex are based on the following assumptions: A developing Party’s
submission in 2025; reporting years according to MPG are 1990─2023; reported years are 2000, 2010,
and 2020─2022; The Party reports CO2, CH4, N2O and SF6 and does not report HFCs PFCs, unspecified
mix of HFCs and PFCs, and NF3.
SUMMARY 2 SUMMARY REPORT FOR CO2 EQUIVALENT EMISSIONS
(Sheet 1 of 1)
GREENHOUSE GAS SOURCE AND CO2(1) CH4 N2O HFCs PFCs SF6
Unspecified mix
of HFCs and
PFCs
NF3 Total
Description of capacity
constraints for using
flexibility provision
SINK CATEGORIES CO2 equivalent (kt )
Total (net emissions)(1)
54,537.81 8,428.10 5,778.27 94.26 69,984.83
1. Energy 54,123.79 1,555.54 274.39 55,953.72
A. Fuel combustion (sectoral approach) 54,010.71 515.39 274.01 54,800.11
1. Energy industries 19,792.73 23.84 71.11 19,887.67
2. Manufacturing industries and construction 4,599.75 6.62 14.72 4,621.09
3. Transport 11,839.57 54.38 116.24 12,010.19
4. Other sectors 17,764.41 430.55 71.82 18,266.78
5. Other 14.26 0.00 0.12 14.38
B. Fugitive emissions from fuels 113.08 1,040.15 0.38 1,153.61
1. Solid fuels NO,NA,IE 94.48 NO,NA,IE 94.48
2. Oil and natural gas 113.08 945.67 0.38 1,059.12
C. CO2 transport and storage NO NO
2. Industrial processes and product use 6,125.90 50.08 1,989.80 94.26 9,406.42 Lack of data
A. Mineral industry 2,072.39 2,072.39
B. Chemical industry 2,294.96 44.79 1,666.71 NO 4,006.46 Lack of data
C. Metal industry 1,595.66 5.29 NO NO 1,878.42 Lack of data
D. Non-energy products from fuels and solvent use 162.90 NA,NO NA,NO 162.90
E. Electronic Industry 1.19 1.19 Lack of data
F. Product uses as ODS substitutes NO 868.91 Lack of data
G. Other product manufacture and use NO NO 323.09 93.08 416.16 Lack of data
H. Other NO NO NO NO NO Lack of data
3. Agriculture 142.26 2,623.90 3,305.66 6,071.82
A. Enteric fermentation 1,916.62 1,916.62
B. Manure management 689.29 490.92 1,180.21
C. Rice cultivation 17.99 17.99
D. Agricultural soils NA 2,814.75 2,814.75
E. Prescribed burning of savannas NO NO NO
F. Field burning of agricultural residues NO NO NO
G. Liming 33.15 33.15
H. Urea application 87.44 87.44
I. Other carbon-containing fertilizers 21.67 21.67
J. Other NO NO NO NO
4. Land use, land-use change and forestry(1)
-5,949.88 23.91 68.83 -5,857.14
A. Forest land -5,593.32 16.67 19.96 -5,556.69
B. Cropland -554.19 1.14 31.23 -521.82
C. Grassland -301.43 6.10 7.24 -288.10
D. Wetlands 374.74 NO 1.25 375.99
E. Settlements 196.74 NA,NO 9.15 205.89
F. Other land 0.08 NA,NO 0.01 0.09
G. Harvested wood products -72.50 -72.50
H. Other NA NA NA NA
5. Waste 95.75 4,174.67 139.59 4,410.01
A. Solid waste disposal NO,NA 3,609.95 3,609.95
B. Biological treatment of solid waste 19.92 12.34 32.26
C. Incineration and open burning of waste 95.75 0.19 0.88 96.82
D. Waste water treatment and discharge 544.61 126.38 670.98
E. Other NO NO NO NO
6. Other (as specified in summary 1.A) NO NO NO NO NO
Memo items:(2)
International bunkers 810.09 0.14 6.75 816.98
Aviation 810.09 0.14 6.75 816.98
Navigation NE,NO NE,NO NE,NO NE,NO
Multilateral operations NO NO NO NO
CO2 emissions from biomass 7,385.57 7,385.57
CO2 captured NO NO
Long-term storage of C in waste disposal sites 9,887.02 9,887.02
Indirect N2O NE,NO
Indirect CO2 (3)
NE,NO
Total CO2 equivalent emissions without land use, land-use change and forestry 75,841.97
Total CO2 equivalent emissions with land use, land-use change and forestry 69,984.83
Total CO2 equivalent emissions, including indirect CO2, without land use, land-use change and forestry NA
Total CO2 equivalent emissions, including indirect CO 2, with land use, land-use change and forestry NA
Documentation box:
HFCs, PFCs, unspecified mixture of HFCs and PFCs and NF3 are applied flexibility according to paragraph 48 of annex to Decision 18/CMA.1.and are not shown in this table.
Note: HFCs, PFCs, unspecified mixture of HFCs and PFCs and NF3 are applied flexibility according to paragraph 48 of annex to Decision 18/CMA.1.and are not shown in this table.
(1) For carbon dioxide (CO2) from land use, land-use change and forestry the net emissions/removals are to be reported. For the purposes of reporting, the signs for removals are always negative (-) and for emissions positive (+). (2) See footnote 7 to table Summary 1.A.(3) In accordance with the UNFCCC Annex I inventory reporting guidelines, for Parties that decide to report indirect CO 2, the national totals shall be provided with and
21
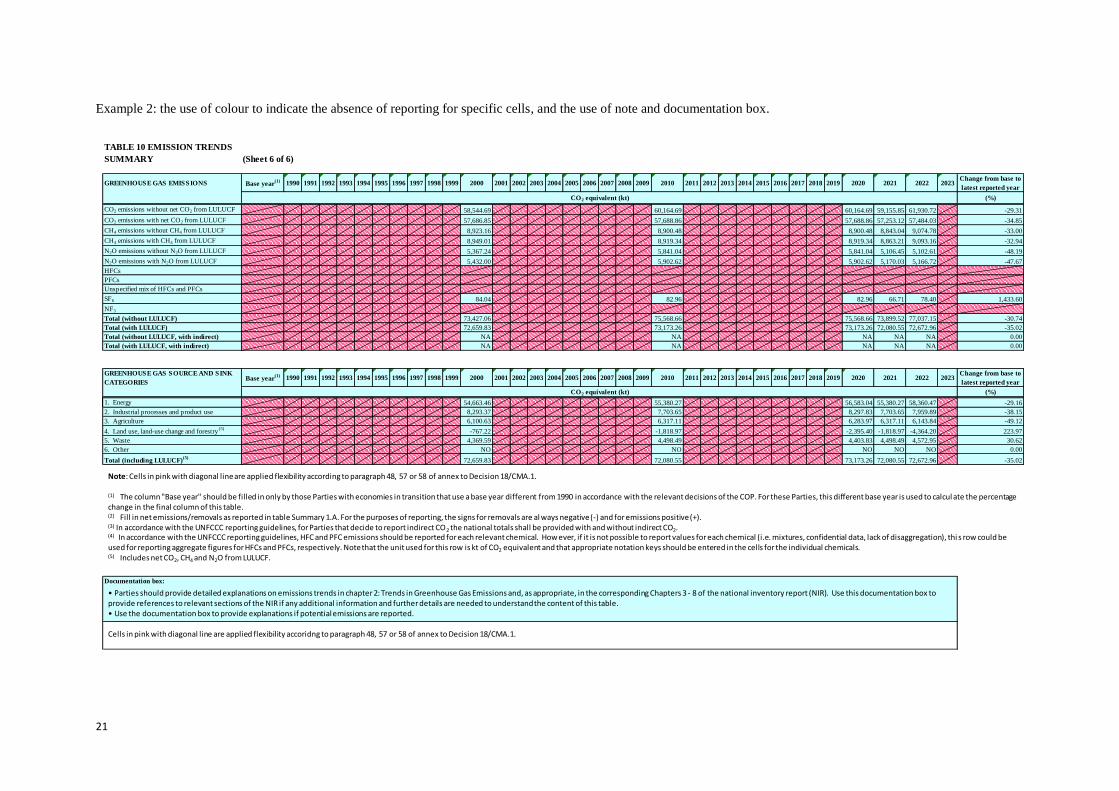
Example 2: the use of colour to indicate the absence of reporting for specific cells, and the use of note and documentation box.
TABLE 10 EMISSION TRENDS
SUMMARY (Sheet 6 of 6)
GREENHOUSE GAS EMISSIONS Base year(1) 1990 1991 1992 1993 1994 1995 1996 1997 1998 1999 2000 2001 2002 2003 2004 2005 2006 2007 2008 2009 2010 2011 2012 2013 2014 2015 2016 2017 2018 2019 2020 2021 2022 2023
Change from base to
latest reported year
CO2 equivalent (kt) (%)
CO2 emissions without net CO2 from LULUCF 58,544.69 60,164.69 60,164.69 59,155.85 61,930.72 -29.31
CO2 emissions with net CO2 from LULUCF 57,686.85 57,688.86 57,688.86 57,253.12 57,484.03 -34.85
CH4 emissions without CH4 from LULUCF 8,923.16 8,900.48 8,900.48 8,843.04 9,074.78 -33.00
CH4 emissions with CH4 from LULUCF 8,949.01 8,919.34 8,919.34 8,863.21 9,093.16 -32.94
N2O emissions without N2O from LULUCF 5,367.24 5,841.04 5,841.04 5,106.45 5,102.61 -48.19
N2O emissions with N2O from LULUCF 5,432.00 5,902.62 5,902.62 5,170.03 5,166.72 -47.67
HFCs
PFCs
Unspecified mix of HFCs and PFCs
SF6 84.04 82.96 82.96 66.71 78.40 1,433.60
NF3
Total (without LULUCF) 73,427.06 75,568.66 75,568.66 73,899.52 77,037.15 -30.74
Total (with LULUCF) 72,659.83 73,173.26 73,173.26 72,080.55 72,672.96 -35.02
Total (without LULUCF, with indirect) NA NA NA NA NA 0.00
Total (with LULUCF, with indirect) NA NA NA NA NA 0.00
GREENHOUSE GAS SOURCE AND SINK
CATEGORIESBase year
(1) 1990 1991 1992 1993 1994 1995 1996 1997 1998 1999 2000 2001 2002 2003 2004 2005 2006 2007 2008 2009 2010 2011 2012 2013 2014 2015 2016 2017 2018 2019 2020 2021 2022 2023Change from base to
latest reported year
CO2 equivalent (kt) (%)
1. Energy 54,663.46 55,380.27 56,583.04 55,380.27 58,360.47 -29.16
2. Industrial processes and product use 8,293.37 7,703.65 8,297.83 7,703.65 7,959.89 -38.15
3. Agriculture 6,100.63 6,317.11 6,283.97 6,317.11 6,143.84 -49.12
4. Land use, land-use change and forestry(5)
-767.22 -1,818.97 -2,395.40 -1,818.97 -4,364.20 223.97
5. Waste 4,369.59 4,498.49 4,403.83 4,498.49 4,572.95 30.62
6. Other NO NO NO NO NO 0.00
Total (including LULUCF)(5)
72,659.83 72,080.55 73,173.26 72,080.55 72,672.96 -35.02
Documentation box:
Note: Cells in pink with diagonal line are applied flexibility according to paragraph 48, 57 or 58 of annex to Decision 18/CMA.1.
(1) The column "Base year" should be filled in only by those Parties with economies in transition that use a base year different from 1990 in accordance with the relevant decisions of the COP. For these Parties, this different base year is used to calcul ate the percentage change in the final column of this table. (2) Fill in net emissions/removals as reported in table Summary 1.A. For the purposes of reporting, the signs for removals are al ways negative (-) and for emissions positive (+). (3) In accordance with the UNFCCC reporting guidelines, for Parties that decide to report indirect CO2 the national totals shall be provided with and without indirect CO2.(4) In accordance with the UNFCCC reporting guidelines, HFC and PFC emissions should be reported for each relevant chemical. How ever, if it is not possible to report values for each chemical (i.e. mixtures, confidential data, lack of disaggregation), thi s row could be used for reporting aggregate figures for HFCs and PFCs, respectively. Note that the unit used for this row is kt of CO2 equivalent and that appropriate notation keys should be entered in the cells for the individual chemicals. (5) Includes net CO2, CH4 and N2O from LULUCF.
• Parties should provide detailed explanations on emissions trends in chapter 2: Trends in Greenhouse Gas Emissions and, as appropriate, in the corresponding Chapters 3 - 8 of the national inventory report (NIR). Use this documentation box to provide references to relevant sections of the NIR if any additional information and further details are needed to understandthe content of this table.• Use the documentation box to provide explanations if potential emissions are reported.
Cells in pink with diagonal line are applied flexibility accoridng to paragraph 48, 57 or 58 of annex to Decision 18/CMA.1.
22
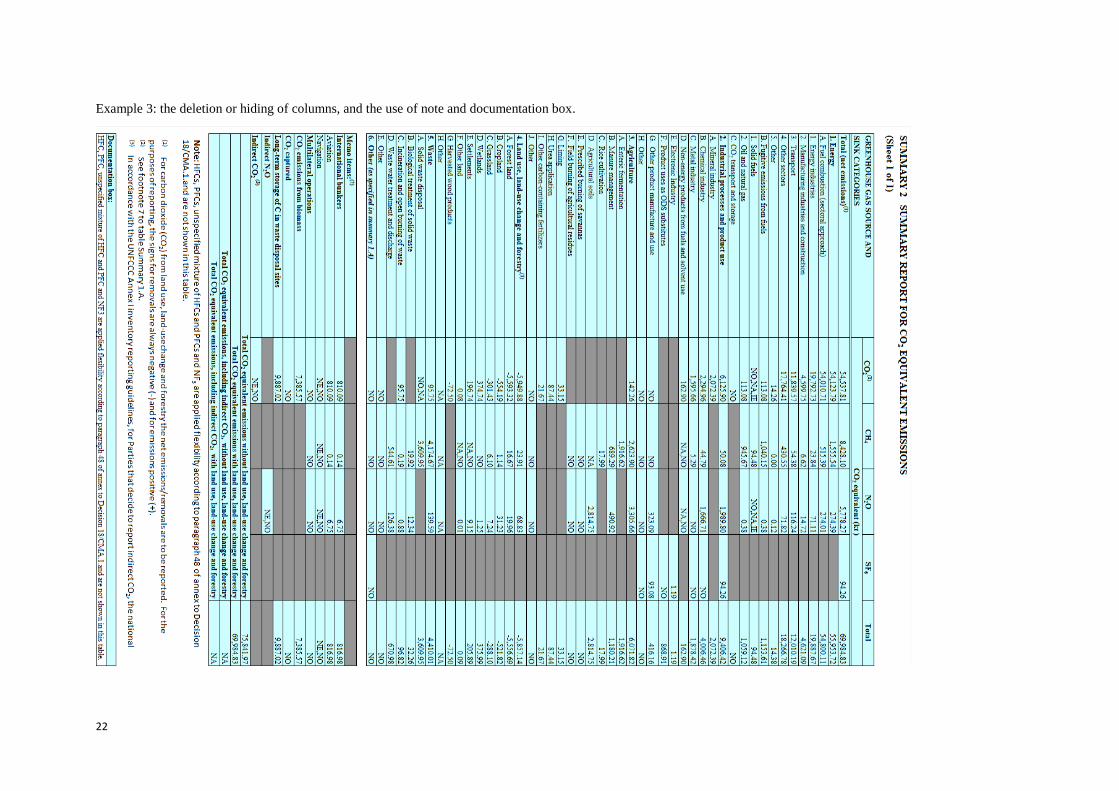
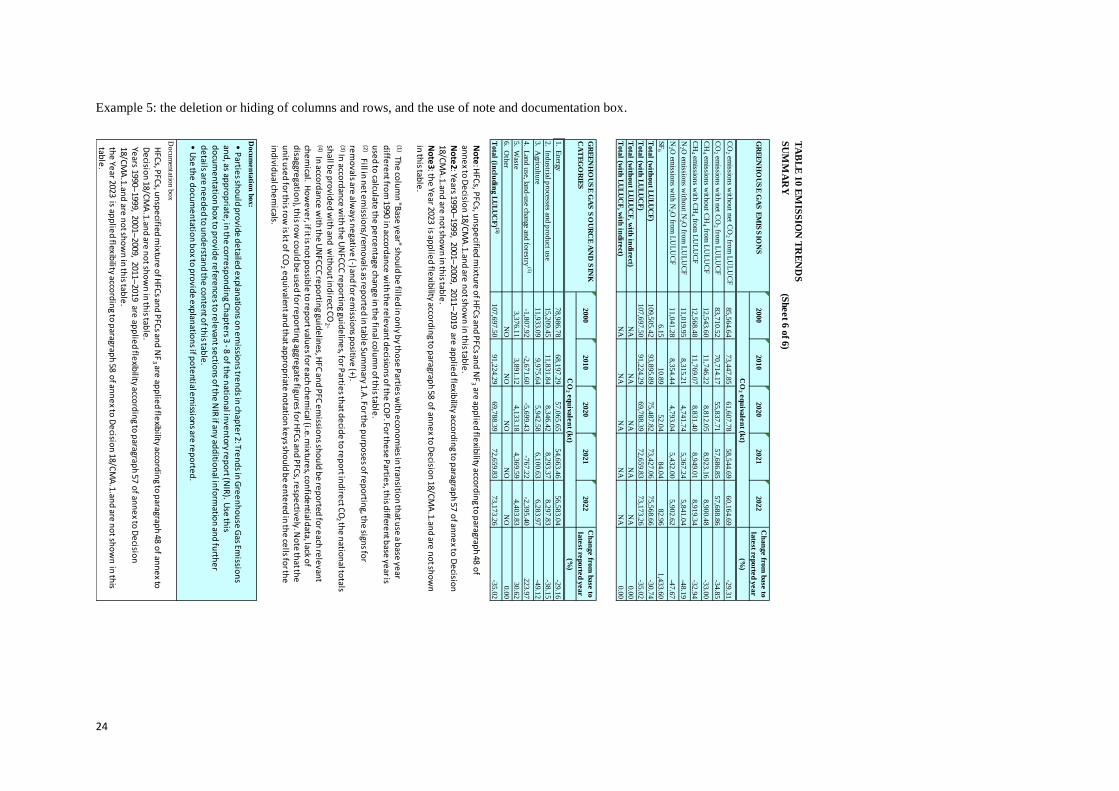
Example 3: the deletion or hiding of columns, and the use of note and documentation box.
23
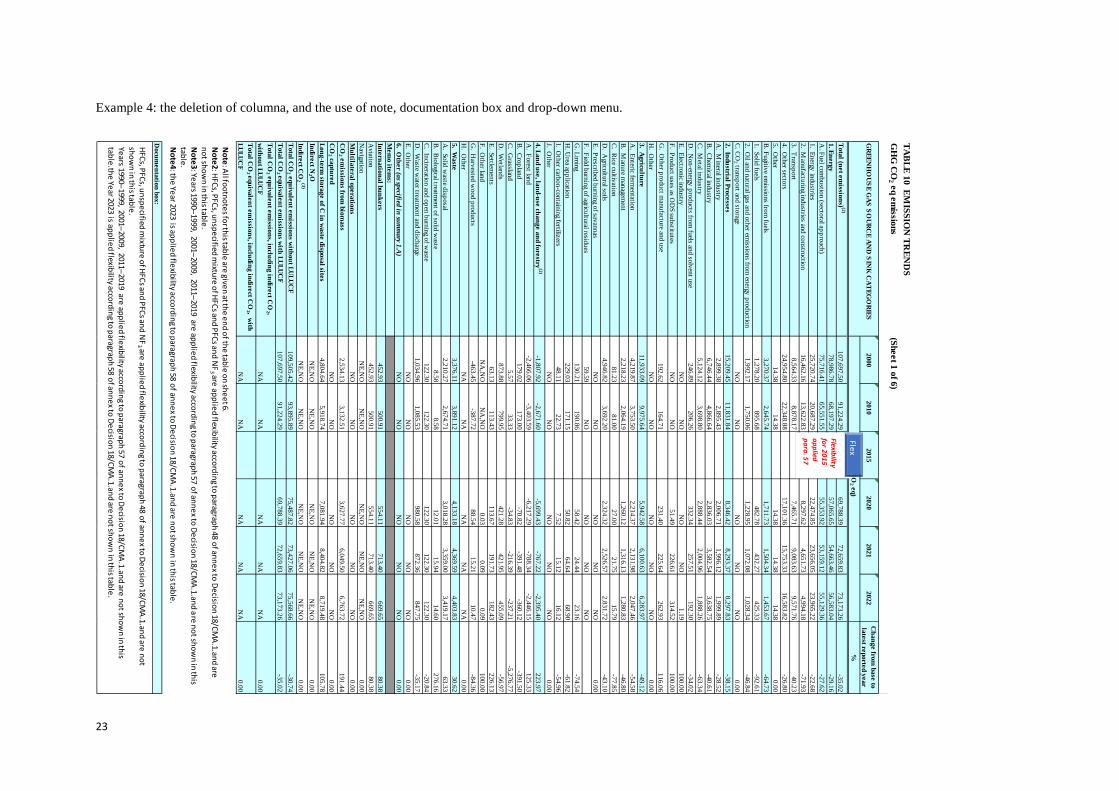
Example 4: the deletion of columna, and the use of note, documentation box and drop-down menu.
TA
BL
E 1
0 E
MIS
SIO
N T
RE
ND
S
GH
G C
O2 e
q e
missio
ns
(Sheet 1
of 6
)
GR
EE
NH
OU
SE
GA
S S
OU
RC
E A
ND
SIN
K C
AT
EG
OR
IES
20
00
20
10
20
15
20
20
20
21
20
22
Ch
an
ge fro
m b
ase
to
late
st rep
orte
d y
ea
r
(kt C
O2 e
q)
%
To
tal (n
et e
missio
ns)
(2)
10
7,6
97
.50
91
,22
4.2
96
9,7
88
.39
72
,65
9.8
37
3,1
73
.26
-35
.02
1. E
nerg
y7
8,9
86
.78
68
,19
7.2
95
7,0
65
.65
54
,66
3.4
65
6,5
83
.04
-29
.16
A. F
uel co
mb
ustio
n (secto
ral app
roach
)7
5,7
16
.41
65
,55
1.5
55
5,3
53
.92
53
,15
9.1
25
5,1
29
.36
-27
.62
1. E
nergy
ind
ustries
25
,72
0.7
42
0,6
87
.29
22
,47
4.8
52
3,6
56
.05
23
,96
5.2
2-2
2.6
8
2. M
anu
facturin
g ind
ustries an
d co
nstru
ction
16
,46
2.1
61
3,6
22
.83
8,2
97
.62
4,6
51
.73
4,9
94
.18
-71
.93
3. T
ransp
ort
8,5
64
.33
8,8
78
.17
7,4
65
.71
9,0
83
.63
9,5
71
.76
40
.23
4. O
ther secto
rs2
4,9
54
.80
22
,34
8.8
81
7,1
01
.36
15
,75
3.3
31
6,5
83
.82
-26
.80
5. O
ther
14
.38
14
.38
14
.38
14
.38
14
.38
0.0
0
B. F
ugitiv
e emissio
ns fro
m fu
els3
,27
0.3
72
,64
5.7
41
,71
1.7
31
,50
4.3
41
,45
3.6
7-6
4.7
3
1. S
olid
fuels
1,2
78
.20
89
5.6
84
82
.78
43
2.2
74
25
.33
-92
.61
2. O
il and
natu
ral gas and
oth
er emissio
ns fro
m en
ergy p
rod
uctio
n1
,99
2.1
71
,75
0.0
61
,22
8.9
51
,07
2.0
81
,02
8.3
4-4
6.8
4
C. C
O2 tran
spo
rt and
storage
NO
NO
NO
NO
NO
0.0
0
2. In
du
strial P
roce
sses
15
,20
9.4
51
1,8
31
.84
8,3
46
.42
8,2
93
.37
8,2
97
.83
-38
.15
A. M
ineral in
du
stry2
,89
9.3
82
,89
5.4
32
,00
6.7
11
,99
6.1
21
,99
9.8
9-2
8.5
2
B. C
hem
ical ind
ustry
6,7
46
.44
4,8
66
.64
2,8
36
.03
3,5
82
.54
3,6
38
.75
-40
.61
C. M
etal ind
ustry
5,1
24
.12
3,6
98
.80
2,8
88
.44
2,0
04
.96
1,8
88
.26
-63
.34
D. N
on
-energy
pro
du
cts from
fuels an
d so
lven
t use
24
6.8
92
06
.26
33
2.3
42
57
.51
19
2.3
0-3
4.0
2
E. E
lectron
ic ind
ustry
NO
NO
NO
NO
1.1
91
00
.00
F. P
rod
uct u
ses as OD
S su
bstitu
tesN
ON
O5
1.4
92
26
.61
31
4.5
21
00
.00
G. O
ther p
rod
uct m
anu
facture an
d u
se 1
92
.62
16
4.7
12
31
.40
22
5.6
42
62
.93
11
6.0
6
H. O
ther
NO
NO
NO
NO
NO
0.0
0
3. A
gricu
lture
11
,93
3.0
99
,97
5.6
45
,94
2.5
86
,10
0.6
36
,28
3.9
7-4
9.1
2
A. E
nteric ferm
entatio
n4
,21
9.8
73
,75
3.5
02
,21
4.3
72
,13
1.9
82
,04
7.4
6-5
4.5
8
B. M
anu
re man
agemen
t2
,21
8.2
32
,06
4.1
91
,26
0.1
21
,31
6.1
31
,28
0.8
3-4
6.8
0
C. R
ice cultiv
ation
81
.23
81
.00
27
.00
21
.75
15
.79
-77
.85
D. A
gricultu
ral soils
4,9
46
.82
3,6
92
.20
2,3
24
.32
2,5
26
.57
2,8
31
.72
-43
.10
E. P
rescribed
bu
rnin
g of sav
ann
asN
ON
ON
ON
ON
O0
.00
F. F
ield b
urn
ing o
f agricultu
ral residu
es5
9.5
9N
ON
ON
ON
O
G. L
imin
g1
30
.21
19
0.8
65
8.4
22
4.4
42
3.1
6-7
4.5
4
H. U
rea app
lication
22
9.0
31
71
.15
50
.82
64
.64
68
.90
-61
.82
I. Oth
er carbo
n-co
ntain
ing fertiliz
ers4
8.1
12
2.7
37
.52
15
.12
16
.12
-54
.96
J. Oth
er N
ON
ON
ON
ON
O0
.00
4. L
an
d u
se, la
nd
-use
cha
ng
e a
nd
fore
stry(2
)-1
,80
7.9
2-2
,67
1.6
0-5
,69
9.4
3-7
67
.22
-2,3
95
.40
22
3.9
7
A. F
orest lan
d-2
,46
6.0
6-3
,40
3.5
9-6
,21
7.2
9-7
88
.34
-2,4
46
.15
12
5.3
3
B. C
rop
land
17
9.0
21
73
.00
-70
.82
-39
1.4
8-3
60
.12
-39
1.5
0
C. G
rassland
5.5
73
3.3
3-3
4.8
3-2
16
.39
-23
7.2
1-5
,27
6.7
7
D. W
etland
s8
73
.88
79
9.9
54
21
.28
42
1.9
54
55
.09
-56
.97
E. S
ettlemen
ts 6
3.1
31
13
.43
11
3.6
71
91
.73
18
2.4
32
26
.13
F. O
ther lan
dN
A,N
ON
A,N
O0
.03
0.0
90
.09
10
0.0
0
G. H
arvested
wo
od
pro
du
cts-4
63
.45
-38
7.7
28
8.5
41
5.2
11
0.4
7-8
4.3
6
H. O
ther
NA
NA
NA
NA
NA
0.0
0
5. W
aste
3,3
76
.11
3,8
91
.12
4,1
33
.18
4,3
69
.59
4,4
03
.83
30
.62
A. S
olid
waste d
ispo
sal 2
,21
0.2
72
,67
4.7
13
,01
8.2
83
,35
9.0
03
,41
9.1
76
3.3
3
B. B
iolo
gical treatmen
t of so
lid w
aste8
.58
8.5
81
2.0
11
5.9
41
4.6
02
76
.16
C. In
cineratio
n an
d o
pen
bu
rnin
g of w
aste1
22
.30
12
2.3
01
22
.30
12
2.3
01
22
.30
-20
.84
D. W
aste water treatm
ent an
d d
ischarge
1,0
34
.96
1,0
85
.53
98
0.5
88
72
.36
84
7.7
5-3
5.1
7
E. O
ther
NO
NO
NO
NO
NO
0.0
0
6. O
ther (a
s specified
in su
mm
ary 1
.A)
NO
NO
NO
NO
NO
0.0
0
Mem
o ite
ms:
Inte
rna
tion
al b
un
kers
45
2.9
35
00
.91
55
4.1
17
13
.40
66
9.6
58
0.3
8
Av
iation
45
2.9
35
00
.91
55
4.1
17
13
.40
66
9.6
58
0.3
8
Nav
igation
NE
,NO
NE
,NO
NE
,NO
NE
,NO
NE
,NO
0.0
0
Mu
ltilate
ral o
pera
tion
sN
ON
ON
ON
ON
O0
.00
CO
2 em
ission
s from
bio
ma
ss2
,53
4.1
33
,13
2.5
13
,62
7.7
76
,04
9.5
06
,76
3.7
21
91
.44
CO
2 cap
ture
dN
ON
ON
ON
ON
O0
.00
Lo
ng
-term
stora
ge o
f C in
wa
ste d
ispo
sal site
s4
,80
4.6
45
,91
8.7
47
,08
1.9
48
,40
4.8
28
,71
9.4
81
05
.78
Ind
irect N
2 ON
E,N
ON
E,N
ON
E,N
ON
E,N
ON
E,N
O0
.00
Ind
irect C
O2
(3)
NE
,NO
NE
,NO
NE
,NO
NE
,NO
NE
,NO
0.0
0
To
tal C
O2 e
qu
ivale
nt e
missio
ns w
itho
ut L
UL
UC
F1
09
,50
5.4
29
3,8
95
.89
75
,48
7.8
27
3,4
27
.06
75
,56
8.6
6-3
0.7
4
To
tal C
O2
eq
uiva
len
t em
ission
s with
LU
LU
CF
10
7,6
97
.50
91
,22
4.2
96
9,7
88
.39
72
,65
9.8
37
3,1
73
.26
-35
.02
To
tal C
O2 e
qu
ivale
nt e
missio
ns, in
clud
ing
ind
irect C
O2 ,
with
ou
t LU
LU
CF
NA
NA
NA
NA
NA
0.0
0
To
tal C
O2
eq
uiva
len
t em
ission
s, inclu
din
g in
dire
ct CO
2 , with
LU
LU
CF
NA
NA
NA
NA
NA
0.0
0
Do
cum
en
tatio
n b
ox
:
No
te: A
ll foo
tno
tes fo
r this tab
le are
given
at the
en
d o
f the
table
on
she
et 6.
No
te2: H
FCs, P
FCs, u
nsp
ecified
mixtu
re of H
FCs an
d P
FCs an
d N
F3 are
app
lied
flexibility acco
rdin
g to p
aragraph
48 of an
ne
x to D
ecisio
n 18/C
MA
.1.and
are
no
t sho
wn
in th
is table
.N
ote
3: Years 1990─
1999, 2001─2009, 2011─
2019 are ap
plie
d flexib
ility accord
ing to
paragrap
h 57 o
f ann
ex to
De
cision
18/CM
A.1.an
d a
re n
ot sh
ow
nin
this
table
.N
ote
4: the
Year 2023 is ap
plie
d fle
xibility accord
ing to
paragrap
h 58 o
f ann
ex to
De
cision
18/CM
A.1.an
d are
no
t sho
wn
in th
is table
.
HFC
s, PFC
s, un
spe
cified m
ixture
of H
FCs an
d P
FCs an
d N
F3 are
app
lied
flexib
ility accord
ing to
paragrap
h 48 o
f ann
ex to
De
cision
18/CM
A.1.an
d are
no
t sh
ow
nin
this tab
le.
Years 1990─
1999, 2001─2009, 2011─
2019 are ap
plie
d fle
xibility acco
rdin
g to p
aragraph
57 of an
ne
x to D
ecisio
n 18/C
MA
.1.and
aren
ot sh
ow
nin
this
table
.the
Year 2023 is ap
plie
d flexib
ility accord
ing to
paragrap
h 58 o
f ann
ex to
De
cision
18/CM
A.1.an
d are
no
t sho
wn
in th
is table
.
Flexibility
for
20
15
a
pp
lied
pa
ra. 5
7
Flex
24
Example 5: the deletion or hiding of columns and rows, and the use of note and documentation box.
TA
BL
E 1
0 E
MIS
SIO
N T
RE
ND
S
SU
MM
AR
Y(S
heet 6
of 6
)
GR
EE
NH
OU
SE
GA
S E
MIS
SIO
NS
20
00
20
10
20
20
20
21
20
22
Ch
an
ge fro
m b
ase
to
late
st rep
orte
d y
ea
r
CO
2 eq
uiva
len
t (kt)
(%)
CO
2 emissio
ns w
itho
ut n
et CO
2 from
LU
LU
CF
85
,56
4.6
47
3,4
47
.85
61
,60
7.7
85
8,5
44
.69
60
,16
4.6
9-2
9.3
1
CO
2 emissio
ns w
ith n
et CO
2 from
LU
LU
CF
83
,71
0.5
27
0,7
14
.17
55
,83
7.7
15
7,6
86
.85
57
,68
8.8
6-3
4.8
5
CH
4 emissio
ns w
itho
ut C
H4 fro
m L
UL
UC
F1
2,5
43
.60
11
,74
6.2
28
,81
2.0
58
,92
3.1
68
,90
0.4
8-3
3.0
0
CH
4 emissio
ns w
ith C
H4 fro
m L
UL
UC
F1
2,5
68
.48
11
,76
9.0
78
,83
1.4
08
,94
9.0
18
,91
9.3
4-3
2.9
4
N2 O
emissio
ns w
itho
ut N
2 O fro
m L
UL
UC
F1
1,0
19
.95
8,3
15
.21
4,7
41
.74
5,3
67
.24
5,8
41
.04
-48
.19
N2 O
emissio
ns w
ith N
2 O fro
m L
UL
UC
F1
1,0
41
.28
8,3
54
.44
4,7
93
.04
5,4
32
.00
5,9
02
.62
-47
.67
SF
66
.15
10
.89
52
.04
84
.04
82
.96
1,4
33
.60
To
tal (w
itho
ut L
UL
UC
F)
10
9,5
05
.42
93
,89
5.8
97
5,4
87
.82
73
,42
7.0
67
5,5
68
.66
-30
.74
To
tal (w
ith L
UL
UC
F)
10
7,6
97
.50
91
,22
4.2
96
9,7
88
.39
72
,65
9.8
37
3,1
73
.26
-35
.02
To
tal (w
itho
ut L
UL
UC
F, w
ith in
dire
ct)N
AN
AN
AN
AN
A0
.00
To
tal (w
ith L
UL
UC
F, w
ith in
dire
ct)N
AN
AN
AN
AN
A0
.00
GR
EE
NH
OU
SE
GA
S S
OU
RC
E A
ND
SIN
K
CA
TE
GO
RIE
S2
00
02
01
02
02
02
02
12
02
2C
ha
ng
e fro
m b
ase
to
late
st rep
orte
d y
ea
r
CO
2 eq
uiva
len
t (kt)
(%)
1. E
nergy
7
8,9
86
.78
68
,19
7.2
95
7,0
65
.65
54
,66
3.4
65
6,5
83
.04
-29
.16
2. In
du
strial pro
cesses and
pro
du
ct use
15
,20
9.4
51
1,8
31
.84
8,3
46
.42
8,2
93
.37
8,2
97
.83
-38
.15
3. A
gricultu
re 1
1,9
33
.09
9,9
75
.64
5,9
42
.58
6,1
00
.63
6,2
83
.97
-49
.12
4. L
and
use, lan
d-u
se chan
ge and
forestry
(5)
-1,8
07
.92
-2,6
71
.60
-5,6
99
.43
-76
7.2
2-2
,39
5.4
02
23
.97
5. W
aste 3
,37
6.1
13
,89
1.1
24
,13
3.1
84
,36
9.5
94
,40
3.8
33
0.6
2
6. O
ther
NO
NO
NO
NO
NO
0.0
0
To
tal (in
clud
ing
LU
LU
CF
)(5
)1
07
,69
7.5
09
1,2
24
.29
69
,78
8.3
97
2,6
59
.83
73
,17
3.2
6-3
5.0
2
Do
cum
en
tatio
n b
ox
:
Do
cum
entatio
n b
ox
No
te: H
FCs, P
FCs, u
nsp
ecified
mixture
of H
FCs an
d P
FCs an
d N
F3
are ap
plie
d fle
xibility accord
ing to
paragrap
h 48 o
f an
ne
x to D
ecisio
n 18/C
MA
.1.and
are n
ot sh
ow
nin
this tab
le.
No
te2: Ye
ars 1990─1999, 2001─
2009, 2011─2019 are
app
lied
flexibility acco
rdin
g to p
aragraph
57 of an
ne
x to D
ecisio
n
18/CM
A.1.an
d are
no
t sho
wn
in th
is table
.N
ote
3: the
Year 2023 is ap
plie
d fle
xibility accord
ing to
paragrap
h 58 o
f ann
ex to
De
cision
18/CM
A.1.an
d are
no
t sho
wn
in th
is table
.
(1)Th
e co
lum
n "B
ase ye
ar" sho
uld
be
filled in
on
ly by th
ose
Partie
s with
eco
no
mies in
transitio
n that u
se a b
ase ye
ar d
iffere
nt from
1990 in acco
rdan
ce w
ith th
e re
levan
t de
cision
s of th
e C
OP
. For th
ese
Partie
s, this d
ifferent b
ase ye
ar is u
sed
to calcu
late th
e p
erce
ntage
chan
ge in
the
final co
lum
n o
f this tab
le.
(2)Fill in
ne
t em
issions/rem
ovals as re
po
rted
in tab
le Su
mm
ary 1.A. Fo
r the
pu
rpo
ses o
f rep
ortin
g, the
signs fo
r re
mo
vals are alw
ays ne
gative (-) and
for e
missio
ns po
sitive (+). (3)In
accord
ance
with
the
UN
FCC
C re
po
rting gu
ide
lines, fo
r Partie
s that d
ecid
e to
rep
ort in
dire
ct CO
2 the
natio
nal to
tals sh
all be
pro
vide
d w
ith an
d w
itho
ut in
direct C
O2 .
(4)In
accord
ance
with
the
UN
FCC
C re
po
rting gu
ide
lines, H
FC an
d P
FC e
missio
ns sh
ou
ld b
e re
po
rted fo
r each
rele
vant
che
mical. H
ow
eve
r, if it is no
t po
ssible to
rep
ort valu
es fo
r each
che
mical (i.e. m
ixture
s, con
fidential d
ata, lack of
disaggre
gation
), this ro
w co
uld
be
use
d fo
r rep
ortin
g aggregate
figures fo
r HFC
s and
PFC
s, resp
ective
ly. No
te that th
e
un
it use
d fo
r this ro
w is kt o
f CO
2e
qu
ivalent an
d th
at app
rop
riate n
otatio
n ke
ys sho
uld
be
en
tered
in th
e ce
lls for th
e
ind
ividu
al che
micals.
• Partie
s sho
uld
pro
vide d
etailed
explan
ations o
n e
missio
ns tre
nd
s in ch
apte
r 2: Tren
ds in
Gre
en
ho
use
Gas Em
ission
s an
d, as ap
pro
priate
, in th
e co
rresp
on
din
g Ch
apte
rs 3 -8 of th
e n
ation
al inve
ntory re
po
rt (NIR
). Use
this
do
cum
en
tation
bo
x to p
rovid
e re
ference
s to re
levan
t sectio
ns of th
e N
IR if an
y add
ition
al info
rmatio
n an
d fu
rthe
r d
etails are
ne
ed
ed to
un
de
rstand th
e co
nte
nt of th
is table
.• U
se th
e d
ocu
me
ntatio
n bo
x to p
rovid
e exp
lanatio
ns if p
ote
ntial em
issions are
rep
orte
d.
HFC
s, PFC
s, un
spe
cified m
ixture
of H
FCs an
d P
FCs an
d N
F3 are
app
lied
flexib
ility accord
ing to
paragrap
h 48 o
f ann
ex to
D
ecisio
n 18/C
MA
.1.and
are n
ot sh
ow
nin
this tab
le.
Years 1990─
1999, 2001─2009, 2011─
2019 are ap
plie
d fle
xibility acco
rdin
g to p
aragraph
57 of an
ne
x to D
ecisio
n
18/CM
A.1.an
d are
no
t sho
wn
in th
is table
.th
e Ye
ar 2023 is app
lied
flexibility acco
rdin
g to p
aragraph
58 of an
ne
x to D
ecisio
n 18/C
MA
.1.and
are n
ot sh
ow
nin
this
table
.
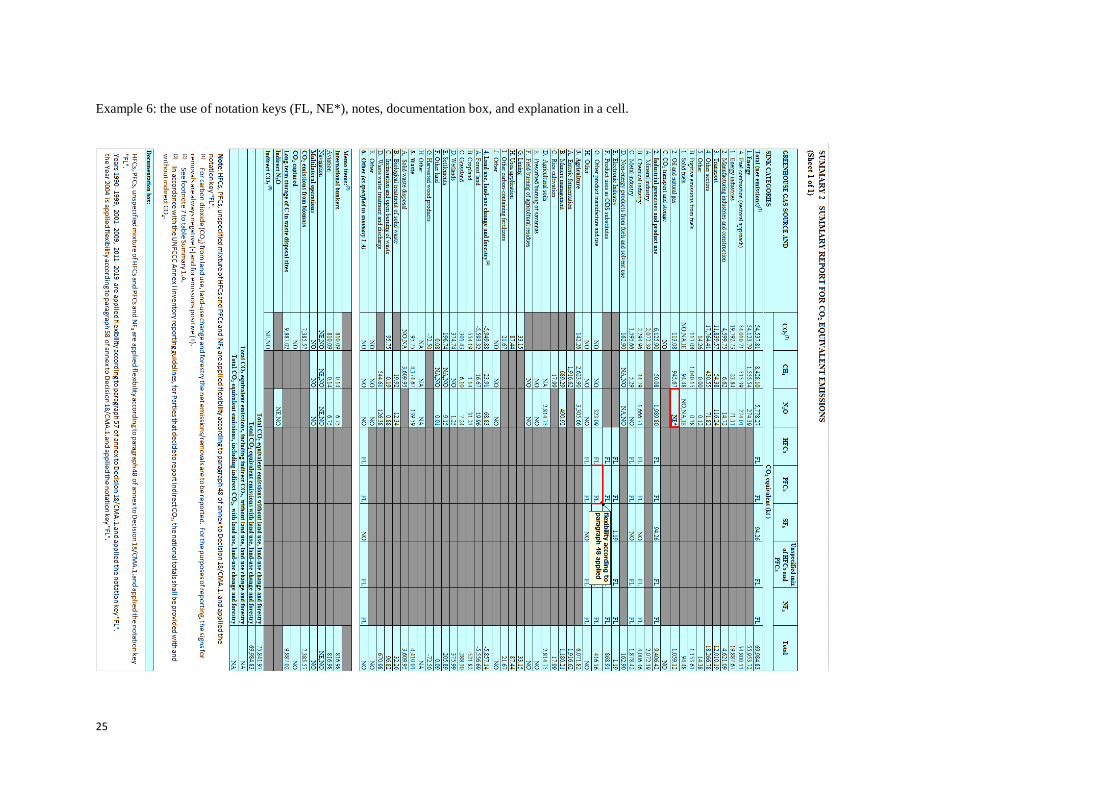
25
Example 6: the use of notation keys (FL, NE*), notes, documentation box, and explanation in a cell.
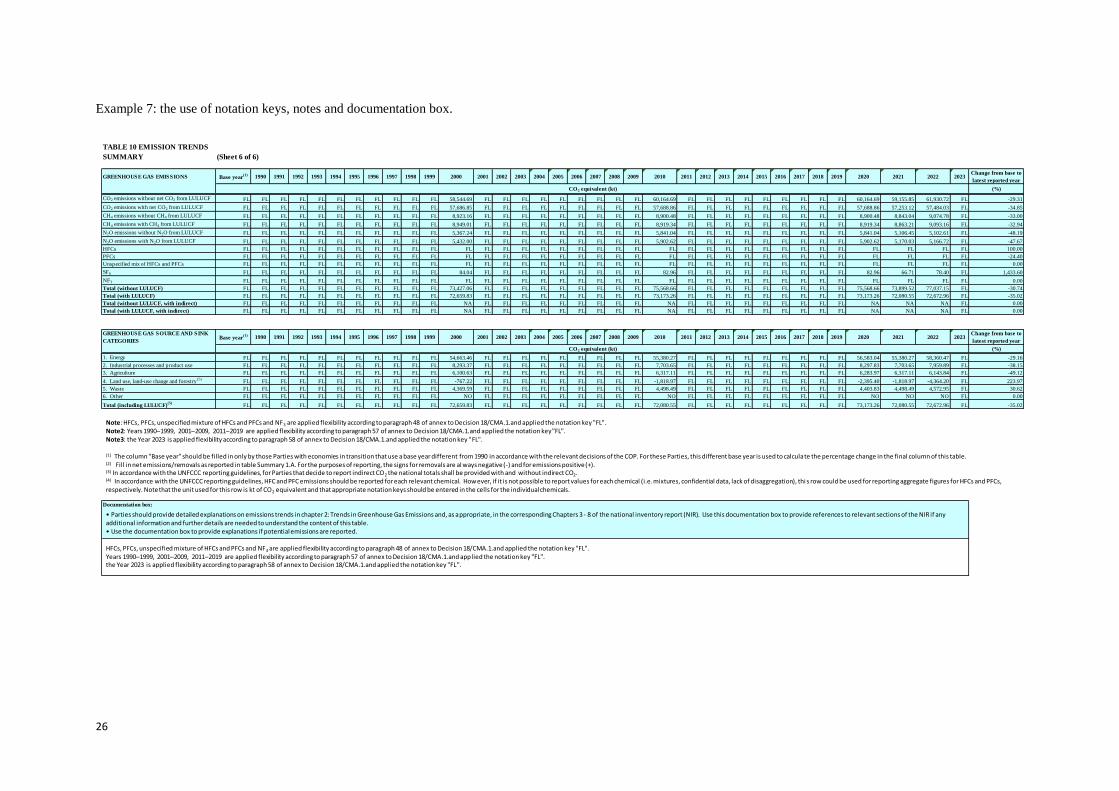
26
Example 7: the use of notation keys, notes and documentation box.
TABLE 10 EMISSION TRENDS
SUMMARY (Sheet 6 of 6)
GREENHOUSE GAS EMISSIONS Base year(1) 1990 1991 1992 1993 1994 1995 1996 1997 1998 1999 2000 2001 2002 2003 2004 2005 2006 2007 2008 2009 2010 2011 2012 2013 2014 2015 2016 2017 2018 2019 2020 2021 2022 2023
Change from base to
latest reported year
CO2 equivalent (kt) (%)
CO2 emissions without net CO2 from LULUCF FL FL FL FL FL FL FL FL FL FL FL 58,544.69 FL FL FL FL FL FL FL FL FL 60,164.69 FL FL FL FL FL FL FL FL FL 60,164.69 59,155.85 61,930.72 FL -29.31
CO2 emissions with net CO2 from LULUCF FL FL FL FL FL FL FL FL FL FL FL 57,686.85 FL FL FL FL FL FL FL FL FL 57,688.86 FL FL FL FL FL FL FL FL FL 57,688.86 57,253.12 57,484.03 FL -34.85
CH4 emissions without CH4 from LULUCF FL FL FL FL FL FL FL FL FL FL FL 8,923.16 FL FL FL FL FL FL FL FL FL 8,900.48 FL FL FL FL FL FL FL FL FL 8,900.48 8,843.04 9,074.78 FL -33.00
CH4 emissions with CH4 from LULUCF FL FL FL FL FL FL FL FL FL FL FL 8,949.01 FL FL FL FL FL FL FL FL FL 8,919.34 FL FL FL FL FL FL FL FL FL 8,919.34 8,863.21 9,093.16 FL -32.94
N2O emissions without N2O from LULUCF FL FL FL FL FL FL FL FL FL FL FL 5,367.24 FL FL FL FL FL FL FL FL FL 5,841.04 FL FL FL FL FL FL FL FL FL 5,841.04 5,106.45 5,102.61 FL -48.19
N2O emissions with N2O from LULUCF FL FL FL FL FL FL FL FL FL FL FL 5,432.00 FL FL FL FL FL FL FL FL FL 5,902.62 FL FL FL FL FL FL FL FL FL 5,902.62 5,170.03 5,166.72 FL -47.67
HFCs FL FL FL FL FL FL FL FL FL FL FL FL FL FL FL FL FL FL FL FL FL FL FL FL FL FL FL FL FL FL FL FL FL FL FL 100.00
PFCs FL FL FL FL FL FL FL FL FL FL FL FL FL FL FL FL FL FL FL FL FL FL FL FL FL FL FL FL FL FL FL FL FL FL FL -24.40
Unspecified mix of HFCs and PFCs FL FL FL FL FL FL FL FL FL FL FL FL FL FL FL FL FL FL FL FL FL FL FL FL FL FL FL FL FL FL FL FL FL FL FL 0.00
SF6 FL FL FL FL FL FL FL FL FL FL FL 84.04 FL FL FL FL FL FL FL FL FL 82.96 FL FL FL FL FL FL FL FL FL 82.96 66.71 78.40 FL 1,433.60
NF3 FL FL FL FL FL FL FL FL FL FL FL FL FL FL FL FL FL FL FL FL FL FL FL FL FL FL FL FL FL FL FL FL FL FL FL 0.00
Total (without LULUCF) FL FL FL FL FL FL FL FL FL FL FL 73,427.06 FL FL FL FL FL FL FL FL FL 75,568.66 FL FL FL FL FL FL FL FL FL 75,568.66 73,899.52 77,037.15 FL -30.74
Total (with LULUCF) FL FL FL FL FL FL FL FL FL FL FL 72,659.83 FL FL FL FL FL FL FL FL FL 73,173.26 FL FL FL FL FL FL FL FL FL 73,173.26 72,080.55 72,672.96 FL -35.02
Total (without LULUCF, with indirect) FL FL FL FL FL FL FL FL FL FL FL NA FL FL FL FL FL FL FL FL FL NA FL FL FL FL FL FL FL FL FL NA NA NA FL 0.00
Total (with LULUCF, with indirect) FL FL FL FL FL FL FL FL FL FL FL NA FL FL FL FL FL FL FL FL FL NA FL FL FL FL FL FL FL FL FL NA NA NA FL 0.00
GREENHOUSE GAS SOURCE AND SINK
CATEGORIESBase year
(1) 1990 1991 1992 1993 1994 1995 1996 1997 1998 1999 2000 2001 2002 2003 2004 2005 2006 2007 2008 2009 2010 2011 2012 2013 2014 2015 2016 2017 2018 2019 2020 2021 2022 2023Change from base to
latest reported year
CO2 equivalent (kt) (%)
1. Energy FL FL FL FL FL FL FL FL FL FL FL 54,663.46 FL FL FL FL FL FL FL FL FL 55,380.27 FL FL FL FL FL FL FL FL FL 56,583.04 55,380.27 58,360.47 FL -29.16
2. Industrial processes and product use FL FL FL FL FL FL FL FL FL FL FL 8,293.37 FL FL FL FL FL FL FL FL FL 7,703.65 FL FL FL FL FL FL FL FL FL 8,297.83 7,703.65 7,959.89 FL -38.15
3. Agriculture FL FL FL FL FL FL FL FL FL FL FL 6,100.63 FL FL FL FL FL FL FL FL FL 6,317.11 FL FL FL FL FL FL FL FL FL 6,283.97 6,317.11 6,143.84 FL -49.12
4. Land use, land-use change and forestry(5)
FL FL FL FL FL FL FL FL FL FL FL -767.22 FL FL FL FL FL FL FL FL FL -1,818.97 FL FL FL FL FL FL FL FL FL -2,395.40 -1,818.97 -4,364.20 FL 223.97
5. Waste FL FL FL FL FL FL FL FL FL FL FL 4,369.59 FL FL FL FL FL FL FL FL FL 4,498.49 FL FL FL FL FL FL FL FL FL 4,403.83 4,498.49 4,572.95 FL 30.62
6. Other FL FL FL FL FL FL FL FL FL FL FL NO FL FL FL FL FL FL FL FL FL NO FL FL FL FL FL FL FL FL FL NO NO NO FL 0.00
Total (including LULUCF)(5)
FL FL FL FL FL FL FL FL FL FL FL 72,659.83 FL FL FL FL FL FL FL FL FL 72,080.55 FL FL FL FL FL FL FL FL FL 73,173.26 72,080.55 72,672.96 FL -35.02
Documentation box:
Note: HFCs, PFCs, unspecified mixture of HFCs and PFCs and NF3 are applied flexibility according to paragraph 48 of annex to Decision 18/CMA.1.and applied the notation key "FL".Note2: Years 1990─1999, 2001─2009, 2011─2019 are applied flexibility according to paragraph 57 of annex to Decision 18/CMA.1.and applied the notation key "FL".Note3: the Year 2023 is applied flexibility according to paragraph 58 of annex to Decision 18/CMA.1.and applied the notation key "FL".
(1) The column "Base year" should be filled in only by those Parties with economies in transition that use a base year different from 1990 in accordance with the relevant decisions of the COP. For these Parties, this different base year is used to calculate the percentage change in the final column of this table. (2) Fill in net emissions/removals as reported in table Summary 1.A. For the purposes of reporting, the signs for removals are al ways negative (-) and for emissions positive (+). (3) In accordance with the UNFCCC reporting guidelines, for Parties that decide to report indirect CO2 the national totals shall be provided with and without indirect CO2.(4) In accordance with the UNFCCC reporting guidelines, HFC and PFC emissions should be reported for each relevant chemical. How ever, if it is not possible to report values for each chemical (i.e. mixtures, confidential data, lack of disaggregation), thi s row could be used for reporting aggregate figures for HFCs and PFCs, respectively. Note that the unit used for this row is kt of CO2 equivalent and that appropriate notation keys should be entered in the cells for the individual chemicals.
• Parties should provide detailed explanations on emissions trends in chapter 2: Trends in Greenhouse Gas Emissions and, as appropriate, in the corresponding Chapters 3 - 8 of the national inventory report (NIR). Use this documentation box to provide references to relevant sections of the NIR if any additional information and further details are needed to understand the content of this table.• Use the documentation box to provide explanations if potential emissions are reported.
HFCs, PFCs, unspecified mixture of HFCs and PFCs and NF3 are applied flexibility according to paragraph 48 of annex to Decision 18/CMA.1.and applied the notation key "FL".Years 1990─1999, 2001─2009, 2011─2019 are applied flexibility according to paragraph 57 of annex to Decision 18/CMA.1.and app lied the notation key "FL".the Year 2023 is applied flexibility according to paragraph 58 of annex to Decision 18/CMA.1.and applied the notation key "FL".
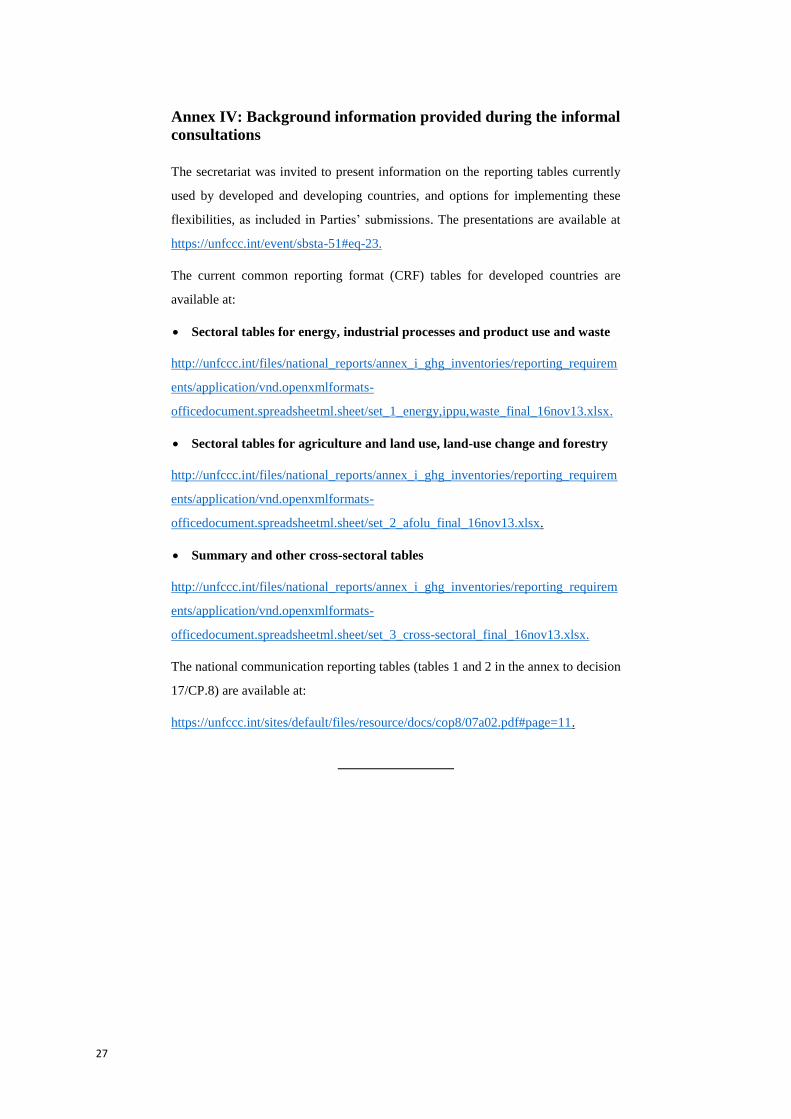
27
Annex IV: Background information provided during the informal
consultations
The secretariat was invited to present information on the reporting tables currently
used by developed and developing countries, and options for implementing these
flexibilities, as included in Parties’ submissions. The presentations are available at
https://unfccc.int/event/sbsta-51#eq-23.
The current common reporting format (CRF) tables for developed countries are
available at:
• Sectoral tables for energy, industrial processes and product use and waste
http://unfccc.int/files/national_reports/annex_i_ghg_inventories/reporting_requirem
ents/application/vnd.openxmlformats-
officedocument.spreadsheetml.sheet/set_1_energy,ippu,waste_final_16nov13.xlsx.
• Sectoral tables for agriculture and land use, land-use change and forestry
http://unfccc.int/files/national_reports/annex_i_ghg_inventories/reporting_requirem
ents/application/vnd.openxmlformats-
officedocument.spreadsheetml.sheet/set_2_afolu_final_16nov13.xlsx.
• Summary and other cross-sectoral tables
http://unfccc.int/files/national_reports/annex_i_ghg_inventories/reporting_requirem
ents/application/vnd.openxmlformats-
officedocument.spreadsheetml.sheet/set_3_cross-sectoral_final_16nov13.xlsx.
The national communication reporting tables (tables 1 and 2 in the annex to decision
17/CP.8) are available at:
https://unfccc.int/sites/default/files/resource/docs/cop8/07a02.pdf#page=11.