Embed Size (px)
Citation preview
ST JOHN’S COLLEGE CAMBRIDGE
Annual Report and Accounts
for the year ended 30 June 2010
Registered Charity number 1137428
Contents Page
Overview of St John’s College College Governance Membership of the Governing Body Principal Professional Advisers Annual Review
1
1
3
4
5 Statement of Responsibilities of the College Council
16
Report of the Auditors
17
Statement of Principal Accounting Policies
19
Consolidated Income and Expenditure Account
26
Consolidated Statement of Total Recognised Gains & Losses
27
Consolidated Balance Sheet
28
College Balance Sheet
29
Consolidated Cash Flow Statement
30
Notes to the Accounts
31
Overview of St John’s College Founded in 1511, St John’s College (formally “The College of St John the Evangelist in the University of Cambridge”) is one of the largest of the 31 colleges within the University of Cambridge, each of which is an independent, self-governing, body with its own property and income. As at 1 June 2010, the College had 141 Fellows and 894 junior members comprising 545 undergraduates and 349 graduates. As at 30 June 2010, the College itself and its subsidiaries had 284 staff (full-time equivalent). In addition, as at 31 October 2010, St John’s College School, the source of choristers for the College’s world renowned choir, had 92 staff (full-time equivalent) and 452 pupils. In constitutional terms, the College is an eleemosynary (i.e. dependent on charity) chartered corporation established by Charter dated 9 April 1511. The aims of the College, as specified by its Statutes, are the promotion of education, religion, learning and research. The College is a charity under English law. Formerly an exempt charity under the terms of Schedule 2 of the Charities Act 1993, the College became registered as a charity with effect from 11 August 2010. Its registration number is 1137428.
The College fulfils its charitable objectives through a wide variety of activities including: admitting undergraduate students for University courses and accepting graduate students admitted by the University; providing, in conjunction with the University, a world class education particularly through small group teaching and academic supervision; supporting students financially through the provision of scholarships, access bursaries, grants and allowances, as well as supporting students in particular financial hardship; supporting research through an annual competition for election to Research Fellowships, the research activities of its Fellows and a programme of visitors from overseas; providing accommodation for students and Fellows; providing library, ICT, cultural and sporting facilities; operating St John’s College School; and promoting an outstanding choral tradition through the College choir.
As part of ‘Collegiate Cambridge’, the long-term success of the College as a centre of academic and educational excellence is dependent on the continuance of the University of Cambridge’s world-class position.
College Governance The Statutes of the College lay down the constitution and arrangements for governance of the College. They describe, among other things, the membership and responsibilities of the Governing Body and Council; the election and duties of the Master and President; the election, admission, tenure and removal of Fellows; and the appointment and duties of College officers. The Statutes are supplemented by orders for the regulation of the College’s affairs, made by the Council in accordance with the Statutes. The Governing Body of the College consists of the Master and all Fellows, and is the ultimate authority in the government of the College. It meets termly or more frequently as necessary. The Governing Body in turn elects for rotating four year terms twelve Fellows who, together with the Master, act as a College Council for the day-to-day administration of the affairs of the College. The members of the College Council are the charity trustees. Elected representatives of the junior members of the College attend College Council meetings for the discussion of matters directly affecting the interests of undergraduates and post-graduates.
1
2
The Master of the College is elected to office by the Fellows until retirement or earlier resignation. He is responsible for general oversight of the affairs of the College. The Master chairs the Governing Body and the Council. The other College officers most involved in the governance of the College are as follows: the President, who is elected by the Fellows for a period of up to four years and, among other duties, acts as the Master’s deputy in his absence; the Senior Tutor, who has overall responsibility for admissions, education and welfare of students; the Deans, who are responsible for overseeing the Chapel and the conduct of junior members of the College; the Senior Bursar, who is responsible for managing the College’s finances; and the Domestic Bursar, who manages the domestic affairs of the College. The Fellowship, more widely, participates actively in the governance of the College through membership of a wide variety of committees that support the Council’s work. Among those committees, the Investments Committee and the Finance Committee have had a number of external members for several years. In addition, the Council appoints an Audit Committee which acts as a board of scrutiny and reports to the Governing Body. The Visitor of the College is the Bishop of Ely. Members of the Governing Body and the College Council, as at 31 October 2010, are set out in ‘Membership of the Governing Body’ below. St John’s College School has its own Governors, who are appointed by the College Council. As at 31 October 2010, 6 of the 12 Governors of the School were Fellows of the College. The School Governors are responsible to the College Council, and ultimately the Governing Body, for the educational policy, management and finances of the School.
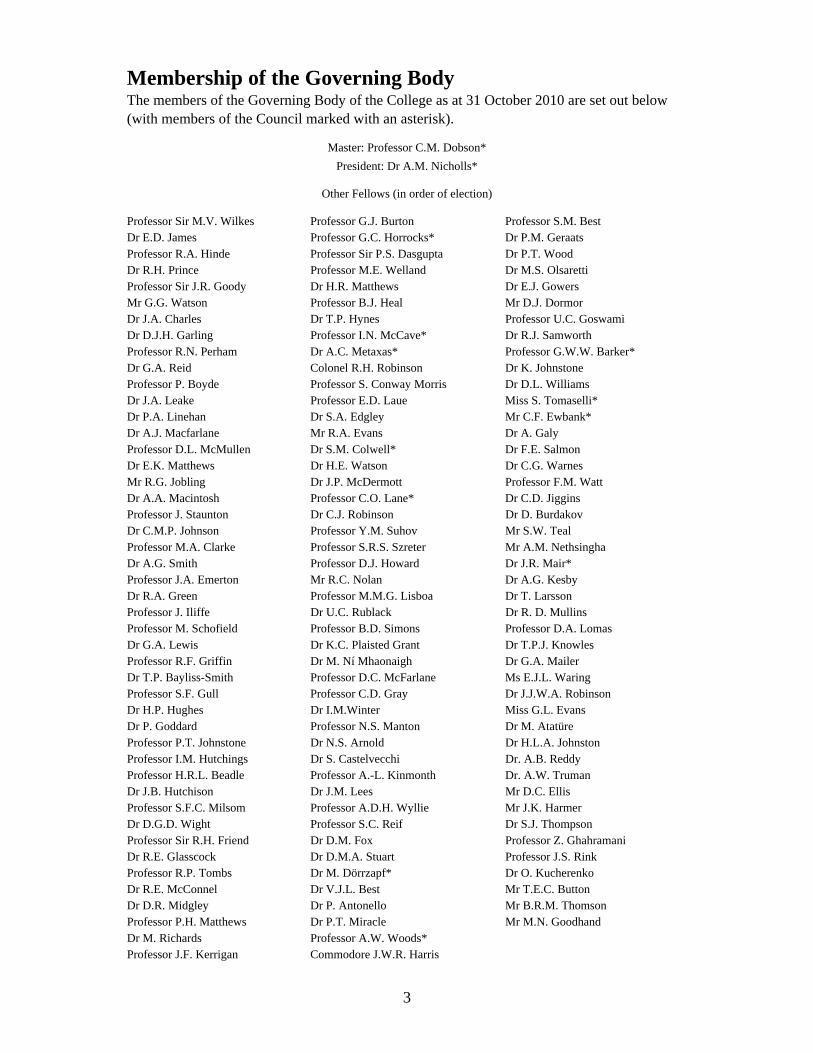
Membership of the Governing Body
The members of the Governing Body of the College as at 31 October 2010 are set out below (with members of the Council marked with an asterisk).
Master: Professor C.M. Dobson*
President: Dr A.M. Nicholls*
Other Fellows (in order of election)
Professor Sir M.V. Wilkes Professor G.J. Burton Professor S.M. Best Dr E.D. James Professor G.C. Horrocks* Dr P.M. Geraats Professor R.A. Hinde Professor Sir P.S. Dasgupta Dr P.T. Wood Dr R.H. Prince Professor M.E. Welland Dr M.S. Olsaretti Professor Sir J.R. Goody Dr H.R. Matthews Dr E.J. Gowers Mr G.G. Watson Professor B.J. Heal Mr D.J. Dormor Dr J.A. Charles Dr T.P. Hynes Professor U.C. Goswami Dr D.J.H. Garling Professor I.N. McCave* Dr R.J. Samworth Professor R.N. Perham Dr A.C. Metaxas* Professor G.W.W. Barker* Dr G.A. Reid Colonel R.H. Robinson Dr K. Johnstone Professor P. Boyde Professor S. Conway Morris Dr D.L. Williams Dr J.A. Leake Professor E.D. Laue Miss S. Tomaselli* Dr P.A. Linehan Dr S.A. Edgley Mr C.F. Ewbank* Dr A.J. Macfarlane Mr R.A. Evans Dr A. Galy Professor D.L. McMullen Dr S.M. Colwell* Dr F.E. Salmon Dr E.K. Matthews Dr H.E. Watson Dr C.G. Warnes Mr R.G. Jobling Dr J.P. McDermott Professor F.M. Watt Dr A.A. Macintosh Professor C.O. Lane* Dr C.D. Jiggins Professor J. Staunton Dr C.J. Robinson Dr D. Burdakov Dr C.M.P. Johnson Professor Y.M. Suhov Mr S.W. Teal Professor M.A. Clarke Professor S.R.S. Szreter Mr A.M. Nethsingha Dr A.G. Smith Professor D.J. Howard Dr J.R. Mair* Professor J.A. Emerton Mr R.C. Nolan Dr A.G. Kesby Dr R.A. Green Professor M.M.G. Lisboa Dr T. Larsson Professor J. Iliffe Dr U.C. Rublack Dr R. D. Mullins Professor M. Schofield Professor B.D. Simons Professor D.A. Lomas Dr G.A. Lewis Dr K.C. Plaisted Grant Dr T.P.J. Knowles Professor R.F. Griffin Dr M. Ní Mhaonaigh Dr G.A. Mailer Dr T.P. Bayliss-Smith Professor D.C. McFarlane Ms E.J.L. Waring Professor S.F. Gull Professor C.D. Gray Dr J.J.W.A. Robinson Dr H.P. Hughes Dr I.M.Winter Miss G.L. Evans Dr P. Goddard Professor N.S. Manton Dr M. Atatüre Professor P.T. Johnstone Dr N.S. Arnold Dr H.L.A. Johnston Professor I.M. Hutchings Dr S. Castelvecchi Dr. A.B. Reddy Professor H.R.L. Beadle Professor A.-L. Kinmonth Dr. A.W. Truman Dr J.B. Hutchison Dr J.M. Lees Mr D.C. Ellis Professor S.F.C. Milsom Professor A.D.H. Wyllie Mr J.K. Harmer Dr D.G.D. Wight Professor S.C. Reif Dr S.J. Thompson Professor Sir R.H. Friend Dr D.M. Fox Professor Z. Ghahramani Dr R.E. Glasscock Dr D.M.A. Stuart Professor J.S. Rink Professor R.P. Tombs Dr M. Dörrzapf* Dr O. Kucherenko Dr R.E. McConnel Dr V.J.L. Best Mr T.E.C. Button Dr D.R. Midgley Dr P. Antonello Mr B.R.M. Thomson Professor P.H. Matthews Dr P.T. Miracle Mr M.N. Goodhand Dr M. Richards Professor A.W. Woods* Professor J.F. Kerrigan Commodore J.W.R. Harris
3
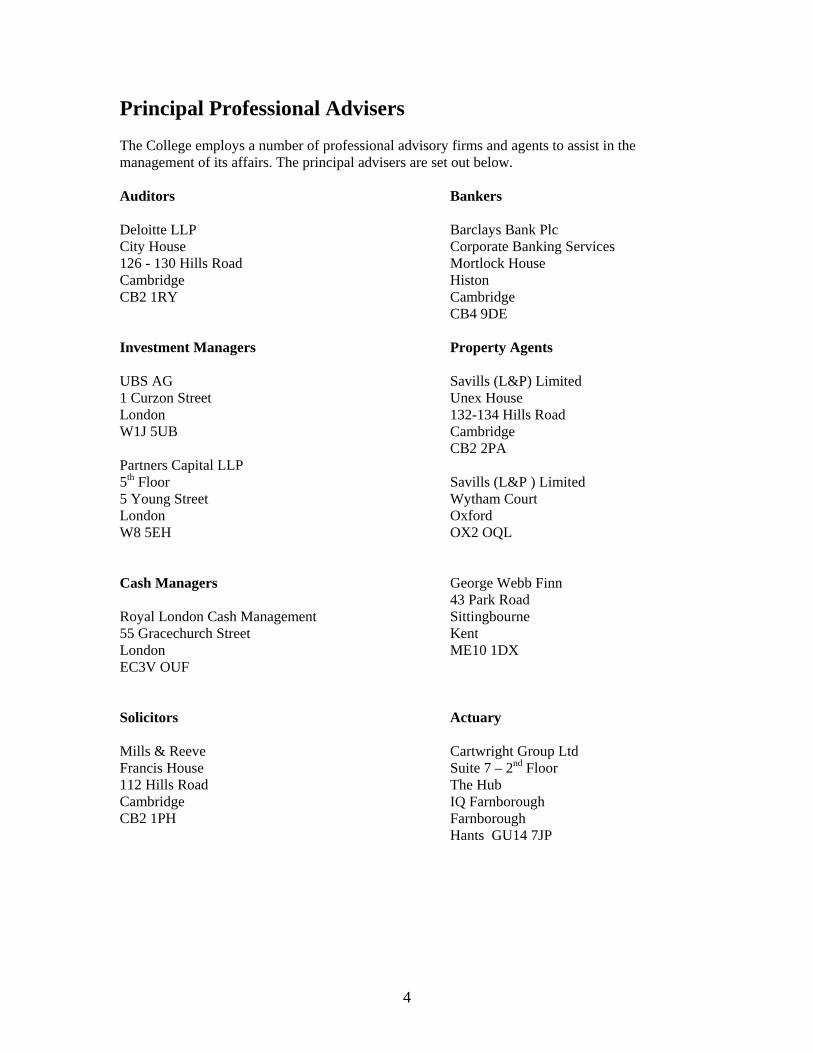
Principal Professional Advisers The College employs a number of professional advisory firms and agents to assist in the management of its affairs. The principal advisers are set out below. Auditors Deloitte LLP City House 126 - 130 Hills Road Cambridge CB2 1RY
Bankers Barclays Bank Plc Corporate Banking Services Mortlock House Histon Cambridge CB4 9DE
Investment Managers UBS AG 1 Curzon Street London W1J 5UB Partners Capital LLP 5th Floor 5 Young Street London W8 5EH
Property Agents Savills (L&P) Limited Unex House 132-134 Hills Road Cambridge CB2 2PA Savills (L&P ) Limited Wytham Court Oxford OX2 OQL
Cash Managers Royal London Cash Management 55 Gracechurch Street London EC3V OUF
George Webb Finn 43 Park Road Sittingbourne Kent ME10 1DX
Solicitors Mills & Reeve Francis House 112 Hills Road Cambridge CB2 1PH
Actuary Cartwright Group Ltd Suite 7 – 2nd Floor The Hub IQ Farnborough Farnborough Hants GU14 7JP
4
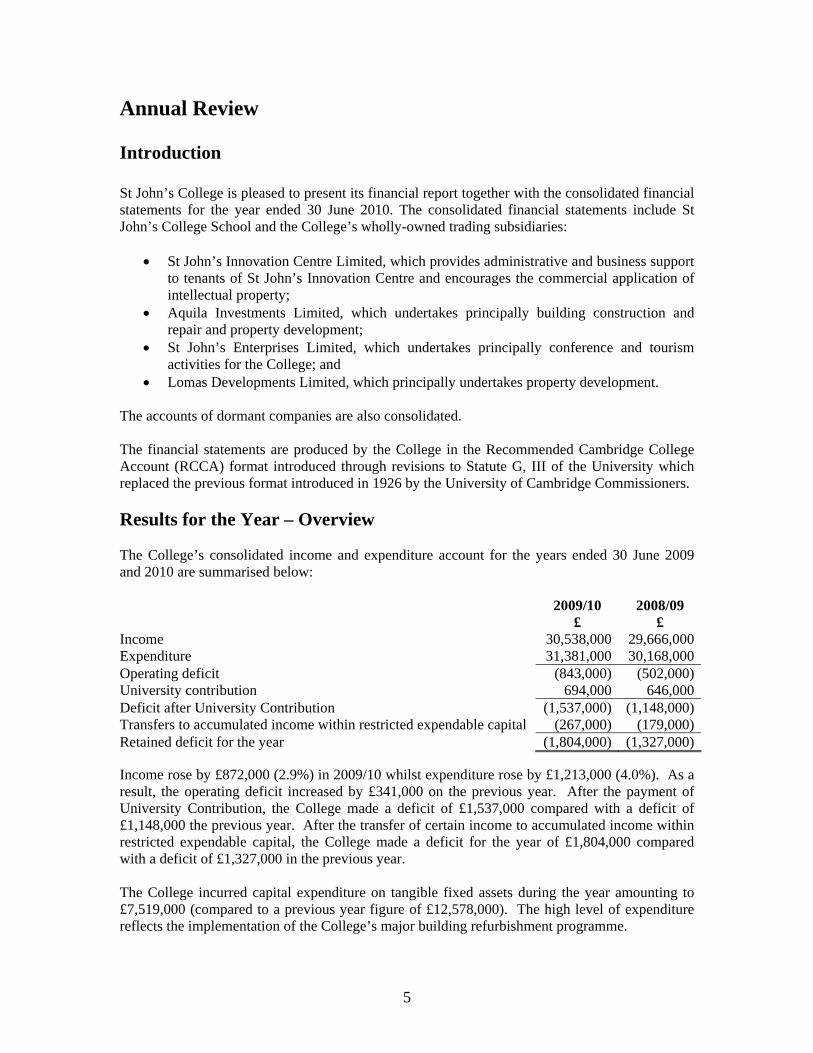
Annual Review Introduction St John’s College is pleased to present its financial report together with the consolidated financial statements for the year ended 30 June 2010. The consolidated financial statements include St John’s College School and the College’s wholly-owned trading subsidiaries:
• St John’s Innovation Centre Limited, which provides administrative and business support to tenants of St John’s Innovation Centre and encourages the commercial application of intellectual property;
• Aquila Investments Limited, which undertakes principally building construction and repair and property development;
• St John’s Enterprises Limited, which undertakes principally conference and tourism activities for the College; and
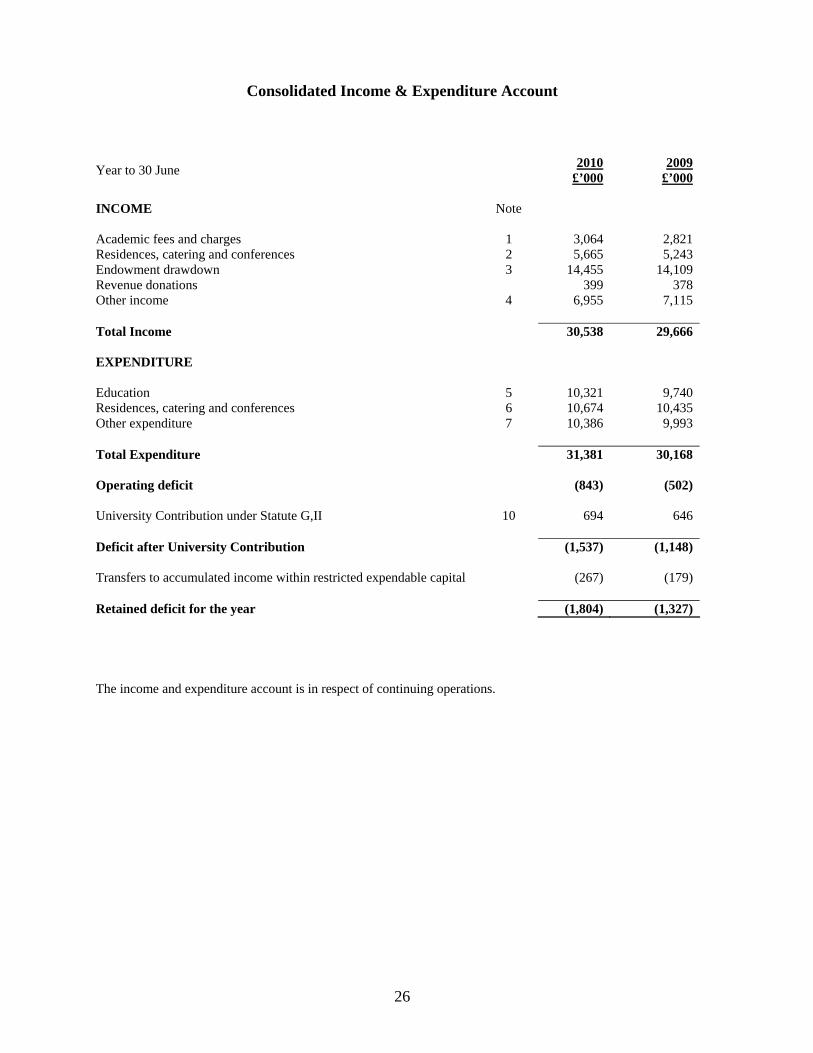
• Lomas Developments Limited, which principally undertakes property development. The accounts of dormant companies are also consolidated. The financial statements are produced by the College in the Recommended Cambridge College Account (RCCA) format introduced through revisions to Statute G, III of the University which replaced the previous format introduced in 1926 by the University of Cambridge Commissioners. Results for the Year – Overview The College’s consolidated income and expenditure account for the years ended 30 June 2009 and 2010 are summarised below: 2009/10
£ 2008/09
£ Income 30,538,000 29,666,000Expenditure 31,381,000 30,168,000Operating deficit (843,000) (502,000)University contribution 694,000 646,000Deficit after University Contribution (1,537,000) (1,148,000)Transfers to accumulated income within restricted expendable capital (267,000) (179,000)Retained deficit for the year (1,804,000) (1,327,000) Income rose by £872,000 (2.9%) in 2009/10 whilst expenditure rose by £1,213,000 (4.0%). As a result, the operating deficit increased by £341,000 on the previous year. After the payment of University Contribution, the College made a deficit of £1,537,000 compared with a deficit of £1,148,000 the previous year. After the transfer of certain income to accumulated income within restricted expendable capital, the College made a deficit for the year of £1,804,000 compared with a deficit of £1,327,000 in the previous year. The College incurred capital expenditure on tangible fixed assets during the year amounting to £7,519,000 (compared to a previous year figure of £12,578,000). The high level of expenditure reflects the implementation of the College’s major building refurbishment programme.
5
College Income The main sources of income for the College are:
• Academic fees and charges • Income from residences, catering and conferences • Endowment drawdown • Revenue donations • Other income
Overall, there was an increase in income in 2009/10, with total income being £30,538,000, up £872,000 (2.9%) from the previous year. Academic fees and charges Total academic fees and charges received in the year were £3,064,000, up £243,000 (8.6%) from £2,821,000 in the previous year. College fees for undergraduates The main component of the academic fees and charges is the college fee, which amounted to £2,005,000 in the year, paid to the College by the University (from the grant received from the Higher Education Funding Council for England (HEFCE)) in respect of undergraduates eligible for student support from UK public funds. The college fee is paid towards the cost of admitting and supervising such undergraduates and providing tutorial support and social and recreational activities, but does not cover the full cost of such provision. The per-capita undergraduate fee for publicly-funded undergraduates was £3,744, up 3.7% over the previous year. In addition to the college fee for publicly-funded undergraduates, the College receives fees from overseas and island students and those UK/EU students not eligible for tuition fee support. These fees were £4,462 per capita and totalled £275,000 in the year. College fees for graduates In addition to college fees for undergraduates, the College receives a college fee in respect of its graduate students which was £2,184 per capita and totalled £496,000 in the year. Reliance on fee income The College is vulnerable to swings in student numbers given that, in the short run at least, the College’s costs are largely fixed. Variability of student numbers arises principally from the quality of applications in any particular year, satisfaction of conditional offers, acceptance of places from students holding multiple offers and the availability of funding for students, particularly for graduates. The gap between the cost of providing education to the College’s students and the fees received by the College is very substantial and this deficit is funded from other resources.
6
Residences, catering and conferences Total income from residences, catering and conferences in the year totalled £5,665,000, up £422,000 (8.1%) from the previous year (£5,243,000). Accommodation The College is able to offer accommodation in the College or nearby hostels and furnished lets for all of its undergraduates and most of its graduates currently in residence. Student room rentals in the College reflect the size, facilities and standards of much of the room stock. The College also provides rooms (including a small number of residential rooms) in College for Fellows. Total accommodation income from College members was £3,131,000 in the year. College catering The College provides catering services to its students, Fellows and staff through a cafeteria, formal dinners in Hall and a Senior Combination Room. The total catering income from College members was £1,318,000 in the year. Conferences and functions The College continues to operate conference and private functions activities to take advantage of out-of-term capacity and to contribute to the overall running costs of the College, whilst ensuring that these activities do not conflict with the College’s prime academic activities. Revenue from the commercial conference and catering activities totalled £1,216,000 in the year, almost level with the previous year. Conference income is significantly influenced by external factors such as overall economic conditions, geopolitical events and competing facilities. Endowment drawdown The College applies a standard method of accounting for fund investment returns on permanent funds until they have a level of distributable reserves which are at least 20% of its original capital. The standard method applies the investment income in the year it arises. For the other funds, a Total Return method is applied. For these funds a proportion of the related earnings and capital appreciation is allocated to the income and expenditure account as a drawdown in accordance with the total return concept. Under this method the Endowment drawdown is determined by a spending rule which is designed to provide stable annual spending levels and to preserve the real value of the endowment portfolio over time. The surplus or deficiency of total return, after deducting the annual Endowment drawdown, is included in the Statement of Total Recognised Gains and Losses. The amount of the effective drawdown and applied income under the policies above was £14,455,000 in the year (see Note 3d). This compared with investment income actually received of £10,755,000. The endowment drawdown and applied income represented a rise of £374,000 (2.7%) on the previous year. Endowment drawdown and applied income represented 47.3% of total income. The College is highly dependent on the endowment income to meet its day-to-day operational expenses. The College’s endowment drawdown amount is reviewed by the College’s Investments Committee each year.
7
Revenue donations Donations and benefactions of £399,000, received during the year, were recognised as income in line with the College’s accounting policy on the treatment of gifts and benefactions. This is slightly higher than the 2008/09 figure of £378,000. This reflects the Telethon fundraising campaign together with increased funding of certain educational projects and awards. Other income School The income from St John’s College School (which though included within the College’s income in the Consolidated Income and Expenditure Statement, is treated as being for the benefit of the school only) was £5,204,000 in the school’s financial year ended 31 August 2010. St John’s College School is run as a separate activity within the College framework. Subsidiary activity Income from St John’s Innovation Centre and other additional subsidiary activity totalled £1,219,000 in the year. This is higher than the income of £1,119,000 in the previous year (8.9%). This is principally caused by higher consultancy revenues. Interest on operational cash balances Income on operational cash balances reduced significantly in the year due to the fall in deposit rates and decreased operational cash balances. Miscellaneous The College also received income from other sources including royalties, filming, tourist and merchandise receipts and income from third party contributions to the running costs of the College’s sports facilities and clubs, arising from shared use with other colleges. College Expenditure Total expenditure was £31,381,000 in 2009/10, up £1,213,000 (4.0%) from the previous year. The categories of expenditure for the College (as determined by the RCCA format) are:
• Educational expenditure • Expenditure on residences, catering and conferences • Other expenditure
Overall cost control remains a high priority for the College. Education Spending on education during the year totalled £10,321,000 which was up £581,000 (6.0%) on the previous year. This expenditure included expenditure on teaching (including through the small-group academic supervision system), tutorial, admissions, research, the cost of scholarships and awards for students, other educational facilities and other expenses.
8
The gap between the cost of providing education and the fees received by the College is very substantial. Teaching, Tutorial, Admissions and Research In common with other Cambridge Colleges, most of the teaching Fellows in the College are University Teaching Officers (UTOs) who are paid their principal stipends by the University, with the College paying for teaching and other duties carried out in the College. The College also employs a number of College Teaching Officers (CTOs) who do not hold any substantive University post and are paid their principal stipends by the College. The College also pays for teaching carried out for its students by non-Fellows (e.g. Fellows of other Colleges, graduate students and post-doctoral research workers in the University). The College also appoints certain Fellows to carry out duties directly related to the provision of education. These include the Senior Tutor, the Admissions Tutor, Tutors and Directors of Studies. These officers are paid stipends by the College. In addition to teaching, the College has a major focus on the promotion of research. The College has a Research Fellowship programme aimed at providing talented academics with an opportunity to focus on research at an early stage in their academic careers. In addition, the College provides support and infrastructure to enable the Fellowship more widely, to engage in research activities. As part of its support to the Fellowship to carry out the parallel tasks of teaching and research, the College provides rooms, grants and allowances, dining and other benefits to Fellows of the College. Scholarships and awards Both through funds donated to the College and from general resources, the College supports its students with a wide variety of scholarships, studentships, prizes, grants and other awards. The most significant items included within this figure were scholarships to support competitively selected graduate scholars and existing scholars of the College in taking post-graduate degrees and access bursaries for both undergraduate and graduate students. A Cambridge Bursary Scheme was introduced in 2006 which is funded by the University, the Cambridge Colleges (including St John’s), the Isaac Newton Trust (which also administers the scheme) and corporate sponsors. The scheme pays substantial bursaries in an effort to ensure that no UK student should be deterred from applying to the University of Cambridge because of financial considerations and that no student should have to leave because of financial difficulties. Expenditure on scholarships and awards totalled £1,712,000 in 2009/10, up £96,000 (5.9%) on the previous year. Other Other educational facilities and other expenses include certain facilities for students and general access and outreach projects.
9
Residences, catering and conferences Expenditure on residences, catering and conferences totalled £10,674,000 in the year, up £239,000 (2.3%) on the prior year. Of this expenditure, £7,296,000 was in respect of accommodation and £3,378,000 was in respect of catering. Expenditure on accommodation and catering for College members totalled £9,522,000, whilst expenditure attributed to the College’s conference and private catering activities totalled £1,152,000 in the year. A significant element of the expenditure on accommodation related to the upkeep of the College’s historic buildings. Other expenditure ‘Other expenditure’ includes expenditure on St John’s College School, the management and repair of properties in the property investment portfolio, fundraising & alumni-relations, charitable gifts, and the St John’s Innovation Centre and other subsidiaries. Expenditure by St John’s College School was £4,862,000, up £18,000 (0.4%) on the previous year. A separate bursar for St John’s College School has responsibility for the school’s finances. Agency and management fees principally relating to the College’s investment portfolio and estates repairs were together £2,949,000, up £249,000 (9.2%) on the previous year. Fundraising and alumni-relations costs were £821,000 in the year, down £4,000 (0.5%) on the previous year. These costs are shown in aggregate since both activities are carried out by the College’s Development Office. These costs reflect the College’s decision to invest further in its alumni relations and fundraising activities with the public launch of a major fundraising campaign in 2008. The College continues to drawdown on its loan facility of £20m to fund partially its building refurbishment programme and, therefore, Interest and Bank charges are expected to rise in the future as the building programme progresses. Expenditure on the St John’s Innovation Centre and other subsidiary activity was £1,248,000, up £55,000 (4.6%) on the previous year. University Contribution The College pays, through an intercollegiate taxation system, a contribution to the Colleges Fund which makes grants to colleges with inadequate endowments. The University Contribution of the College for the year 2009/10 amounted to £694,000. Expenditure by Activity The description of the expenditure of the College set out above is based on categorisations in the Income and Expenditure Account (as laid down in the RCCA format). The additional commentary below highlights the principal components of expenditure by activity.
10
Staff costs Emoluments and related national insurance and pensions costs of both academic and non- academic staff rose to £13,893,000, an increase of £216,000 (1.6%) on the previous year. This rise reflects cost of living awards, increased pension contributions, and certain staff changes. This represents some 44.3% of the total expenditure of the College. Other operating expenses Other operating expenses of the College were £13,168,000, up £575,000 (4.6%) on the previous year. This primarily reflects increased maintenance costs, scholarships and awards, and consultancy costs. Depreciation Included within educational expenditure, residences, catering and conferences expenditure and other expenditure is a total of £4,320,000 of depreciation of which £3,826,000 relates to the operational buildings of the College. This depreciation charge is an accounting measure of the amount of the economic benefit of the assets that has been consumed during the period and is apportioned across the activities of the College. The accounting policy adopted for depreciation (in combination with the policy for the valuation of buildings) has a significant effect on the operating surplus/deficit of the College. As indicated in the Statement of Principal Accounting Policies, the policy adopted for operational buildings is to depreciate them on a straight-line basis over 50 years. This is consistent with FRS 15 (Tangible Fixed Assets). The level of depreciation of operational buildings that arises from this policy is less than the actual capital expenditure that the College anticipates having to expend on its operational buildings on a per annum basis over the next 5 years. Capital and Reserves Capital and reserves stood at £557,097,000 at 30 June 2010, up £25,411,000 (4.8%) on the previous year. This was mainly a result of rises in the market value of investments and increases from benefactions and donations of a capital nature. The Capital and Reserves include deferred capital grants which currently stand at £5,465,000. At 30 June 2010, unrestricted, undesignated, expendable capital reserves stood at £11,692,000. Investments Investment policy The College’s investment objective is to manage its investment portfolio to produce the highest return consistent with the preservation of long-term capital value in real terms, such that it can fulfil its charitable objectives in perpetuity and that is consistent with an acceptable degree of risk. Through this objective, the College seeks to be even-handed between the interests of present and future beneficiaries. The asset allocation for the investment portfolio is set on the recommendation of the Investments Committee, which generally includes four external members with experience in the main asset
11
classes in which the College is invested or in which it intends to invest. The College Council is responsible for decisions such as the appointment of investment managers, authorising major changes in investment strategy and property transactions. UBS AG and Partners Capital LLP act as investment managers for the College’s securities portfolio and operates on a fully discretionary basis subject to the terms of the College’s investment policy. The appointment of investment managers is generally reviewed every three years, or more frequently in response to specific circumstances. The College has a Consolidated Trust Fund, established in 1956, in which permanent capital, expendable capital, restricted funds (including trusts) and unrestricted funds hold units. It has many similarities with a unit trust structure. Whilst the College has wide powers of investment, its ability to adopt the optimum asset allocation for its investment portfolio was historically limited by the fact that it could spend only accounting investment income. The College therefore took steps to amend the Scheme for its Consolidated Trust Fund to enable it to pursue a total-return policy for its investments. This will facilitate the adoption of the optimum asset allocation for the College’s investment portfolio. All of the College’s direct property investment portfolio is held outside the Consolidated Trust Fund. The College is highly dependent on returns from its investment portfolio to fund its charitable purposes and the College recognises the importance of optimising the returns from its investment portfolio. The College monitors its asset allocation with a view to optimising both the diversification of the portfolio and risk-adjusted returns. Investments The total value of the College’s investment portfolio at 30 June 2010 was £333,439,000, up £27,050,000 (8.8%) from its value at 30 June 2009. £181,929,000 (54.6%) of the investment portfolio is currently invested in direct property. The property portfolio is invested in a mix of agricultural, commercial (office, industrial and retail) and residential properties, the latter mostly in Cambridge. These property investments are managed by Savills (L&P) Limited and George Webb Finn. Those residential properties which are let or intended to be let to students, Fellows and staff are considered and valued as operational buildings (and appear as part of tangible fixed assets) rather than investments. The weighting to property is relatively large and it is intended that over time the proportion of the portfolio invested in property will reduce, both as a result of property sales and through new fundraising by the College being primarily invested in assets other than property. As at 30 June 2010, the equities and fixed-income portfolio had a value of £95,563,000, representing 28.7% of the overall portfolio. 22.4% of the whole portfolio was invested in equities and 6.3% in bonds. Other real assets had a value of £8,959,000, representing 2.7% of the overall portfolio. The College has increased its allocation to private equity through a commitment to Cambridge University Fund L.P., a pooled private equity vehicle set up by the University and a number of Cambridge Colleges. The College has also increased its allocation to hedge funds. As at 30 June
12
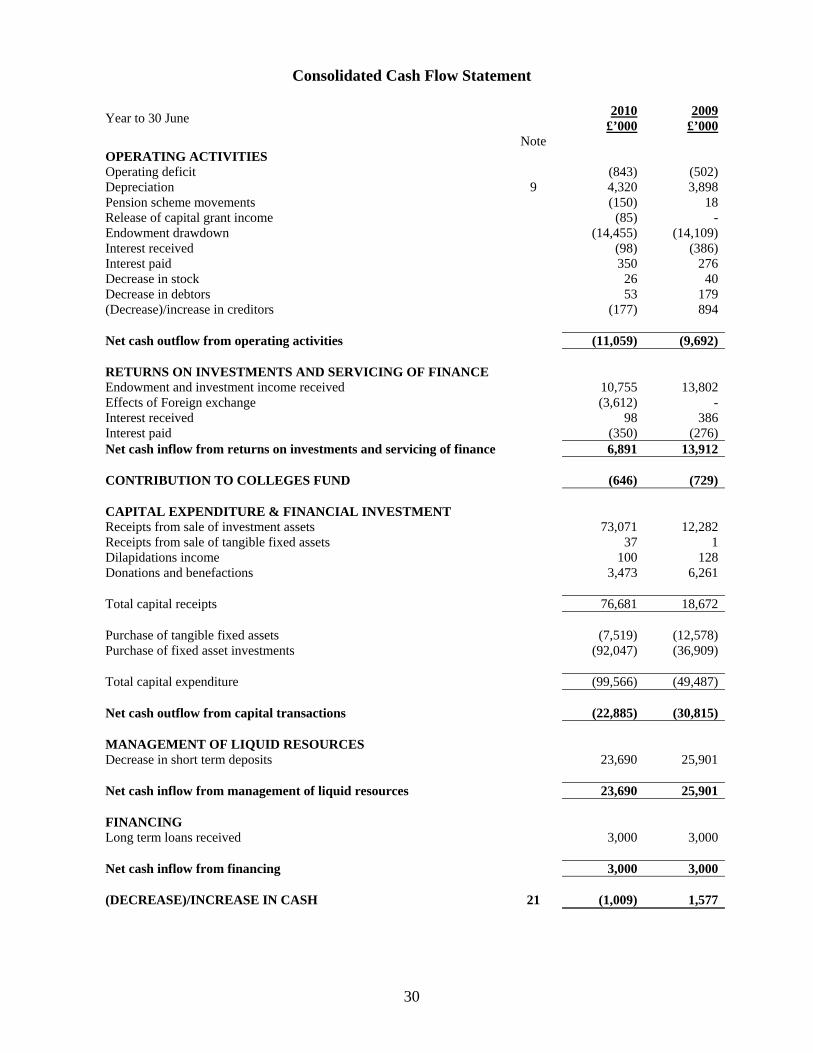
2010, the College held unquoted securities with a valuation of £38,997,000 (representing 11.7% of the overall portfolio). In addition, at 30 June 2010, the College held cash for reinvestment amounting to £7,991,000 (representing 2.4% of the portfolio). The College is exposed to foreign exchange risk on the investments it holds in foreign currency. The College seeks to mitigate these risks by entering into cashflow hedges, which are managed by its advisers. Ethical investment The College operates an ethical investments policy. Under the terms of that policy and having regard to the requirements of charity law to maximise returns, the College seeks to ensure that investments are not made in companies whose practices are in conflict with the charitable purposes of the College or are likely to alienate the members or benefactors of the College. Cash flows Cash outflow from operating activities (i.e. excluding endowment drawdown) was £11,059,000, £1,367,000 higher than the previous year’s cash outflow of £9,692,000. Working capital decreased by £98,000. Net cash inflow from endowment income was £10,755,000, down £3,047,000 (22.1%) on the previous year. This gave a cash outflow for 2009/10 before University Contribution and capital transactions of £4,168,000, down £8,388,000 from the previous year. However, this includes the effects of foreign exchange (£3,612,000) which relate to College’s Endowment and changes to investment allocation. Capital receipts totalled £76,681,000, including £73,071,000 from sales of securities and investment properties in the year and £3,473,000 from donations and benefactions of a capital nature. Total capital expenditure in the year amounted to £99,566,000, of which £92,047,000 was spent on fixed asset investments and £7,519,000 was purchase of tangible fixed assets reflecting capital expenditure on operational College buildings and other fixed assets. The total cash outflow from capital transactions was £22,885,000. The College also drew down £3,000,000 of its bank facility to fund its building refurbishment programme. Capital Expenditure Refurbishment programme The need to renovate and improve the College’s operational buildings (which are mostly Grade I or Grade II listed and of historic importance), in addition to normal maintenance, places an enormous burden on the College. In 2009/10 the College spent a total of £6,733,000 on
13
improvements to its operational buildings. This substantial level of expenditure reflects the implementation of the College’s significant building refurbishment programme. It is likely that expenditure in future years will continue at high levels with refurbishment projects such as Cripps and the former Divinity School now being implemented. Implementation of new regulations A significant portion of the capital expenditure that the College has been and will be carrying out on its buildings, relates to the implementation of new regulations, most notably recent disability legislation and the Houses in Multiple Occupation (HMO) legislation. The College has instigated a programme of work to provide disabled access and to convert a number of College rooms for disabled use. The HMO work requires a substantial programme of renovation of College accommodation, principally furnished lets and hostels. This work has been made both complex and costly by the historic nature of much of the College’s building stock. The expenditure that the new regulations necessitate is significant. Risk Management The College continues to develop a formal risk-management process involving the creation of a Risk Register. The relevant individuals in College will be charged with responsibility for evaluating the risks coming within their areas of responsibility and advising the Council on the nature of the risk, the probability of occurrence and severity of impact, as well as steps taken to mitigate the risk. Through the Risk Register, the College will seek to identify and manage risks. However, the nature of the College’s activities is such that the College is faced with a large number of risks, not all of which can be mitigated through insurance. Fundraising The existence and success of St John’s College in its current form is a reflection of the outstanding generosity of both historic and more recent benefactors, many but not all of whom have been members of the College. The College believes that its endowment will have to grow significantly if it is to sustain, and build on, its success to date and the College is increasingly active in fund-raising. It is closely involved with the University of Cambridge in the Cambridge 800th Anniversary Campaign, launched in September 2005, (the agreement with the University provides that a gift to the College for its purposes is also deemed to be a gift to the University campaign for Collegiate Cambridge) and in September 2008 the College publicly launched a campaign centred around the College’s 500th anniversary in 2011. In 2009/10, donations and benefactions received by the College totalled £3,894,000. Financial Outlook and Challenges Whilst St John’s College is one of the better-endowed Cambridge Colleges, its commitments and its role in the University are commensurately significant and the College has experienced, and will continue to face, significant financial challenges many of which are common to the University and other Cambridge Colleges.
14
The College seeks to respond to these challenges by focusing on efficient financial management and endeavouring to manage its existing resources to best effect. However, if it is to be able to sustain and develop the activities that are critical to its mission and achieve its full potential, it is clear that the College will need to build its endowment over the coming years. On behalf of the College Council Professor Christopher Dobson Master
Chris Ewbank Senior Bursar
18 November 2010
15
Statement of Responsibilities of the College Council
In accordance with the College’s Statutes, the Council is responsible for the administration of the Group’s and College’s affairs. The Council is responsible for preparing the Annual Report and financial statements in accordance with applicable law and United Kingdom Accounting Standards. The Council is responsible for preparing the financial statements for each financial year which give a true and fair view of the state of affairs of the Group and the College and of the surplus or deficit of the Group for that period. In preparing those financial statements the Council: • Selects suitable accounting policies and applies them consistently; • Makes judgements and estimates that are reasonable and prudent; • States whether applicable accounting standards have been followed, subject to any material
departures disclosed and explained in the financial statements; and • Prepares the financial statements on the going concern basis unless it is inappropriate to
presume that the Group and College will continue in operation. The Council is responsible for keeping proper accounting records which disclose with reasonable accuracy at any time the financial position of the Group and the College and enable them to ensure that the financial statements comply with the Statutes of the University of Cambridge. They are also responsible for safeguarding the assets of the Group and the College and hence for taking reasonable steps for the prevention and detection of fraud and other irregularities. The Council is responsible for sending the Annual Report and Accounts in the form prescribed by the University Statutes to the University by the prescribed deadline. The Council is responsible for the maintenance and integrity of the corporate and financial information included on the College’s website. Legislation in the United Kingdom governing the preparation and dissemination of financial statements may differ from legislation in other jurisdictions.
16
Independent Auditors’ Report to the Governing Body of St John’s College
We have audited the financial statements of St John’s College for the year ended 30 June 2010 which comprise the statement of principal accounting policies, the consolidated income and expenditure account, the consolidated statement of total recognised gains and losses, the balance sheets, the consolidated cash flow statement and the related notes 1 to 24. These financial statements have been prepared under the accounting policies set out therein. This report is made solely to the Governing Body, in accordance with our engagement letter dated 14 June 2010. Our audit work has been undertaken so that we might state to the Governing Body those matters we are required to state to them in an auditors’ report and for no other purpose. To the fullest extent permitted by law, we do not accept or assume responsibility to anyone other than the College and the Governing Body, for our audit work, for this report, or for the opinions we have formed. Respective responsibilities of the College’s Council and auditors As described in the statement of the responsibilities of the College Council, the College Council is responsible for the preparation of the financial statements in accordance with applicable United Kingdom Generally Accepted Accounting Practice and the provisions of the Statutes of the College and the University of Cambridge. The College Council is also responsible for sending the Annual Report and Accounts in the form prescribed by the University Statutes to the University as set out in the Responsibilities of the College Council on page 16. Our responsibility is to audit the financial statements in accordance with relevant United Kingdom legal and regulatory requirements and International Standards on Auditing (UK and Ireland). We report to you our opinion as to whether the financial statements give a true and fair view and are properly prepared in accordance with the accounting policies set out therein, with the Statutes of the University of Cambridge, and with the provisions of the Statutes of the College. In addition, we report whether the University Contribution has been correctly calculated in accordance with the provisions of University Statute G, II. We also report if, in our opinion, the Annual Review is not consistent with the financial statements, if the Group or College has not kept proper accounting records, or if we have not received all the information and explanations we require for our audit. We read the other information contained in the Annual Report and Accounts and consider the implications for our report if we become aware of any apparent misstatements or material inconsistencies with the financial statements. Basis of audit opinion We conducted our audit in accordance with International Standards on Auditing (UK and Ireland) issued by the Auditing Practices Board. An audit includes examination, on a test basis, of evidence relevant to the amounts and disclosures in the financial statements. It also includes an
17
assessment of the significant estimates and judgements made in the preparation of the financial statements and of whether the accounting policies are appropriate to the circumstances of the College and the Group, consistently applied and adequately disclosed. We planned and performed our audit so as to obtain all the information and explanations which we considered necessary in order to provide us with sufficient evidence to give reasonable assurance that the financial statements are free from material misstatement, whether caused by fraud or other irregularity or error. In forming our opinion, we also evaluated the overall adequacy of the presentation of information in the financial statements. Opinion In our opinion: (a) the financial statements give a true and fair view of the state of affairs of the College and
the Group as at 30 June 2010 and of the income and expenditure of the Group for the year then ended and have been properly prepared in accordance with the accounting policies set out therein and the Statutes of the College and the University of Cambridge; and
(b) in all material respects, the contribution return due from the College to the University has
been correctly completed in accordance with the provisions of Statute G,II of the University of Cambridge.
18
Statement of Principal Accounting Policies Basis of preparation The financial statements have been prepared in accordance with the provisions of the Statutes of the College and of the University of Cambridge and applicable United Kingdom Accounting Standards. Basis of Accounting The financial statements have been prepared under the historical-cost convention as modified by the revaluation of certain investments and on the basis of continuing to operate as a going concern. Basis of consolidation The consolidated financial statements consolidate the financial statements of the College and its subsidiary undertakings for the year ended 30 June 2010. The results of subsidiary undertakings acquired or disposed of during the period are included in the consolidated income and expenditure account from the date of acquisition or up to the date of disposal. The College Field and Boat Clubs have been consolidated. The activities of student societies have not been consolidated because these are viewed as autonomous activities. Endowment return and Recognition of income The College applies both a Total Return and standard method of accounting for fund investment returns. The standard method applies the investment income in the year it arises. The standard method is applied until a permanent fund has a level of distributable reserves which are at least 20% of its original capital. For the other funds, a Total Return policy is applied. For these funds a proportion of the related earnings and capital appreciation is allocated to the income and expenditure account as a drawdown in accordance with the total return concept. Under this method the Endowment drawdown is determined by a spending rule which is designed to provide stable annual spending levels and to preserve the real value of the endowment portfolio over time. The surplus or deficiency of total return, after deducting the annual Endowment drawdown, is included in the Statement of Total Recognised Gains and Losses and is carried forward as unapplied return. The spending rule adopted by the College is a ‘Constant Growth with Cap and Floor’ rule under which the drawdown from the Endowment for a particular year is the previous year’s drawdown increased by RPI+1%, subject to a minimum payout of 3% and a maximum payout of 4% of a trailing 3 year average Endowment value. The target spending rate is 3.5%, which reflects long-run expected real returns given the College’s asset allocation and long-run expected College inflation. However, the actual spending rate in any year will depend on the results of the spending rule and will therefore vary from the 3.5% target rate. The spending rule provides for the drawdown to be adjusted to reflect additions to the Endowment through donations.
19
The income from a restricted capital fund under the standard method is shown as income in the year that it is receivable. Income from a restricted capital fund that is not expended in the year in which it is receivable is, at the year-end, transferred from the Income and Expenditure Account to accumulated income within restricted expendable capital. When there is subsequent expenditure of accumulated income from a restricted capital fund, income is credited back to the Income and Expenditure Account from the restricted expendable capital fund to match the expenditure through transfers to accumulated income. Gifts, donations and benefactions of an income nature are shown as income in the year in which they are received, provided that this can be fully expended on that purpose within two years of receipt. Otherwise the gift may be deferred in full or in part and held within liabilities pending release. Restricted benefactions and donations that are used to fund capital projects are initially treated as deferred capital grants, and then released over the expected useful life of the related asset on a basis consistent with the depreciation policy. Rental income is recognised on an accruals basis according to the terms of the lease. College fee income is recognised in the period for which it is received and includes all fees chargeable to students or their sponsors. The costs of any fees waived or written off by the College are included as expenditure. Donations and benefactions Gifts, benefactions and legacies will be treated as capital if there is a legally binding restriction or it can be inferred that the sum is intended to be retained. In the latter case, the Council will consider the donor's correspondence and association with the College together with the size of the sum involved. Gifts, benefactions, and legacies treated in this way are shown in the Consolidated Statement of Total Recognised Gains and Losses. Other gifts, donations and benefactions of an income nature are, as indicated in “Recognition of income” above, shown as income in the year in which they become receivable. Pension schemes The College and its subsidiary undertakings participate in a number of pension schemes of both defined-benefit and defined-contribution types. Cambridge Colleges Federated Pension Scheme The College contributes to the Cambridge Colleges Federated Pension Scheme (“CCFPS”), which is a defined-benefit pension scheme. Unlike the other defined-benefit schemes (as noted below), this scheme has assets and liabilities directly attributable to the College. Amounts charged to operating expenditure are the current service costs and gains and losses on settlements and curtailments. They are included as part of staff costs. Past-service costs are recognised immediately in the income and expenditure account if the benefits have vested. If the benefits have not vested immediately, the costs are recognised over the period until vesting occurs. The interest cost and the expected return on assets are shown as a net amount of other
20
finance costs or credits to interest. Actuarial gains and losses are recognised immediately in the Statement of Total Recognised Gains and Losses. The scheme is funded, with the assets of the scheme held separately from those of the group, in separate trustee administered funds. The scheme assets are measured at fair value and liabilities are measured on an actuarial basis using the projected unit method and discounted at a rate equivalent to the current rate of return on a high quality corporate bond of equivalent currency and term to the scheme liabilities. The actuarial valuations are obtained at least triennially and are updated at each balance sheet date. The resulting defined-benefit asset or liability, net of related deferred tax, is presented separately after other net assets on the face of the balance sheet. Other defined-benefit pension schemes The College also makes contributions to the defined-benefit schemes set out below. The College is unable to identify its share of the assets and liabilities of these schemes on a consistent and reasonable basis. Therefore, these schemes are accounted for as if they were defined-contribution pension schemes. Contributions are charged to the income and expenditure account as they are incurred. Differences between contributions payable in the year and contributions actually paid are shown as either accruals or prepayments in the balance sheet. (i) The College participates in the Universities Superannuation Scheme (USS), a defined benefit scheme which is contracted out of the State Second Pension (S2P). The assets of the scheme are held in a separate trustee-administered fund. The institution is unable to identify its share of the underlying assets and liabilities of the scheme on a consistent and reasonable basis and therefore, as required by FRS 17 “Retirement benefits”, accounts for the scheme as if it were a defined contribution scheme. As a result, the amount charged to the income and expenditure account represents the contributions payable to the scheme in respect of the accounting period. (ii) Church of England Funded Pensions Scheme: The College participates in the Church of England Funded Pensions Scheme. This is a defined-benefit scheme but the College is unable to identify its share of the underlying assets and liabilities. (iii) Teachers’ Pension Scheme: The College participates in the Teachers’ Pension Scheme which is a statutory, contributory, final-salary scheme. The College is unable to identify its share of the underlying assets and liabilities. Defined-Contribution Pension Schemes The College and its subsidiaries also contribute to a number of defined-contribution pension schemes. For defined-contribution schemes the amount charged to the income and expenditure account in respect of pension costs and other post-retirement benefits is the contributions payable in the year. Differences between contributions payable in the year and contributions actually paid are shown as either accruals or prepayments in the balance sheet.
21
Tangible Fixed Assets Land and Buildings In accordance with the transitional provisions of Financial Reporting Standard 15 as applied to the College Accounts, land and buildings are stated at valuation on the basis of depreciated replacement cost. The valuation was carried out as at 30 June 2004 by Carter Jonas LLP, property consultants. This valuation will not be updated and will be carried forward as the gross value to be depreciated over its expected useful economic life. Freehold land is not shown separately. Freehold buildings are depreciated on a straight-line basis over their expected useful economic lives of 50 years. A review for impairment of a fixed asset is carried out if events or changes in circumstances indicate that the carrying amount of the fixed asset may not be recoverable. Freehold land is not depreciated. Where land and buildings are acquired they are capitalised at cost. Buildings under construction are valued at cost, based on the value of architects’ certificates and other direct costs incurred, and are depreciated when brought into use. Finance costs which are directly attributable to the construction of buildings are not capitalised as part of the cost of those assets. Land held specifically for development, investment and subsequent sale is included at market value. The cost of additions to operational property shown in the balance sheet includes the cost of land. Heritage Assets Works of art, books and other valuable artefacts (heritage assets) acquired since 1 July 2007 and valued at over £20k are capitalised and recognised in the balance sheet at the cost or value of the acquisition, where such a cost or valuation is reasonably obtainable. Heritage assets are not depreciated since their long economic life and high residual value mean that any depreciation would not be material. Operational assets are those that the College uses in the course of meeting its charitable purposes of education, learning, research and religion. Once an asset has been classified as an operational asset it is not reclassified as a heritage asset. Owing to the volume of items and valuation issues (e.g. age, origin, veracity) it has been decided that it is neither practical nor beneficial to identify and value Heritage Assets acquired before 1 July 2007. Maintenance of Premises The cost of major refurbishment and maintenance which restores value is capitalised when the project valuation is above the capitalisation threshold of £20,000. Expenditure capitalised will be depreciated on a straight-line basis over the expected useful economic life. The cost of other maintenance is charged to the Income and Expenditure Account as it is incurred.
22
Furniture, Fittings and Equipment Furniture, fittings and equipment costing less than £20,000 per individual item or group of related items are written off in the year of acquisition. All other assets are capitalised at cost and depreciated on a straight-line basis over their expected useful life as follows:
Plant and machinery (long life) 10 years Plant and machinery (short life) 5 years Vehicles 5 years Furniture and soft furnishings 5 years Computer network and equipment 5 years
Deferred capital grants Where a fixed asset is acquired with the aid of a specific bequest or donation it is capitalised and depreciated in accordance with the depreciation policy for that asset class. The related benefaction is credited to a deferred capital fund and is released to the Income and Expenditure Account over the expected useful economic life of the related asset on a basis consistent with the depreciation policy. Investments Securities Securities are shown at their market value. Realised and unrealised capital gains and losses will be recognised as increases/(decreases) of market value of investment assets within the Statement of Total Recognised Gains and Losses. This treatment recognises the fact that the investments are held for the long-term benefit of the College and that there is no intention of realising the asset without reinvestment of the sale proceeds. Investments that are not listed on a recognised stock exchange are carried at historical cost less any provision for impairment in their value. In note 3 investment income is included as and when dividends and interest become payable and interest on bank deposits is included as earned. Investment Properties Investment properties are included at their market value as at 30 June 2010. Realised and unrealised capital gains and losses are recognised in the same way as for securities as part of increases/(decreases) of market value of investment assets. Due to the length of ownership of many of the investment properties, realised capital gains cannot be recognised with reference to historic cost. Investments solely for resale are treated as current assets.
23
Stocks Stocks are stated at the lower of cost and net realisable value. Provisions Provisions are recognised if, when the College has a present legal or constructive obligation as a result of a past event, it is probable that a transfer of economic benefit will be required to settle the obligation and a reliable estimate can be made of the amount of the obligation. Foreign currencies Transactions denominated in foreign currencies are recorded at the rate of exchange ruling at the dates of the transactions. Monetary assets and liabilities denominated in foreign currencies are translated into sterling at year-end rates or, where there are related forward foreign-exchange contracts, at contract rates. The resulting exchange differences are dealt with in the determination of income and expenditure for the financial year. Reserves Permanent Capital The RCCA format requires the College to distinguish between “permanent capital” (amounts which the Governing Body has no power to convert to income and apply as such) and other funds and reserves. In these accounts the College has also disclosed amounts which it is not its policy to spend, under the “permanent” heading. This includes capital amounts previously taken to the Corporate Capital account and that part of the tangible fixed asset reserve representing the land of the College site. Restricted funds The College has received donations which may only be used for a particular purpose and these are classified as restricted funds on the College balance sheet. Designated funds Designated funds are unrestricted funds which have been designated for a particular purpose. These have been classified by their primary purpose (although they may have alternative charitable uses). St John’s College School The School is viewed as a separate activity of the College. Control of its reserves has been delegated to its Board of Governors. Its reserves, including those representing its tangible fixed
24
assets, are represented by a designated reserve within the College accounts (except for its prize and trust funds which are treated on an individual basis).
Taxation The College is a registered charity. Accordingly, the College is exempt from taxation in respect of income or capital gains received within categories covered by Section 505 of the Income and Corporation Taxes Act 1988 or Section 256 of the Taxation of Chargeable Gains Act 1992, to the extent that such income or gains are applied to exclusively charitable purposes. The College receives no similar exemption in respect of Value Added Tax. Contribution Under Statute G,II The College is liable to be assessed for contribution under the provisions of Statute G,II of the University of Cambridge. The contribution is currently used to fund grants to certain Colleges from the Colleges Fund.
25
26
Consolidated Income & Expenditure Account Year to 30 June 2010
£’000
2009 £’000
INCOME Note Academic fees and charges 1 3,064 2,821 Residences, catering and conferences 2 5,665 5,243 Endowment drawdown 3 14,455 14,109 Revenue donations 399 378 Other income 4 6,955 7,115 Total Income 30,538 29,666 EXPENDITURE Education 5 10,321 9,740 Residences, catering and conferences 6 10,674 10,435 Other expenditure 7 10,386 9,993 Total Expenditure 31,381 30,168 Operating deficit (843) (502) University Contribution under Statute G,II 10 694 646 Deficit after University Contribution (1,537) (1,148) Transfers to accumulated income within restricted expendable capital (267) (179) Retained deficit for the year (1,804) (1,327) The income and expenditure account is in respect of continuing operations.
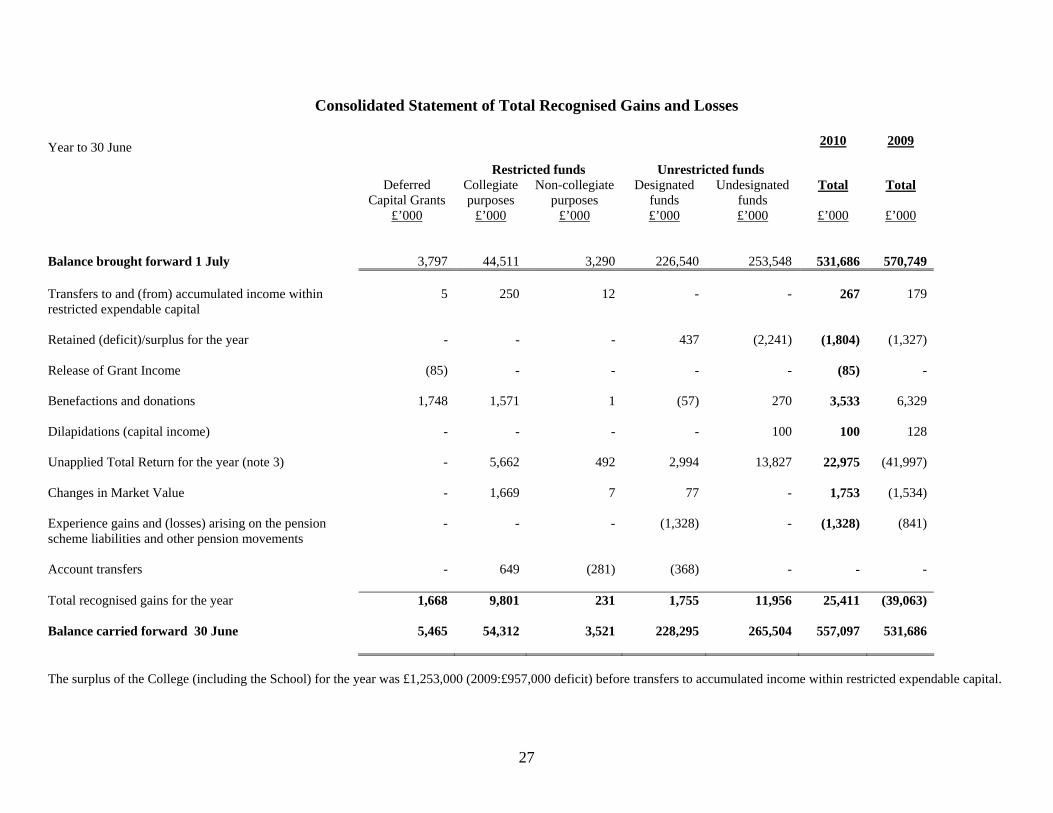
Consolidated Statement of Total Recognised Gains and Losses Year to 30 June 2010 2009
Restricted funds Unrestricted funds Deferred
Capital Grants £’000
Total
£’000
Total
£’000
Collegiate purposes
£’000
Non-collegiate purposes
£’000
Designated funds £’000
Undesignated funds £’000
Balance brought forward 1 July 3,797 44,511 3,290 226,540 253,548 531,686 570,749 Transfers to and (from) accumulated income within restricted expendable capital
5 250 12 - - 267 179
Retained (deficit)/surplus for the year - - - 437 (2,241) (1,804) (1,327) Release of Grant Income (85) - - - - (85) - Benefactions and donations 1,748 1,571 1 (57) 270 3,533 6,329 Dilapidations (capital income) - - - - 100 100 128 Unapplied Total Return for the year (note 3) - 5,662 492 2,994 13,827 22,975 (41,997) Changes in Market Value - 1,669 7 77 - 1,753 (1,534) Experience gains and (losses) arising on the pension scheme liabilities and other pension movements
- - - (1,328) - (1,328) (841)
Account transfers - 649 (281) (368) - - - Total recognised gains for the year 1,668 9,801 231 1,755 11,956 25,411 (39,063) Balance carried forward 30 June 5,465 54,312 3,521 228,295 265,504 557,097 531,686 The surplus of the College (including the School) for the year was £1,253,000 (2009:£957,000 deficit) before transfers to accumulated income within restricted expendable capital.
27
28
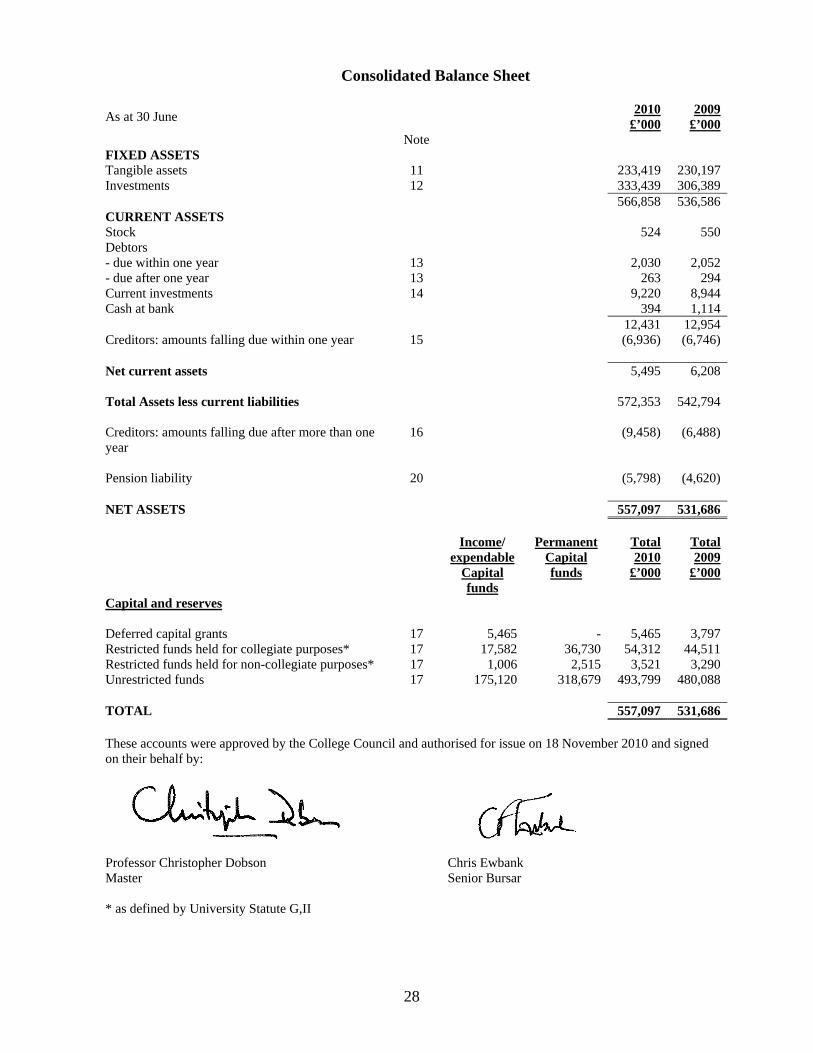
Consolidated Balance Sheet As at 30 June 2010
£’0002009
£’000
Note FIXED ASSETS Tangible assets 11 233,419 230,197 Investments 12 333,439 306,389 566,858 536,586 CURRENT ASSETS Stock 524 550 Debtors - due within one year 13 2,030 2,052 - due after one year 13 263 294 Current investments 14 9,220 8,944 Cash at bank 394 1,114 12,431 12,954 Creditors: amounts falling due within one year 15 (6,936) (6,746) Net current assets 5,495 6,208 Total Assets less current liabilities 572,353 542,794 Creditors: amounts falling due after more than one year
16 (9,458) (6,488)
Pension liability 20 (5,798) (4,620) NET ASSETS 557,097 531,686 Income/
expendable Capital funds
Permanent Capital funds
Total 2010
£’000
Total 2009
£’000
Capital and reserves Deferred capital grants 17 5,465 - 5,465 3,797 Restricted funds held for collegiate purposes* 17 17,582 36,730 54,312 44,511 Restricted funds held for non-collegiate purposes* 17 1,006 2,515 3,521 3,290 Unrestricted funds 17 175,120 318,679 493,799 480,088 TOTAL 557,097 531,686 These accounts were approved by the College Council and authorised for issue on 18 November 2010 and signed on their behalf by:
Professor Christopher Dobson Master
Chris Ewbank Senior Bursar
* as defined by University Statute G,II
29
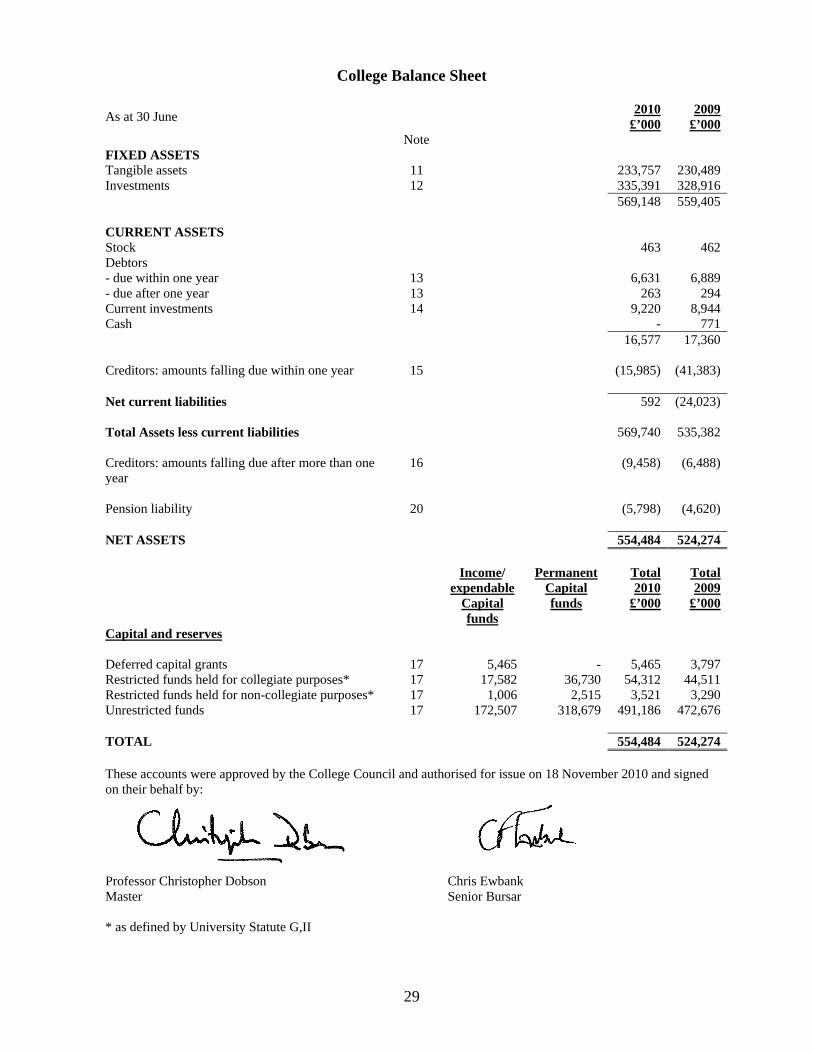
College Balance Sheet
As at 30 June 2010 £’000
2009 £’000
Note FIXED ASSETS Tangible assets 11 233,757 230,489 Investments 12 335,391 328,916 569,148 559,405 CURRENT ASSETS Stock 463 462 Debtors - due within one year 13 6,631 6,889 - due after one year 13 263 294 Current investments 14 9,220 8,944 Cash - 771 16,577 17,360 Creditors: amounts falling due within one year 15 (15,985) (41,383) Net current liabilities 592 (24,023) Total Assets less current liabilities 569,740 535,382 Creditors: amounts falling due after more than one year
16 (9,458) (6,488)
Pension liability 20 (5,798) (4,620) NET ASSETS 554,484 524,274 Income/
expendable Capital funds
Permanent Capital funds
Total 2010
£’000
Total 2009
£’000
Capital and reserves Deferred capital grants 17 5,465 - 5,465 3,797 Restricted funds held for collegiate purposes* 17 17,582 36,730 54,312 44,511 Restricted funds held for non-collegiate purposes* 17 1,006 2,515 3,521 3,290 Unrestricted funds 17 172,507 318,679 491,186 472,676 TOTAL 554,484 524,274 These accounts were approved by the College Council and authorised for issue on 18 November 2010 and signed on their behalf by:
Professor Christopher Dobson Master
Chris Ewbank Senior Bursar
* as defined by University Statute G,II
30
Consolidated Cash Flow Statement Year to 30 June 2010
£’000
2009 £’000
Note OPERATING ACTIVITIES Operating deficit (843) (502) Depreciation 9 4,320 3,898 Pension scheme movements (150) 18 Release of capital grant income (85) - Endowment drawdown (14,455) (14,109) Interest received (98) (386) Interest paid 350 276 Decrease in stock 26 40 Decrease in debtors 53 179 (Decrease)/increase in creditors (177) 894 Net cash outflow from operating activities (11,059) (9,692) RETURNS ON INVESTMENTS AND SERVICING OF FINANCE Endowment and investment income received 10,755 13,802 Effects of Foreign exchange (3,612) - Interest received 98 386 Interest paid (350) (276) Net cash inflow from returns on investments and servicing of finance 6,891 13,912 CONTRIBUTION TO COLLEGES FUND (646) (729) CAPITAL EXPENDITURE & FINANCIAL INVESTMENT Receipts from sale of investment assets 73,071 12,282 Receipts from sale of tangible fixed assets 37 1 Dilapidations income 100 128 Donations and benefactions 3,473 6,261 Total capital receipts 76,681 18,672 Purchase of tangible fixed assets (7,519) (12,578) Purchase of fixed asset investments (92,047) (36,909) Total capital expenditure (99,566) (49,487) Net cash outflow from capital transactions (22,885) (30,815) MANAGEMENT OF LIQUID RESOURCES Decrease in short term deposits 23,690 25,901 Net cash inflow from management of liquid resources 23,690 25,901 FINANCING Long term loans received 3,000 3,000 Net cash inflow from financing 3,000 3,000 (DECREASE)/INCREASE IN CASH 21 (1,009) 1,577
31
Notes to the Accounts
1. ACADEMIC FEES AND CHARGES COLLEGE FEES 2010
£’000
2009 £’000
Fee income paid on behalf of undergraduates at the Publicly-funded undergraduate rate (per capita fee £3,744)
2,005 1,906
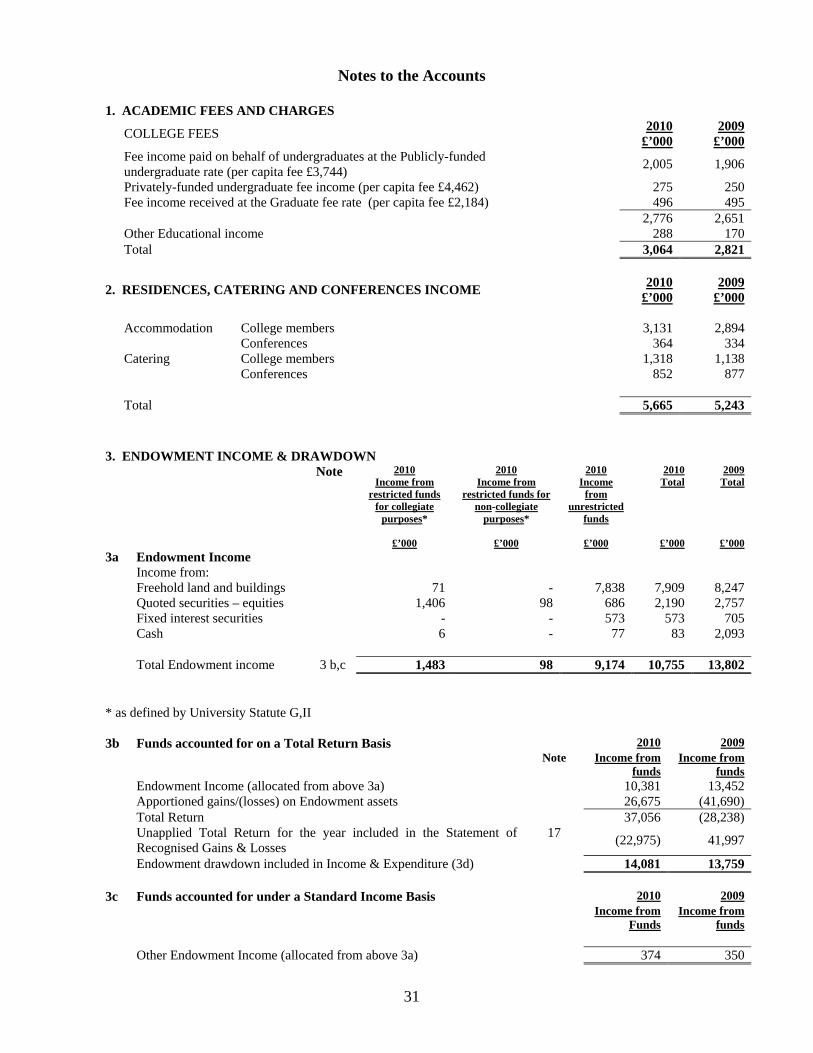
Privately-funded undergraduate fee income (per capita fee £4,462) 275 250 Fee income received at the Graduate fee rate (per capita fee £2,184) 496 495 2,776 2,651 Other Educational income 288 170 Total 3,064 2,821
2. RESIDENCES, CATERING AND CONFERENCES INCOME 2010 £’000
2009 £’000
Accommodation College members 3,131 2,894 Conferences 364 334 Catering College members 1,318 1,138 Conferences 852 877 Total 5,665 5,243 3. ENDOWMENT INCOME & DRAWDOWN Note 2010
Income from restricted funds
for collegiate purposes*
£’000
2010 Income from
restricted funds for non-collegiate
purposes*
£’000
2010 Income
from unrestricted
funds
£’000
2010 Total
£’000
2009 Total
£’000
3a Endowment Income Income from: Freehold land and buildings 71 - 7,838 7,909 8,247 Quoted securities – equities 1,406 98 686 2,190 2,757 Fixed interest securities - - 573 573 705 Cash 6 - 77 83 2,093 Total Endowment income 3 b,c 1,483 98 9,174 10,755 13,802
* as defined by University Statute G,II 3b Funds accounted for on a Total Return Basis 2010 2009
Note Income from funds
Income from funds
Endowment Income (allocated from above 3a) 10,381 13,452 Apportioned gains/(losses) on Endowment assets 26,675 (41,690) Total Return 37,056 (28,238) Unapplied Total Return for the year included in the Statement of
Recognised Gains & Losses 17 (22,975) 41,997
Endowment drawdown included in Income & Expenditure (3d) 14,081 13,759 3c Funds accounted for under a Standard Income Basis 2010 2009
Income from Funds
Income from funds
Other Endowment Income (allocated from above 3a) 374 350
32
3. ENDOWMENT INCOME & DRAWDOWN (continued) 3d Endowment income & drawdown included in the Income and Expenditure
Account
2010 Total £’000
2009
Total £’000
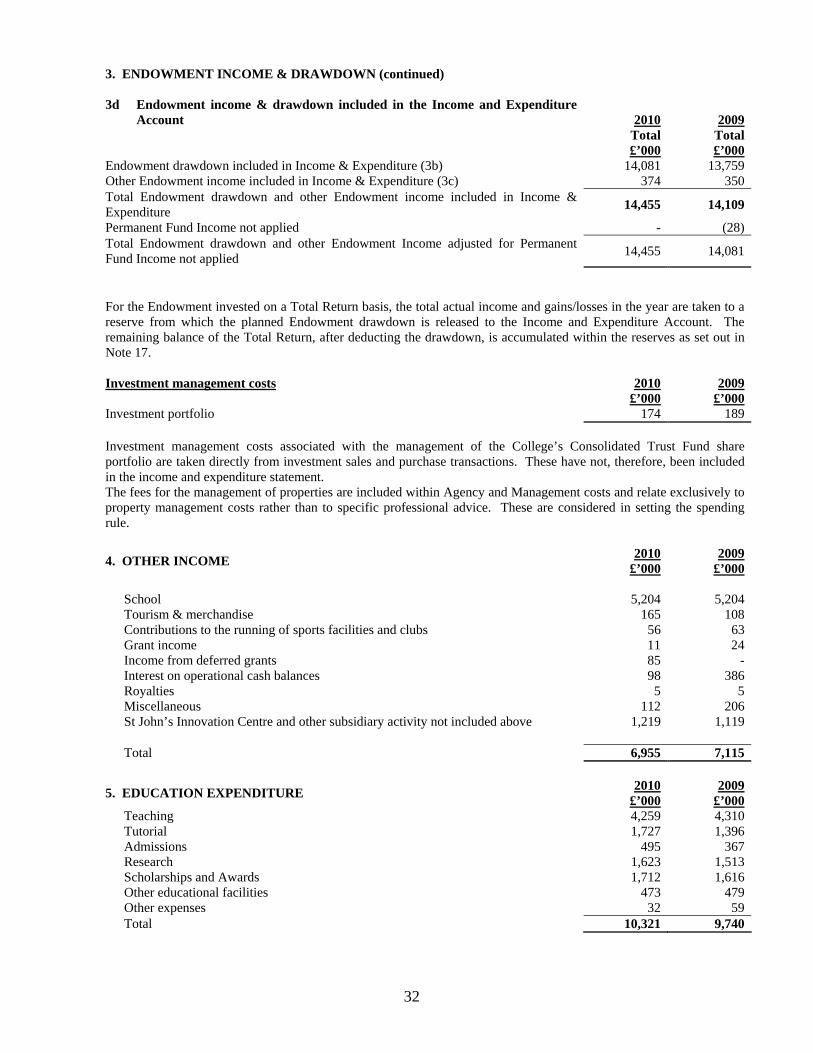
Endowment drawdown included in Income & Expenditure (3b) 14,081 13,759 Other Endowment income included in Income & Expenditure (3c) 374 350 Total Endowment drawdown and other Endowment income included in Income & Expenditure 14,455 14,109
Permanent Fund Income not applied - (28) Total Endowment drawdown and other Endowment Income adjusted for Permanent Fund Income not applied 14,455 14,081
For the Endowment invested on a Total Return basis, the total actual income and gains/losses in the year are taken to a reserve from which the planned Endowment drawdown is released to the Income and Expenditure Account. The remaining balance of the Total Return, after deducting the drawdown, is accumulated within the reserves as set out in Note 17. Investment management costs 2010
£’000
2009 £’000
Investment portfolio 174 189 Investment management costs associated with the management of the College’s Consolidated Trust Fund share portfolio are taken directly from investment sales and purchase transactions. These have not, therefore, been included in the income and expenditure statement. The fees for the management of properties are included within Agency and Management costs and relate exclusively to property management costs rather than to specific professional advice. These are considered in setting the spending rule.
4. OTHER INCOME 2010 £’000
2009 £’000
School 5,204 5,204 Tourism & merchandise 165 108 Contributions to the running of sports facilities and clubs 56 63 Grant income 11 24 Income from deferred grants 85 - Interest on operational cash balances 98 386 Royalties 5 5 Miscellaneous 112 206 St John’s Innovation Centre and other subsidiary activity not included above 1,219 1,119 Total 6,955 7,115
5. EDUCATION EXPENDITURE 2010 £’000
2009 £’000
Teaching 4,259 4,310 Tutorial 1,727 1,396 Admissions 495 367 Research 1,623 1,513 Scholarships and Awards 1,712 1,616 Other educational facilities 473 479 Other expenses 32 59 Total 10,321 9,740
33
6. RESIDENCES, CATERING AND CONFERENCES EXPENDITURE 2010 £’000
2009 £’000
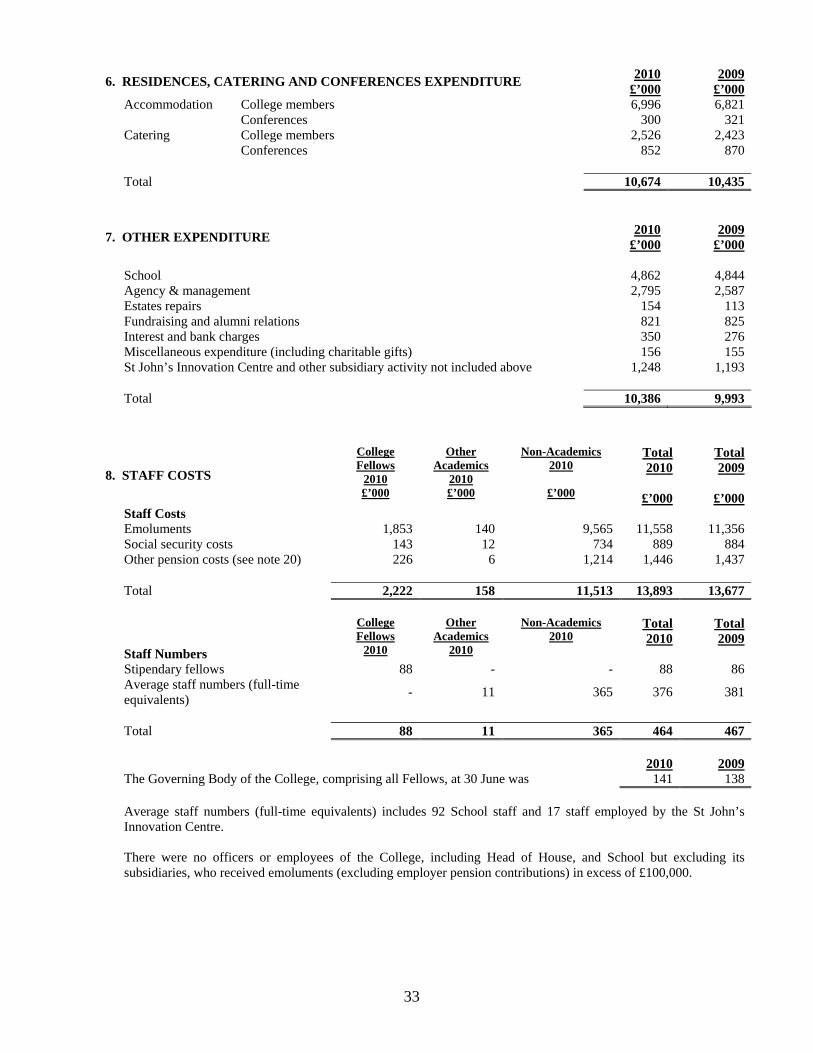
Accommodation College members 6,996 6,821 Conferences 300 321 Catering College members 2,526 2,423 Conferences 852 870 Total 10,674 10,435
7. OTHER EXPENDITURE 2010 £’000
2009 £’000
School 4,862 4,844 Agency & management 2,795 2,587 Estates repairs 154 113 Fundraising and alumni relations 821 825 Interest and bank charges 350 276 Miscellaneous expenditure (including charitable gifts) 156 155 St John’s Innovation Centre and other subsidiary activity not included above 1,248 1,193 Total 10,386 9,993
8. STAFF COSTS
College Fellows
2010 £’000
Other Academics
2010 £’000
Non-Academics 2010
£’000
Total 2010
£’000
Total 2009
£’000
Staff Costs Emoluments 1,853 140 9,565 11,558 11,356 Social security costs 143 12 734 889 884 Other pension costs (see note 20) 226 6 1,214 1,446 1,437 Total 2,222 158 11,513 13,893 13,677
Staff Numbers
College Fellows
2010
Other Academics
2010
Non-Academics 2010
Total 2010
Total 2009
Stipendary fellows 88 - - 88 86 Average staff numbers (full-time
equivalents) - 11 365 376 381
Total 88 11 365 464 467 2010 2009
The Governing Body of the College, comprising all Fellows, at 30 June was 141 138 Average staff numbers (full-time equivalents) includes 92 School staff and 17 staff employed by the St John’s
Innovation Centre. There were no officers or employees of the College, including Head of House, and School but excluding its
subsidiaries, who received emoluments (excluding employer pension contributions) in excess of £100,000.
34
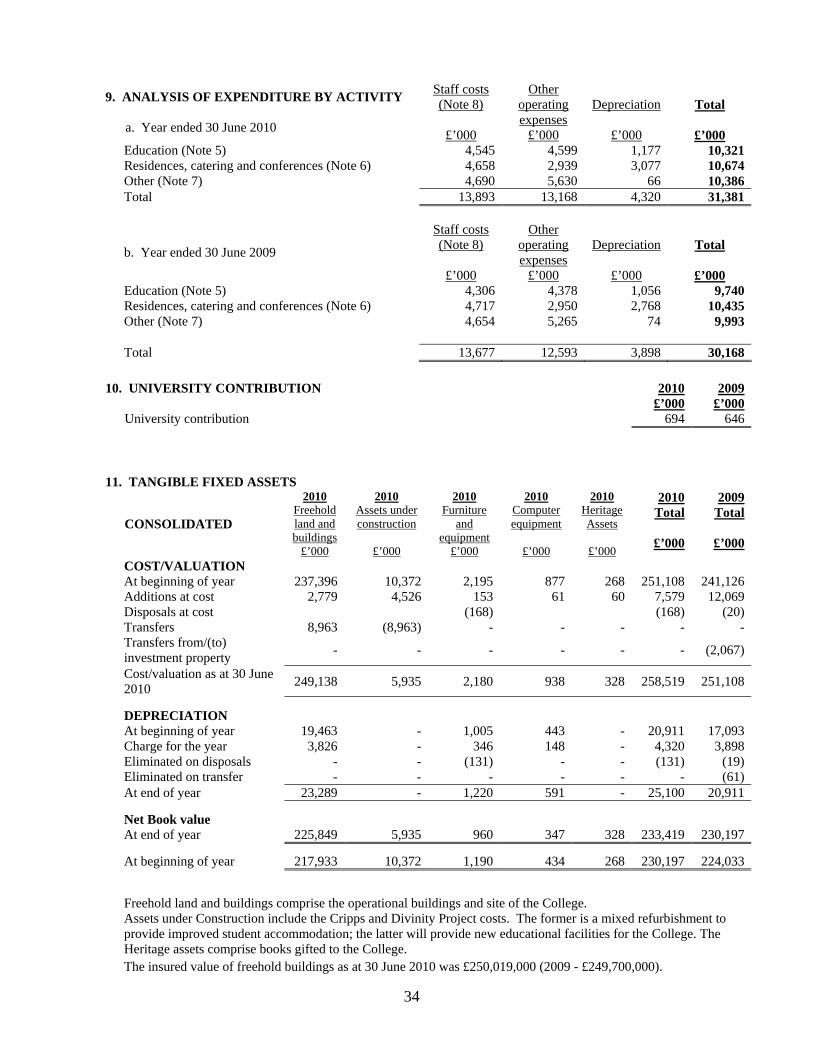
9. ANALYSIS OF EXPENDITURE BY ACTIVITY a. Year ended 30 June 2010
Staff costs (Note 8)
£’000
Other operating expenses
£’000
Depreciation
£’000
Total
£’000
Education (Note 5) 4,545 4,599 1,177 10,321 Residences, catering and conferences (Note 6) 4,658 2,939 3,077 10,674 Other (Note 7) 4,690 5,630 66 10,386 Total 13,893 13,168 4,320 31,381
b. Year ended 30 June 2009
Staff costs (Note 8)
£’000
Other operating expenses
£’000
Depreciation
£’000
Total
£’000
Education (Note 5) 4,306 4,378 1,056 9,740 Residences, catering and conferences (Note 6) 4,717 2,950 2,768 10,435 Other (Note 7) 4,654 5,265 74 9,993 Total 13,677 12,593 3,898 30,168 10. UNIVERSITY CONTRIBUTION
2010
£’000
2009 £’000
University contribution 694 646 11. TANGIBLE FIXED ASSETS
CONSOLIDATED
2010 Freehold land and buildings
£’000
2010 Assets under construction
£’000
2010 Furniture
and equipment
£’000
2010 Computer equipment
£’000
2010 Heritage Assets
£’000
2010 Total
£’000
2009 Total
£’000
COST/VALUATION At beginning of year 237,396 10,372 2,195 877 268 251,108 241,126 Additions at cost 2,779 4,526 153 61 60 7,579 12,069 Disposals at cost (168) (168) (20) Transfers 8,963 (8,963) - - - - - Transfers from/(to)
investment property - - - - - - (2,067)
Cost/valuation as at 30 June 2010 249,138 5,935 2,180 938 328 258,519 251,108
DEPRECIATION At beginning of year 19,463 - 1,005 443 - 20,911 17,093 Charge for the year 3,826 - 346 148 - 4,320 3,898 Eliminated on disposals - - (131) - - (131) (19) Eliminated on transfer - - - - - - (61) At end of year 23,289 - 1,220 591 - 25,100 20,911
Net Book value At end of year 225,849 5,935 960 347 328 233,419 230,197
At beginning of year 217,933 10,372 1,190 434 268 230,197 224,033
Freehold land and buildings comprise the operational buildings and site of the College. Assets under Construction include the Cripps and Divinity Project costs. The former is a mixed refurbishment to
provide improved student accommodation; the latter will provide new educational facilities for the College. The Heritage assets comprise books gifted to the College.
The insured value of freehold buildings as at 30 June 2010 was £250,019,000 (2009 - £249,700,000).
35
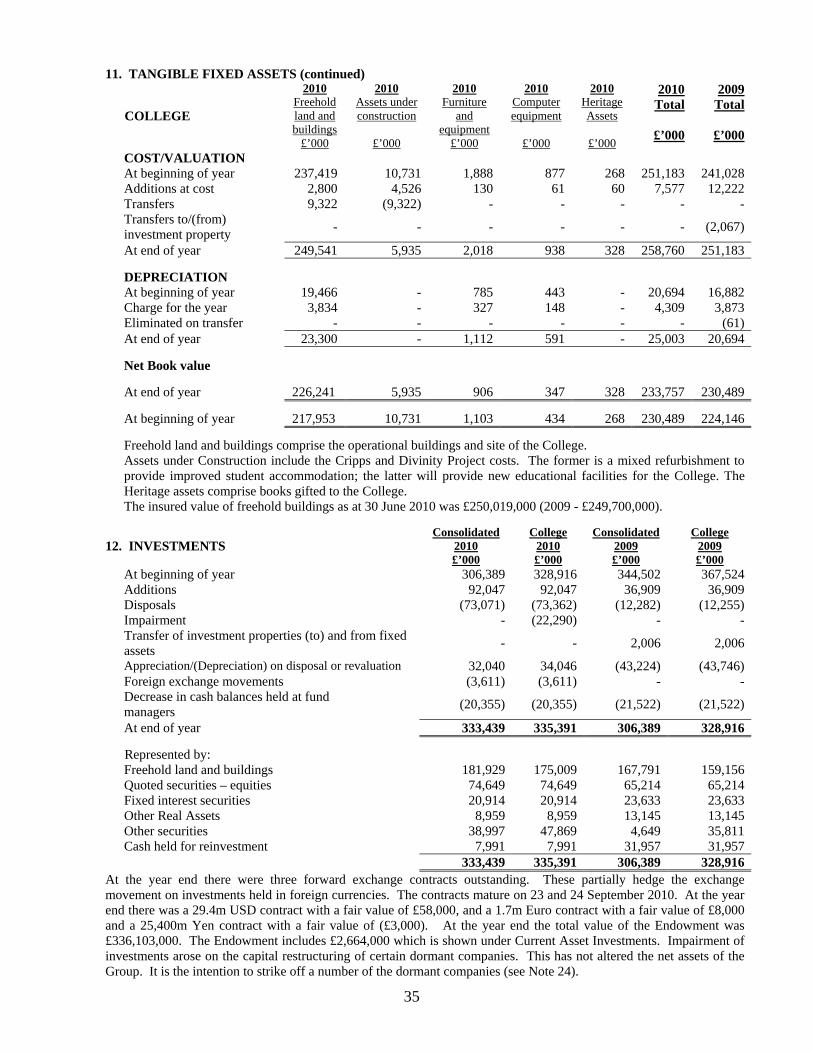
11. TANGIBLE FIXED ASSETS (continued)
COLLEGE
2010 Freehold land and buildings
£’000
2010 Assets under construction
£’000
2010 Furniture
and equipment
£’000
2010 Computer equipment
£’000
2010 Heritage Assets
£’000
2010 Total
£’000
2009 Total
£’000
COST/VALUATION At beginning of year 237,419 10,731 1,888 877 268 251,183 241,028 Additions at cost 2,800 4,526 130 61 60 7,577 12,222 Transfers 9,322 (9,322) - - - - - Transfers to/(from)
investment property - - - - - - (2,067)
At end of year 249,541 5,935 2,018 938 328 258,760 251,183
DEPRECIATION At beginning of year 19,466 - 785 443 - 20,694 16,882 Charge for the year 3,834 - 327 148 - 4,309 3,873 Eliminated on transfer - - - - - - (61) At end of year 23,300 - 1,112 591 - 25,003 20,694
Net Book value
At end of year 226,241 5,935 906 347 328 233,757 230,489
At beginning of year 217,953 10,731 1,103 434 268 230,489 224,146
Freehold land and buildings comprise the operational buildings and site of the College. Assets under Construction include the Cripps and Divinity Project costs. The former is a mixed refurbishment to
provide improved student accommodation; the latter will provide new educational facilities for the College. The Heritage assets comprise books gifted to the College.
The insured value of freehold buildings as at 30 June 2010 was £250,019,000 (2009 - £249,700,000).
12. INVESTMENTS Consolidated
2010 £’000
College 2010 £’000
Consolidated 2009 £’000
College 2009 £’000
At beginning of year 306,389 328,916 344,502 367,524 Additions 92,047 92,047 36,909 36,909 Disposals (73,071) (73,362) (12,282) (12,255) Impairment - (22,290) - - Transfer of investment properties (to) and from fixed
assets - - 2,006 2,006
Appreciation/(Depreciation) on disposal or revaluation 32,040 34,046 (43,224) (43,746) Foreign exchange movements (3,611) (3,611) - - Decrease in cash balances held at fund
managers (20,355) (20,355) (21,522) (21,522)
At end of year 333,439 335,391 306,389 328,916
Represented by: Freehold land and buildings 181,929 175,009 167,791 159,156 Quoted securities – equities 74,649 74,649 65,214 65,214 Fixed interest securities 20,914 20,914 23,633 23,633 Other Real Assets 8,959 8,959 13,145 13,145 Other securities 38,997 47,869 4,649 35,811 Cash held for reinvestment 7,991 7,991 31,957 31,957 333,439 335,391 306,389 328,916 At the year end there were three forward exchange contracts outstanding. These partially hedge the exchange movement on investments held in foreign currencies. The contracts mature on 23 and 24 September 2010. At the year end there was a 29.4m USD contract with a fair value of £58,000, and a 1.7m Euro contract with a fair value of £8,000 and a 25,400m Yen contract with a fair value of (£3,000). At the year end the total value of the Endowment was £336,103,000. The Endowment includes £2,664,000 which is shown under Current Asset Investments. Impairment of investments arose on the capital restructuring of certain dormant companies. This has not altered the net assets of the Group. It is the intention to strike off a number of the dormant companies (see Note 24).
36
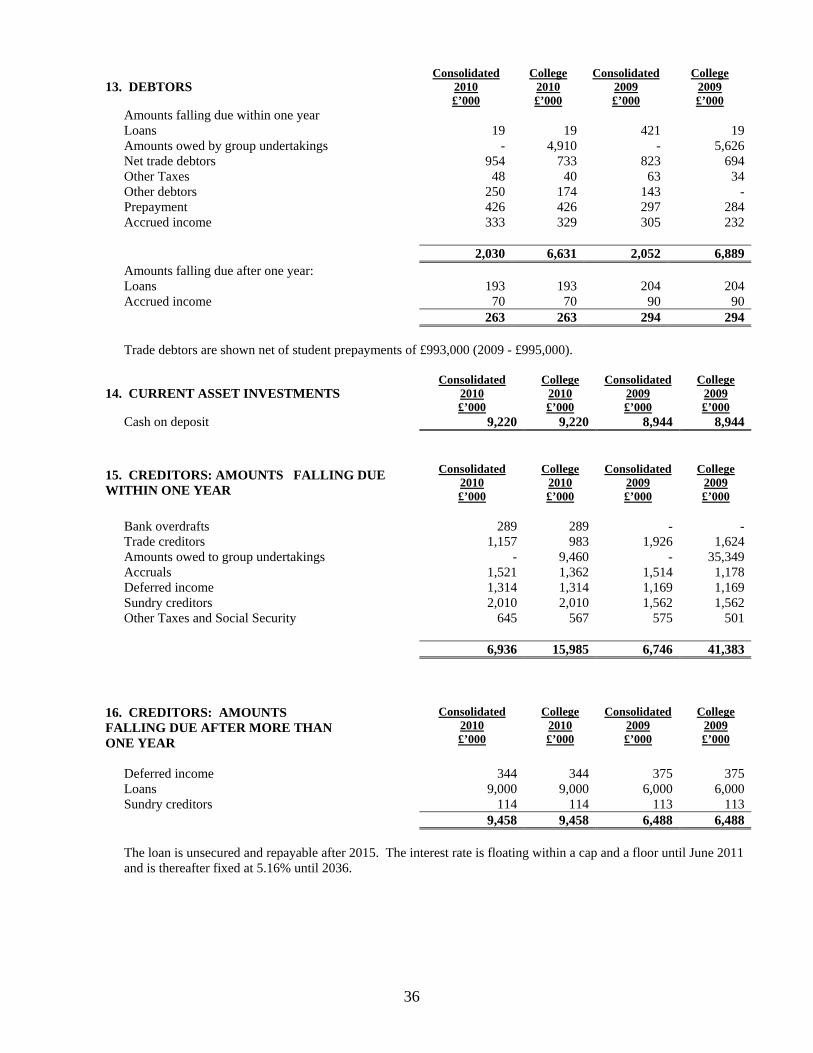
13. DEBTORS Consolidated
2010 £’000
College 2010 £’000
Consolidated 2009 £’000
College 2009 £’000
Amounts falling due within one year
Loans 19 19 421 19 Amounts owed by group undertakings - 4,910 - 5,626 Net trade debtors 954 733 823 694 Other Taxes 48 40 63 34 Other debtors 250 174 143 - Prepayment 426 426 297 284 Accrued income 333 329 305 232 2,030 6,631 2,052 6,889 Amounts falling due after one year: Loans 193 193 204 204 Accrued income 70 70 90 90 263 263 294 294 Trade debtors are shown net of student prepayments of £993,000 (2009 - £995,000).
14. CURRENT ASSET INVESTMENTS Consolidated
2010 £’000
College 2010 £’000
Consolidated 2009 £’000
College 2009 £’000
Cash on deposit 9,220 9,220 8,944 8,944
15. CREDITORS: AMOUNTS FALLING DUE WITHIN ONE YEAR
Consolidated 2010 £’000
College 2010 £’000
Consolidated 2009 £’000
College 2009 £’000
Bank overdrafts 289 289 - - Trade creditors 1,157 983 1,926 1,624 Amounts owed to group undertakings - 9,460 - 35,349 Accruals 1,521 1,362 1,514 1,178 Deferred income 1,314 1,314 1,169 1,169 Sundry creditors 2,010 2,010 1,562 1,562 Other Taxes and Social Security 645 567 575 501 6,936 15,985 6,746 41,383 16. CREDITORS: AMOUNTS FALLING DUE AFTER MORE THAN ONE YEAR
Consolidated 2010 £’000
College 2010 £’000
Consolidated 2009 £’000
College 2009 £’000
Deferred income 344 344 375 375 Loans 9,000 9,000 6,000 6,000 Sundry creditors 114 114 113 113 9,458 9,458 6,488 6,488 The loan is unsecured and repayable after 2015. The interest rate is floating within a cap and a floor until June 2011
and is thereafter fixed at 5.16% until 2036.
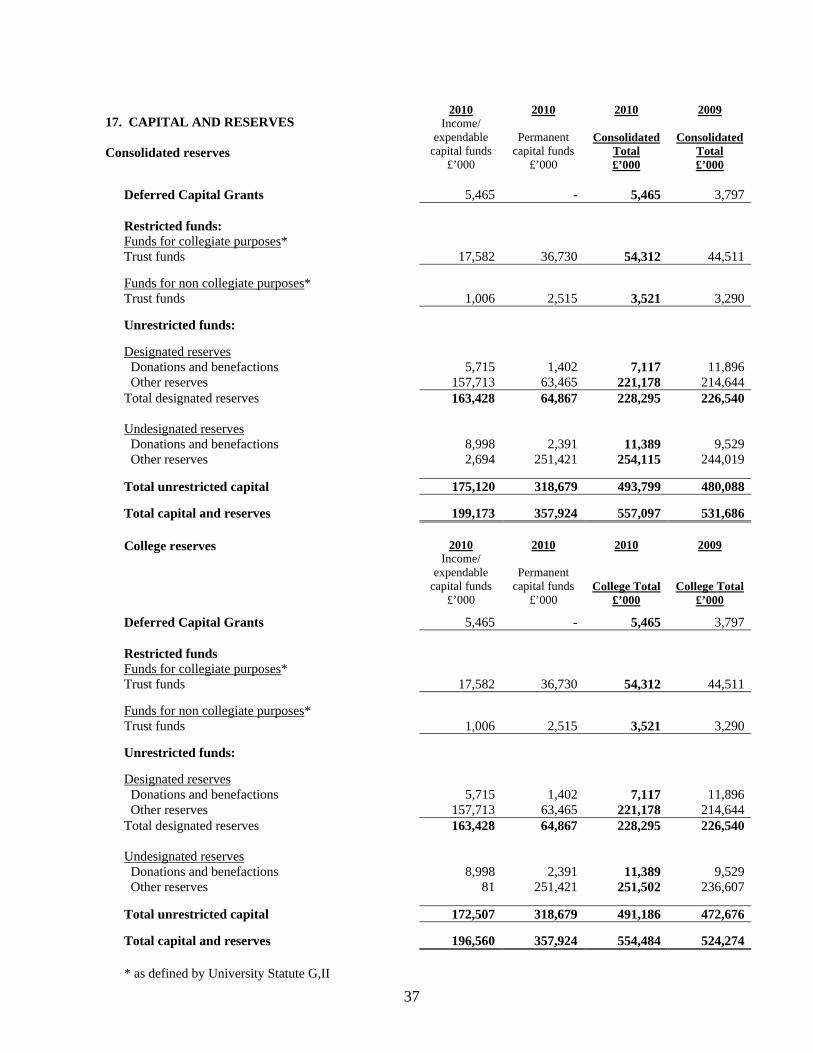
37
17. CAPITAL AND RESERVES Consolidated reserves
2010 Income/
expendable capital funds
£’000
2010
Permanent capital funds
£’000
2010
Consolidated Total £’000
2009
Consolidated Total £’000
Deferred Capital Grants 5,465 - 5,465 3,797 Restricted funds: Funds for collegiate purposes* Trust funds 17,582 36,730 54,312 44,511
Funds for non collegiate purposes* Trust funds 1,006 2,515 3,521 3,290
Unrestricted funds:
Designated reserves Donations and benefactions 5,715 1,402 7,117 11,896 Other reserves 157,713 63,465 221,178 214,644 Total designated reserves 163,428 64,867 228,295 226,540 Undesignated reserves Donations and benefactions 8,998 2,391 11,389 9,529 Other reserves 2,694 251,421 254,115 244,019
Total unrestricted capital 175,120 318,679 493,799 480,088
Total capital and reserves 199,173 357,924 557,097 531,686 College reserves
2010 Income/
expendable capital funds
£’000
2010
Permanent capital funds
£’000
2010
College Total £’000
2009
College Total £’000
Deferred Capital Grants 5,465 - 5,465 3,797 Restricted funds Funds for collegiate purposes* Trust funds 17,582 36,730 54,312 44,511
Funds for non collegiate purposes* Trust funds 1,006 2,515 3,521 3,290
Unrestricted funds:
Designated reserves Donations and benefactions 5,715 1,402 7,117 11,896 Other reserves 157,713 63,465 221,178 214,644 Total designated reserves 163,428 64,867 228,295 226,540 Undesignated reserves Donations and benefactions 8,998 2,391 11,389 9,529 Other reserves 81 251,421 251,502 236,607
Total unrestricted capital 172,507 318,679 491,186 472,676
Total capital and reserves 196,560 357,924 554,484 524,274 * as defined by University Statute G,II
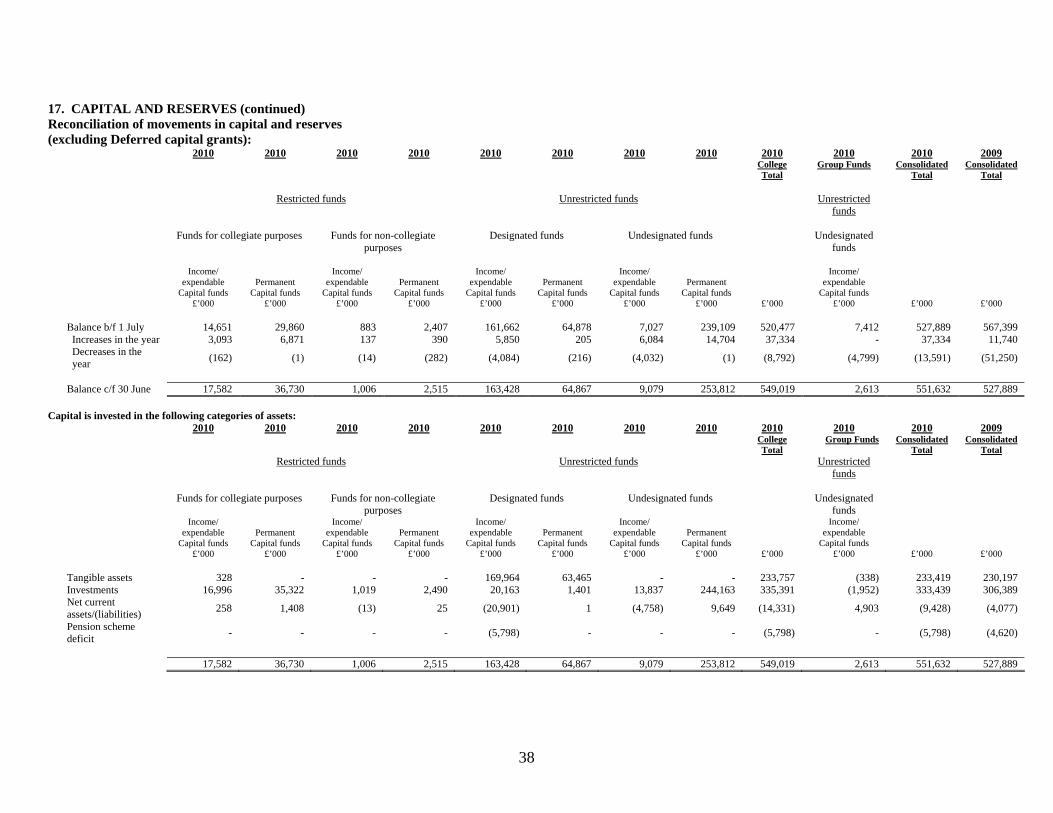
38
17. CAPITAL AND RESERVES (continued)
Reconciliation of movements in capital and reserves (excluding Deferred capital grants):
2010 2010 2010 2010 2010 2010 2010 2010 2010 2010 2010 2009
College Total
Group Funds Consolidated Total
Consolidated Total
Restricted funds Unrestricted funds Unrestricted
funds
Funds for collegiate purposes Funds for non-collegiate
purposes Designated funds Undesignated funds Undesignated
funds
Income/
expendable Capital funds
£’000
Permanent
Capital funds £’000
Income/ expendable
Capital funds £’000
Permanent
Capital funds £’000
Income/ expendable
Capital funds £’000
Permanent
Capital funds £’000
Income/ expendable
Capital funds £’000
Permanent
Capital funds £’000
£’000
Income/ expendable
Capital funds £’000
£’000
£’000 Balance b/f 1 July 14,651 29,860 883 2,407 161,662 64,878 7,027 239,109 520,477 7,412 527,889 567,399 Increases in the year 3,093 6,871 137 390 5,850 205 6,084 14,704 37,334 - 37,334 11,740 Decreases in the
year (162) (1) (14) (282) (4,084) (216) (4,032) (1) (8,792) (4,799) (13,591) (51,250)
Balance c/f 30 June 17,582 36,730 1,006 2,515 163,428 64,867 9,079 253,812 549,019 2,613 551,632 527,889 Capital is invested in the following categories of assets: 2010 2010 2010 2010 2010 2010 2010 2010 2010 2010 2010 2009
Consolidated Total
College Total
Group Funds Consolidated Total
Unrestricted funds
Unrestricted funds Restricted funds
Funds for collegiate purposes Funds for non-collegiate
purposes Designated funds Undesignated funds Undesignated
funds
Income/ expendable
Capital funds £’000
Permanent
Capital funds £’000
Income/ expendable
Capital funds £’000
Permanent
Capital funds £’000
Income/ expendable
Capital funds £’000
Permanent
Capital funds £’000
Income/ expendable
Capital funds £’000
Permanent
Capital funds £’000
£’000
Income/ expendable
Capital funds £’000
£’000
£’000 Tangible assets 328 - - - 169,964 63,465 - - 233,757 (338) 233,419 230,197 Investments 16,996 35,322 1,019 2,490 20,163 1,401 13,837 244,163 335,391 (1,952) 333,439 306,389 Net current
assets/(liabilities) 258 1,408 (13) 25 (20,901) 1 (4,758) 9,649 (14,331) 4,903 (9,428) (4,077)
Pension scheme deficit - - - - (5,798) - - - (5,798) - (5,798) (4,620)
17,582 36,730 1,006 2,515 163,428 64,867 9,079 253,812 549,019 2,613 551,632 527,889
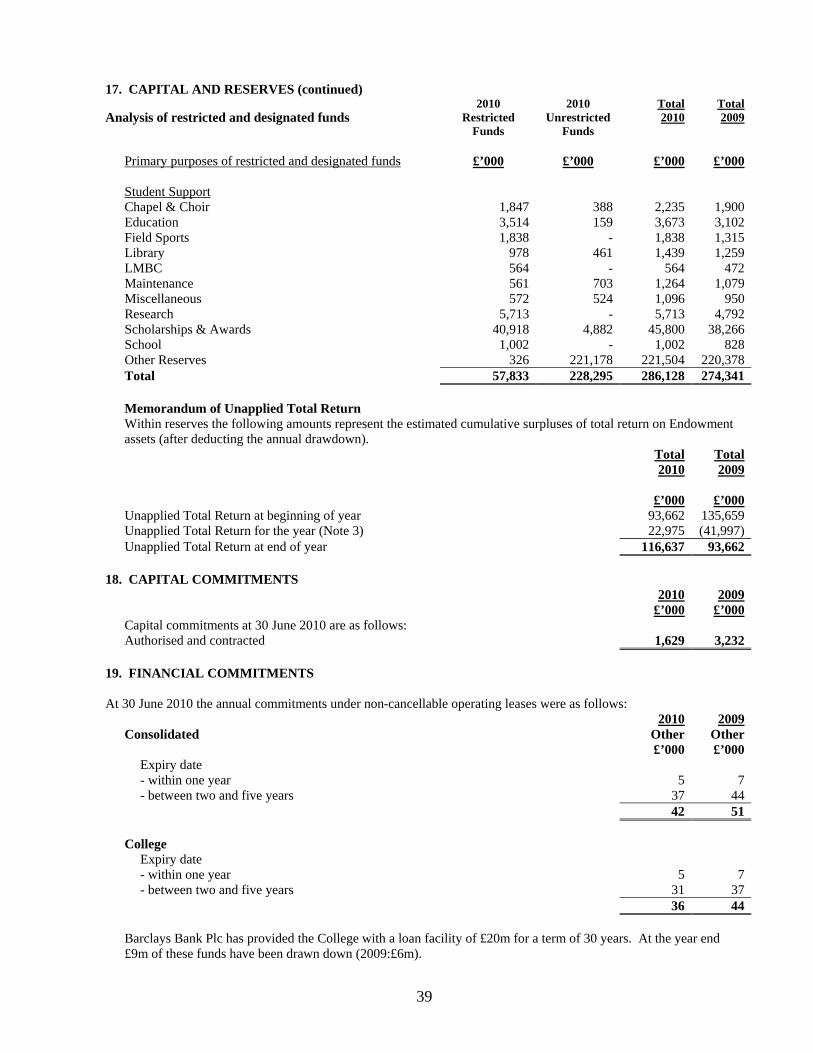
39
17. CAPITAL AND RESERVES (continued)
Analysis of restricted and designated funds 2010
Restricted Funds
2010 Unrestricted
Funds
Total 2010
Total 2009
Primary purposes of restricted and designated funds £’000 £’000 £’000 £’000
Student Support Chapel & Choir 1,847 388 2,235 1,900 Education 3,514 159 3,673 3,102 Field Sports 1,838 - 1,838 1,315 Library 978 461 1,439 1,259 LMBC 564 - 564 472 Maintenance 561 703 1,264 1,079 Miscellaneous 572 524 1,096 950 Research 5,713 - 5,713 4,792 Scholarships & Awards 40,918 4,882 45,800 38,266 School 1,002 - 1,002 828 Other Reserves 326 221,178 221,504 220,378 Total 57,833 228,295 286,128 274,341 Memorandum of Unapplied Total Return Within reserves the following amounts represent the estimated cumulative surpluses of total return on Endowment
assets (after deducting the annual drawdown). Total
2010
Total 2009
£’000 £’000
Unapplied Total Return at beginning of year 93,662 135,659 Unapplied Total Return for the year (Note 3) 22,975 (41,997) Unapplied Total Return at end of year 116,637 93,662 18. CAPITAL COMMITMENTS 2010
£’000
2009 £’000
Capital commitments at 30 June 2010 are as follows: Authorised and contracted 1,629 3,232 19. FINANCIAL COMMITMENTS At 30 June 2010 the annual commitments under non-cancellable operating leases were as follows: 2010 2009
Consolidated Other £’000
Other £’000
Expiry date - within one year 5 7 - between two and five years 37 44 42 51 College Expiry date - within one year 5 7 - between two and five years 31 37 36 44 Barclays Bank Plc has provided the College with a loan facility of £20m for a term of 30 years. At the year end
£9m of these funds have been drawn down (2009:£6m).
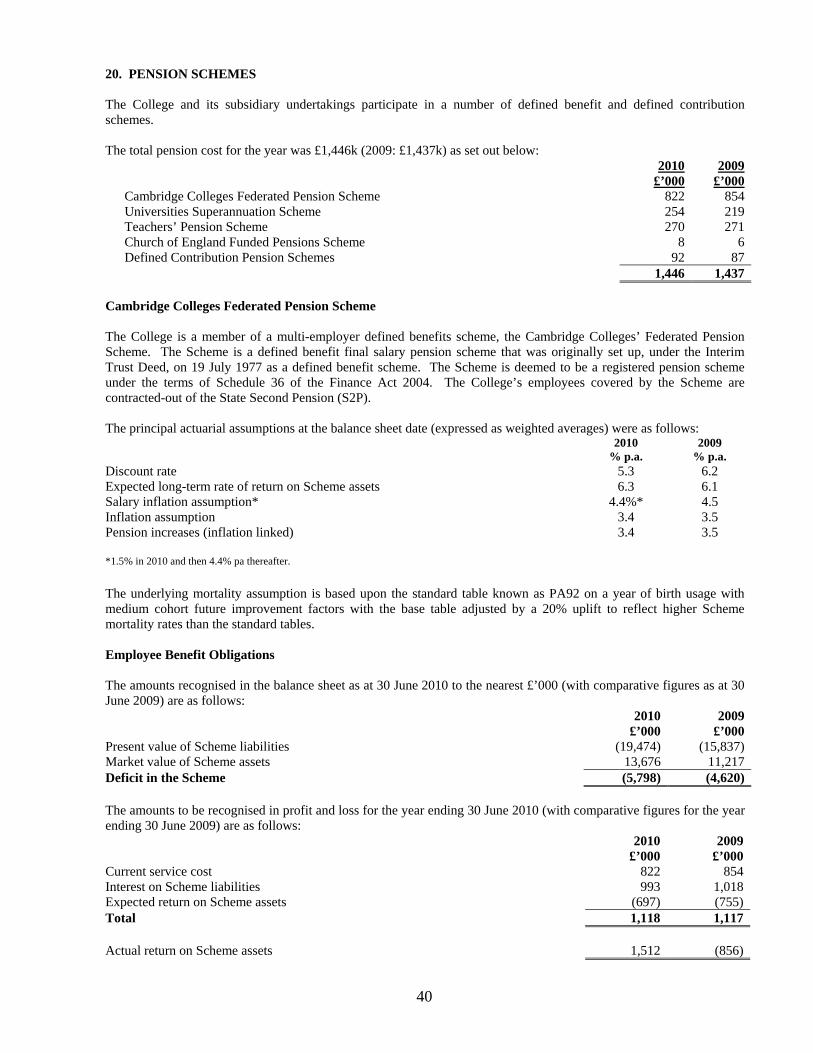
40
20. PENSION SCHEMES The College and its subsidiary undertakings participate in a number of defined benefit and defined contribution schemes. The total pension cost for the year was £1,446k (2009: £1,437k) as set out below: 2010
£’000
2009 £’000
Cambridge Colleges Federated Pension Scheme 822 854 Universities Superannuation Scheme 254 219 Teachers’ Pension Scheme 270 271 Church of England Funded Pensions Scheme 8 6 Defined Contribution Pension Schemes 92 87 1,446 1,437 Cambridge Colleges Federated Pension Scheme The College is a member of a multi-employer defined benefits scheme, the Cambridge Colleges’ Federated Pension Scheme. The Scheme is a defined benefit final salary pension scheme that was originally set up, under the Interim Trust Deed, on 19 July 1977 as a defined benefit scheme. The Scheme is deemed to be a registered pension scheme under the terms of Schedule 36 of the Finance Act 2004. The College’s employees covered by the Scheme are contracted-out of the State Second Pension (S2P). The principal actuarial assumptions at the balance sheet date (expressed as weighted averages) were as follows:
2010 % p.a.
2009 % p.a.
Discount rate 5.3 6.2 Expected long-term rate of return on Scheme assets 6.3 6.1 Salary inflation assumption* 4.4%* 4.5 Inflation assumption 3.4 3.5 Pension increases (inflation linked) 3.4 3.5 *1.5% in 2010 and then 4.4% pa thereafter. The underlying mortality assumption is based upon the standard table known as PA92 on a year of birth usage with medium cohort future improvement factors with the base table adjusted by a 20% uplift to reflect higher Scheme mortality rates than the standard tables. Employee Benefit Obligations The amounts recognised in the balance sheet as at 30 June 2010 to the nearest £’000 (with comparative figures as at 30 June 2009) are as follows: 2010
£’000 2009
£’000 Present value of Scheme liabilities (19,474) (15,837) Market value of Scheme assets 13,676 11,217 Deficit in the Scheme (5,798) (4,620) The amounts to be recognised in profit and loss for the year ending 30 June 2010 (with comparative figures for the year ending 30 June 2009) are as follows: 2010
£’000 2009
£’000 Current service cost 822 854 Interest on Scheme liabilities 993 1,018 Expected return on Scheme assets (697) (755) Total 1,118 1,117 Actual return on Scheme assets 1,512 (856)
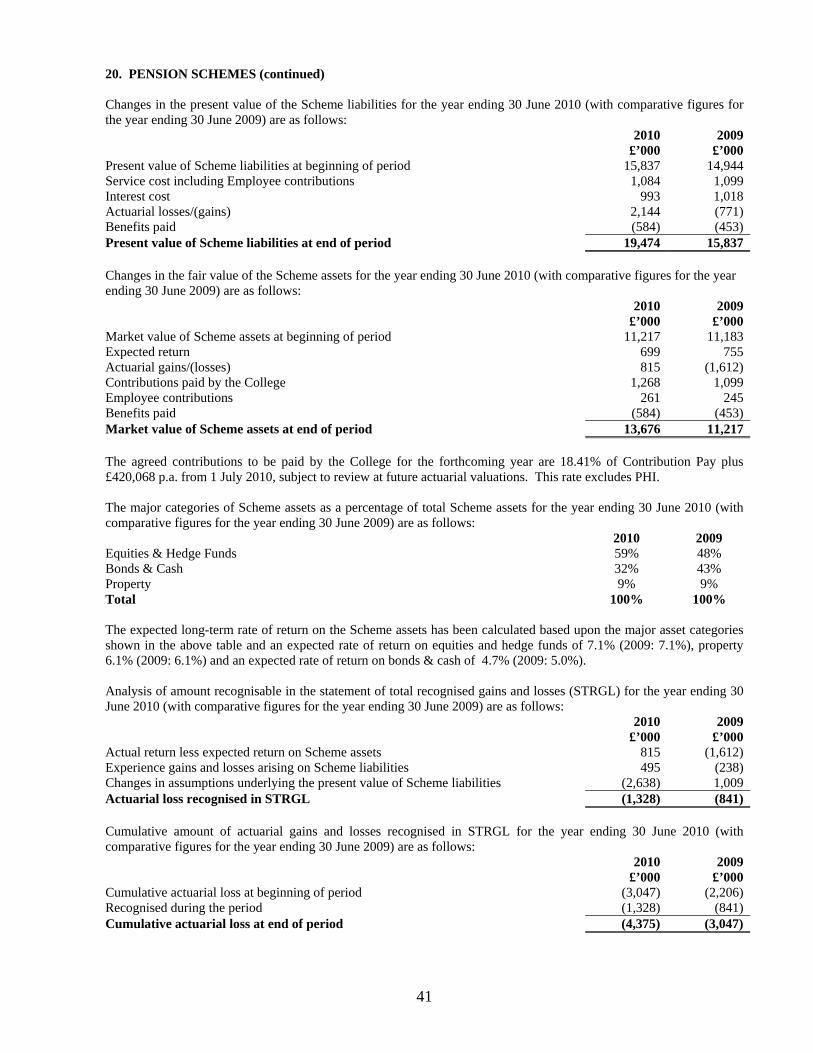
41
20. PENSION SCHEMES (continued) Changes in the present value of the Scheme liabilities for the year ending 30 June 2010 (with comparative figures for the year ending 30 June 2009) are as follows: 2010
£’000 2009
£’000 Present value of Scheme liabilities at beginning of period 15,837 14,944 Service cost including Employee contributions 1,084 1,099 Interest cost 993 1,018 Actuarial losses/(gains) 2,144 (771) Benefits paid (584) (453) Present value of Scheme liabilities at end of period 19,474 15,837 Changes in the fair value of the Scheme assets for the year ending 30 June 2010 (with comparative figures for the year ending 30 June 2009) are as follows: 2010
£’000 2009
£’000 Market value of Scheme assets at beginning of period 11,217 11,183 Expected return 699 755 Actuarial gains/(losses) 815 (1,612) Contributions paid by the College 1,268 1,099 Employee contributions 261 245 Benefits paid (584) (453) Market value of Scheme assets at end of period 13,676 11,217 The agreed contributions to be paid by the College for the forthcoming year are 18.41% of Contribution Pay plus £420,068 p.a. from 1 July 2010, subject to review at future actuarial valuations. This rate excludes PHI. The major categories of Scheme assets as a percentage of total Scheme assets for the year ending 30 June 2010 (with comparative figures for the year ending 30 June 2009) are as follows: 2010 2009 Equities & Hedge Funds 59% 48% Bonds & Cash 32% 43% Property 9% 9% Total 100% 100% The expected long-term rate of return on the Scheme assets has been calculated based upon the major asset categories shown in the above table and an expected rate of return on equities and hedge funds of 7.1% (2009: 7.1%), property 6.1% (2009: 6.1%) and an expected rate of return on bonds & cash of 4.7% (2009: 5.0%). Analysis of amount recognisable in the statement of total recognised gains and losses (STRGL) for the year ending 30 June 2010 (with comparative figures for the year ending 30 June 2009) are as follows: 2010
£’000 2009
£’000 Actual return less expected return on Scheme assets 815 (1,612) Experience gains and losses arising on Scheme liabilities 495 (238) Changes in assumptions underlying the present value of Scheme liabilities (2,638) 1,009 Actuarial loss recognised in STRGL (1,328) (841) Cumulative amount of actuarial gains and losses recognised in STRGL for the year ending 30 June 2010 (with comparative figures for the year ending 30 June 2009) are as follows: 2010
£’000 2009
£’000 Cumulative actuarial loss at beginning of period (3,047) (2,206) Recognised during the period (1,328) (841) Cumulative actuarial loss at end of period (4,375) (3,047)
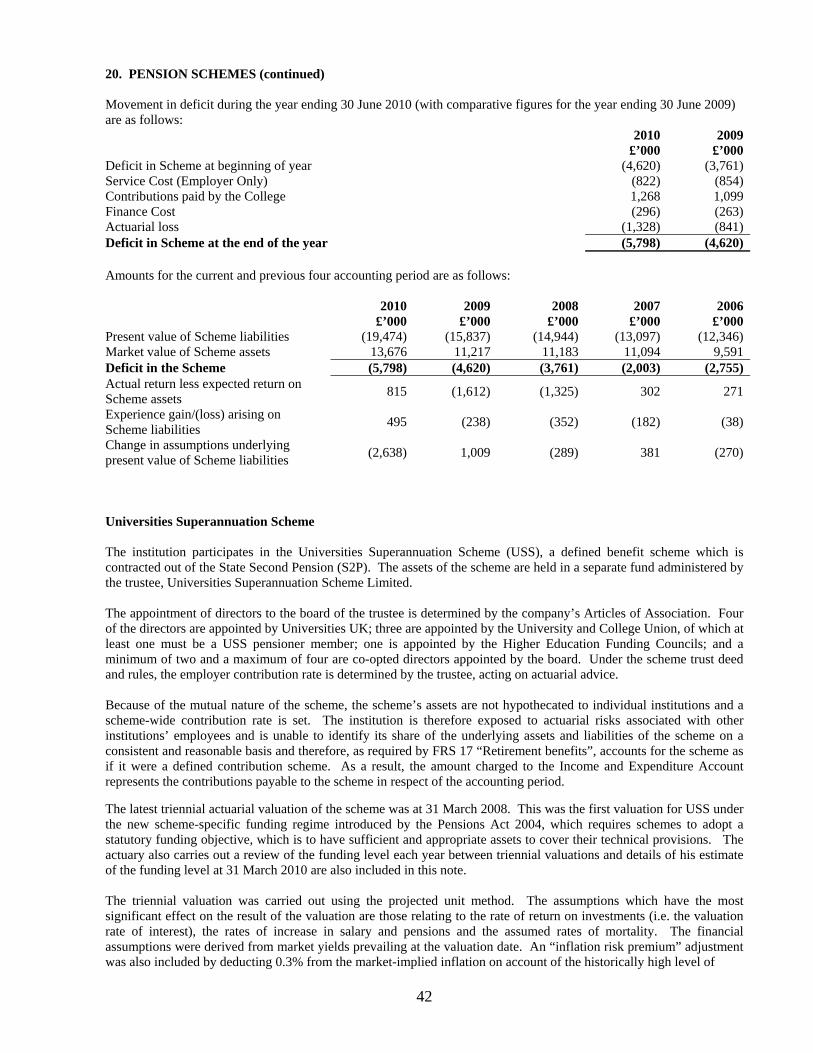
42
20. PENSION SCHEMES (continued) Movement in deficit during the year ending 30 June 2010 (with comparative figures for the year ending 30 June 2009) are as follows: 2010
£’000 2009
£’000 Deficit in Scheme at beginning of year (4,620) (3,761) Service Cost (Employer Only) (822) (854) Contributions paid by the College 1,268 1,099 Finance Cost (296) (263) Actuarial loss (1,328) (841) Deficit in Scheme at the end of the year (5,798) (4,620) Amounts for the current and previous four accounting period are as follows: 2010
£’000 2009
£’000 2008
£’000 2007
£’000 2006
£’000 Present value of Scheme liabilities (19,474) (15,837) (14,944) (13,097) (12,346) Market value of Scheme assets 13,676 11,217 11,183 11,094 9,591 Deficit in the Scheme (5,798) (4,620) (3,761) (2,003) (2,755) Actual return less expected return on Scheme assets 815 (1,612) (1,325) 302 271
Experience gain/(loss) arising on Scheme liabilities 495 (238) (352) (182) (38)
Change in assumptions underlying present value of Scheme liabilities (2,638) 1,009 (289) 381 (270)
Universities Superannuation Scheme The institution participates in the Universities Superannuation Scheme (USS), a defined benefit scheme which is contracted out of the State Second Pension (S2P). The assets of the scheme are held in a separate fund administered by the trustee, Universities Superannuation Scheme Limited. The appointment of directors to the board of the trustee is determined by the company’s Articles of Association. Four of the directors are appointed by Universities UK; three are appointed by the University and College Union, of which at least one must be a USS pensioner member; one is appointed by the Higher Education Funding Councils; and a minimum of two and a maximum of four are co-opted directors appointed by the board. Under the scheme trust deed and rules, the employer contribution rate is determined by the trustee, acting on actuarial advice. Because of the mutual nature of the scheme, the scheme’s assets are not hypothecated to individual institutions and a scheme-wide contribution rate is set. The institution is therefore exposed to actuarial risks associated with other institutions’ employees and is unable to identify its share of the underlying assets and liabilities of the scheme on a consistent and reasonable basis and therefore, as required by FRS 17 “Retirement benefits”, accounts for the scheme as if it were a defined contribution scheme. As a result, the amount charged to the Income and Expenditure Account represents the contributions payable to the scheme in respect of the accounting period. The latest triennial actuarial valuation of the scheme was at 31 March 2008. This was the first valuation for USS under the new scheme-specific funding regime introduced by the Pensions Act 2004, which requires schemes to adopt a statutory funding objective, which is to have sufficient and appropriate assets to cover their technical provisions. The actuary also carries out a review of the funding level each year between triennial valuations and details of his estimate of the funding level at 31 March 2010 are also included in this note. The triennial valuation was carried out using the projected unit method. The assumptions which have the most significant effect on the result of the valuation are those relating to the rate of return on investments (i.e. the valuation rate of interest), the rates of increase in salary and pensions and the assumed rates of mortality. The financial assumptions were derived from market yields prevailing at the valuation date. An “inflation risk premium” adjustment was also included by deducting 0.3% from the market-implied inflation on account of the historically high level of
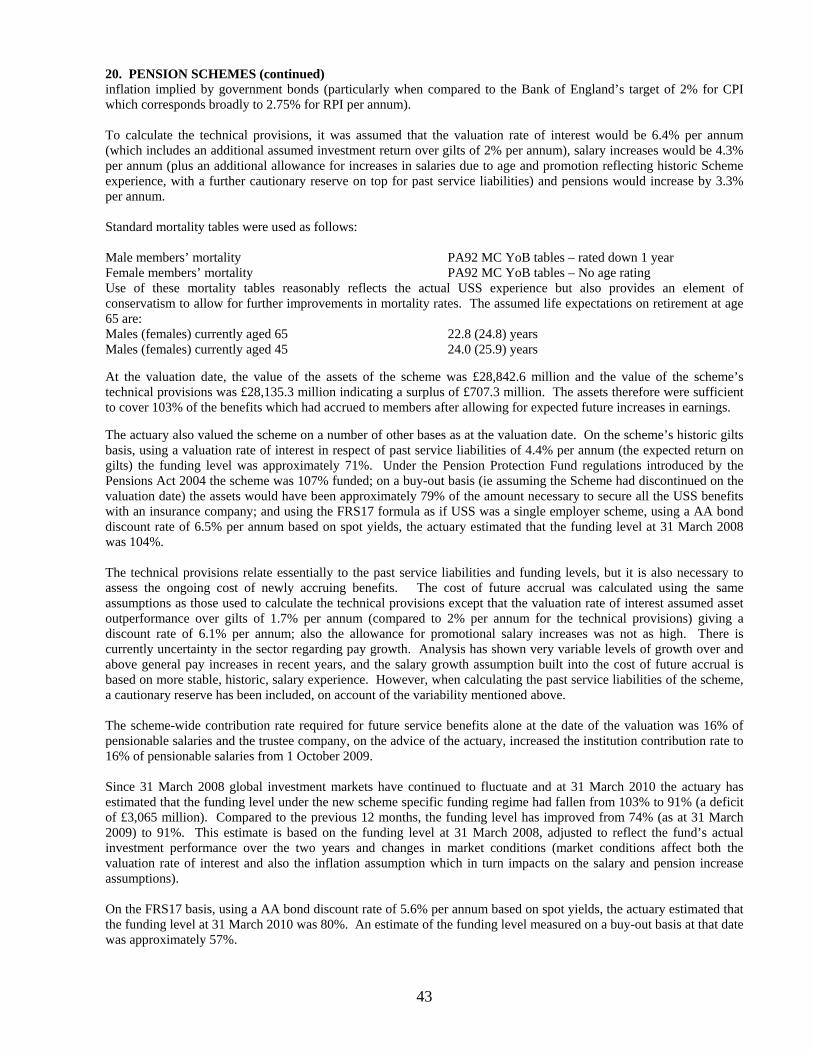
43
20. PENSION SCHEMES (continued) inflation implied by government bonds (particularly when compared to the Bank of England’s target of 2% for CPI which corresponds broadly to 2.75% for RPI per annum). To calculate the technical provisions, it was assumed that the valuation rate of interest would be 6.4% per annum (which includes an additional assumed investment return over gilts of 2% per annum), salary increases would be 4.3% per annum (plus an additional allowance for increases in salaries due to age and promotion reflecting historic Scheme experience, with a further cautionary reserve on top for past service liabilities) and pensions would increase by 3.3% per annum. Standard mortality tables were used as follows: Male members’ mortality PA92 MC YoB tables – rated down 1 year Female members’ mortality PA92 MC YoB tables – No age rating Use of these mortality tables reasonably reflects the actual USS experience but also provides an element of conservatism to allow for further improvements in mortality rates. The assumed life expectations on retirement at age 65 are: Males (females) currently aged 65 22.8 (24.8) years Males (females) currently aged 45 24.0 (25.9) years At the valuation date, the value of the assets of the scheme was £28,842.6 million and the value of the scheme’s technical provisions was £28,135.3 million indicating a surplus of £707.3 million. The assets therefore were sufficient to cover 103% of the benefits which had accrued to members after allowing for expected future increases in earnings. The actuary also valued the scheme on a number of other bases as at the valuation date. On the scheme’s historic gilts basis, using a valuation rate of interest in respect of past service liabilities of 4.4% per annum (the expected return on gilts) the funding level was approximately 71%. Under the Pension Protection Fund regulations introduced by the Pensions Act 2004 the scheme was 107% funded; on a buy-out basis (ie assuming the Scheme had discontinued on the valuation date) the assets would have been approximately 79% of the amount necessary to secure all the USS benefits with an insurance company; and using the FRS17 formula as if USS was a single employer scheme, using a AA bond discount rate of 6.5% per annum based on spot yields, the actuary estimated that the funding level at 31 March 2008 was 104%. The technical provisions relate essentially to the past service liabilities and funding levels, but it is also necessary to assess the ongoing cost of newly accruing benefits. The cost of future accrual was calculated using the same assumptions as those used to calculate the technical provisions except that the valuation rate of interest assumed asset outperformance over gilts of 1.7% per annum (compared to 2% per annum for the technical provisions) giving a discount rate of 6.1% per annum; also the allowance for promotional salary increases was not as high. There is currently uncertainty in the sector regarding pay growth. Analysis has shown very variable levels of growth over and above general pay increases in recent years, and the salary growth assumption built into the cost of future accrual is based on more stable, historic, salary experience. However, when calculating the past service liabilities of the scheme, a cautionary reserve has been included, on account of the variability mentioned above. The scheme-wide contribution rate required for future service benefits alone at the date of the valuation was 16% of pensionable salaries and the trustee company, on the advice of the actuary, increased the institution contribution rate to 16% of pensionable salaries from 1 October 2009. Since 31 March 2008 global investment markets have continued to fluctuate and at 31 March 2010 the actuary has estimated that the funding level under the new scheme specific funding regime had fallen from 103% to 91% (a deficit of £3,065 million). Compared to the previous 12 months, the funding level has improved from 74% (as at 31 March 2009) to 91%. This estimate is based on the funding level at 31 March 2008, adjusted to reflect the fund’s actual investment performance over the two years and changes in market conditions (market conditions affect both the valuation rate of interest and also the inflation assumption which in turn impacts on the salary and pension increase assumptions). On the FRS17 basis, using a AA bond discount rate of 5.6% per annum based on spot yields, the actuary estimated that the funding level at 31 March 2010 was 80%. An estimate of the funding level measured on a buy-out basis at that date was approximately 57%.
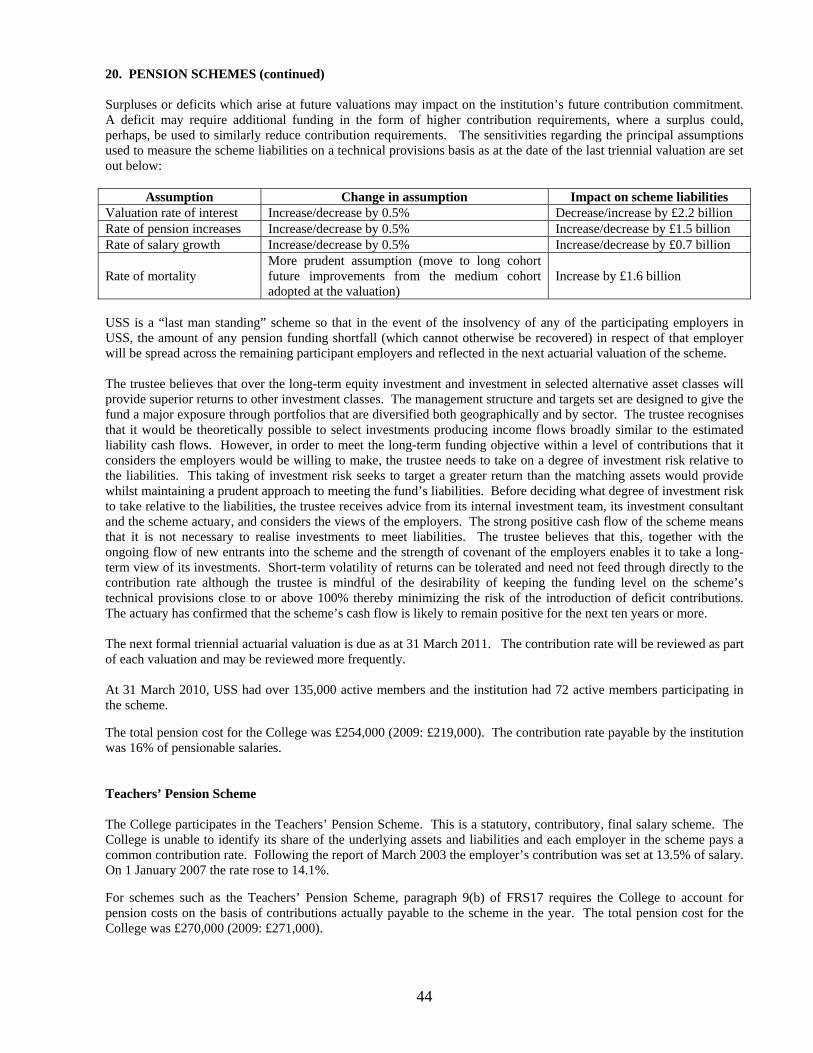
44
20. PENSION SCHEMES (continued) Surpluses or deficits which arise at future valuations may impact on the institution’s future contribution commitment. A deficit may require additional funding in the form of higher contribution requirements, where a surplus could, perhaps, be used to similarly reduce contribution requirements. The sensitivities regarding the principal assumptions used to measure the scheme liabilities on a technical provisions basis as at the date of the last triennial valuation are set out below:
Assumption Change in assumption Impact on scheme liabilities Valuation rate of interest Increase/decrease by 0.5% Decrease/increase by £2.2 billion Rate of pension increases Increase/decrease by 0.5% Increase/decrease by £1.5 billion Rate of salary growth Increase/decrease by 0.5% Increase/decrease by £0.7 billion Rate of mortality
More prudent assumption (move to long cohort future improvements from the medium cohort adopted at the valuation)
Increase by £1.6 billion
USS is a “last man standing” scheme so that in the event of the insolvency of any of the participating employers in USS, the amount of any pension funding shortfall (which cannot otherwise be recovered) in respect of that employer will be spread across the remaining participant employers and reflected in the next actuarial valuation of the scheme. The trustee believes that over the long-term equity investment and investment in selected alternative asset classes will provide superior returns to other investment classes. The management structure and targets set are designed to give the fund a major exposure through portfolios that are diversified both geographically and by sector. The trustee recognises that it would be theoretically possible to select investments producing income flows broadly similar to the estimated liability cash flows. However, in order to meet the long-term funding objective within a level of contributions that it considers the employers would be willing to make, the trustee needs to take on a degree of investment risk relative to the liabilities. This taking of investment risk seeks to target a greater return than the matching assets would provide whilst maintaining a prudent approach to meeting the fund’s liabilities. Before deciding what degree of investment risk to take relative to the liabilities, the trustee receives advice from its internal investment team, its investment consultant and the scheme actuary, and considers the views of the employers. The strong positive cash flow of the scheme means that it is not necessary to realise investments to meet liabilities. The trustee believes that this, together with the ongoing flow of new entrants into the scheme and the strength of covenant of the employers enables it to take a long-term view of its investments. Short-term volatility of returns can be tolerated and need not feed through directly to the contribution rate although the trustee is mindful of the desirability of keeping the funding level on the scheme’s technical provisions close to or above 100% thereby minimizing the risk of the introduction of deficit contributions. The actuary has confirmed that the scheme’s cash flow is likely to remain positive for the next ten years or more. The next formal triennial actuarial valuation is due as at 31 March 2011. The contribution rate will be reviewed as part of each valuation and may be reviewed more frequently. At 31 March 2010, USS had over 135,000 active members and the institution had 72 active members participating in the scheme. The total pension cost for the College was £254,000 (2009: £219,000). The contribution rate payable by the institution was 16% of pensionable salaries. Teachers’ Pension Scheme The College participates in the Teachers’ Pension Scheme. This is a statutory, contributory, final salary scheme. The College is unable to identify its share of the underlying assets and liabilities and each employer in the scheme pays a common contribution rate. Following the report of March 2003 the employer’s contribution was set at 13.5% of salary. On 1 January 2007 the rate rose to 14.1%. For schemes such as the Teachers’ Pension Scheme, paragraph 9(b) of FRS17 requires the College to account for pension costs on the basis of contributions actually payable to the scheme in the year. The total pension cost for the College was £270,000 (2009: £271,000).
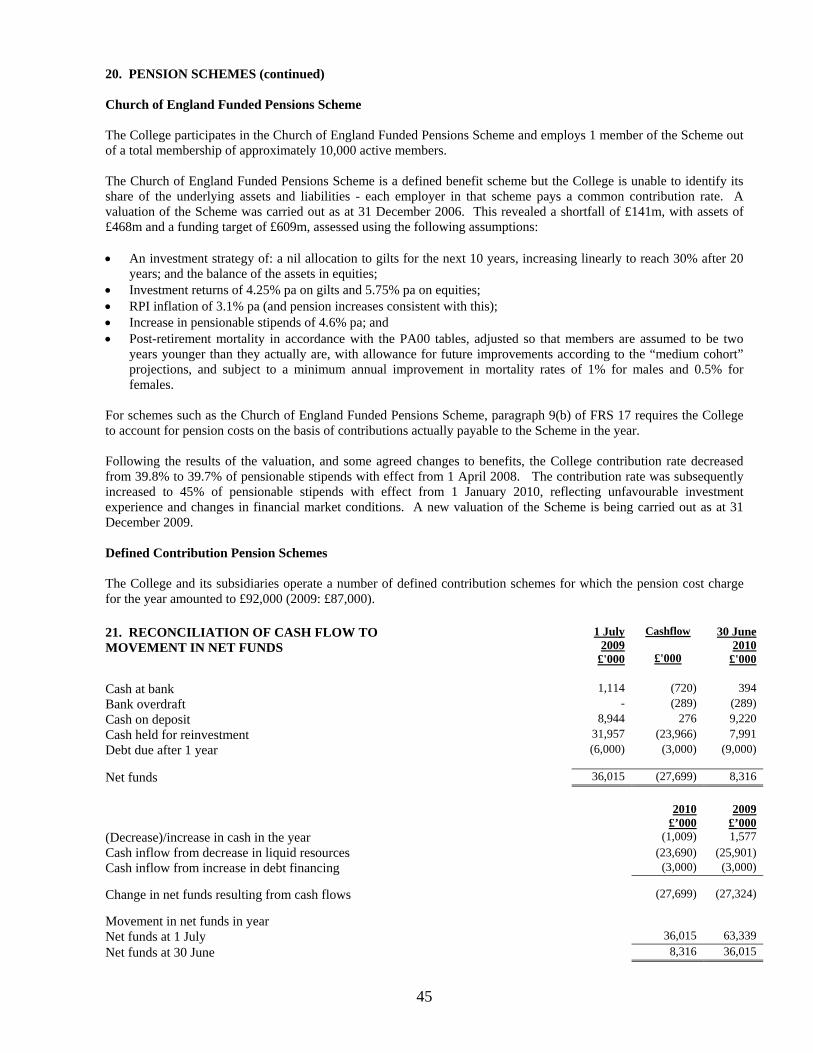
45
20. PENSION SCHEMES (continued) Church of England Funded Pensions Scheme The College participates in the Church of England Funded Pensions Scheme and employs 1 member of the Scheme out of a total membership of approximately 10,000 active members. The Church of England Funded Pensions Scheme is a defined benefit scheme but the College is unable to identify its share of the underlying assets and liabilities - each employer in that scheme pays a common contribution rate. A valuation of the Scheme was carried out as at 31 December 2006. This revealed a shortfall of £141m, with assets of £468m and a funding target of £609m, assessed using the following assumptions: • An investment strategy of: a nil allocation to gilts for the next 10 years, increasing linearly to reach 30% after 20
years; and the balance of the assets in equities; • Investment returns of 4.25% pa on gilts and 5.75% pa on equities; • RPI inflation of 3.1% pa (and pension increases consistent with this); • Increase in pensionable stipends of 4.6% pa; and • Post-retirement mortality in accordance with the PA00 tables, adjusted so that members are assumed to be two
years younger than they actually are, with allowance for future improvements according to the “medium cohort” projections, and subject to a minimum annual improvement in mortality rates of 1% for males and 0.5% for females.
For schemes such as the Church of England Funded Pensions Scheme, paragraph 9(b) of FRS 17 requires the College to account for pension costs on the basis of contributions actually payable to the Scheme in the year. Following the results of the valuation, and some agreed changes to benefits, the College contribution rate decreased from 39.8% to 39.7% of pensionable stipends with effect from 1 April 2008. The contribution rate was subsequently increased to 45% of pensionable stipends with effect from 1 January 2010, reflecting unfavourable investment experience and changes in financial market conditions. A new valuation of the Scheme is being carried out as at 31 December 2009. Defined Contribution Pension Schemes The College and its subsidiaries operate a number of defined contribution schemes for which the pension cost charge for the year amounted to £92,000 (2009: £87,000). 21. RECONCILIATION OF CASH FLOW TO MOVEMENT IN NET FUNDS
1 July 2009
£'000
Cashflow
£'000
30 June 2010
£'000
Cash at bank 1,114 (720) 394 Bank overdraft - (289) (289) Cash on deposit 8,944 276 9,220 Cash held for reinvestment 31,957 (23,966) 7,991 Debt due after 1 year (6,000) (3,000) (9,000)
Net funds 36,015 (27,699) 8,316 2010
£’000
2009 £’000
(Decrease)/increase in cash in the year (1,009) 1,577 Cash inflow from decrease in liquid resources (23,690) (25,901) Cash inflow from increase in debt financing (3,000) (3,000)
Change in net funds resulting from cash flows (27,699) (27,324)
Movement in net funds in year Net funds at 1 July 36,015 63,339 Net funds at 30 June 8,316 36,015
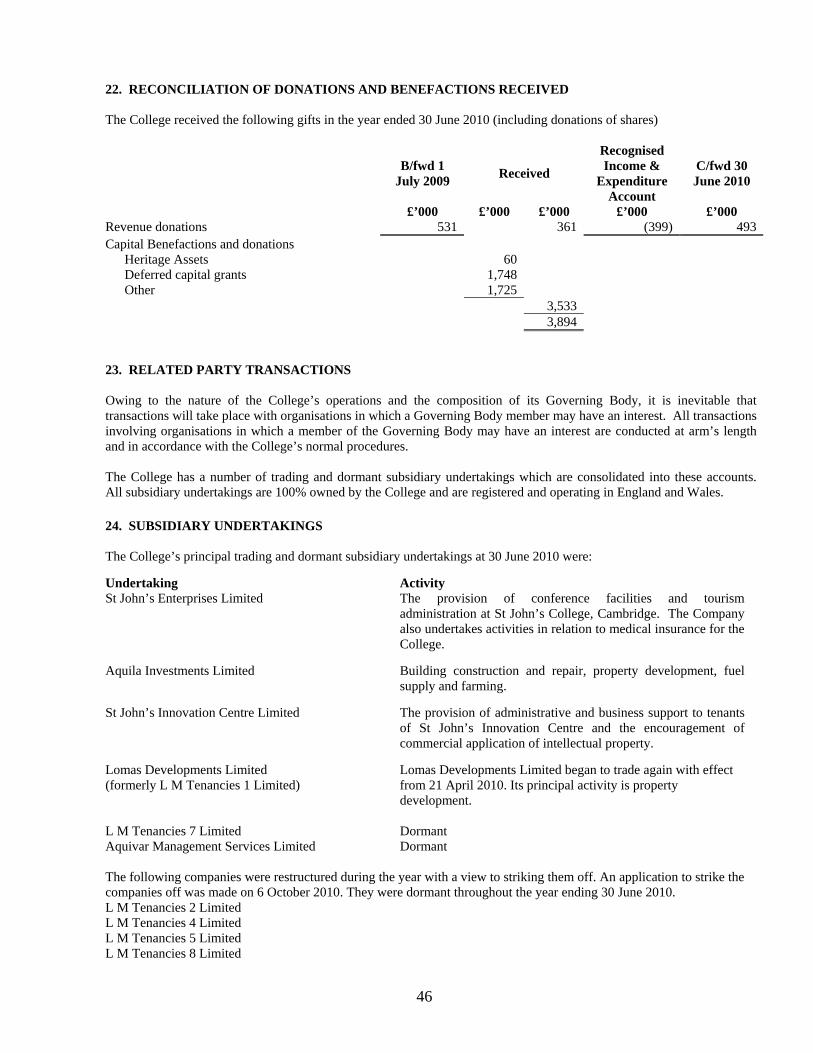
46
22. RECONCILIATION OF DONATIONS AND BENEFACTIONS RECEIVED The College received the following gifts in the year ended 30 June 2010 (including donations of shares)
B/fwd 1 July 2009 Received
Recognised Income &
Expenditure Account
C/fwd 30 June 2010
£’000 £’000 £’000 £’000 £’000 Revenue donations 531 361 (399) 493 Capital Benefactions and donations Heritage Assets 60 Deferred capital grants 1,748 Other 1,725 3,533 3,894
23. RELATED PARTY TRANSACTIONS Owing to the nature of the College’s operations and the composition of its Governing Body, it is inevitable that transactions will take place with organisations in which a Governing Body member may have an interest. All transactions involving organisations in which a member of the Governing Body may have an interest are conducted at arm’s length and in accordance with the College’s normal procedures. The College has a number of trading and dormant subsidiary undertakings which are consolidated into these accounts. All subsidiary undertakings are 100% owned by the College and are registered and operating in England and Wales. 24. SUBSIDIARY UNDERTAKINGS The College’s principal trading and dormant subsidiary undertakings at 30 June 2010 were:
Undertaking Activity St John’s Enterprises Limited The provision of conference facilities and tourism
administration at St John’s College, Cambridge. The Company also undertakes activities in relation to medical insurance for the College.
Aquila Investments Limited Building construction and repair, property development, fuel supply and farming.
St John’s Innovation Centre Limited The provision of administrative and business support to tenants
of St John’s Innovation Centre and the encouragement of commercial application of intellectual property.
Lomas Developments Limited (formerly L M Tenancies 1 Limited)
Lomas Developments Limited began to trade again with effect from 21 April 2010. Its principal activity is property development.
L M Tenancies 7 Limited Dormant Aquivar Management Services Limited Dormant The following companies were restructured during the year with a view to striking them off. An application to strike the companies off was made on 6 October 2010. They were dormant throughout the year ending 30 June 2010. L M Tenancies 2 Limited L M Tenancies 4 Limited L M Tenancies 5 Limited L M Tenancies 8 Limited