Embed Size (px)
Citation preview

Diabetes Risk and Prevention Programs in Michigan
June 7, 2013 First Friday Forum

Overview of the Science of Prediabetes
Paul M. Dake, M.D.
Diabetes Partners in Action Coalition Co-Chair

Learner Objectives • Define prediabetes • Understand the heightened risk for diabetes • State which diabetes complications begin in
prediabetes

Lab Values – Prediabetes/Diabetes Normal Prediabetes Diabetes
HbA1c (A1c) Less than 5.7%
5.7% – 6.4% Greater than 6.4%
Fasting Blood Glucose (FBG)
Less than 100mg/dl
100 – 125 mg/dl
Greater than 125 mg/dl
Oral Glucose Tolerance (OGTT)
Less than 140mg/dl
140 – 199 mg/dl
Greater than 199 mg/dl

Tip of the iceberg…
26 million with Diabetes
79 million with Prediabetes1
1. Centers for Disease Control and Prevention (CDC). National diabetes fact sheet: national estimates and general information on diabetes and prediabetes in the United States, 2011. Atlanta, GA: U.S. Health and Human Services, CDC, 2011.
Prediabetes • 35% of US adults have prediabetes, which equates to
about 2.6 million individuals in Michigan.1,2 • Only 6.4% of adults with prediabetes in Michigan
know their prediabetes status. The numbers are slightly higher for those at higher risk (overweight, older, etc.)3
1. Centers for Disease Control and Prevention (CDC). National diabetes fact sheet: national estimates and general information on diabetes and prediabetes in the United States, 2011. Atlanta, GA: U.S. Health and Human Services, CDC, 2011.
2. Prediabetes in Michigan 2011—The Facts. Michigan Department of Community Health, 2011. www.michigan.gov/diabetes
3. Fussman C, Pier K. Diabetes Testing and Prediabetes Among Michigan Adults. Michigan BRFSS Surveillance Brief. Vol. 5, No. 5. Lansing, MI: Michigan Department of Community Health, Division of Genomics, Perinatal Health, and Chronic Disease Epidemiology, Surveillance

Prediabetes—Risk of Diabetes
• 9-25% increased 5-year incidence risk for those with A1c 5.5%-6.0%, compared to having an A1c <= 5.0%
• 25-50% increased 5-year incidence risk for those with A1c 6.0%-6.5%; Relative Risk = 20, compared to those with A1c of 5.0%4
4. Zhang X, Gregg EW, Williamson DF, Barker LE, Thomas W, Bullard KW, Imperatore G, Williams DE, Albright AL. A1C level and future risk of diabetes: a systematic review. Diabetes Care 2010;33:1665–1673

End-organ Damage in Prediabetes
• Retinopathy (eye blood vessel changes) • Neuropathy (damage to small nerves) • Nephropathy (decrease in kidney function)

Testing Recommendations 1. Testing should be considered in all adults who are overweight (BMI ≥25 kg/m2*) and have additional risk factors:
Physical inactivity First-degree relative with diabetes High-risk race/ethnicity Women who delivered a baby weighing >9lb or history of Gestational Diabetes Hypertension OR on therapy for hypertension (even if controlled) HDL cholesterol level <35 mg/dL and/or a triglyceride level >250 mg/dL A1c ≥ 5.7%, Impaired Glucose Tolerance, or Impaired Fasting Glucose on
previous testing Other clinical conditions associated with insulin resistance Cardiovascular Disease
2. In the absence of the above criteria, testing for diabetes should begin at age 45 years. 3. If results are normal, testing should be repeated at least at 3-year intervals, with consideration of more frequent testing depending upon initial results and risk status.
American Diabetes Association Clinical Practice Recommendations, 2013
DPP Evidence and NDPP—MDCH Diabetes Prevention
Kristi Pier, MHS, MCHES Michigan Department of Community
Health

Learner Objectives
• Understand the evidence of diabetes prevention from the original studies
• Be aware of the components of the CDC Diabetes Prevention Recognition Program
• Be aware of diabetes prevention programs in Michigan and how to refer participants

Overview of the Evidence-based Diabetes Prevention Program
– The DPP study for people with prediabetes • 3,234 people with elevated glucose levels, non-
diabetes – 3 Groups
• Placebo • Metformin • Lifestyle changes
– Lifestyle change group saw a 58% reduction in diabetes incidence
– Metformin group saw a 31% reduction

Evidence of Lifestyle Change Program Original DPP -- Lifestyle intervention
• Achieve at least 7% weight loss • Moderate physical activity of 150 minutes a week • One-on-one 16 session program, 2 hour sessions, for 4
months; monthly sessions for remainder of year • Nutrition, physical activity content, behavior change
content, such as goal setting and problem solving DEPLOY study—Research into Practice
• Proved similar outcomes in group setting • 6.0% weight loss at 6 months • Based in community, primarily utilizing lay health
leaders (lifestyle coaches) • Group sessions, 1 hour (vs 2 hour one-on-one)

National Diabetes Prevention Program—Lifestyle Balance
Two Goals • Lose 5-7% weight • Moderate physical activity of 150 minutes a week
Program Structure • Group program based in community, led by lifestyle coaches • Core Sessions—16 weekly sessions; Post-Core—6 monthly
sessions • Content includes nutrition, physical activity, behavior change
content, such as goal setting and problem solving • Participants log/track food intake and physical activity
Participants • Must be 18 or older • Have prediabetes (at least 50% of participants) or be at high risk

CDC NDPP Recognition Program The CDC has established a “recognition” program to: ◦ Standardize, assuring quality and fidelity as the
program is implemented across the country ◦ Develop and maintain a program registry ◦ Provide technical assistance
Standards and program delivery requirements are located in the Standards and Operating Procedures document (www.cdc.gov/diabetes/prevention)
The goal of CDC Diabetes Prevention is to scale the program quickly and seek reimbursement

Diabetes Prevention Recognition Programs must:
• Apply to become DPP delivery organization • Identify curriculum to be used • Submit regular data:
o Attendance—core and post-core o Weight and PA documentation o Proof of program eligibility requirement— >50%
with prediabetes lab value • Organizations considered “pending” until data
submitted and approved

Lifestyle Coach Training
• Recognized agencies are encouraged to send lifestyle coaches to training o CDC identified training agency, Diabetes Training
and Technical Assistance Center (DTTAC) and master trainers to deliver approved curriculum
• Current recognized programs in Michigan have trained lifestyle coaches

MDCH Diabetes Prevention Program Progress
• Three lifestyle coach training sessions by DTTAC; 9 DPRPs; 36 trained coaches
• One of 8 states with grant from NACDD State Diabetes Prevention Project o Established Diabetes Prevention Network to update, access
resources and provide TA as needed o NACDD grant funding to allow us to outreach to providers
and establish referral networks • Online data application to support data reporting to CDC • Convene 4 working teams to support DPRPs
o Data, Marketing; 3rd Party Reimbursement and Reaching Employers

A Culture of Prevention Integrating Health Status into
the Company Culture
Terri Eudy, MA Grand Valley Health Plan

Learner Objectives
• Understand the benefits of risk reduction in employees and cost of diabetes in sick days, absenteeism, loss of productivity and health care costs
• Be aware of benefits of a prevention culture in the worksite
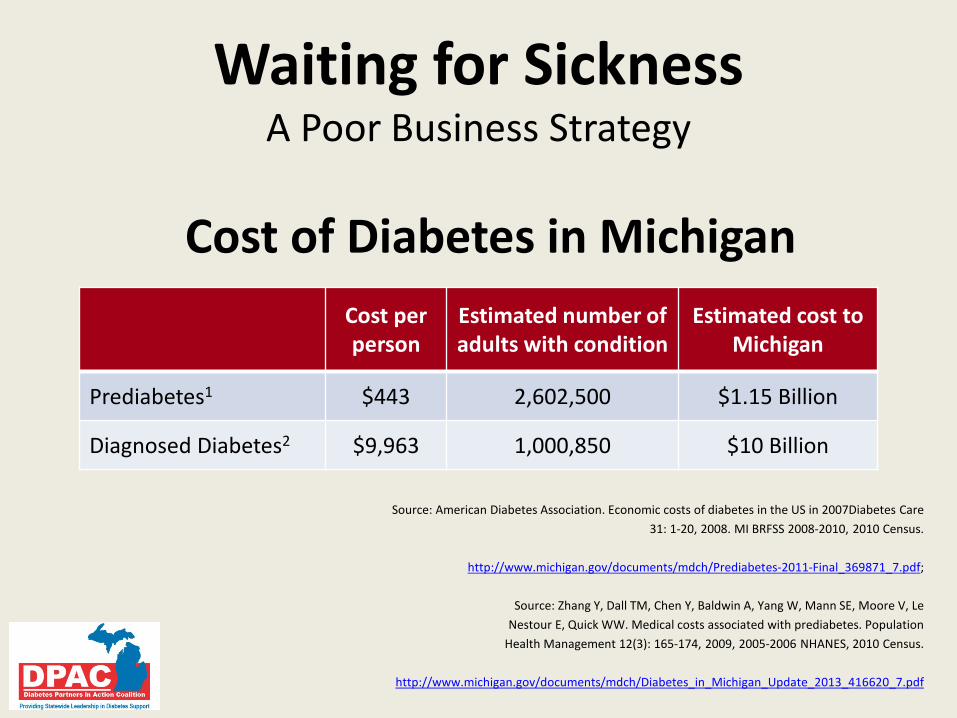
Waiting for Sickness A Poor Business Strategy
Cost of Diabetes in Michigan
Source: American Diabetes Association. Economic costs of diabetes in the US in 2007Diabetes Care 31: 1-20, 2008. MI BRFSS 2008-2010, 2010 Census.
http://www.michigan.gov/documents/mdch/Prediabetes-2011-Final_369871_7.pdf;
Source: Zhang Y, Dall TM, Chen Y, Baldwin A, Yang W, Mann SE, Moore V, Le
Nestour E, Quick WW. Medical costs associated with prediabetes. Population Health Management 12(3): 165-174, 2009, 2005-2006 NHANES, 2010 Census.
http://www.michigan.gov/documents/mdch/Diabetes_in_Michigan_Update_2013_416620_7.pdf
Cost per person
Estimated number of adults with condition
Estimated cost to Michigan
Prediabetes1 $443 2,602,500 $1.15 Billion
Diagnosed Diabetes2 $9,963 1,000,850 $10 Billion
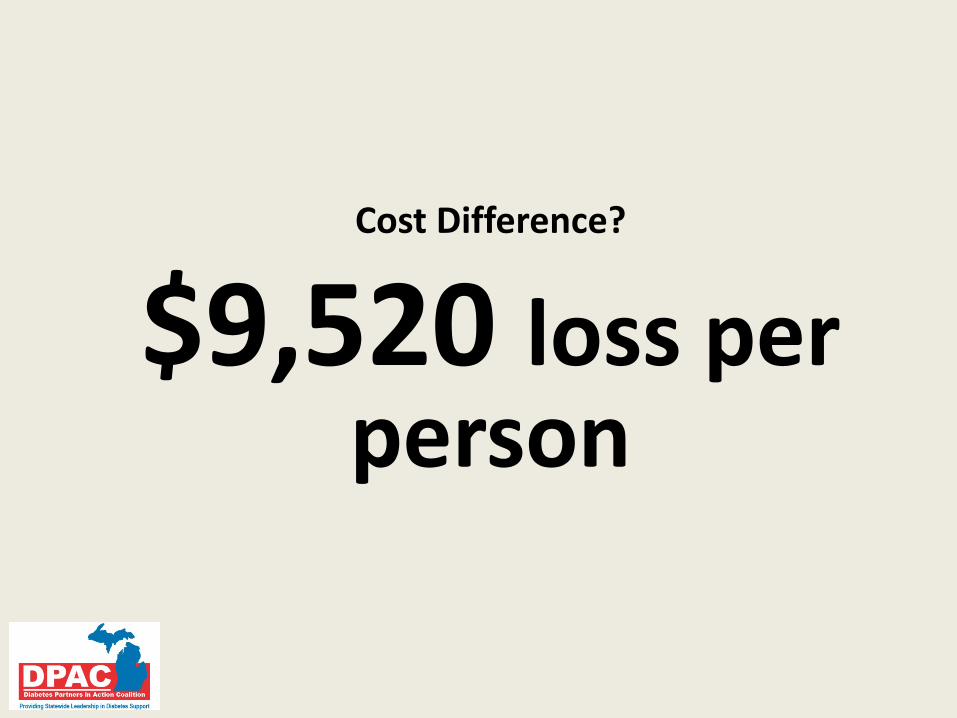
Cost Difference?
$9,520 loss per person

Some Risk Factors for Prediabetes
Lifestyle
Obesity
High Cholesterol
High Blood Pressure
Impaired Blood Glucose Regulation
Sedentary Lifestyle

The Economics of Health Status A Business Case for Wellness
Investing in health management programs = spending less on healthcare costs on one side of the economic equation while increased health related productivity will be realized on the other side
Medical / Hospital Drug Absence Presenteeism Workers’ Comp Disability
Effectiveness on the job • Safety • Production/Profit Retention Morale Recruitment
Source: Zero Trends, Health as a Serious Economic Strategy, Edington D, Health Management Research Center, University of Michigan, 2009

Creating a Culture of Prevention Integrating Health Status
• Senior leadership – CEO, President, Owner, Senior Management
• Align the workplace with the vision. – Respect the culture, values and philosophy of your organization – Engage operational leaders – Integrate policies into company culture and practices
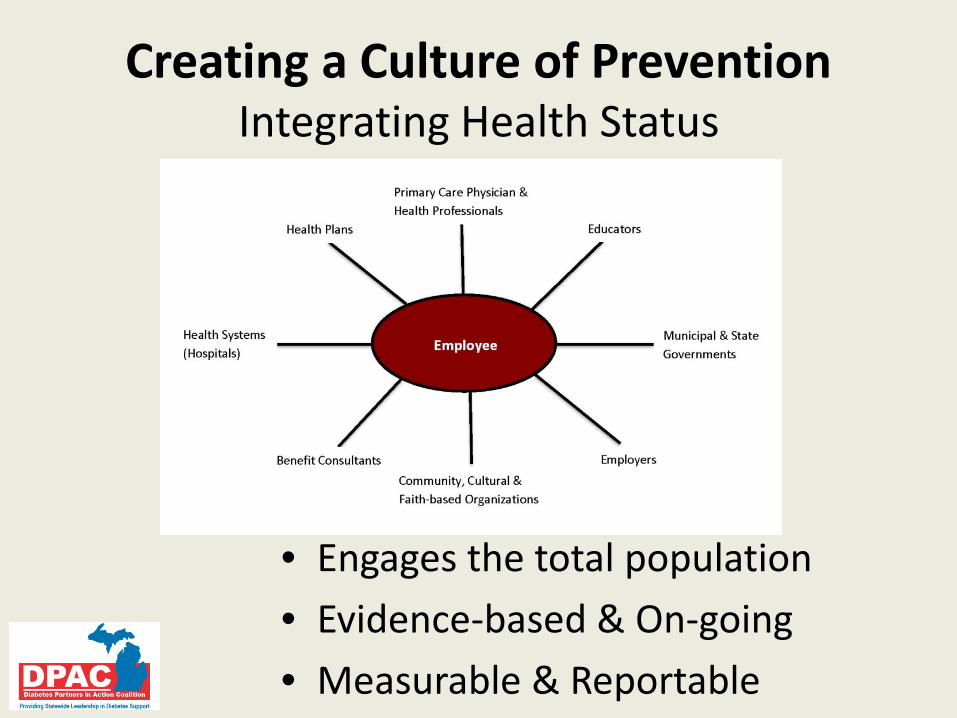
Creating a Culture of Prevention Integrating Health Status
• Engages the total population • Evidence-based & On-going • Measurable & Reportable
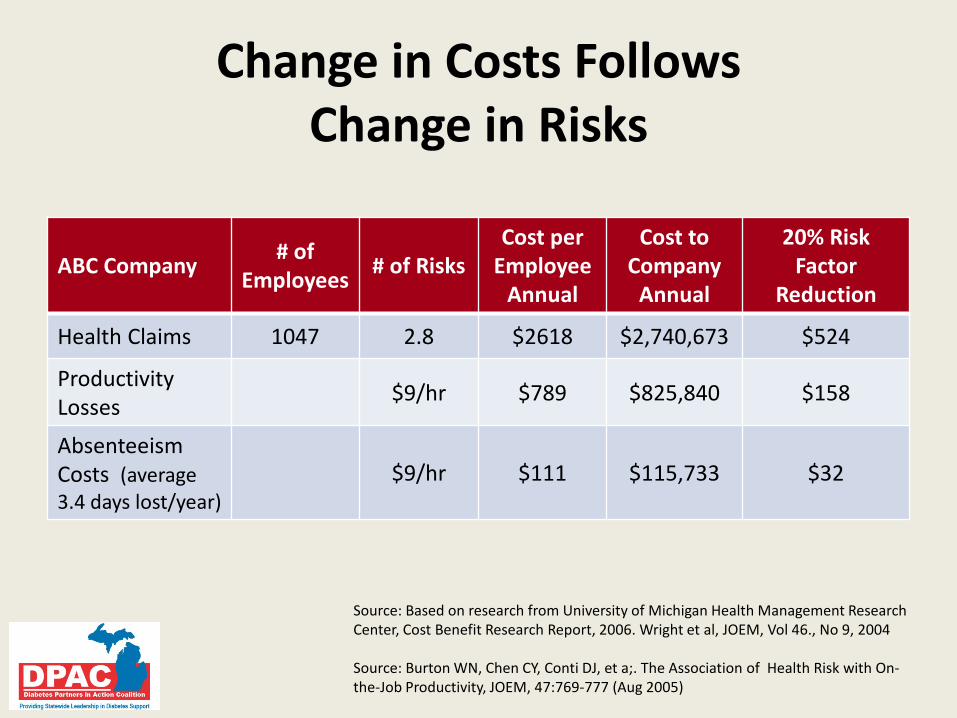
Change in Costs Follows Change in Risks
ABC Company # of Employees # of Risks
Cost per Employee
Annual
Cost to Company
Annual
20% Risk Factor
Reduction
Health Claims 1047 2.8 $2618 $2,740,673 $524
Productivity Losses $9/hr $789 $825,840 $158
Absenteeism Costs (average 3.4 days lost/year)
$9/hr $111 $115,733 $32
Source: Based on research from University of Michigan Health Management Research Center, Cost Benefit Research Report, 2006. Wright et al, JOEM, Vol 46., No 9, 2004 Source: Burton WN, Chen CY, Conti DJ, et a;. The Association of Health Risk with On- the-Job Productivity, JOEM, 47:769-777 (Aug 2005)

A Culture of Prevention A Responsible Business Strategy
Cost of Diabetes in Michigan
Cost Aversion: About 24.8 Billion
Source: American Diabetes Association. Economic costs of diabetes in the US in 2007Diabetes Care 31: 1-20, 2008. MI BRFSS 2008-2010, 2010 Census.
http://www.michigan.gov/documents/mdch/Prediabetes-2011-Final_369871_7.pdf;
Source: Zhang Y, Dall TM, Chen Y, Baldwin A, Yang W, Mann SE, Moore V, Le
Nestour E, Quick WW. Medical costs associated with prediabetes. Population Health Management 12(3): 165-174, 2009, 2005-2006 NHANES, 2010 Census.
http://www.michigan.gov/documents/mdch/Diabetes_in_Michigan_Update_2013_416620_7.pdf
Cost per person
Estimated number of adults with condition
Estimated cost to Michigan
Prediabetes1 $443 2,602,500 $1.15 Billion
Diagnosed Diabetes2 $9,963 1,000,850 $10 Billion
Cost difference $9,520
A Culture of Prevention Thank you

Lessons from the Field—Michigan DPRP
Art Franke, PhD National Kidney Foundation of
Michigan

Learner Objectives
• Understand how a diabetes prevention program is operationalized in the community
• Understand the lifestyle changes promoted in the program
• Give examples of success of participants in the diabetes prevention programs in Michigan

The Role of the DPP Recognized Centers
• Partners provide support and services for DPP
• Identify eligible participants
• Proactive outreach for community engagement
• Communications and messaging about prediabetes
• Trained lifestyle coaches
• Measure outcomes to document success

• Delivered in community settings in groups of 10-15 people
• Personal lifestyle goals are set by each participant
• Participant benefits: • Instruction on healthy eating, physical activity, and
lifestyle changes • Group and individual support • Educational materials • Personalized feedback • Motivation for physical activity • Useful information • A healthier you!
Diabetes Prevention: Proven, Possible and Powerful!

Examples of DPP Community Engagement
• Church in Inkster with Referrals from FQHC
• Worksite in Ann Arbor
• Chelsea Wellness Center • Priority Health in Grand Rapids
• Detroit Medical Center working with Emergency Dept.
• St. Mary’s Hospital in Livonia
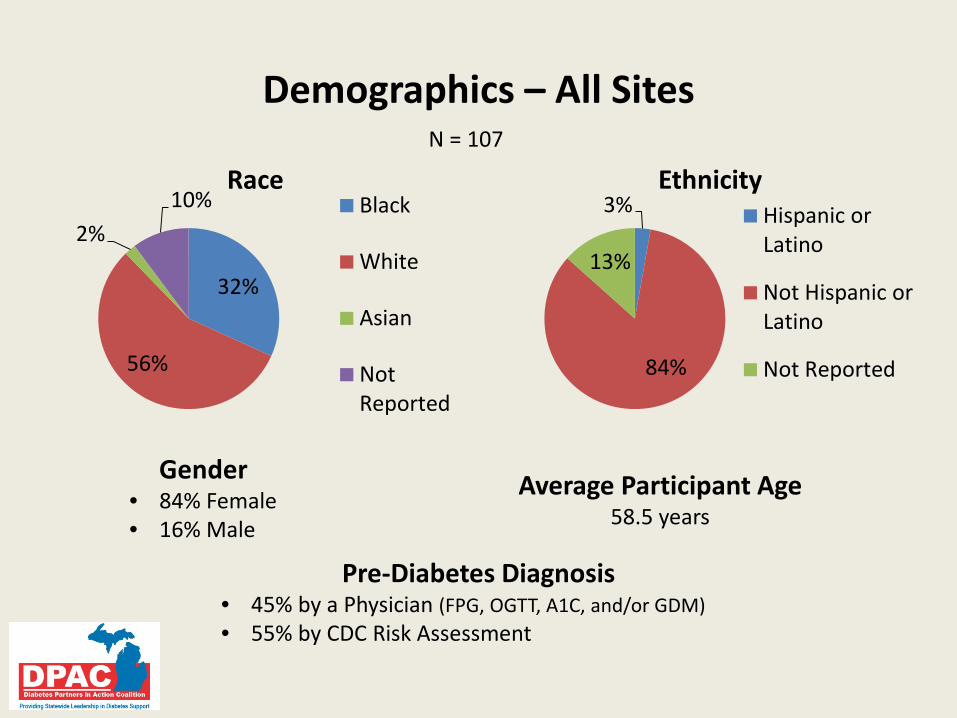
Demographics – All Sites
32%
56%
2% 10%
Race Black
White
Asian
NotReported
3%
84%
13%
Ethnicity Hispanic orLatino
Not Hispanic orLatino
Not Reported
Gender • 84% Female • 16% Male
Pre-Diabetes Diagnosis • 45% by a Physician (FPG, OGTT, A1C, and/or GDM) • 55% by CDC Risk Assessment
Average Participant Age 58.5 years
N = 107

Physical Activity Completed Sites
• Participants who completed the core sessions averaged 177.5 minutes per week
Workshop Site Number of Participants
Average Physical Activity* (minutes)
Inkster 15 108.4 NKFM 13 202.6 Chelsea 19 221.4 Achieved 47 177.5
*Average Physical Activity reported per session
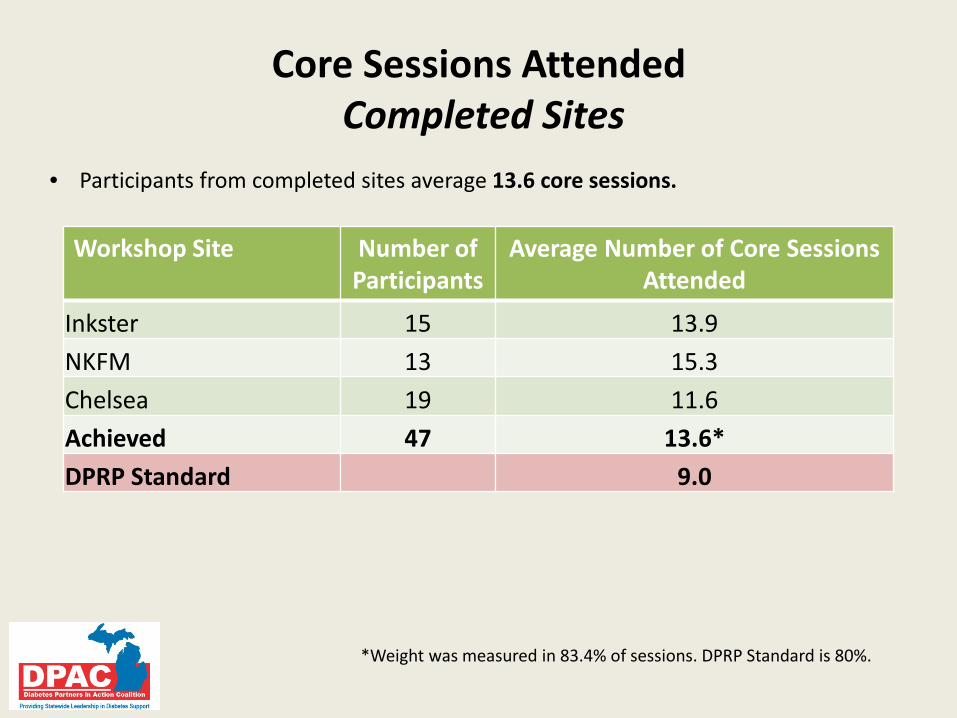
Core Sessions Attended Completed Sites
Workshop Site Number of Participants
Average Number of Core Sessions Attended
Inkster 15 13.9 NKFM 13 15.3 Chelsea 19 11.6 Achieved 47 13.6* DPRP Standard 9.0
*Weight was measured in 83.4% of sessions. DPRP Standard is 80%.
• Participants from completed sites average 13.6 core sessions.

Weight Loss at End of Core Phase Completed Sites
Workshop Site Number of Participants
Total Weight Loss at End of
Core Phase (lbs.)
Average Per-Participant Weight Loss at End of
Core (%) Inkster 15 83.0 -3.0% NKFM 13 133.8 -5.4% Chelsea 19 186.0 -5.0% Achieved 47 402.8 -4.5% DPRP Standard -5.0%
• Participants who have completed the core phase have averaged 4.5% weight loss

Weight Loss Goals Achieved Completed Core Sites
Workshop Site Number of Participants
Met 5% Weight Loss Goal (%)
Met 7% Weight Loss Goal (%)
Inkster 15 26.7% 6.7% NKFM 13 61.5% 30.8% Chelsea 19 52.6% 36.8% Achieved 47 46.9% 24.8%
• 46.9% of participants who met the 5% weight loss goal • 24.8% of participants who met the 7% weight loss goal

• Greatest benefits are associated with those modifications that include weight loss, dietary changes, and exercise
• Evidence-based approach to prevent or delay onset of type 2 Diabetes
• Moderate weight loss (5-7% of body weight) • Modest physical activity (150 minutes per week)
Bottom Line – It Works!
“I feel better and find it’s much easier to run around with my young grandchildren. It also feels good to fit into smaller clothes.”
“I have developed self confidence in my abilities to lose weight and get regular activity.”


![prediabetes - Diabetes Pro - American Diabetes Association · PDF fileDefine prediabetes ... [Epub ahead of print] ... Family history of type 2 diabetes in first- or second-degree](https://img.pdfslide.us/doc/110x75/5aa1bdb67f8b9a84398c1ca6/prediabetes-diabetes-pro-american-diabetes-association-prediabetes-epub.jpg)