Embed Size (px)
Citation preview

Overview of School Finance in Iowa

Click here to continue
1 LSA: August 2013
School Aid Presentation Brief History/Principles Allowable Growth Rate/State Cost Per Pupil Foundation Level School Aid Revenue School Aid Formula Funding Components Discretionary Programs Miscellaneous Valuations per Pupil and Property Tax Implications Addendum

Click here to continue
2 LSA: August 2013
Brief History and Goals of School Finance in Iowa

Click here to continue
3 LSA: August 2013
Brief History of School Finance in Iowa
In 1950 – 4,652 school districts Reorganization Plan adopted in 1950s
1965 – 1,098 school districts 1975 – 450 school districts 1985 – 437 school districts 1995 – 384 school districts 2005 – 367 school districts Currently – 346 school districts

Click here to continue
4 LSA: August 2013
Brief History of School Finance in Iowa
Until the mid 1960s – school district funding was all property tax
In 1971, school foundation program adopted (enrollment-based) – substantial increase in State aid to school districts
In 1989 – enactment of Iowa Code chapter 257 with implementation beginning in FY 1992

Click here to continue
5 LSA: August 2013
Brief History of School Finance in Iowa (continued)
In 1992, allowable growth adopted In 1995, formula modified to set allowable growth two
years in advance In 1996, increased Regular Program Foundation
Level from 83.0% to 87.5% beginning in FY 1997 (increased the portion of State aid paid from the State General Fund and provided property tax relief)
In 1999, Special Education Foundation Level increased from 79.0% to 87.5% beginning in FY 2000

Click here to continue
6 LSA: August 2013
Brief History of School Finance in Iowa (continued)
In 2001, eliminated the 100.0% budget guarantee, replaced it with phase-out or alternate budget adjustment to begin in FY 2004, and made the on-time funding provision permanent
In 2006, created additional property tax adjustment aid to “buy down” additional levy rates for qualifying school districts that have the highest tax rates

Click here to continue
7 LSA: August 2013
Brief History of School Finance in Iowa (continued)
2008 Legislative Session: State sales/use tax for school infrastructure –
excess funds after school infrastructure allocations will be used for property tax relief through school aid formula
State Categorical Supplements – Additional categorical program funding rolled into the school aid formula beginning in FY 2010

Click here to continue
8 LSA: August 2013
Brief History of School Finance in Iowa (continued)
2009 Legislative Session: Across-the-board reduction of 1.5% for FY 2009 Maintained 4.0% allowable growth rate for FY 2010 Established 2.0% allowable growth rate for FY 2011 American Recovery and Reinvestment Act (ARRA)
Education Fiscal Stabilization: $40.0 million in FY 2009 $202.5 million in FY 2010

Click here to continue
9 LSA: August 2013
Brief History of School Finance in Iowa (continued)
2010 Legislative Session: Prior to Session, across-the-board reduction of 10.0%
for FY 2010 Maintained 2.0% allowable growth rates for FY 2011 Used one-time funds in place of General Fund for
State aid totaling $53.0 million Capped appropriation for State aid – $156.1 million
short of fully funding Postponed setting FY 2012 allowable growth rates

Click here to continue
10 LSA: August 2013
Brief History of School Finance in Iowa (continued)
2011 Legislative Session: Legislature did not establish allowable growth rates for
FY 2012 (defaulted to 0.0%) Established 2.0% allowable growth rates for FY 2013 Added an additional State aid reduction to area
education agencies (AEA) reduction of $20.0 million for FY 2012
Reduced the preschool formula weighting from 0.6 to 0.5

Click here to continue
11 LSA: August 2013
Brief History of School Finance in Iowa (continued)
2012 Legislative Session: No allowable growth rate established for FY 2014 Reduced State aid to AEAs by $20.0 million in addition
to the $7.5 million annual statutory reduction (maintained the reduction made in FY 2011)
Dropout prevention program changes – modified allowable growth restriction and allowable expenditure increases

Click here to continue
12 LSA: August 2013
Brief History of School Finance in Iowa (continued)
2013 Legislative Session: FY 2014 allowable growth rate = 2.0% One-time State funding in FY 2014 of $57.1 million Reduced State aid to AEAs by $15.0 million in addition to
the $7.5 million annual statutory reduction for FY 2014 FY 2015 allowable growth rate = 4.0% Education reform enacted Property tax reform enacted
Click here to continue
13 LSA: August 2013
Goals and Principles
Equity in expenditure Property tax relief Equalize taxation Uniform State aid allocation formula Predictable Simple Pupil Driven

Click here to continue
14 LSA: August 2013
Goals and Principles (continued)
Provide for local discretion/incentives Establish maximum spending control One funding formula school districts and AEAs Provide adequate funding Promote high achievement Modify the impact of community and family
background on achievement

Click here to continue
15 LSA: August 2013
School Aid Allowable Growth and State Cost Per Pupil
Click here to continue
16 LSA: August 2013
Allowable Growth Rate
Supplemental State aid (in FY 2015) Recommended by the Governor Established by the General Assembly Policy decision impacting State school
aid appropriation

Click here to continue
17 LSA: August 2013
Allowable Growth Amount Allowable Growth Rate x State Cost Per Pupil = Growth Per Pupil
For example:
2013-2014
2.0% Allowable Growth Rate X
FY 2013 State Cost Per Pupil ($6,001)
= $120 Per Pupil

Click here to continue
18 LSA: August 2013
State Cost Per Pupil (SCPP)
FY 2014: $6,001 + $120 = $6,121 FY 2013 SCPP + Allowable Growth

Click here to continue
19 LSA: August 2013
State Cost Per Pupil FY 2014 SCPP = $6,121
Used to determine allowable growth per pupil for the next year
Used to determine minimum district cost per pupil Note: same methodology for all 10 cost per pupil
amounts in the school aid formula

Click here to continue
20 LSA: August 2013
District Cost Per Pupil – FY 2013 $6,296 – Highest (7 Districts) $6,121 – Lowest (168 Districts) $175 – Range (2.8% difference)
District cost per pupil increases each year by a per pupil amount (per pupil allowable growth)
Minimum district cost per pupil = State cost per pupil
Note that this is not the case for the State categorical supplement per pupil amounts

Click here to continue
21 LSA: August 2013
Allowable Growth - History
$3,406
$6,121
$6,366
0
1,000
2,000
3,000
4,000
5,000
6,000
7,000
0.0%
0.5%
1.0%
1.5%
2.0%
2.5%
3.0%
3.5%
4.0%
4.5%
1994 1995 1996 1997 1998 1999 2000 2001 2002 2003 2004 2005 2006 2007 2008 2009 2010 2011 2012 2013 2014 2015
$
Fiscal Year
Allowable Growth Rate and State Cost Per Pupil Amounts FY 1994 to FY 2015
Allowable Growth Rate SCPP

Click here to continue
22 LSA: August 2013
School Aid Formula Foundation Levels

Click here to continue
23 LSA: August 2013
Foundation Formula
Foundation Level
FY 2013: 87.5% of SCPP ($6,121) = $5,356 Per Pupil
State Aid
Uniform Levy $5.40 Per $1000 Valuation
Additional Levy

Click here to continue
24 LSA: August 2013
Foundation Formula Property Rich
DistrictProperty Poor
District
Uniform Levy$5.40
Additional Levy
State Aid
Uniform Levy$5.40
Additional Levy
State Aid
Foundation Level
Foundation Level
Uniform Levy$5.40
Additional Levy
State Aid
Uniform Levy$5.40
Additional Levy
State Aid
Property RichDistrict
Property Poor District
Uniform Levy$5.40
Additional Levy
State Aid
Uniform Levy$5.40
Additional Levy
State Aid
Foundation Level
Foundation Level
Uniform Levy$5.40
Additional Levy
State Aid
Uniform Levy$5.40
Additional Levy
State Aid
More on this later in the presentation.

Click here to continue
25 LSA: August 2013
Foundation Formula
87.5%Foundation 79.0%
Level Foundation Level
Additional Levy
State AidState Aid
Additional Levy
Special Education Instruction
Additional Levy
Uniform Levy
Regular Program
State Aid
AEA Special Education Support

Click here to continue
26 LSA: August 2013
FY 2014 School Aid Foundation Levels
87.5%Foundation 79.0%
Level Foundation Level
$5,356 $5,356 $212
Uniform Levy
$57
State AidState Aid State Aid
$6,121 $6,121 $269Additional Levy Additional Levy
$765 $765 Additional Levy
Special Education AEA Special Regular Program Instruction Education Support
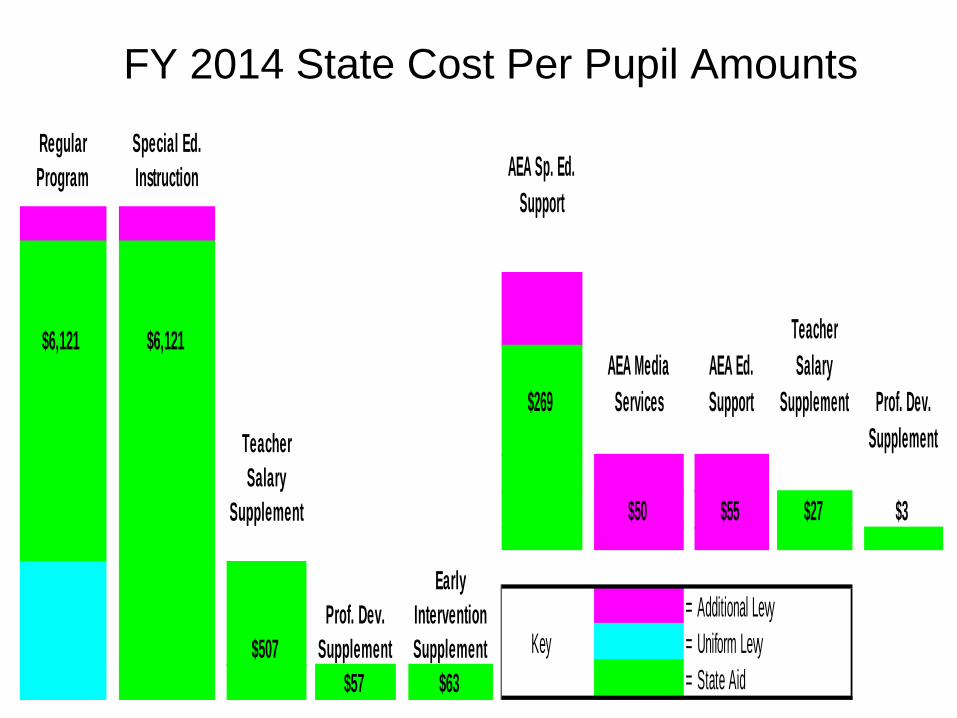
FY 2014 State Cost Per Pupil Amounts
LSA: August 2013
Regular Program
Special Ed. Instruction
$6,121 $6,121
Teacher Salary
Supplement
$507Prof. Dev.
Supplement
Early Intervention Supplement
$57 $63
AEA Sp. Ed. Support
$269
$50 $55 $27 $3
= Additional Levy= Uniform Levy= State Aid
AEA Media Services
AEA Ed. Support
Teacher Salary
Supplement Prof. Dev. Supplement
Key

Click here to continue
28 LSA: August 2013
Property Tax Replacement Payment New beginning in FY 2014 Property tax relief for increase in
cost per pupil due to allowable growth rate
Current law based on FY 2014 and FY 2015
Indirect impact on foundation level for future fiscal years
Reduces additional levy portion for all districts
Per pupil amount = $15 in FY 2014 and $46 in FY 2015 and beyond
87.5%Foundation
LevelState Aid/
Additional Levy
Property Tax Replacement
Uniform Levy

Click here to continue
29 LSA: August 2013
School District Revenue Sources

Click here to continue
30 LSA: August 2013
School District Revenues
Where do the revenues come from? General Fund
Formula – Required – Discretionary
Miscellaneous Income – Federal categoricals
Non General Fund/Other

Click here to continue
31 LSA: August 2013
Revenue - Foundation Formula
Where do the revenues come from? Required Local Levy – Uniform Levy State Aid Additional Levy Property Tax Equity Relief (PTER)
Fund

Click here to continue
32 LSA: August 2013
Revenue - Foundation Formula (continued)
FY 2014 Uniform Levy = $759.4 million Additional Levy (second effort) = $578.6 million State Aid = $2,725.6 million (includes $8.7 million
from Property Tax Equity Relief (PTER) Fund)
Click here to continue
33 LSA: August 2013
State Aid Increase funding for districts
“Fair” method to distribute State aid
Provide property tax relief
Equalize effort

Click here to continue
34 LSA: August 2013
Additional Levy FY 2014 Additional Levy Total = $578.6 million Components of Additional Levy: 12.5% of the Regular Program Foundation Level ($372.6 million) 12.5% of the Special Education Foundation Level ($48.5 million) 21.0% of the AEA Foundation Level ($29.5 million) AEA Media and Education Services ($53.7 million) DCPP above SCPP ($14.3 million) District and AEA Budget Adjustment ($13.4 million) Dropout Prevention Program ($97.2 million) Property Tax Adjustment Aid ($ -32.7 million) NEW: Property Tax Replacement Payment ($ -8.3 million) Property Tax Adjustment Aid – 1990 provision ($ -9.3 million) Miscellaneous ($ -0.3 million) Total may not add due to rounding.

Click here to continue
35 LSA: August 2013
$372.6
$48.5-$32.7 -$8.3
$29.5 $25.5 $28.2 $14.3 $11.2 $2.2
$97.2
-$9.6 -$0.3
-$100.0
$0.0
$100.0
$200.0
$300.0
$400.0
$500.0
$600.0
Regula
r F
oundatio
n -
12.5
%
Sp
ec. E
d. F
ou
ndation -
12.5
%
Pro
p. T
ax A
dj. A
id
Pro
p. T
ax R
epla
cem
ent P
aym
en
t
AE
A F
oundation
- 2
1.0
%
AE
A M
edia
Serv
ices
AE
A E
d.
Serv
ices
DC
PP
>S
CP
P
Bu
dget G
uara
nte
e/A
dju
stm
en
t
AE
A E
d.
Sup. B
udgt. G
uar.
Dro
pout P
revention
Pro
gra
m
Pro
pert
y T
ax A
dj. A
id (
1992)
Mis
c.
School Aid Formula FY 2014 Additional Levy ComponentsDollars in Millions
Total Additional Levy = $578.6 Million

Click here to continue
36 LSA: August 2013
Additional Levy Component Average Median Max* Min Range
Regular Foundation - 12.5% 372.6$ 2.6453$ 2.4213$ 5.0301$ 0.6907$ 4.3394$ 346 100.0%Spec. Ed. Foundation - 12.5% 48.5 0.3440 0.2811 0.7588 0.0462 0.7126 346 100.0%
Prop. Tax Adj. Aid -32.7 -0.2318 0.0000 -2.1850 0.0000 -2.1850 78 22.5%Prop. Tax Replacement Payment -8.3 -0.0586 -0.0530 -0.1105 -0.0149 -0.0957 346 100.0%
AEA Foundation - 21.0% 29.5 0.2093 0.1917 0.4087 0.0561 0.3526 346 100.0%AEA Media Services 25.5 0.1814 0.1629 0.3422 0.0453 0.2969 346 100.0%
AEA Ed. Services 28.2 0.2005 0.1803 0.3845 0.0509 0.3336 346 100.0%Dist. Cost Per Pupil > State Cost Per Pupil ** 14.3 0.1017 0.0386 0.7327 0.0000 0.7327 269 77.7%
Budget Guarantee/Adjustment 11.2 0.0793 0.0000 2.5241 0.0000 2.5241 133 38.4%AEA Ed. Support Budget Guarantee 2.2 0.0157 0.0093 0.2628 0.0000 0.2628 202 58.4%
Dropout Prevention Program 97.2 0.6901 0.4965 1.7910 0.0000 1.7910 298 86.1%Property Tax Adj. Aid (1992) -9.6 -0.0680 -0.0585 -1.0389 0.0000 -1.0389 294 85.0%
Misc. -0.3 -0.0018 -0.0007 0.3135 -0.1346 0.4481 346 100.0%
Additional Levy - State Level 578.6$ 4.1070$ 3.8758$ 7.3397$ 0.9999$ 6.3398$ 346 100.0%
Notes:*Reductions in tax rates are displayed as negative values and displayed in the maximum column as negative values.**There w ere 178 school districts w ith a district cost per pupil (DCPP) that exceeded the State cost per pupil for a total of $12.9 million. **There w ere 228 school districts w ith an AEA cost per pupil that exceeded the State AEA cost per pupil for a total of $1.4 million.
FY 2014 School Aid Formula Additional Levy Component Statistics
Additional Levy Portion Amount
(in Millions)
Property Tax Rate Statistics by Additional Levy Component
# of Districts
Impacted
% of Districts
Impacted

Click here to continue
37 LSA: August 2013
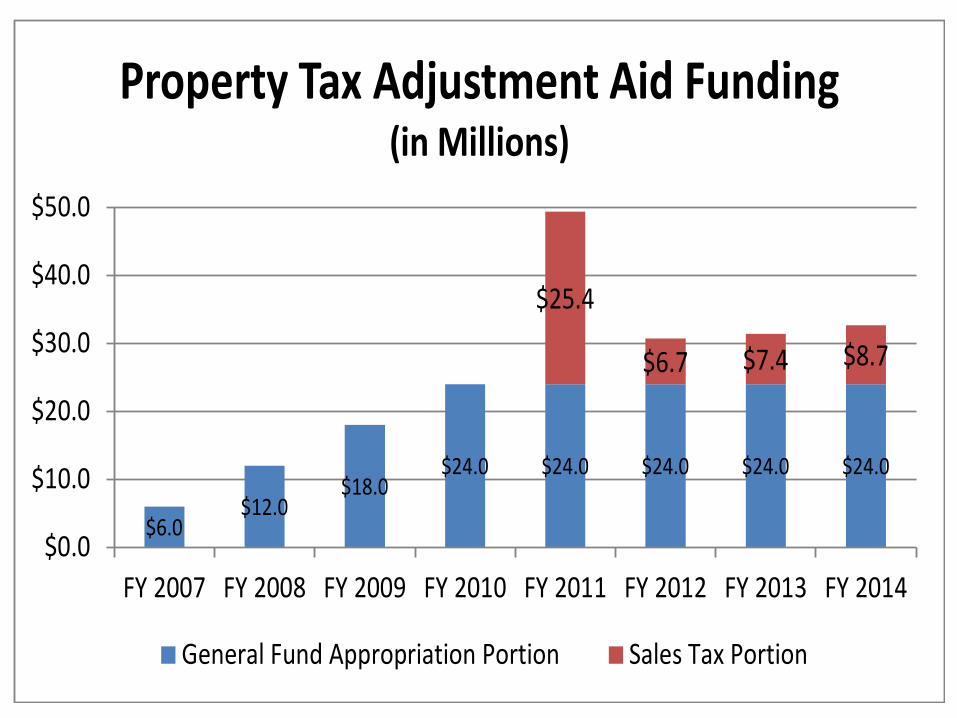
Additional Levy – Property Tax Adjustment Aid
Provides targeted property tax relief to districts with the highest adjusted additional levy rates
Funds include a General Fund appropriation included in the school aid formula and excess sales/use tax for school infrastructure deposited in the Property Tax Equity and Relief (PTER) Fund
If funding is sufficient, the foundation level percentage will be increased (an additional $21.3 million required in FY 2014)
Click here to continue
38 LSA: August 2013
$6.0$12.0
$18.0$24.0 $24.0 $24.0 $24.0 $24.0
$25.4
$6.7 $7.4 $8.7
$0.0
$10.0
$20.0
$30.0
$40.0
$50.0
FY 2007 FY 2008 FY 2009 FY 2010 FY 2011 FY 2012 FY 2013 FY 2014
Property Tax Adjustment Aid Funding(in Millions)
General Fund Appropriation Portion Sales Tax Portion

Click here to continue
39 LSA: August 2013
FY 2014 PTER/Property Tax. Adj. Aid
$0.0
$1.0
$2.0
$3.0
$4.0
$5.0
$6.0
Levy
Rat
e ($
1,00
0 of
Tax
able
Val
uatio
n)
Adjusted Additional Levy Rate After $24.0 Million After PTER
FY 2014 Adjusted Additional Tax Levy Rate from high to low
$24.0 million appropriation buys rates down to $3.58
PTER Funds of $8.7 million buys rates down lower to $3.3416
Click here to continue
40 LSA: August 2013
School Aid Foundation Formula Funding Components

Click here to continue
41 LSA: August 2013
Combined District Cost Regular Program Cost + Budget Guarantee (Budget Adjustment) + Weighted Enrollment Funding + Dropout Prevention Program Funding + AEA Program Funding + State Categorical Supplements Combined District Cost
Click here to continue
42 LSA: August 2013
Program Area State
State Aid % of Total
Local Taxes
Local Taxes % of Total Total
Program Percentage
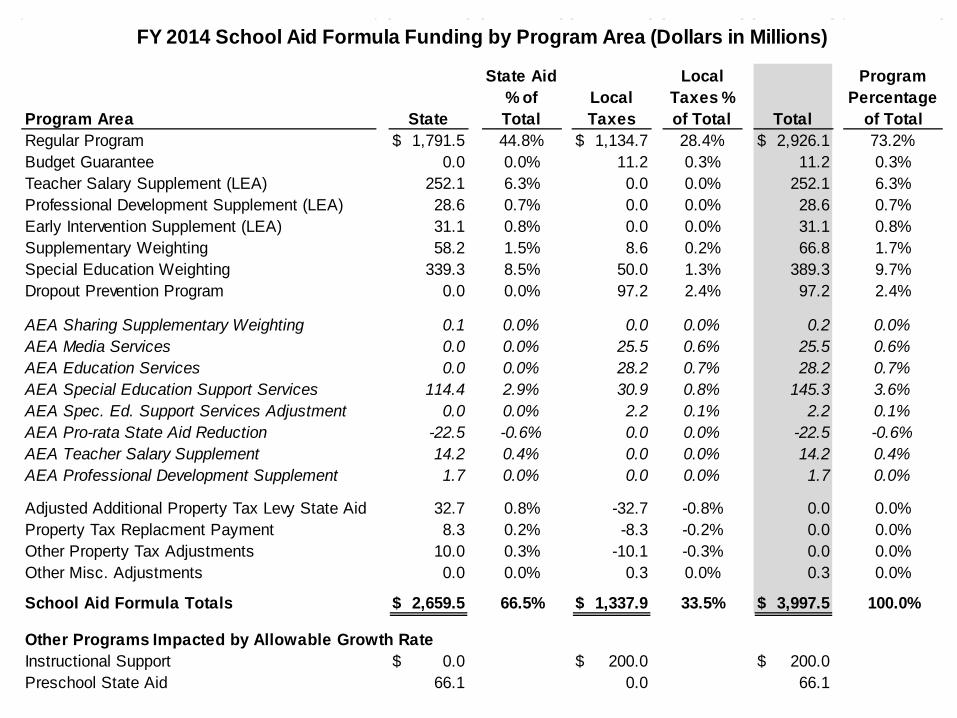
of TotalRegular Program 1,791.5$ 44.8% 1,134.7$ 28.4% 2,926.1$ 73.2%Budget Guarantee 0.0 0.0% 11.2 0.3% 11.2 0.3%Teacher Salary Supplement (LEA) 252.1 6.3% 0.0 0.0% 252.1 6.3%Professional Development Supplement (LEA) 28.6 0.7% 0.0 0.0% 28.6 0.7%Early Intervention Supplement (LEA) 31.1 0.8% 0.0 0.0% 31.1 0.8%Supplementary Weighting 58.2 1.5% 8.6 0.2% 66.8 1.7%Special Education Weighting 339.3 8.5% 50.0 1.3% 389.3 9.7%Dropout Prevention Program 0.0 0.0% 97.2 2.4% 97.2 2.4%
AEA Sharing Supplementary Weighting 0.1 0.0% 0.0 0.0% 0.2 0.0%AEA Media Services 0.0 0.0% 25.5 0.6% 25.5 0.6%AEA Education Services 0.0 0.0% 28.2 0.7% 28.2 0.7%AEA Special Education Support Services 114.4 2.9% 30.9 0.8% 145.3 3.6%AEA Spec. Ed. Support Services Adjustment 0.0 0.0% 2.2 0.1% 2.2 0.1%AEA Pro-rata State Aid Reduction -22.5 -0.6% 0.0 0.0% -22.5 -0.6%AEA Teacher Salary Supplement 14.2 0.4% 0.0 0.0% 14.2 0.4%AEA Professional Development Supplement 1.7 0.0% 0.0 0.0% 1.7 0.0%
Adjusted Additional Property Tax Levy State Aid 32.7 0.8% -32.7 -0.8% 0.0 0.0%Property Tax Replacment Payment 8.3 0.2% -8.3 -0.2% 0.0 0.0%Other Property Tax Adjustments 10.0 0.3% -10.1 -0.3% 0.0 0.0%Other Misc. Adjustments 0.0 0.0% 0.3 0.0% 0.3 0.0%
School Aid Formula Totals 2,659.5$ 66.5% 1,337.9$ 33.5% 3,997.5$ 100.0%
Other Programs Impacted by Allowable Growth RateInstructional Support 0.0$ 200.0$ 200.0$ Preschool State Aid 66.1 0.0 66.1
FY 2014 School Aid Formula Funding by Program Area (Dollars in Millions)

Click here to continue
43 LSA: August 2013
Basic Funding – Enrollment Pupil Count Pupils are counted for funding purposes by
where they reside – not where they attend Resident pupils counted as 1.0 Shared-time (nonpublic counted on a FTE
basis) Count taken as of October 1 October 2012 count used to determine
2013-14 funding (FY 2014)

Click here to continue
44 LSA: August 2013
Basic Funding – Enrollment (continued) Pupil Count – October 2012 (FY 2014 Funding) Basic enrollment (476,245)
Resident (442,451) Includes Dual Enrolled Home School Assistance Program (HSAP) Students
Open Enroll Out (27,651) Tuition Out (5,636) Shared-time (203) Competent Private Instruction (CPI) Students (304)

Click here to continue
45 LSA: August 2013
Regular Program District Cost District Cost Per Pupil X (Pupil Count – Basic Enrollment) Regular Program District Cost (Basic “pool” of money for the district)
Regular Program Funding accounted for 73.2% of the Combined District Cost in FY 2014

Click here to continue
46 LSA: August 2013
Weighted Enrollment Funding Pupil Driven System Weightings “Add” Pupils
Weightings x District Cost Per Pupil Adds Funding
Accounted for approximately 11.4% of the Combined District Cost in FY 2014
Special Education Weightings = 9.7%
Other Weightings = 1.7%

Click here to continue
47 LSA: August 2013
Weighted Enrollment Funding
*Total of arts and sciences and career and tech community college courses. **Includes State aid for property tax replacement payments
Weighting Category Weight State Aid** Property Tax Total
Special Ed. 1 24,739.20 132,874,243$ 19,168,112$ 152,042,355$ 346 Special Ed. 2 18,101.65 97,223,962 14,005,493 111,229,455 345 Special Ed. 3 20,510.27 110,160,660 15,906,362 126,067,022 341
Total Special Ed. 63,351.12 340,258,865 49,079,967 389,338,832 346
Shared Students 48.00 257,803 38,469 296,272 69 Shared Teachers 308.07 1,654,617 242,725 1,897,342 69
Community College (CC) Courses* 2,875.32 15,443,328 2,224,068 17,667,396 345 CC Arts and Sciences 1,197.91 6,433,996 928,788 7,362,785 337
CC Career and Tech 1,677.24 9,008,435 1,295,151 10,303,585 333 Whole Grade Sharing 289.30 1,553,830 224,363 1,778,194 10
Regional Academy 14.00 75,194 11,452 86,646 1 ICN 2.81 15,076 2,190 17,267 74
Operational Functions 1,421.83 7,636,649 1,113,923 8,750,572 129 Supplementary Shared Wght. Total 4,959.57 26,637,850 3,857,393 30,495,243 346
At-Risk 2,340.680 12,571,814 1,812,799 14,384,613 346 ESL 3,391.96 18,218,217 2,638,441 20,856,658 203
Reorganization 177.70 954,427 142,749 1,097,176 11
Total Supplementary Weight 10,869.91 58,382,308 8,451,382 66,833,691 346
AEA Sharing 539.84 114,446$ 36,212$ 150,659$ 1
Total Weighting 74,760.87 398,755,619$ 57,567,562$ 456,323,181$ 346
Estimated FY 2014 School Finance Amounts # of Districts

Click here to continue
48 LSA: August 2013
41,252.1
70,153.8 64,764.5
63,351.1
0
10,000
20,000
30,000
40,000
50,000
60,000
70,000
80,000
1991
1992
1993
1994
1995
1996
1997
1998
1999
2000
2001
2002
2003
2004
2005
2006
2007
2008
2009
2010
2011
2012
2013
2014
Fiscal Year
Special Education WeightingsFY 1991 Through FY 2014
Special Ed. I Special Ed. II Special Ed. III Total Special Ed.

Click here to continue
49 LSA: August 2013
654
3,089 3,187
2,8743,013
3,1973,392
0
500
1,000
1,500
2,000
2,500
3,000
3,500
4,000
1992
1993
1994
1995
1996
1997
1998
1999
2000
2001
2002
2003
2004
2005
2006
2007
2008
2009
2010
2011
2012
2013
2014
Fiscal Year
Limited English Proficient WeightingsFY 1992 Through FY 2014
Eligibility increased from 3 to 4 years
Weighting increased from 0.19 to 0.22

Click here to continue
50 LSA: August 2013
5,563
3,446
8,998
7,691
7,478
0
1,000
2,000
3,000
4,000
5,000
6,000
7,000
8,000
9,000
10,000
1992
1993
1994
1995
1996
1997
1998
1999
2000
2001
2002
2003
2004
2005
2006
2007
2008
2009
2010
2011
2012
2013
2014
Fiscal Year
Supplementary WeightingsSharing, At-Risk, and Reorganization
FY 1992 Through FY 2014

Click here to continue
51 LSA: August 2013
Budget Adjustment (Previously Called Budget Guarantee)
Regular Program Budget = Pupils x District Cost
Provides an adjustment in the Regular Program Budget for districts with no or low growth in enrollments
Phase-out began in FY 2005
Scale-Down Version: ended in FY 2013
101.0% Adjustment: will remain in place after phase-out of scale-down
A factor of enrollment changes and allowable growth rate
Funded through local property tax (part of the additional levy)
FY 2014 = $11.1 million (133 districts)

Click here to continue
52 LSA: August 2013
0
50
100
150
200
250
300
$0.0
$5.0
$10.0
$15.0
$20.0
$25.0
$30.0
$35.0
$40.0
$45.0
$50.0
FY 1
996
FY 1
997
FY 1
998
FY 1
999
FY 2
000
FY 2
001
FY 2
002
FY 2
003
FY 2
004
NE
W L
AW
FY 2
005
FY 2
006
FY 2
007
FY 2
008
FY 2
009
FY 2
010
FY 2
011
FY 2
012
FY 2
013
101.
0% O
nly
FY 2
014
Num
ber o
f Dis
tric
ts
Dol
lars
in M
illio
nsBudget Guarantee FY 1996 - FY 2004Budget Adjustment FY 2005 - FY 2014
100.% Budget Guarantee 101.00% Scale-Down Number of Districts

Click here to continue
53 LSA: August 2013
0.00%
0.50%
1.00%
1.50%
2.00%
2.50%
3.00%
3.50%
4.00%
4.50%
$0.0
$10.0
$20.0
$30.0
$40.0
$50.0
$60.0
FY1996
FY1997
FY1998
FY1999
FY2000
FY2001
FY2002
FY2003
FY2004
FY2005
FY2006
FY2007
FY2008
FY2009
FY2010
FY2011
FY2012
FY2013
FY2014
Budget Guarantee/Budget Adjustment vs. Allowable Growth Rate
Budget Guarantee Total - in Millions (left-axis)
Allowable Growth Rate (right axis)

Click here to continue
54 LSA: August 2013
Dropout Prevention Program Funding
FY 2014 Dropout Prevention Program: Provides modified allowable growth for
dropout prevention programs Basically limited to 5.0% of the District’s
Regular Program Cost Total of $97.2 million (local property tax –
included in the additional levy) 298 districts (86.1%)

Click here to continue
55 LSA: August 2013
State Categorical Supplements Programs and FY 2014 funding amounts include: Educational Excellence and Student Achievement/Teacher Quality (SATQ) Teacher Comp = Teacher Salary Supplement ($266.3 million) SATQ Professional Development = Professional Development Supplement ($30.2 million) Early Intervention/Class Size Reduction Supplement ($31.1 million) Total of State Categorical Supplements = $327.5 million (8.2% of combined district cost)

Click here to continue
56 LSA: August 2013
School Budget Review Committee Funding
Six-Member Committee Five voting members and Department of Education Director
(nonvoting) Authority to grant budget increases Modified allowable growth (property taxes) Unique and unusual circumstances “Manage” Formula
Special education weights Cash reserve Negative unspent balances Grants budget authority

Click here to continue
57 LSA: August 2013
AEA Program Funding Combined District Cost
AEA funding Pupil driven Flows through local district Special education support services Media services Educational services AEA sharing Categorical supplements (teacher compensation
and professional development)

Click here to continue
58 LSA: August 2013
Area Education Agency Programs Funding “flows through” local districts. Amounts for FY 2014: Special Education Support Services: $125.0 million (after State aid reduction) – State aid and property
tax $7.5 million State aid reduction (permanent) $15.0 million additional State aid reduction Educational Services: $28.2 million – property tax Media Services: $25.5 million – property tax AEA Sharing: $151,000 – State aid and property tax Teacher Compensation: $14.2 million Professional Development: $1.7 million Total AEA Funding: $194.8 million (4.9% of combined district
cost)
Click here to continue
59 LSA: August 2013
Discretionary School District Programs

Click here to continue
60 LSA: August 2013
Discretionary – General Fund Instructional Support Program
Up to 10.0% of the regular program budget Board approved for five years Voter approved for 10 years Part of school district’s general fund Funded through local tax/State aid* mix
FY 2014: 335 Districts – $200.0 million State Aid – $0.0 Property Tax – $114.5 million Income Surtax – $85.5million (276 Districts) $75.3 million additional State aid to “fully” fund State portion
*No State funding was appropriated for FY 2014.
Click here to continue
61 LSA: August 2013
Cash Reserve Provides “cash” behind spending authority Property taxes levied for:
Cash flow State aid, property tax shortfall Modified allowable growth (MAG) Included in district’s general fund
FY 2014 = $190.1 million (64.2% of districts) FY 2013 = $231.5 million (83.6% of districts) FY 2012 = $273.5 million (93.2% of districts) FY 2011 = $297.6 million (90.8% of districts)

Click here to continue
62 LSA: August 2013
Discretionary: Non-General Fund Management Levy
Physical Plant and Equipment Levy (PPEL)
Public Education and Recreational Levy (PERL) – also referred to as Playground and Equipment Levy
Debt Levy
State sales/use tax for school infrastructure (revenue purpose statement)

Click here to continue
63 LSA: August 2013
Management Levy Optional Levy authorized by the School Board FY 2014: Use restricted – not rate restricted
Liability insurance premium costs Tort judgments Self insurance Loss of property Unemployment benefits Early retirement
338 districts (97.7%) $150.7 million
Click here to continue
64 LSA: August 2013
Physical Plant and Equipment Levy FY 2014: Board Approved - Levy rate of $0.33 per $1,000
of taxable valuation of property 335 districts (96.8%) $48.2 million (property tax)
Voter Approved – Maximum levy rate of $1.34 per $1,000 of taxable valuation of property 243 districts (70.2% for $113.6 million total) $103.7 million property tax $10.0 million income surtax (79 districts)

Click here to continue
65 LSA: August 2013
Public Education and Recreational Levy (PERL)
Also known as the Playground Levy. FY 2014: Voter approved Levy rate up to $0.135 per $1,000 of taxable
valuation of property Remains in place until rescinded by the voters 18 districts $2.3 million

Click here to continue
66 LSA: August 2013
Bonds/Debt Service Voter approved – requires 60.0% approval Maximum of 20 years Cannot exceed $2.70/$1,000 taxable valuation,
unless voters approved higher rate specified on ballot (but cannot exceed $4.05/$1,000 taxable valuation)
$148.2 million in FY 2014 (185 districts and four previously dissolved/reorganized districts)

Click here to continue
67 LSA: August 2013
SAVE Fund SAVE (Secure an Advanced Vision for Education) State sales/use tax for school infrastructure Distribution formula based on School Infrastructure Local
Option (SILO) sales tax distribution By the end of FY 2014, per pupil funding will be equal Revenue purpose statement FY 2014 is estimated at $415.0 million Excess flows to PTER Fund (2.1% Beginning in FY 2015)

Click here to continue
68 LSA: August 2013
Per Pupil Valuations/Property Tax Variances

Click here to continue
69 LSA: August 2013
Property Rich vs. Property Poor (Example)
Comparison of Two Districts Each with 1,000 students Each generating $5.8 million through formula funding
District A Property rich $750,000 taxable valuation per pupil
District B Property poor $150,000 taxable valuation per pupil

Click here to continue
70 LSA: August 2013
Property Rich Vs. Property Poor Example District A
Property rich Total funding = $5.8 million Uniform Levy = $4.1 million State Aid = $1.0 million Additional Levy = $0.7 million
District B Property poor Total funding = $5.8 million Uniform Levy = $0.8 million State Aid = $4.3 million Additional Levy = $0.7 million
District A District BAdditional
LevyAdditional
LevyFoundation
LevelState Aid State
Aid
Uniform Levy Uniform
Levy

Click here to continue
71 LSA: August 2013
Property Rich Vs. Property Poor (Additional Levy)
District A District BAdditional
LevyAdditional
Levy
Additional Levy totals $0.7 million for both districts, BUT:
Additional Levy rates are different Additional Levy is not rate restricted –
property tax rate is based on amount generated from the school aid formula
District A Property rich Additional Levy rate = $0.961
District B Property poor Additional Levy rate = $4.807
Difference in Additional Levy rate is $3.845
Click here to continue
72 LSA: August 2013
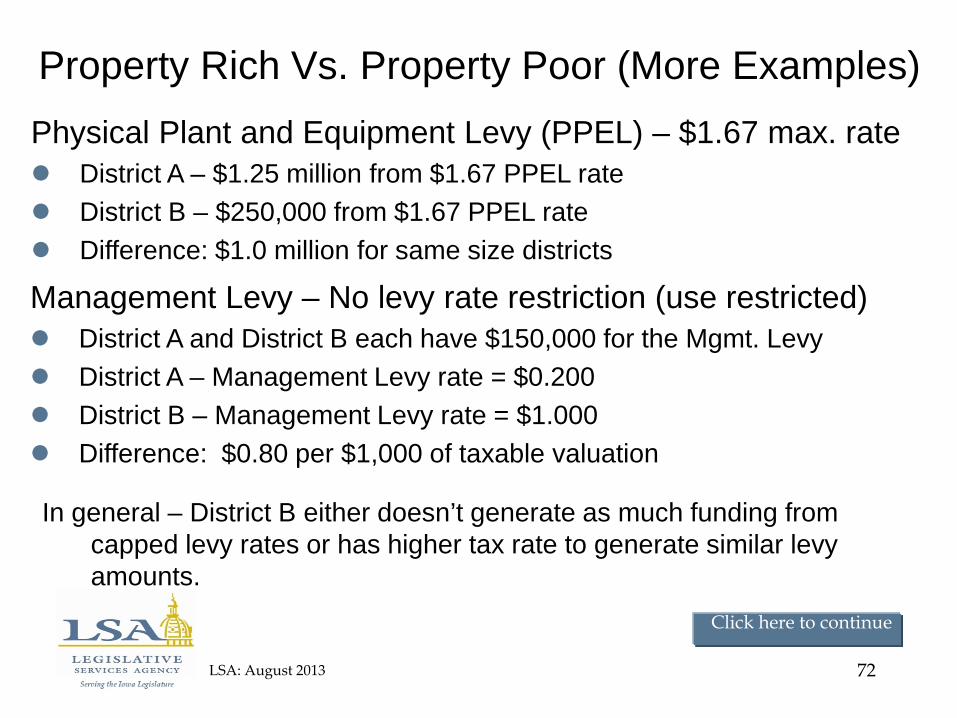
Property Rich Vs. Property Poor (More Examples) Physical Plant and Equipment Levy (PPEL) – $1.67 max. rate District A – $1.25 million from $1.67 PPEL rate District B – $250,000 from $1.67 PPEL rate Difference: $1.0 million for same size districts
In general – District B either doesn’t generate as much funding from capped levy rates or has higher tax rate to generate similar levy amounts.
Management Levy – No levy rate restriction (use restricted) District A and District B each have $150,000 for the Mgmt. Levy District A – Management Levy rate = $0.200 District B – Management Levy rate = $1.000 Difference: $0.80 per $1,000 of taxable valuation

Click here to continue
73 LSA: August 2013
Per Pupil Valuations - Tax Rates
In general: School districts with higher per pupil valuations:
Generate more tax dollars at a fixed property tax rate Will have a lower property tax rate for levies with no capped rates Will receive less State aid through the foundation formula
School districts with lower per pupil valuations: Generate less tax dollars at a fixed property tax rate Will have a higher property tax rate for levies with no capped rates Will receive more State aid through the foundation formula
This may impact school district decisions for discretionary programs funded locally
Click here to continue
74 LSA: August 2013
Addendum - Other Information
Click here to continue
75 LSA: August 2013
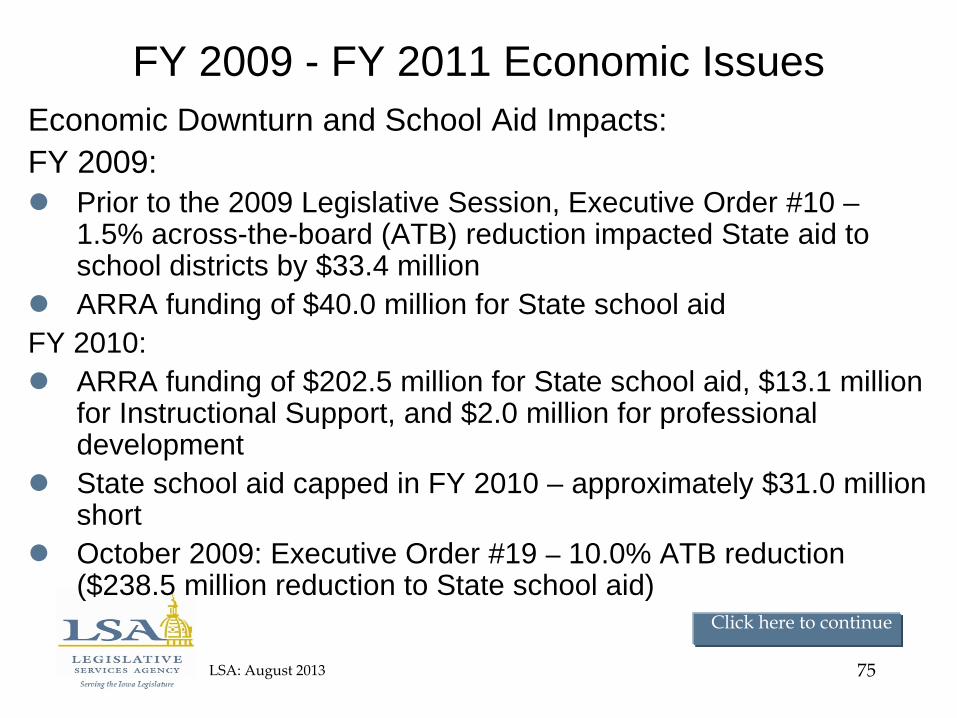
FY 2009 - FY 2011 Economic Issues Economic Downturn and School Aid Impacts: FY 2009: Prior to the 2009 Legislative Session, Executive Order #10 –
1.5% across-the-board (ATB) reduction impacted State aid to school districts by $33.4 million
ARRA funding of $40.0 million for State school aid FY 2010: ARRA funding of $202.5 million for State school aid, $13.1 million
for Instructional Support, and $2.0 million for professional development
State school aid capped in FY 2010 – approximately $31.0 million short
October 2009: Executive Order #19 – 10.0% ATB reduction ($238.5 million reduction to State school aid)

Click here to continue
76 LSA: August 2013
FY 2009 – FY 2011 Economic Issues (continued)
FY 2011: State school aid appropriation capped: $156.1 million short
of fully funding ARRA funding totaling $47.9 million used in lieu of General
Fund for State aid Underground Storage Tank (UST) funding totaling
$5.1 million used in lieu of General Fund for State aid Instructional Support Program appropriation capped at
$7.5 million and funded through the School Infrastructure Fund

Click here to continue
77 LSA: August 2013
Education Jobs Fund FY 2011: Federal program to provide additional funding for school
level staff Iowa’s application for funding submitted in August 2010
(approval pending) Specifies funds to be used for school staff expenditures
during the 2010-2011 school year Iowa’s share = $96.5 million Allocated to school districts based on weighted enrollment Maintenance of effort provision tied to K-12 and
postsecondary education funding levels

Click here to continue
78 LSA: August 2013
K-12 School Aid, $2,714.8 , 41.8%
Medical Assistance, $1,143.8 , 17.6%
Higher Education, $816.5 , 12.6%
Corrections, $374.5 , 5.8%
Remainder of Programs/Agencies,
$1,440.4 , 22.2%
Estimated FY 2014 General Fund Appropriations by Program Area(Dollars in Millions)
Total Appropriations = $6,490.1

Click here to continue
79 LSA: August 2013
School District Property Taxes
FY 1998 to FY 2014: Annual average School Foundation Levy increase of 3.0% while other school levies averaged 6.2%.
$833.1
$1,337.9
$291.5
$758.1
$0.0$200.0$400.0$600.0$800.0
$1,000.0$1,200.0$1,400.0$1,600.0
FY 1
998
FY 1
999
FY 2
000
FY 2
001
FY 2
002
FY 2
003
FY 2
004
FY 2
005
FY 2
006
FY 2
007
FY 2
008
FY 2
009
FY 2
010
FY 2
011
FY 2
012
FY 2
013
FY 2
014
School Levies - FY 1998 to Est. FY 2014(Dollars in Millions)
School Foundation Other School Levies Total

Click here to continue
80 LSA: August 2013
School District Property Taxes
Average annual growth from FY 1998 to FY 2014: Cash Reserve Levy 8.2%, Management Levy 9.5%, total PPEL 6.8%
$0.0
$50.0
$100.0
$150.0
$200.0
$250.0
$300.0
FY1998
FY1999
FY2000
FY2001
FY2002
FY2003
FY2004
FY2005
FY2006
FY2007
FY2008
FY2009
FY2010
FY2011
FY2012
FY2013
FY2014
Other School District Levy Amounts(Dollars in Millions)
Instructional Support/Ed. Improvement Cash Reserve Management PPEL Debt Other
Click here to continue
81 LSA: August 2013
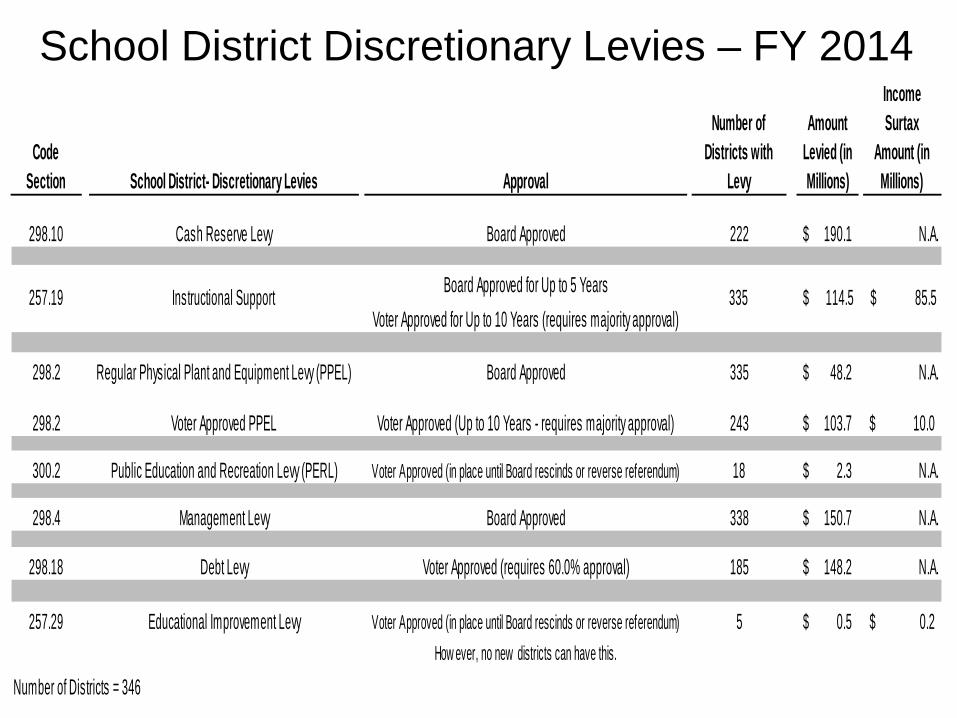
School District Discretionary Levies – FY 2014
Code Section School District- Discretionary Levies Approval
Number of Districts with
Levy
Amount Levied (in Millions)
Income Surtax
Amount (in Millions)
298.10 Cash Reserve Levy Board Approved 222 190.1$ N.A.
Board Approved for Up to 5 YearsVoter Approved for Up to 10 Years (requires majority approval)
298.2 Regular Physical Plant and Equipment Levy (PPEL) Board Approved 335 48.2$ N.A.
298.2 Voter Approved PPEL Voter Approved (Up to 10 Years - requires majority approval) 243 103.7$ 10.0$
300.2 Public Education and Recreation Levy (PERL) Voter Approved (in place until Board rescinds or reverse referendum) 18 2.3$ N.A.
298.4 Management Levy Board Approved 338 150.7$ N.A.
298.18 Debt Levy Voter Approved (requires 60.0% approval) 185 148.2$ N.A.
257.29 Educational Improvement Levy Voter Approved (in place until Board rescinds or reverse referendum) 5 0.5$ 0.2$ How ever, no new districts can have this.
Number of Districts = 346
257.19 Instructional Support 335 $ 114.5 $ 85.5
Click here to continue
82 LSA: August 2013
Income Surtax Income Surtax is a funding source used to replace
property tax – totaled $95.7 million in FY 2014 Instructional Support ($85.5 million), voter-
approved PPEL ($10.0 million), and Educational Improvement ($0.2 million) Programs
286 (82.7%) school districts imposed for FY 2014 FY 2014 remaining income surtax capacity =
$454.2 million

Click here to continue
83 LSA: August 2013
Income Surtax
0.0%
4.0%
8.0%
12.0%
16.0%
20.0%
$0.0
$100.0
$200.0
$300.0
$400.0
$500.0
$600.0
FY2000
FY2001
FY2002
FY2003
FY2004
FY2005
FY2006
FY2007
FY2008
FY2009
FY2010
FY2011
FY2012
FY2013
FY2014
Do
llars
in
Mill
ion
s
Income Surtax: Capacity vs. Actual AmountFY 2000 - FY 2014
Total Income Surtax Capactiy Actual Total Income Surtax Percent of Actual to Capacity

Click here to continue
84 LSA: August 2013
Federal Funding Title I, Title II, IDEA, others Federal Sequestration – reduction of
federal funding (estimated $8.1 million reduction for Iowa school districts/AEAs)
Federal funding percentages: On average, school districts approximately 3.2% and AEAs approximately 41.0%

Click here to continue
85 LSA: August 2013
School Finance – LSA Role Model the school aid formula including
State aid and property tax implications Provide fiscal estimates of proposed
legislation including impact at the school district level
Provide historical data at the State and school district level

Click here to continue
86 LSA: August 2013
Recent Issues Some Recent Issues Subject of Legislation: Equalization of per pupil spending Enrollment changes (declines/increases) Transportation costs Property tax relief/property tax equalization Education reform Online learning initiatives School infrastructure Teacher compensation Curriculum School district cash reserves

Click here to continue
87 LSA: August 2013
Questions?
Shawn Snyder
515-281-7799
LSA K-12 Website: http://staffweb.legis.state.ia.us/lfb/docs/k-12_ed/k-12_ed.htm