Embed Size (px)
Citation preview

Overview of Numeric Nutrient Criteria Development and
Implementation in Montana
Michael Suplee, PhD Water Quality Standards Section
Montana Department of Environmental Quality
Presented to Flathead WAG January 17, 2012

Presentation Outline • Why numeric nutrient criteria? • Criteria derivation: methods overview
– Wadeable streams, Large rivers, Lakes/reservoirs • The Clark Fork River case study • Implementation: Meeting the standards over
time – Senate bills 95 and 367
• Nutrient Work Group • Draft Circular DEQ-12 and new rules
– MPDES permitting • USEPA acceptance of Montana’s approach • Timeline: adoption of statewide nutrient criteria • Criteria specific to Flathead Lake

Why Numeric Nutrient Criteria? • Existing standards are narrative (“no nuisance aquatic
life”, etc.) – Intent fairly clear, application inconsistent
• Nutrient (i.e., nitrogen and phosphorus) over-
enrichment directly and indirectly impacts other, existing numeric WQ standards: – Dissolved oxygen, pH, etc.
Better to address root cause via nutrient standards
• Allows for more consistent permitting and TMDL application

Clark Fork River
Nuisance algal growth, rivers & streams

0 50 100 150 200 250 300 350 400 450 500
Benthic algae level (mg Chla/m2)
Actual/likely affects on stream uses at varying algae levels (wadeable streams)
Recreation acceptable Recreation unacceptable
Increasing salmonid growth & survival
Salmonid growth & Survival high
Salmonid growth & Survival possibly reduced
Salmonid growth & survival very likely impaired
No DO problems DO problems very likely Possible DO problems
Stonefly, mayfly caddis- fly dominant
Shift in biomass & community structure
Midges, worms, mollusks, scuds dominant
?

Control Reach (Sept 9, 2010)
Nutrient dosed Reach (Sept 9, 2010)

Nutrient Impacts in a Wadeable Stream During a Controlled Nutrient Addition Study
Dosing start (8/9) DO problems (9/28) Dosing end (10/1)
Grey: Reach dosed with N and P Black: Control Reach
Aquatic life/fish DO standards (acute, chronic)

DO problems probably occur in patches as a function of stream morphology and depositional characteristics
Low Dissolved Oxygen
FLOW

Nutrient Criteria Derivation: Wadeable Streams
3 major parts: 1) Identification of appropriate geographic zones in which
specific nutrient criteria (total P, total N) would apply 2) Understanding of cause-effect (i.e., stressor-response)
relationships between nutrients and beneficial uses • Requires determining “harm to use” • Different expectations for different regions of the state
3) Water quality data from reference sites Data from 2 and 3 above can (and should) be considered together

Montana Ecoregions (level III, IV)
Mountainous Prairie
Dose-response studies carried out in a level III ecoregion occurring in MT (except Mebane [2010])
Reference Stream Sites Nutrient concentration data from reference streams — which support all their beneficial uses and have minimal impacts — are compiled for each ecoregion (III, and IV if possible)
Western MT reference stream site
Eastern MT prairie-stream reference site
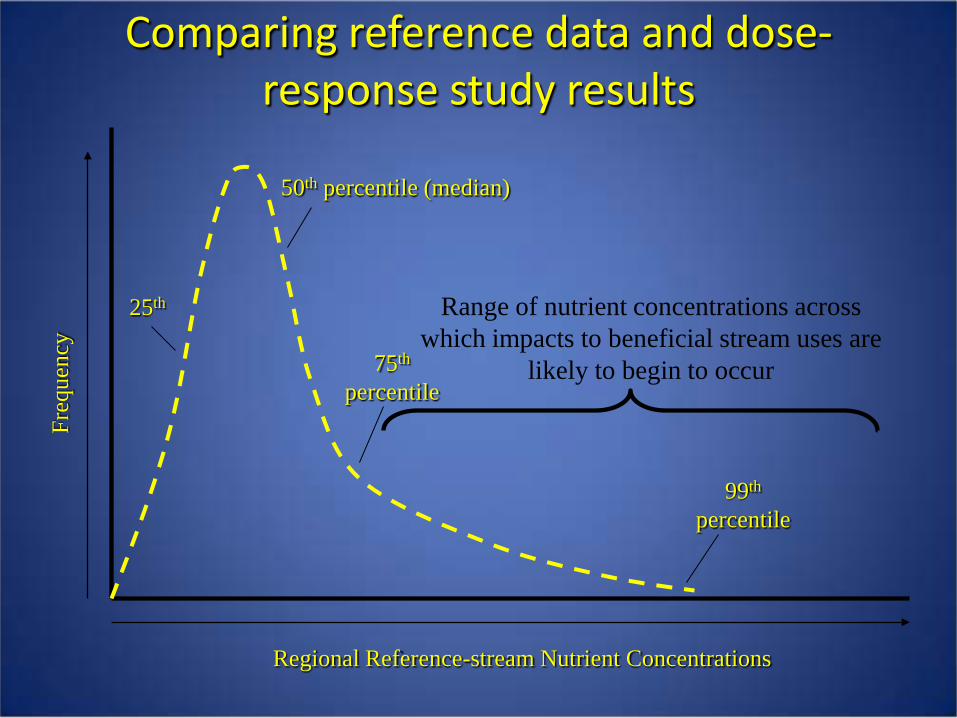
Comparing reference data and dose-response study results
Freq
uenc
y
Regional Reference-stream Nutrient Concentrations
50th percentile (median)
75th percentile
25th Range of nutrient concentrations across which impacts to beneficial stream uses are
likely to begin to occur
99th percentile

– No comparable reference available, as for wadeables – Large rivers much deeper/faster than wadeable streams; changes light regime and
other factors
Solution: Use mechanistic water-quality models – Can vary nutrient inputs in model and observe effects on other water quality
parameters/standards, like • DO • Nuisance benthic algae growth • pH • Total organic carbon (TOC) • Total dissolved gas (TDG)
Nutrient Criteria Derivation: Large Rivers Table F-4. Large river segments within the state of Montana.
River Name Segment Description
Big Horn River Yellowtail Dam to mouth
Clark Fork River Bitterroot River to state-line
Flathead River Origin to mouth
Kootenai River Libby Dam to state-line
Madison River Ennis Lake to mouth
Missouri River Origin to state-line
South Fork Flathead River Hungry Horse Dam to mouth
Yellowstone River State-line to state-line

Lower Yellowstone River
– Used QUAL2K model to derive criteria
• Steady state
• Simulates benthic algae
– Study reach 232.9 km or 145 miles
– Low flows near 100 m3/sec (3,280 cfs) ; free flowing

For wadeable streams and large rivers, criteria apply seasonally (summer and fall) only, when algal growth is peak and ensuing water quality
impacts are maximal Table 1. Montana Draft Nutrient Criteria for some ecoregions and the lower Yellowstone River
Level III Ecoregion Period When Criteria Apply
Parameter
Total P (mg/L) Total N (mg/L) Related Assessment
Information
Northern Rockies July 1 -Sept. 30
0.025 0.3 120 mg Chl a/m2 (36 g AFDW/m2)
Canadian Rockies July 1 -Sept. 30
0.025 0.3 120 mg Chl a/m2 (36 g AFDW/m2)
Middle Rockies July 1 -Sept. 30
0.030 0.3 120 mg Chl a/m2 (36 g AFDW/m2)
Idaho Batholith July 1 -Sept. 30
0.030 0.3 120 mg Chl a/m2 (36 g AFDW/m2)
Northwestern Glaciated Plains June 16-Sept. 30
0.12 1.1 n/a
Northwestern Great Plains, Wyoming Basin
July 1 -Sept. 30
0.12 1.0 n/a
Yellowstone River (Bighorn R. confluence to Powder R. confluence)
Aug 1 -Oct 31 0.09 0.70 Nutrient concentrations based on limiting pH
impacts
Yellowstone River (Powder R. confluence to stateline)
Aug 1 -Oct 31 0.14 1.0 Nutrient concentrations based on limiting
nuisance algal growth

Nutrient impacts to lakes • Loss of water clarity; reduction of recreation and aesthetic quality and
property value • Increased frequency of noxious algae blooms
• Changes in fish species composition • Loss of macrophytes, replaced by dense phytoplankton • Taste and odor problems (drinking water source)

Nutrient Criteria Derivation: Lakes and Reservoirs
• Under development. Critical data collection
in Montana lakes was completed between 2003-2008
• Reservoirs pending. May use a modeling approach as for large rivers
– Canyon Ferry Reservoir likely our first effort

Clark Fork River: MT case study • 1970s-80s: Much of river impaired by nuisance algae from excess
nutrients
• 1980s-90s: Studies, models, BPJ set targets for acceptable algae levels & estimated nutrient concentrations and loads expected to meet the targets
• 1998: Stakeholders develop voluntary nutrient reduction plan (VNRP) and implementation process
• 2002: MT adopted nutrient and algae standards for the river which
mirrored VNRP targets
• 2004: By this time, most major nutrient reduction efforts in place, including a major facility upgrade in Missoula (to BNR)
• 2011: Analysis of >12 years of monitoring data shows
improvements are occurring (lower P, algae below nuisance downstream of Missoula) in spite of basin-wide population growth

Implementation: Statewide approach
to meet the standards over time

Implementation: Economic Considerations
• Option are available for communities to receive temporary relief from the requirements based on:
– Ability to pay for treatment (affordability)
– Availability of treatment technology (limits of technology)
• These options apply only to wastewater treatment beyond the federally mandated technology-based regulations (i.e., National Secondary Standards)
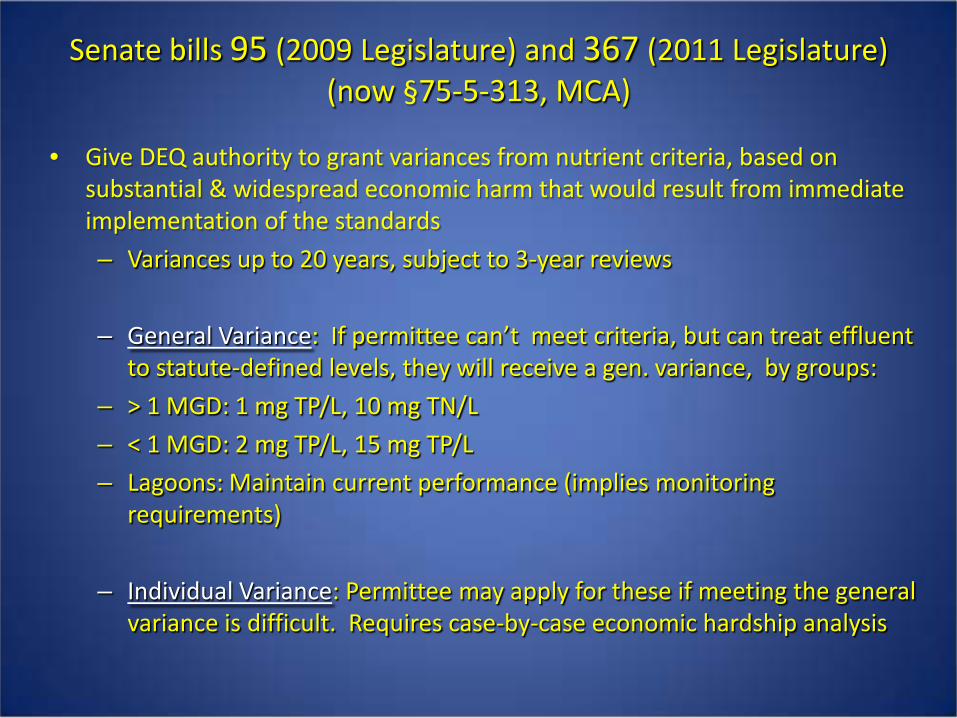
Senate bills 95 (2009 Legislature) and 367 (2011 Legislature) (now §75-5-313, MCA)
• Give DEQ authority to grant variances from nutrient criteria, based on substantial & widespread economic harm that would result from immediate implementation of the standards
– Variances up to 20 years, subject to 3-year reviews
– General Variance: If permittee can’t meet criteria, but can treat effluent to statute-defined levels, they will receive a gen. variance, by groups:
– > 1 MGD: 1 mg TP/L, 10 mg TN/L
– < 1 MGD: 2 mg TP/L, 15 mg TP/L
– Lagoons: Maintain current performance (implies monitoring requirements)
– Individual Variance: Permittee may apply for these if meeting the general variance is difficult. Requires case-by-case economic hardship analysis

OVERALL: Law allows Montana to implement numeric nutrient criteria in a staged manner over ~ 20 years, allowing critical time to better address all sources
of nutrient pollution (point and nonpoint) and for treatment technology
to improve/come down in cost

§75-5-313, MCA
• Describes the “Nutrient Work Group” – Broad cross-section of MT stakeholders
– Advise DEQ on numeric nutrient standards, especially implementation policy
– Have met with DEQ 15 times since May 2009
• Nutrient trading policy developed – Will allow for creation of nutrient credits and trading
between point sources and point source-nonpoint sources
Draft Circular DEQ-12 and new rules
Contain:
• Criteria
• General variance procedures
• Individual variances
• Permitting requirements
• Non-degradation
http://deq.mt.gov/wqinfo/NutrientWorkGroup/default.mcpx

MPDES permitting implications
• DEQ plans to use a seasonal 14Q10 (lowest average 14 consecutive day flow, July 1-September 30, average recurrence frequency once in 10 years) – Greater volume than 7Q10 which is used for toxics
• River/stream criteria apply summer and fall, except for dischargers affecting lakes (year-round)
• Permits would be based on an Average Monthly Limit (AML) only, using EPA’s TSD guidance (1991)

Major Facility Permit Process • “Reasonable Potential”: analyzes likelihood the effluent will exceed a nutrient
standard.
• For this example, will assume ambient stream conc. > standard (no dillution available). As such, permit is based on the effluent conc. variability and an assumption that the effluent follow a log-normal distribution
• For a large facility, DEQ usually requires 4 samples/month for nutrients. In this case, the standard (ug/L) =AML= permit limit. Effective July – September – For example, TN: 300 µg/L = standard = AML = permit limit
• A TMDL WLA, derived independently, will be equal to or less than the permit
limit derived by Permitting
Concentration

General Variances in Permitting • Based on effluent quality Long Term Average and
an assumption of log-normal • Examples with different CVs and sample sizes
shown below:

New! EPA acceptance of Montana’s approach
In an official memo (1/3/2012) USEPA states:
• “We recognize the strong science-based work MDEQ has conducted over the past several years to develop draft NNC for N and P for wadeable streams”
• “EPA concludes that the issuance of variances would be consistent with the Clean Water Act and its implementing regulations.”
Timeline: adoption of statewide nutrient criteria
• Next NWG Meeting: 2/27/2012 (Helena, MT) • More NWG meetings to follow (~ monthly) Assuming details get worked out: • Board package in July or September, 2012
– Public hearings, response to comments, modifications, etc.
• Rules take at least 6 months to become law – In law early 2013 at the soonest

Criteria specific to Flathead Lake • DEQ intends to propose to BER that criteria for
Flathead Lake be adopted as well as the streams • Currently, best criteria are the 1998 TMDL
targets: – 5.0 µg TP/L – 95 µg TN/L – 30 µg NO3-N/L – 1.0 µ Chla/L DEQ is communication with Flathead Lake Biological
Station for any updates to these values they might recommend.
As measured at Midlake Deep site

Example Major Facility Permit
• Maximum reported total N = 14.04 mg/L (standard = 300 μg/L) • Maximum reported total P = 0.38 mg/L; (standard = 25 μg/L) • Receiving water 14Q10 = 0 CFS • Receiving water 14Q10 = zero, reasonable potential (RP) is assessed by comparing the maximum
effluent values for N and P to the standards. RP to exceed the standards exists. • The 14Q10 is zero, so the standard is used as the waste load allocation (WLA) for developing
permit limits. From the WLA, the long term average (LTA) effluent concentration necessary to achieve the WLA, based on the 95% probability distribution of the effluent, is calculated using a multiplier from TSD Table 5-1 as follows:
• LTA = WLA x Table 5-1 multiplier • The Table 5-1 multiplier is dependent on the coefficient of variation in the facility effluent data and
the 95th percentile. In cases where the Department does not have adequate data to calculate a CV, 0.6 is considered the default CV.
• LTA = 300 μg/L x 0.644 = 193 μg/L (CV = 0.6) • From the LTA, an Average Monthly Limit (30-day average) is calculated based on a multiplier from
Table 5-2 of the TSD. • AML = LTA x Table 5-2 multiplier 2 • For an AML, multiplier is selected based on the data number of samples to be collected during the
monthly monitoring period. For a facility this size the Department typically requires at least 4 samples per monitoring period for nutrients.
• AML = 193 μg/L x 1.55 = 299 μg/L (n = 4; CV = 0.6) • The AML above would be the effluent limit in the permit. The limits would be effective July –
September only.