Embed Size (px)
Citation preview

Overview of Newborn Screening Laboratory
Processes and Quality Management
Scott M. Shone, PhDProgram Manager
New Jersey NBS Laboratory
SACHDNCMay 11, 2015

Newborn Screening System
Policy Makers
Medicaid
Medical Consultants
Physicians
Clinics
Reporting
Military
Regulations
Information Technology
Laboratory Testing
Education
Case Management
Specimen Acquisition
Customer Service
Ombudsman
Stakeholder Groups
Hospitals
Quality Assurance
Demographic Entry
BABY
Insurance
Private Laboratory
Parents
Nurses

Education (throughout the process)Screening, including specimen collection and testingFollow-up and result reportingDiagnostic confirmationManagementProgram evaluation and Continuous Quality Improvement
Key Components of Newborn Screening

Total quality management should be applied to newborn screening programs.
As with any programmatic effort, improvements result from careful and continuous monitoring of key steps in the process, the assessment of that information, and the introduction of changes that continuously improve
program performance. Uniform and consistent monitoring of system quality indicators can provide information about the relative performance
of screening programs.

Quality Assurance (QA) – all the planned and systematic activities implemented within the quality system, and demonstrated as needed, to provide adequate confidence that an entity will fulfill requirements for quality. NOTE: Quality assurance may be said to comprise internal quality assurance and external quality assurance and is interrelated with quality control.
Quality Control (QC) – the operational techniques and activities that are used to fulfill requirements for quality.
Quality Indicators (QI) - a metric that gives an indication of process or output quality and can be used to make comparisons across different Programs

Ensuring Quality


Preanalytic
Test selection and ordering
Specimen collection,
handling, and delivery
Specimen receipt and
accessioning
Analytic
Specimen preparation
Test performance
Monitoring and verification of test accuracy and results
Documenting test findings
Postanalytic
Reporting test results
Turn around time
Verifying electronic data
transfers
Records and specimen retention

Establishing a New Test Verify manufacturer’s
Accuracy Precision Reportable range Reference intervals
Establish assay’s Accuracy Precision Analytical sensitvity Analytical specificity Reportable range Reference intervals Other performance
characteristics


CLSI -Clinical and Laboratory Standards Institute www.clsi.org
LA04-A5 - Blood Collection on Filter Paper for Newborn Screening Programs; Approved Standard - Fifth Edition
LA04-A5-DVD - Making a Difference Through Newborn Screening: Blood Collection on Filter Paper

Preanalytic Quality
0%
5%
10%
15%
20%
25%
30%
35%
40%
45%
50%
55%
60%
65%
70%
75%
80%
85%
90%
95%
100%
2011
Cumu
lative
%
>7 d
6-7 d
5-6 d
4-5 d
3-4 d
48-72 hr
24-48 hr
12-24 hr
< 12 hr By 48 hours =
91.8%Median =
35.9h
0%
5%
10%
15%
20%
25%
30%
35%
40%
45%
50%
55%
60%
65%
70%
75%
80%
85%
90%
95%
100%
2014
Cumulati
ve %
>7 d
6-7 d
5-6 d
4-5 d
3-4
48-72
24-48
12-24
<12 By 48 hours =
94.6%Median =
36.0h
0%
5%
10%
15%
20%
25%
30%
35%
40%
45%
50%
55%
60%
65%
70%
75%
80%
85%
90%
95%
100%
2011
Cumu
lative
%
>7 d
7 d
6 d
5 d
4 d
3 d
2 d
1 d
Same day By 3 days =
86%
0%
5%
10%
15%
20%
25%
30%
35%
40%
45%
50%
55%
60%
65%
70%
75%
80%
85%
90%
95%
100%
2014
Cumulati
ve %
>7 d
7 d
6 d
5 d
4 d
3 d
2 d
1 d
Same day
By 3 days =
92%


Galactosemia• GALT• TGAL
Biotinidase Deficiency• BIO
Cystic Fibrosis• IRT
Congenital Adrenal Hyperplasia• 17OHP
Congenital Hypothyroidism• T4• TSH
Amino Acid DisordersFatty Acid DisordersOrganic Acid Disorders
Hemoglobinopathies
Severe Combined Immunodeficiency

Rejecting assays is not the purpose of quality control
Process must detect immediate errors caused by test failure

Analytic Quality Material
Dried blood spots In-house Commercial vendor
Kit Non-kit CDC NSQAP
Levels Decision points
WNL Abnormal
Establishing laboratory range Replicates ≥ 20
observations Instrument to
Instrument
Frequency ≥ 2 control materials
per assay Acceptance Criteria
Westgard rules Patients
Monitor Plate Instrument to
Instrument Trends Shifts

Monitor & Corrective Action
Sample 2015035P1-LOW1 2015035P1-LOW2 Range 2015035P1-HIGH1 2015035P1-HIGH2 RangeC0 139.46 157.12 (123.52 - 181.60) 358.85 342.54 (302.32 - 424.90)C2 32.49 35.83 (29.79 - 42.99) 73.68 73.62 (61.97 - 90.35)C3 8.33 9.44 (7.46 - 11.60) 23.56 22.56 (19.13 - 29.75)C4 1.68 2.65 (1.39 - 4.09) 7.73 5.95 (3.57 - 10.23)C4 MRM 2.31 2.63 (2.21 - 3.35) 6.68 6.27 (5.59 - 8.77)C5 1.23 1.06 (0.50 - 1.58) 2.29 2.26 (1.35 - 3.93)C5 MRM 0.94 1.05 (0.87 - 1.23) 2.49 2.55 (2.06 - 3.44)C5DC 0.63 0.67 (0.48 - 0.72) 1.53 1.48 (1.24 - 1.90)C6 0.42 0.63 (0.17 - 1.07) 2.19 1.46 (0.50 - 2.84)C8 0.8 0.62 (0.24 - 1.08) 1.79 1.4 (0.71 - 2.99)C10 0.55 0.49 (0.14 - 0.86) 1.28 0.61 (0.40 - 2.26)C12 2.11 1.9 (1.08 - 2.82) 4.1 5.22 (2.98 - 7.42)C14 1.99 2.19 (1.06 - 2.62) 3.65 5.43 (2.92 - 6.58)C16 10.86 10.86 (8.09 - 17.09) 24.34 27.81 (20.27 - 40.85)C16 MRM 11.7 13.62 (10.62 - 14.70) 31.59 29.63 (25.54 - 37.42)C18 2.26 2.35 (1.59 - 3.33) 5.2 5.98 (2.66 - 7.40)C18 MRM 2.36 2.56 (2.02 - 2.98) 4.87 4.67 (4.06 - 5.98)CIT 161.82 174.12 (128.98 - 191.02) 526.25 509.94 (416.21 - 629.45)LEU 379.78 575.87 (363.63 - 613.17) 1614.49 1485.48 (1010.70 - 1953.48)MET 94.2 109.52 (54.32 - 112.76) 321.77 253.68 (191.79 - 392.19)PHE 192.89 227.81 (167.78 - 254.48) 539.97 656.16 (491.07 - 803.97)TYR 281.85 389.96 (215.61 - 389.97) 1107.64 999.54 (702.05 - 1294.73)ARG 6.88 6.33 (3.36 - 7.08) 5.61 5.1 (3.15 - 7.71)
Sample 2015035P1-LOW1 2015035P1-LOW2 Range 2015035P1-HIGH1 2015035P1-HIGH2 RangeC0 139.46 157.12 (123.52 - 181.60) 358.85 342.54 (302.32 - 424.90)C2 32.49 35.83 (29.79 - 42.99) 73.68 73.62 (61.97 - 90.35)C3 8.33 9.44 (7.46 - 11.60) 23.56 22.56 (19.13 - 29.75)C4 1.68 2.65 (1.39 - 4.09) 7.73 5.95 (3.57 - 10.23)C4 MRM 2.31 2.63 (2.21 - 3.35) 6.68 6.27 (5.59 - 8.77)C5 1.23 1.06 (0.50 - 1.58) 2.29 2.26 (1.35 - 3.93)C5 MRM 0.94 1.05 (0.87 - 1.23) 2.49 2.55 (2.06 - 3.44)C5DC 0.63 0.67 (0.48 - 0.72) 1.53 1.48 (1.24 - 1.90)C6 0.42 0.63 (0.17 - 1.07) 2.19 1.46 (0.50 - 2.84)C8 0.8 0.62 (0.24 - 1.08) 1.79 1.4 (0.71 - 2.99)C10 0.55 0.49 (0.14 - 0.86) 1.28 0.61 (0.40 - 2.26)C12 2.11 1.9 (1.08 - 2.82) 4.1 5.22 (2.98 - 7.42)C14 1.99 2.19 (1.06 - 2.62) 3.65 5.43 (2.92 - 6.58)C16 10.86 10.86 (8.09 - 17.09) 24.34 27.81 (20.27 - 40.85)C16 MRM 11.7 13.62 (10.62 - 14.70) 31.59 29.63 (25.54 - 37.42)C18 2.26 2.35 (1.59 - 3.33) 5.2 5.98 (2.66 - 7.40)C18 MRM 2.36 2.56 (2.02 - 2.98) 4.87 4.67 (4.06 - 5.98)CIT 161.82 174.12 (128.98 - 191.02) 526.25 509.94 (416.21 - 629.45)LEU 379.78 575.87 (363.63 - 613.17) 1614.49 1485.48 (1010.70 - 1953.48)MET 94.2 109.52 (54.32 - 112.76) 321.77 253.68 (191.79 - 392.19)PHE 192.89 227.81 (167.78 - 254.48) 539.97 656.16 (491.07 - 803.97)TYR 281.85 391.81 (215.61 - 389.97) 1107.64 999.54 (702.05 - 1294.73)ARG 6.88 6.33 (3.36 - 7.08) 5.61 5.1 (3.15 - 7.71)


>37 weeks BORD PRETotal
Abnormal
June 30, 2014 to Oct 7, 2014
26,835 specimens
89(0.33%
)
14(0.05%)
103(0.38%)
Oct 8, 2014 to Jan 31, 2015
32,082 specimens
13(0.04%
)
3(0.009%
)
16(0.05%)
SCID Cutoff Adjustment
1 Classic SCID, 1 ADA SCID, 1 Leaky SCID, 5 idiopathic T-cell lymphopenia
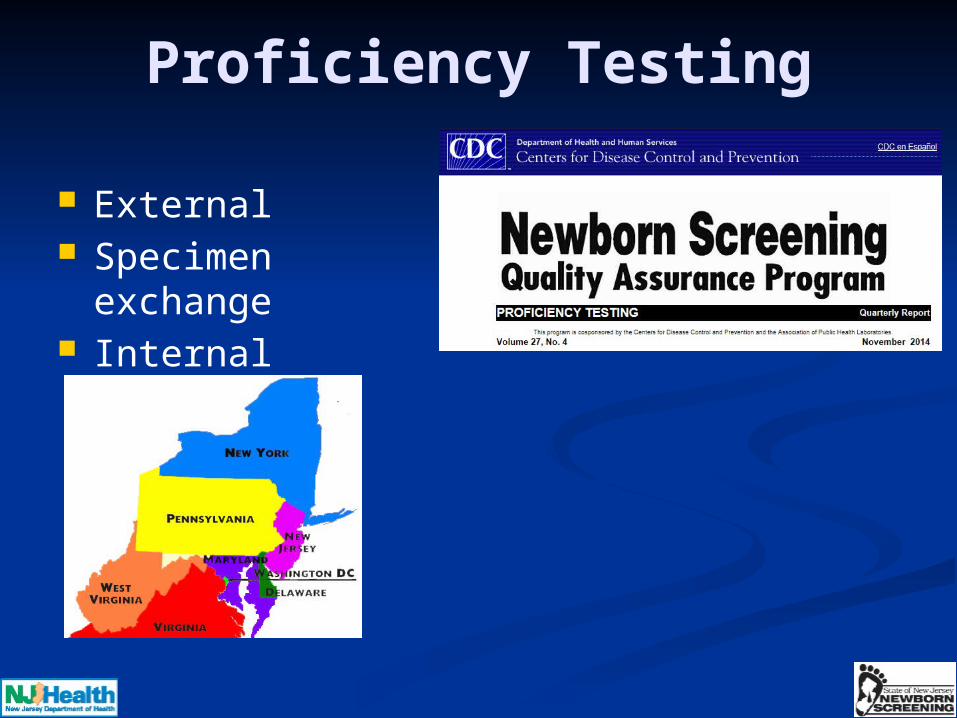
Proficiency Testing
External Specimen
exchange Internal

Preanalytic
Test selection and ordering
Specimen collection,
handling, and delivery
Specimen receipt and
accessioning
Analytic
Specimen preparation
Test performance
Monitoring and verification of test accuracy and results
Documenting test findings
Postanalytic
Reporting test results
Turn around time
Verifying electronic data
transfers
Records and specimen retention

Newborn Screening System
Policy Makers
Medicaid
Medical Consultants
Physicians
Clinics
Reporting
Military
Regulations
Information Technology
Laboratory Testing
Education
Case Management
Specimen Acquisition
Customer Service
Ombudsman
Stakeholder Groups
Hospitals
Quality Assurance
Demographic Entry
BABY
Insurance
Private Laboratory
Parents
Nurses