Embed Size (px)
Citation preview

Overview of new MODIS and Landsat data derived products to characterise land cover and
change over Russia
Sergey BARTALEV
Russian Academy of Sciences Space Research Institute (IKI)
15 Aprile 2013, GOFC-GOLD Symposium, Wageningen

LAGMA : Locally Adaptive Global Mapping Algorithm
Local spectral-temporal signatures of classes Spectral-temporal MODIS data composites
Maximum likelihood classifier
Covariation of
metrics
Average of
metrics
Number of
samples
Metrics for the pixel
Probabilities for classes
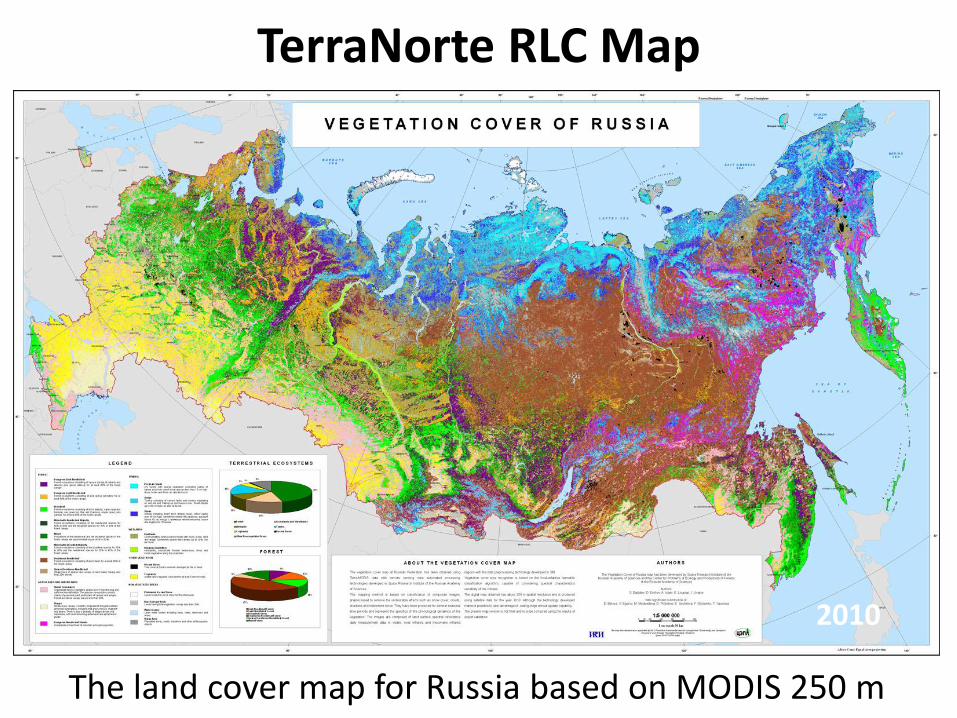
The land cover map for Russia based on MODIS 250 m
TerraNorte RLC Map
2005 2010

Automated technology for annual land cover mapping based on MODIS data
2000
2005
2012
The homogenous time-series of land cover maps of Russia has been
developed for the period of years 2000-2012.

Forest change detection using the land cover maps time-series
2000 2001 2002
2005 2006 2008

Forest area dynamics for Russia over period of years 2000-2012
The forest area estimated using MODIS data derived land cover maps.
The annual forest area change (%) is as compared to year 2000.
-1,8
-1,6
-1,4
-1,2
-1,0
-0,8
-0,6
-0,4
-0,2
0,0
0,2
0,4
0,6
2000 2001 2002 2003 2004 2005 2006 2007 2008 2009 2010 2011 2012
годы
%
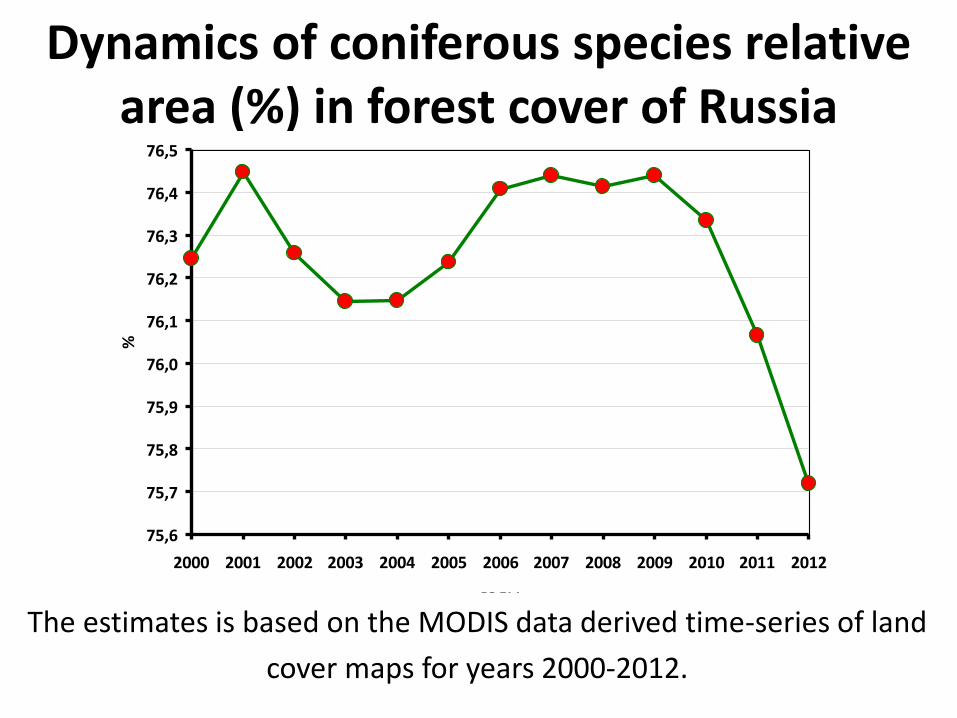
Dynamics of coniferous species relative area (%) in forest cover of Russia
75,6
75,7
75,8
75,9
76,0
76,1
76,2
76,3
76,4
76,5
2000 2001 2002 2003 2004 2005 2006 2007 2008 2009 2010 2011 2012
годы
%
The estimates is based on the MODIS data derived time-series of land
cover maps for years 2000-2012.

The estimation is based on MODIS data derived land cover maps for 2000-2012. The
relative (%) tree species area changes estimated as compared to year 2000.
-10,0
-8,0
-6,0
-4,0
-2,0
0,0
2,0
4,0
6,0
2000 2001 2002 2003 2004 2005 2006 2007 2008 2009 2010 2011 2012
годы
%
Темнохвойные Лиственница Сосна
Relative area (%) dynamics of different coniferous species in forest of Russia

0,25
0,3
0,35
0,019 0,024 0,029 0,034 0,039 0,044 0,049
reflectance in RED (620—670 nm) band
reflecta
nce in N
IR (
841—
876 n
m)
band
oak
birch
maple
aspen
linden
Forest species classification using MODIS time-series
Deciduous Broadleaf Forest in TerraNorte RLC map
Forest Map of USSR (1990, 1:2,5 mln) Forest species mapping using MODIS time-series

The forest cover is classified considering dominant tree
species using seasonal time-series of MODIS data

0,0%
5,0%
10,0%
15,0%
20,0%
25,0%
30,0%
35,0%
40,0%
45,0%
Spruce Fir Siberian
Pine
Pine Larch Oak Erman's
Birch
Birch Aspen
official state statistics
map based estimates
0,00%
0,10%
0,20%
0,30%
0,40%
0,50%
0,60%
Beech Linden Maple
Forest species area % : MODIS derived estimates vs. official statistics

2010
Method of forest GSV retrieval based on ASAR and MODIS data products synergy
Forest GSV Map
Locally-adaptive regression fitting
Local classes’ signatures of GSV
(BIOMASAR) and Surface Reflectance
(MODIS Snow Composite)
TerraNorte Land Cover BIOMASAR MODIS
LAGMA

Enhanced forest GSV retrieval is based on Envisat-ASAR derived BIOMASSAR product
and MODIS data snow composite synergy (250 m, year 2010)..

Enhanced forest GSV map vs. BIOMASAR
Forest GSV map BIOMASAR map

Enhanced forest GSV map vs. BIOMASAR: Pareto Boundary evaluation approach
0
3
6
9
12
15
18
21
24
0 3 6 9 12 15 18 21
Co
mm
iss
ion
err
or,
%
Omission error, %
MODIS
BIOMASAR2
BIOMASAR Enhanced GSV map
GSV Threshold
Forest cover
TerraNorte RLC Forest cover

100
150
200
250
300
350
100 150 200 250 300 350
Sto
ck
vo
lum
e,
m3
/ha
Stock volume, m3/ha
MODIS
BIOMASAR
GSV error in comparison to ground truth data at 1 km pixel:
MODIS - 14% ; BIOMASAR - 26%
y = 1,12x - 35,44 R² = 0,99
y = 1,03x - 28,15 R² = 0,99
0
2500
5000
7500
10000
12500
15000
0 2,500 5,000 7,500 10,000 12,500 15,000
To
tal s
toc
k v
olu
me
, m
illi
on
m3
Total stock volume according official statistics, million m3
BIOMASAR
MODIS
Linear(BIOMASAR)
Linear(MODIS)
Comparison with official statistics for administrative units of Russia (2010 )
Enhanced forest GSV map vs. BIOMASAR: comparison to ground truth data and official statistics

Landsat-TM/ETM+ clouds/shadow masking
Landsat-TM Clouds detection (in red) Geometric shadow belt (in black)
Detected clouds (red) and shadows (green)
1. Clouds detection
2. Geometric modelling of shadows belts
3. Filtering of the geometric shadows
4. Spatial filtering of clouds and shadows

Landsat-TM/ETM+ composite for year 2011
The automatic data processing chain allows yearly production of the Landsat-TM/ETM seasonal composites

Burnt area mapping technology using Landsat-TM data is in operation (> 3500 burs were mapped in Russia for 2011 fire season)

Combined SRBA&HRBA burnt area map:
Russian Federation, fire season of year 2011
The map includes burnt area polygons mapped with both MODIS (SRBA
product) and Landsat-TM/ETM+ (HRBA product) data

Forest burn severity map of Russia for year 2012

Forest burn severity assessment: Russia, fire season 2012
Totally 7012 th ha or 64% of forest area is seriously damaged (high severity and lost forest) in Russia during fire season 2012

Web-based Vegetation Monitoring Service VEGA: vega.smislab.ru
VEGA (in operation since May 2011) is developed by
the Space Research Institute of the Russian Academy
of Sciences to provide vegetation status analysis tools
based on multi-annual and near-real-time EO data


![GSV Publications requiring copyright permission Publications requiring copyright permission: 4 GSV Library 929.2 CANE CAN 67. Canty, Wendy. All the shades of Gray. [Photocopy] GSV](https://img.pdfslide.us/doc/110x75/5aa7f75b7f8b9a54748cb5e9/gsv-publications-requiring-copyright-permission-publications-requiring-copyright.jpg)