Embed Size (px)
Citation preview
Overview of Internal Migration in Indonesia
© S
hutt
erst
ock/
Robb
y Fa
khria
nnur

2 |
• Indonesia’s total population, as recorded by UNESCAP in 2016, stands at just under 261 million.
• Indonesia has an annual population growth rate of 1.1% and a total fertility rate of 2.4 (UNESCAP 2016).
• More than half of the Indonesian population live in urban areas (54%) (ibid.). The country’s cities are growing rapidly, at a rate of 4.1% per year. By 2025 it is expected that 68% of its population will be living in cities (World Bank 2016).
• 13.8% of the rural population was lived below the rural poverty line in 2014, compared to 8.2% of the urban population who lived below the urban poverty line. The rural population are generally employed in low-productivity jobs in the agriculture and low-end service sectors (ADB 2015b).
• The Indonesian economy has shifted away from agriculture. In 1985, 54.7% of employed people worked in agriculture, 13.4% in industry, and 31.8% in services. By 2015 the percentages were 34.0%, 19.7%, and 44.8% respectively (ADB 2016). The agricultural sector lost 900,000 jobs in the decade preceding 2015 and urban employment has gradually overtaken rural employment, though many urban jobs which have been created are in the risky informal sector (ADB 2015a).
Indonesia Context
© Shutterstock/dmitry_islentev

| 3
• Internal migrants in Indonesia constitute a significant population. Nearly 9.8 million individuals were estimated to be temporary internal migrants in 20101 (Sukamdi and Mujahid 2015), though this number only represents migrants who moved in the 5 years prior to the 2010 census. This number significantly outstrips the number of international migrants from Indonesia, which is estimated at over 4.5 million (UNDESA 2017).
• From 2005-2010 Java proved to be the most attractive island for in-migrants, with 556,511 arrivals, but it nonetheless experienced net out-migration, as nearly a million migrants left Java (mostly for Sumatra) (Sukamdi and Mujahid 2015).
• Migration in Indonesia tends to be mostly rural-urban. In every province, the urban population has increased. However, information is still needed on what part of this “urbanization” has been the outcome of actual “migration” and how much is a result of the re-classification of some rural areas as urban due to development (ibid.).
• Migrants increasingly tend to move further away from their home. This might be explained by transport and communications improvements (ibid.).
• Greater Jakarta is expected to be particularly affected by climate change (especially through coastal flooding and increased cyclonic activity). As a result, internal migration may shift to other less at-risk urban areas, including other islands in Indonesia (ADB 2012). Research also indicates that climate variability in Indonesia will have a greater impact on short-distance population movements than long-distance ones (Thiede and Gray 2016).
Migrants’ Characteristics• Females outnumber males among married, divorced and widowed migrants but the proportion
of single male migrants is higher than that of single female migrants (Sukamdi and Mujahid 2015).
• The proportion of divorced and widowed female migrants is on average lower than that of the general population. However, among those above 60 years of age the proportion of divorced and widowed females is higher among migrants. This suggests that adult children are more likely to move with their mothers, particularly if their mothers are widowed or divorced and dependent on them (ibid.).
1 In the 2010 census, information on temporary internal migrants was obtained by asking the question: “In which regency/city and province did (NAME) live 5 years ago (MAY 2005)?” No information can therefore be obtained on migrants who may have moved between the reference year and date the census took place but returned to their original destination before that time. It is also not possible to tell if a migrant moved on multiple occasions. A person is classified as a migrant for life if the provincial or district / city where they were born is different from the provincial or district / city they are living in at the time the census was held (Sukamdi and Mujahid 2015).
© Shutterstock/Michal Knitl
4 |
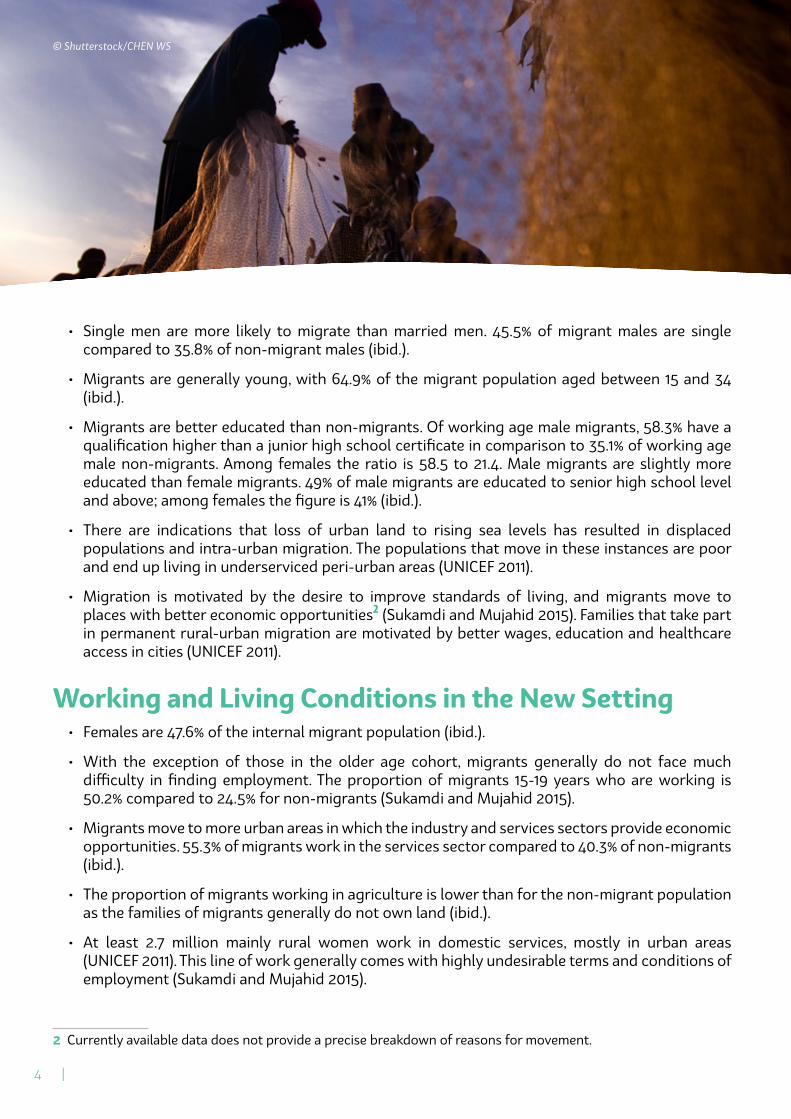
• Single men are more likely to migrate than married men. 45.5% of migrant males are single compared to 35.8% of non-migrant males (ibid.).
• Migrants are generally young, with 64.9% of the migrant population aged between 15 and 34 (ibid.).
• Migrants are better educated than non-migrants. Of working age male migrants, 58.3% have a qualification higher than a junior high school certificate in comparison to 35.1% of working age male non-migrants. Among females the ratio is 58.5 to 21.4. Male migrants are slightly more educated than female migrants. 49% of male migrants are educated to senior high school level and above; among females the figure is 41% (ibid.).
• There are indications that loss of urban land to rising sea levels has resulted in displaced populations and intra-urban migration. The populations that move in these instances are poor and end up living in underserviced peri-urban areas (UNICEF 2011).
• Migration is motivated by the desire to improve standards of living, and migrants move to places with better economic opportunities2 (Sukamdi and Mujahid 2015). Families that take part in permanent rural-urban migration are motivated by better wages, education and healthcare access in cities (UNICEF 2011).
Working and Living Conditions in the New Setting• Females are 47.6% of the internal migrant population (ibid.).
• With the exception of those in the older age cohort, migrants generally do not face much difficulty in finding employment. The proportion of migrants 15-19 years who are working is 50.2% compared to 24.5% for non-migrants (Sukamdi and Mujahid 2015).
• Migrants move to more urban areas in which the industry and services sectors provide economic opportunities. 55.3% of migrants work in the services sector compared to 40.3% of non-migrants (ibid.).
• The proportion of migrants working in agriculture is lower than for the non-migrant population as the families of migrants generally do not own land (ibid.).
• At least 2.7 million mainly rural women work in domestic services, mostly in urban areas (UNICEF 2011). This line of work generally comes with highly undesirable terms and conditions of employment (Sukamdi and Mujahid 2015).
2 Currently available data does not provide a precise breakdown of reasons for movement.
© Shutterstock/CHEN WS
| 5
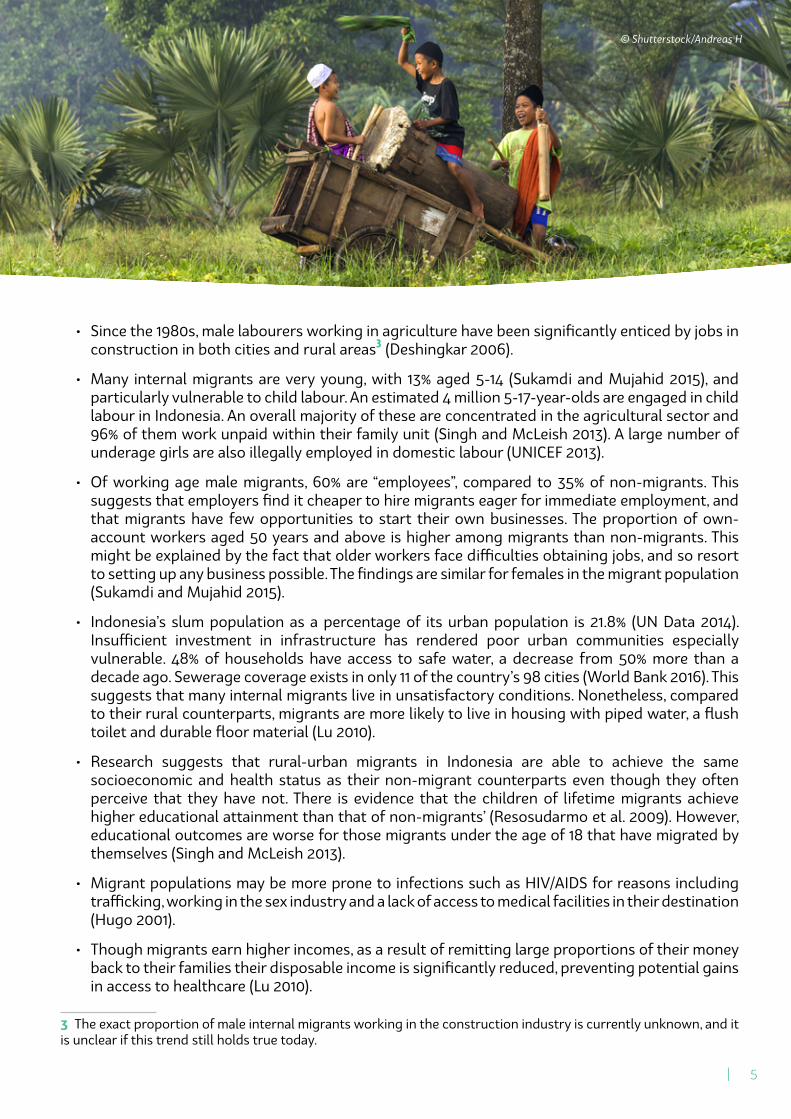
• Since the 1980s, male labourers working in agriculture have been significantly enticed by jobs in construction in both cities and rural areas3 (Deshingkar 2006).
• Many internal migrants are very young, with 13% aged 5-14 (Sukamdi and Mujahid 2015), and particularly vulnerable to child labour. An estimated 4 million 5-17-year-olds are engaged in child labour in Indonesia. An overall majority of these are concentrated in the agricultural sector and 96% of them work unpaid within their family unit (Singh and McLeish 2013). A large number of underage girls are also illegally employed in domestic labour (UNICEF 2013).
• Of working age male migrants, 60% are “employees”, compared to 35% of non-migrants. This suggests that employers find it cheaper to hire migrants eager for immediate employment, and that migrants have few opportunities to start their own businesses. The proportion of own-account workers aged 50 years and above is higher among migrants than non-migrants. This might be explained by the fact that older workers face difficulties obtaining jobs, and so resort to setting up any business possible. The findings are similar for females in the migrant population (Sukamdi and Mujahid 2015).
• Indonesia’s slum population as a percentage of its urban population is 21.8% (UN Data 2014). Insufficient investment in infrastructure has rendered poor urban communities especially vulnerable. 48% of households have access to safe water, a decrease from 50% more than a decade ago. Sewerage coverage exists in only 11 of the country’s 98 cities (World Bank 2016). This suggests that many internal migrants live in unsatisfactory conditions. Nonetheless, compared to their rural counterparts, migrants are more likely to live in housing with piped water, a flush toilet and durable floor material (Lu 2010).
• Research suggests that rural-urban migrants in Indonesia are able to achieve the same socioeconomic and health status as their non-migrant counterparts even though they often perceive that they have not. There is evidence that the children of lifetime migrants achieve higher educational attainment than that of non-migrants’ (Resosudarmo et al. 2009). However, educational outcomes are worse for those migrants under the age of 18 that have migrated by themselves (Singh and McLeish 2013).
• Migrant populations may be more prone to infections such as HIV/AIDS for reasons including trafficking, working in the sex industry and a lack of access to medical facilities in their destination (Hugo 2001).
• Though migrants earn higher incomes, as a result of remitting large proportions of their money back to their families their disposable income is significantly reduced, preventing potential gains in access to healthcare (Lu 2010).
3 The exact proportion of male internal migrants working in the construction industry is currently unknown, and it is unclear if this trend still holds true today.
© Shutterstock/Andreas H
6 |
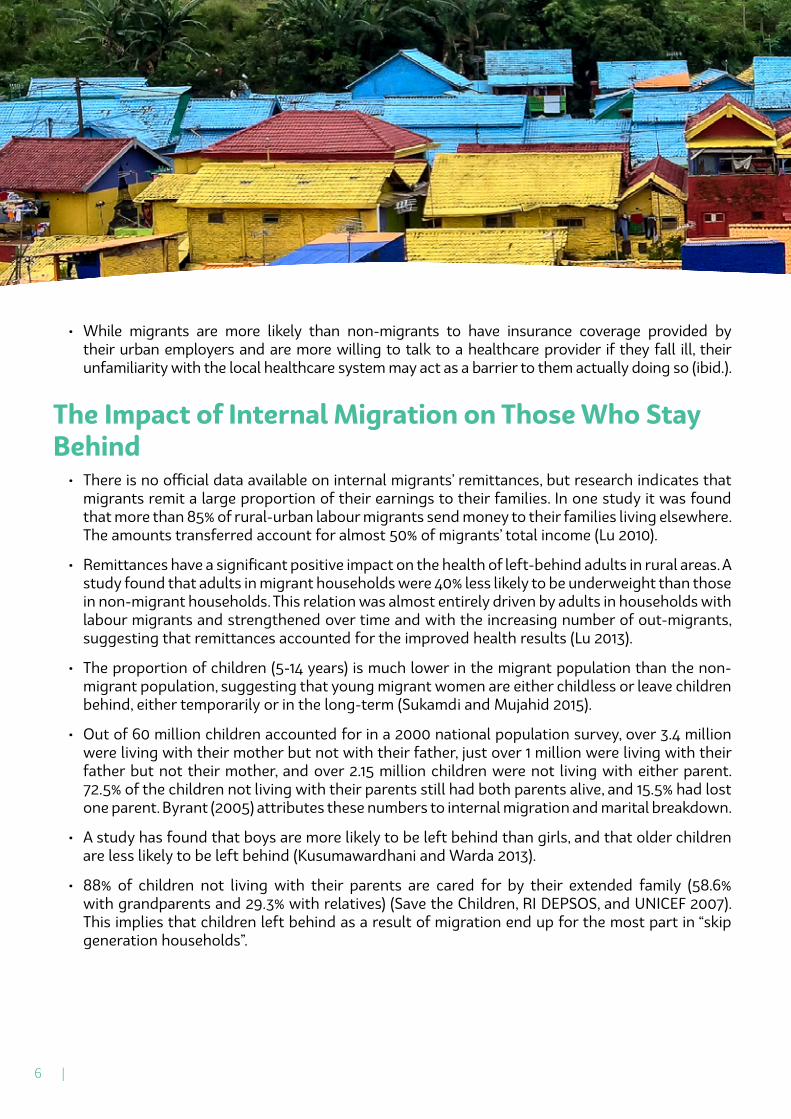
• While migrants are more likely than non-migrants to have insurance coverage provided by their urban employers and are more willing to talk to a healthcare provider if they fall ill, their unfamiliarity with the local healthcare system may act as a barrier to them actually doing so (ibid.).
The Impact of Internal Migration on Those Who Stay Behind
• There is no official data available on internal migrants’ remittances, but research indicates that migrants remit a large proportion of their earnings to their families. In one study it was found that more than 85% of rural-urban labour migrants send money to their families living elsewhere. The amounts transferred account for almost 50% of migrants’ total income (Lu 2010).
• Remittances have a significant positive impact on the health of left-behind adults in rural areas. A study found that adults in migrant households were 40% less likely to be underweight than those in non-migrant households. This relation was almost entirely driven by adults in households with labour migrants and strengthened over time and with the increasing number of out-migrants, suggesting that remittances accounted for the improved health results (Lu 2013).
• The proportion of children (5-14 years) is much lower in the migrant population than the non-migrant population, suggesting that young migrant women are either childless or leave children behind, either temporarily or in the long-term (Sukamdi and Mujahid 2015).
• Out of 60 million children accounted for in a 2000 national population survey, over 3.4 million were living with their mother but not with their father, just over 1 million were living with their father but not their mother, and over 2.15 million children were not living with either parent. 72.5% of the children not living with their parents still had both parents alive, and 15.5% had lost one parent. Byrant (2005) attributes these numbers to internal migration and marital breakdown.
• A study has found that boys are more likely to be left behind than girls, and that older children are less likely to be left behind (Kusumawardhani and Warda 2013).
• 88% of children not living with their parents are cared for by their extended family (58.6% with grandparents and 29.3% with relatives) (Save the Children, RI DEPSOS, and UNICEF 2007). This implies that children left behind as a result of migration end up for the most part in “skip generation households”.
• Given that net out-migration causes a shift in the age distribution towards both the youngest and older age cohorts, the dependency ratio increases in areas where net out-migration is highest (Sukamdi and Mujahid 2015).
ReferencesAsian Development Bank (ADB) (2012). Addressing Climate Change and Migration in Asia and the Pacific.
[online] Manila: Asian Development Bank. Available at: https://www.adb.org/sites/default/files/publication/29662/addressing-climate-change-migration.pdf.
ADB (2015a). Summary of Indonesia’s Economic Analysis. ADB Papers on Indonesia, No.2. [online] Jakarta, Indonesia. Available at: https://www.adb.org/sites/default/files/publication/177010/ino-paper-02-2015.pdf
ADB (2015b). Summary of Indonesia’s Poverty Analysis. ADB Papers on Indonesia, No.4. [online] Jakarta, Indonesia. Available at: https://www.adb.org/sites/default/files/publication/177017/ino-paper-04-2015.pdf
ADB (2016). Analysis of Trends and Challenges in the Indonesian Labor Market. ADB Papers on Indonesia, No.16. [online] Jakarta, Indonesia. Available at: https://www.adb.org/sites/default/files/publication/182935/ino-paper-16-2016.pdf
Bryant, J. (2005). Children of International Migrants in Indonesia, Thailand and the Philippines: A Review of Evidence and Policies. Innocenti Working Paper No. 2005-05. [online] Florence: UNICEF Innocenti Research Centre. Available at: https://www.unicef-irc.org/publications/381/
Deshingkar, P. (2006). Internal migration, poverty and development in Asia. Briefing Paper. [online] Institute of Development Studies (IDS), Overseas Development Institute (ODI). Available at: https://www.odi.org/sites/odi.org.uk/files/odi-assets/publications-opinion-files/5669.pdf.
Hugo, G. (2001). Population Mobility and HIV/AIDS in Indonesia. [online] UNDP South East Asia HIV and Development Office, ILO Indonesia, UNAIDS Indonesia. Available at: http://www.ilo.org/wcmsp5/groups/public/---asia/---ro-bangkok/---ilo-jakarta/documents/publication/wcms_141794.pdf.
Hugo, G. (2005). Migration in the Asia-Pacific region: A paper prepared for the Policy Analysis and Research Programme of the Global Commission on International Migration. [online] Global Commission on International Migration. Available at: https://www.iom.int/jahia/webdav/site/myjahiasite/shared/shared/mainsite/policy_and_research/gcim/rs/RS2.pdf.
International Labour Organization (ILO) (2013). 10 Years of Work on Labour Migration in Indonesia. [online] Jakarta, p.3. Available at: http://www.ilo.org/wcmsp5/groups/public/---asia/---ro-bangkok/---ilo-jakarta/documents/publication/wcms_213361.pdf.
Kusumawardhani, N. and Warda, N. (2013). Migration and The Incidence of Working Children: Evidence from Indonesia. SMERU Conference on Child Poverty and Social Protection. [online] SMERU. Available at: http://www.smeru.or.id/cpsp/Paper,%20Abstact,%20CV/0203_Niken-paper.pdf
© Shutterstock/Kadek Bonit Permadi
Lu, Y. (2010) Mental Health and Risk Behaviors of Rural-Urban Migrants: Longitudinal Evidence from Indonesia. Population Studies 64(2):147-163
Lu, Y. (2013). Household Migration, Remittances and Their Impact on Health in Indonesia. International Migration, 51, pp.202-215.
Resosudarmo, B., Suryahadi, A., Purnagunawan, R., Yumna, A. and Yusrina, A. (2009). The Socioeconomic and Health Status of Rural–Urban Migrants in Indonesia. [online] Jakarta: SMERU Research Institute. Available at: http://www.smeru.or.id/sites/default/files/publication/migrantworkers.pdf.
Save the Children, DEPSOS RI and UNICEF (2007). Someone that Matters: The Quality of Care in Childcare Institutions in Indonesia. [online] Available at: https://www.unicef.org/eapro/someone-that-matters.pdf.
Singh, S. and McLeish, S. (2013). Social protection and its effectieness in tackling child labour: the case of internal child migrants in Indonesia. SMERU Conference on Child Poverty and Social Protection Concerence. [online] SMERU. Available at: http://www.smeru.or.id/cpsp/Paper,%20Abstact,%20CV/0203_Simrin-paper.pdf
Sukamdi and Mujahid, G. (2015). UNFPA Indonesia Monograph Series: No.3, Internal Migration in Indonesia. UNFPA Indonesia Monograph Series. [online] Jakarta: UNFPA. Available at: http://indonesia.unfpa.org/en/publications/monograph-series-no-3-internal-migration-indonesia
Thiede, B. and Gray, C. (2016). Heterogeneous climate effects on human migration in Indonesia. Population and Environment. [online] Available at: https://proxy.library.upenn.edu:2320/article/10.1007/s11111-016-0265-8.
UN Data (2017). UNdata | record view | Slum population as percentage of urban, percentage. [online] Available at: http://data.un.org/Data.aspx?d=MDG&f=seriesRowID%3A710.
United Nations, Department of Economic and Social Affairs (UNDESA) (2017). International Migrant Stock: The 2017 Revision. [online] Available at: http://www.un.org/en/development/desa/population/migration/data/estimates2/estimates17.shtml
United Nations Economic and Social Commission for Asia and the Pacific (UNESCAP) (2016). ESCAP population data sheet. [online] Available at: http://www.unescap.org/sites/default/files/SPPS%20PS%20data%20sheet%202016%20v15-2.pdf
United Nations Children’s Emergeny Fund (UNICEF) (2011). The impacts of climate change on nutrition and migration affecting children in Indonesia. [online] Available at: https://www.unicef.org/eapro/Indonesia_climate_change_report.pdf
World Bank (2016). The Indonesia Urban Story. [online] Jakarta, Indonesia. Available at: http://pubdocs.worldbank.org/en/45281465807212968/IDN-URBAN-ENGLISH
This brief is part of a series of Policy Briefs on Internal Migration in Southeast Asia jointly produced by UNESCO, UNDP, IOM, and UN-Habitat. These briefs are part of an initiative aimed at researching and responding to internal migration in the region. The full set of briefs can be found at http://bangkok.unesco.org/content/policy-briefs-internal-migration-southeast-asia
© Shutterstock/Aizuddin Saad