Embed Size (px)
Citation preview
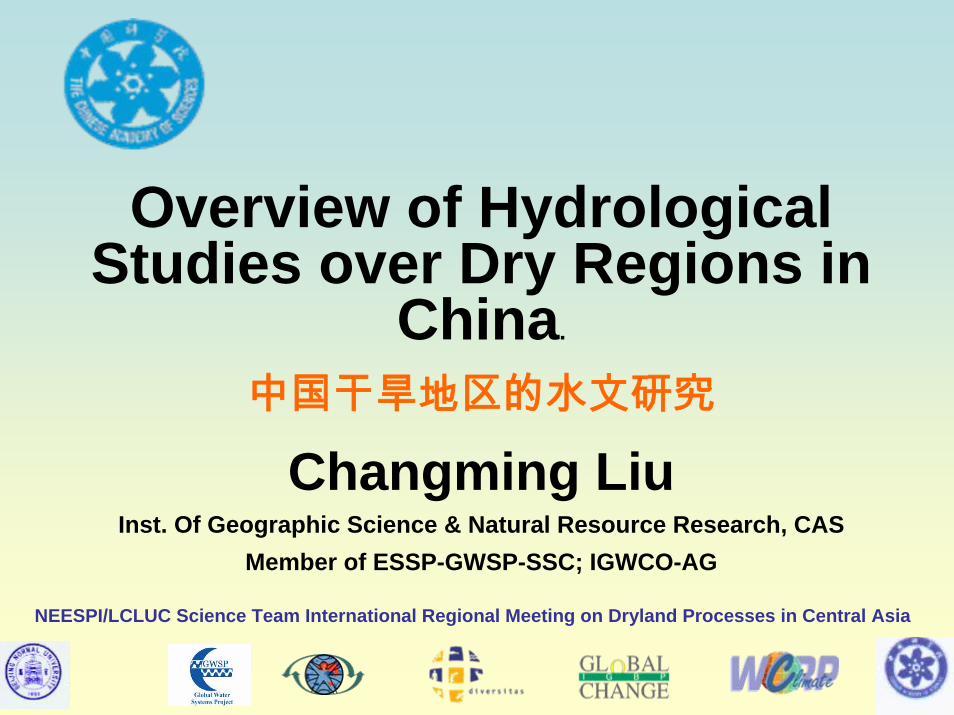
Overview of Hydrological Studies over Dry Regions in
China.
中国干旱地区的水文研究
Changming LiuInst. Of Geographic Science & Natural Resource Research, CAS
Member of ESSP-GWSP-SSC; IGWCO-AG
NEESPI/LCLUC Science Team International Regional Meeting on Dryland Processes in Central Asia

Table of Contents
Introduction
Development and eco-environment issues
Hydrologic Regime Features
Major Research Issues
Brief remarks

Northern Eurasia Science Partnership Initiative (NEESPI ) Area
Northern Eurasian Area

NDVI- Asia

Hydrological Regionalization of China
Where are dry land area in China?

水循环示意图
6189
Water Cycle in China 全球水循环示意图
6189
2712
3478
700
116 2686
56
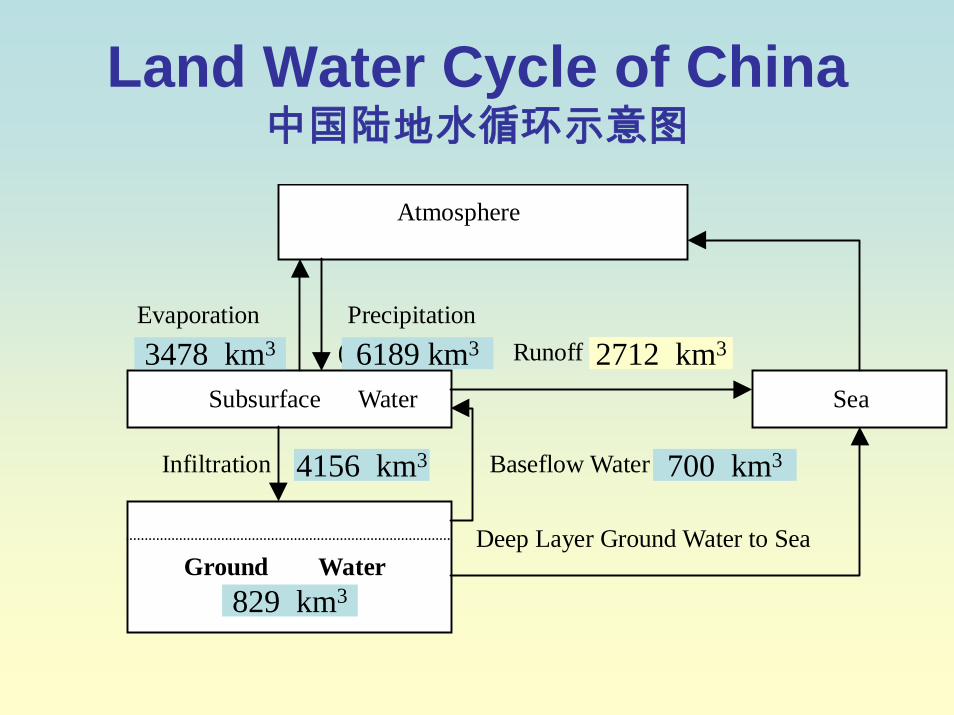
Land Water Cycle of China中国陆地水循环示意图
Evaporation Precipitation (6048 KM3/yr) Runoff (2711KM3/yr) Infiltration (828KM3/yr) Baseflow Water (700 KM3/yr) Deep Layer Ground Water to Sea
Atmosphere
Subsurface Water Sea
Ground Water
6189 km3 2712 km3
4156 km3
3478 km3
829 km3
700 km3
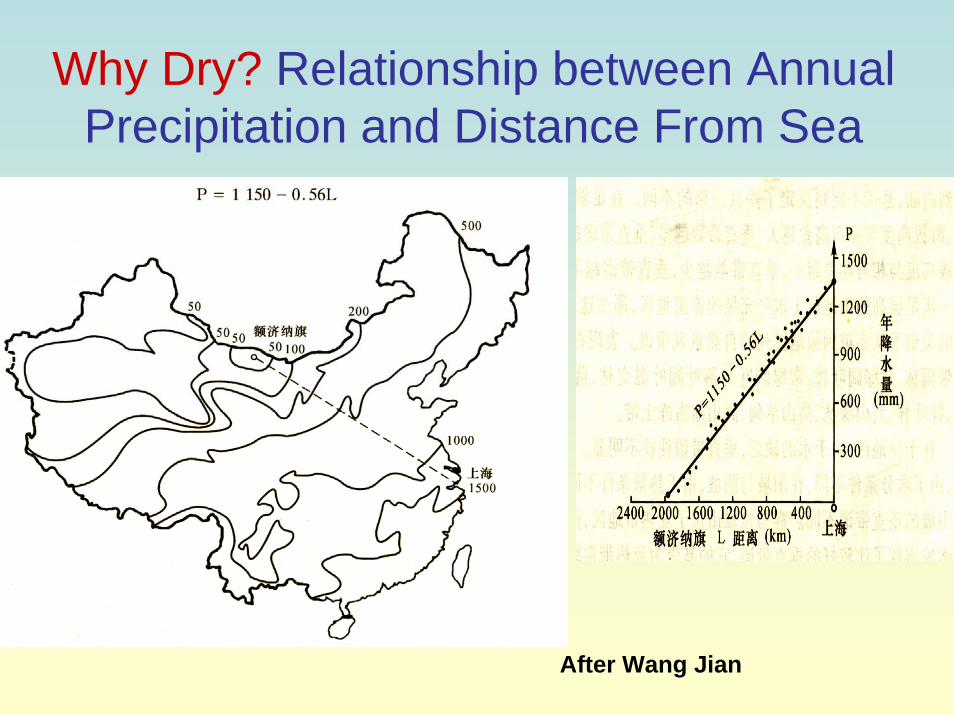
Why Dry? Relationship between Annual Precipitation and Distance From Sea
After Wang Jian
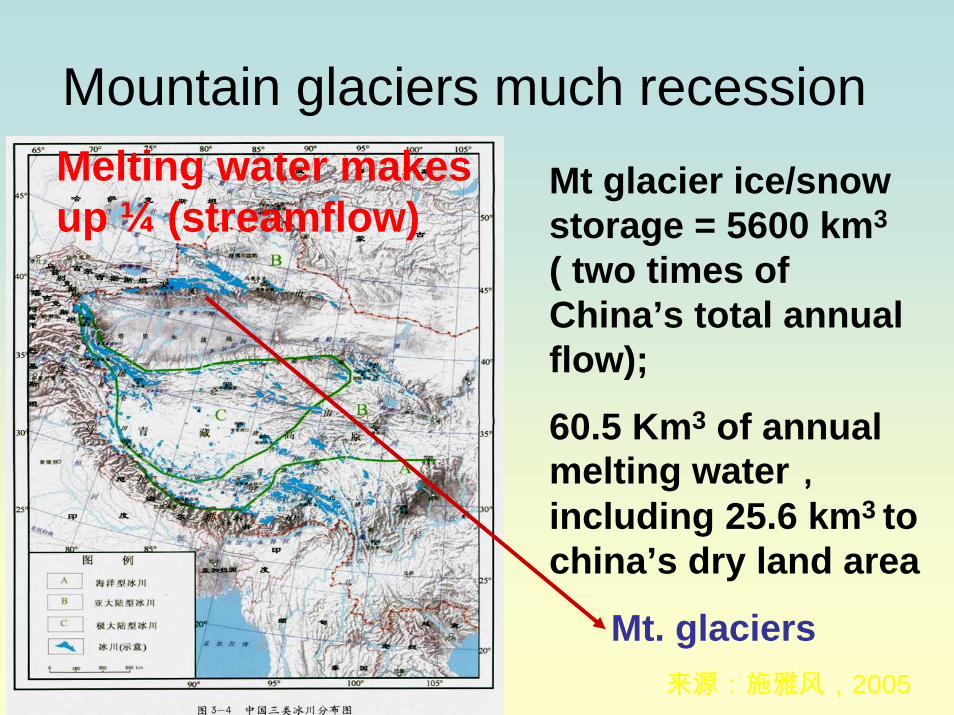
Mountain glaciers much recessionMt glacier ice/snow storage = 5600 km3
( two times of China’s total annual flow);
60.5 Km3 of annual melting water,including 25.6 km3 to china’s dry land area
Mt. glaciers来源:施雅风,2005
Melting water makes up ¼ (streamflow)

We are just here in developing area of China’s dry land regions
Urumqi City in Remote West Desert of China Has Expanded: as the Largest City in the Central Asia
• Location in the Northwestern,Northern and Northeastern China;
• Dry land area in China amounts to above 3.5 million km2, including semi-arid lands;
• Urumqi south is just the center of whole Asia.
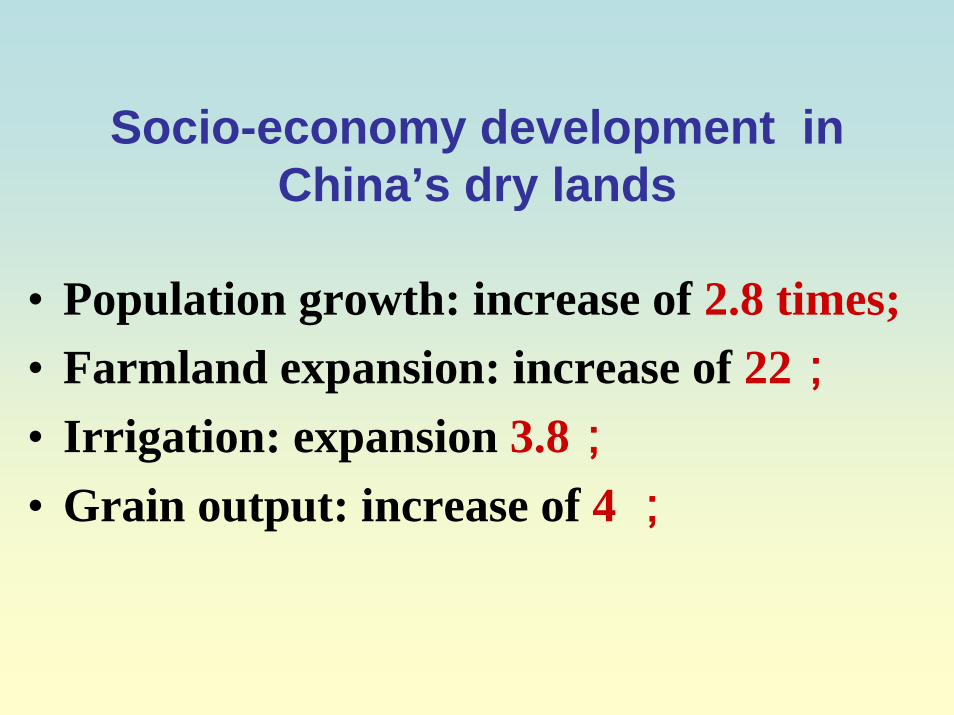
Socio-economy development in China’s dry lands
• Population growth: increase of 2.8 times;• Farmland expansion: increase of 22;• Irrigation: expansion 3.8;• Grain output: increase of 4 ;

西北沙漠与沙漠化
植被破坏水土流失 牧场退化草原沙化
地下水枯胡杨林死亡
Lespedeza (Huyang)
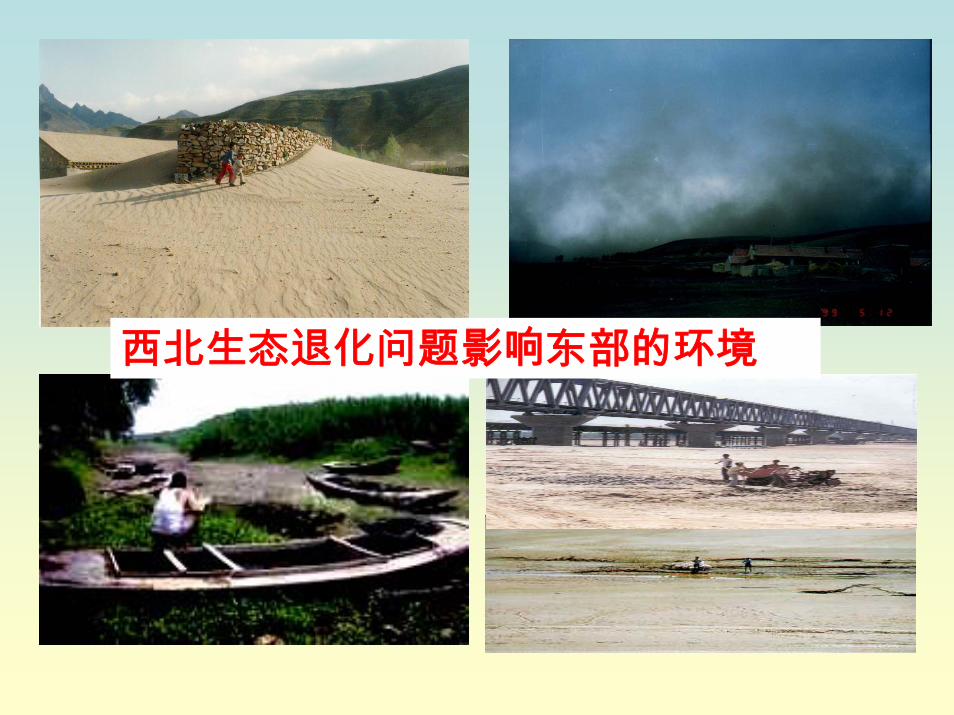
西北生态退化问题影响东部的环境
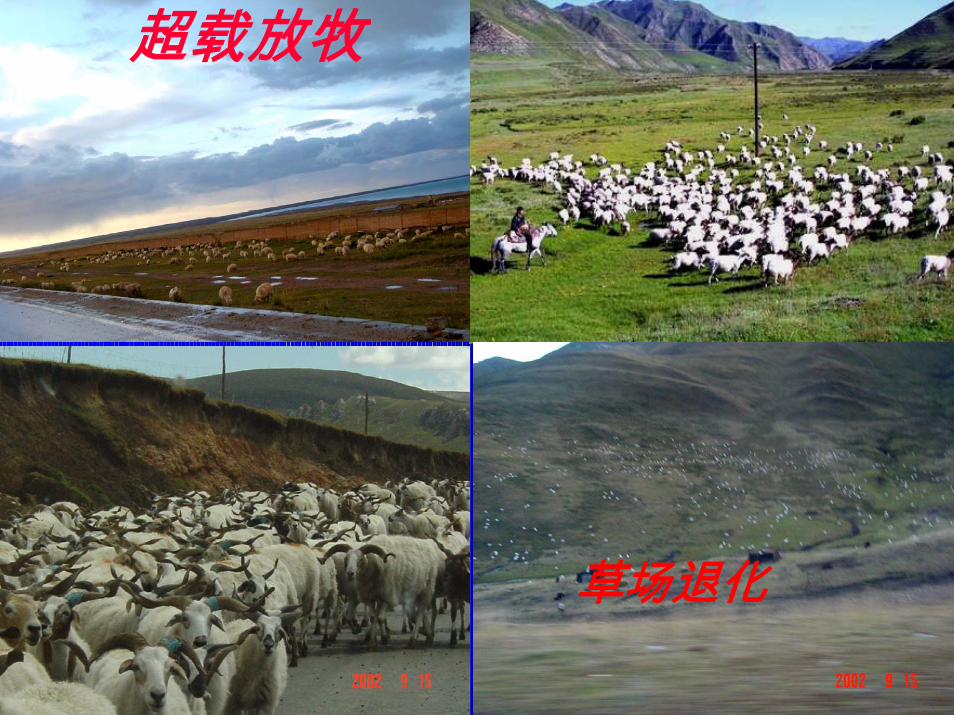
超载放牧
草场退化
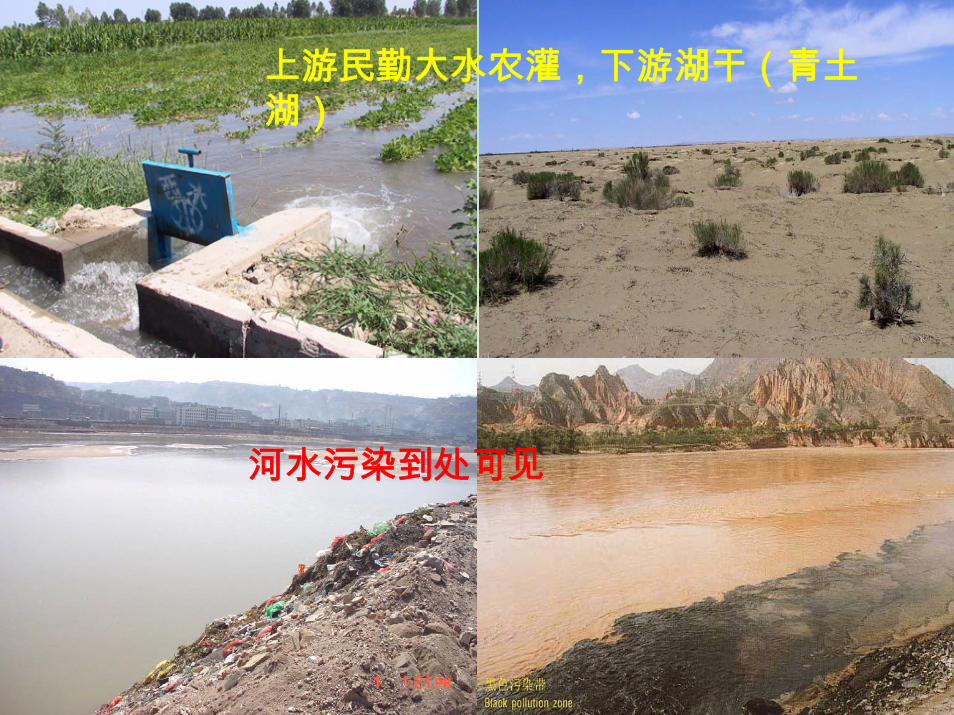
河水的污染
上游民勤大水农灌,下游湖干(青土湖)
河水污染到处可见

超采地下水,地下水位下降,井干枯
绿了农田,黄了树林
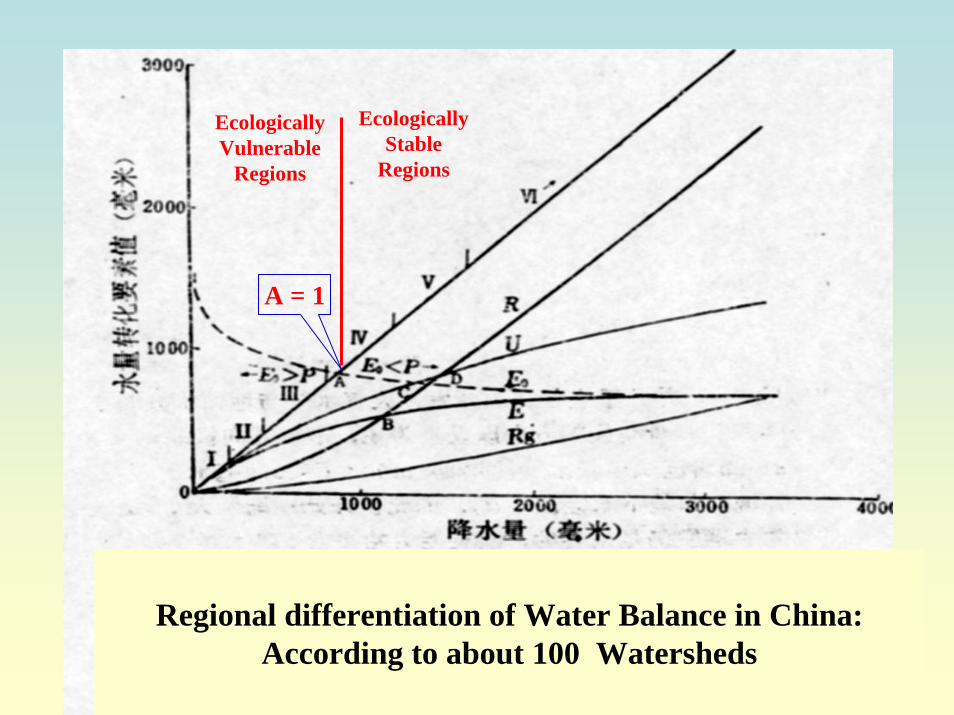
Regional differentiation of Water Balance in China:According to about 100 Watersheds
A = 1
EcologicallyVulnerable
Regions
EcologicallyStable
Regions
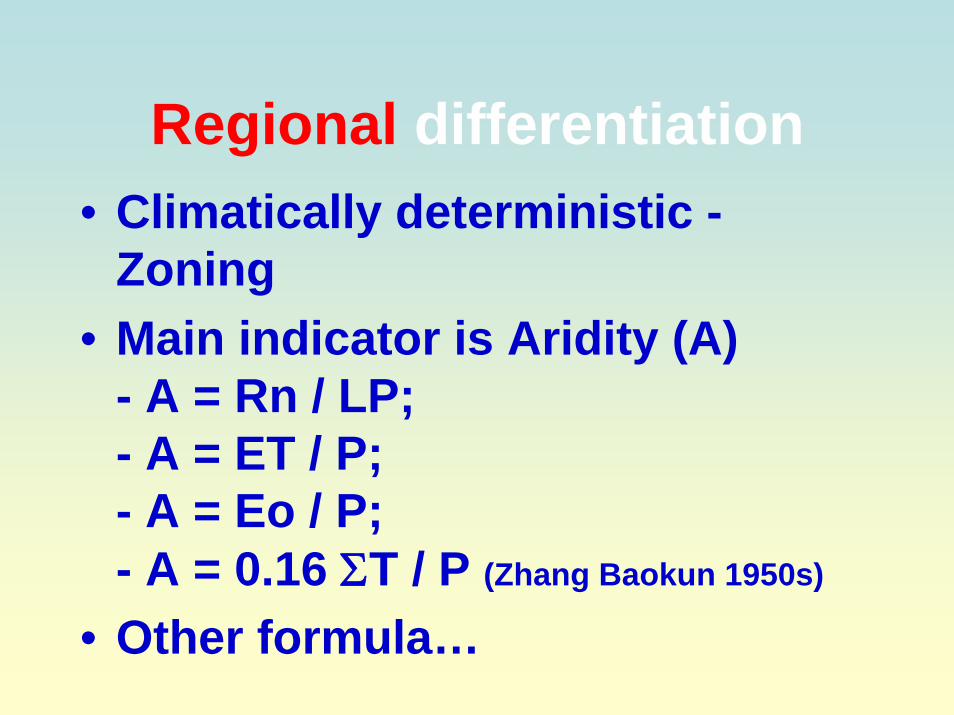
Regional differentiation• Climatically deterministic -
Zoning• Main indicator is Aridity (A)
- A = Rn / LP; - A = ET / P; - A = Eo / P; - A = 0.16 ΣT / P (Zhang Baokun 1950s)
• Other formula…
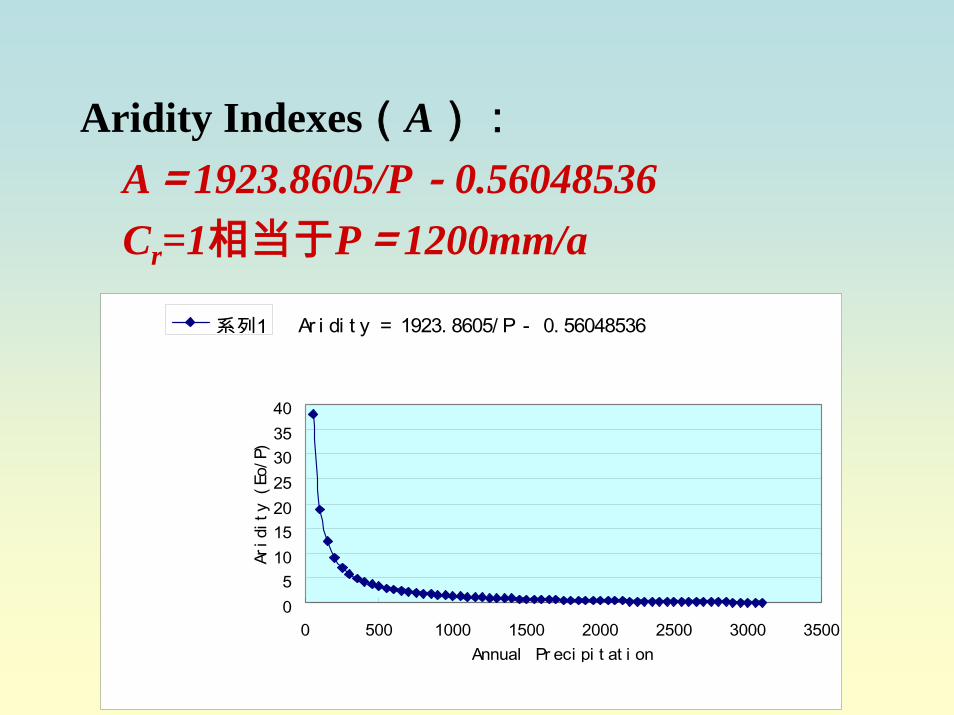
Aridity Indexes(A):A=1923.8605/P-0.56048536Cr=1相当于P=1200mm/a
Ar i di t y = 1923. 8605/ P - 0. 56048536
05
10152025303540
0 500 1000 1500 2000 2500 3000 3500Annual Pr eci pi t at i on
Arid
ity
(Eo/
P)
系列1
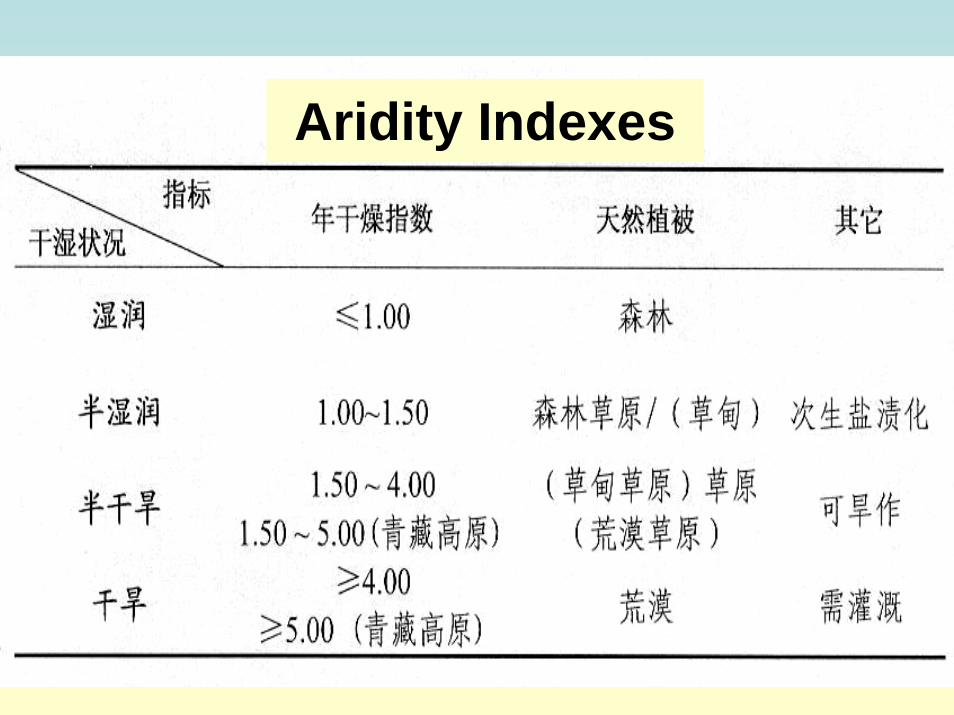
Aridity Indexes

欧洲的计算
Falkenmark Index

Cv Comparison between the dry and the wet rivers basins
dry
wet

Table: A comparison of the variation coefficient (Cv) of water cycle components indry and wet watersheds.
Coefficient of variation of annual water cycle components(Cv)Watersheds
Precipitation (P) Evapotranspiration(E) Runoff (R)
Dry (P < 500 mm) 0.40 0.39 0.88Wet (P > 1200
mm) 0.19 0.06 0.27
P, ET,R variation coefficient (Cv )
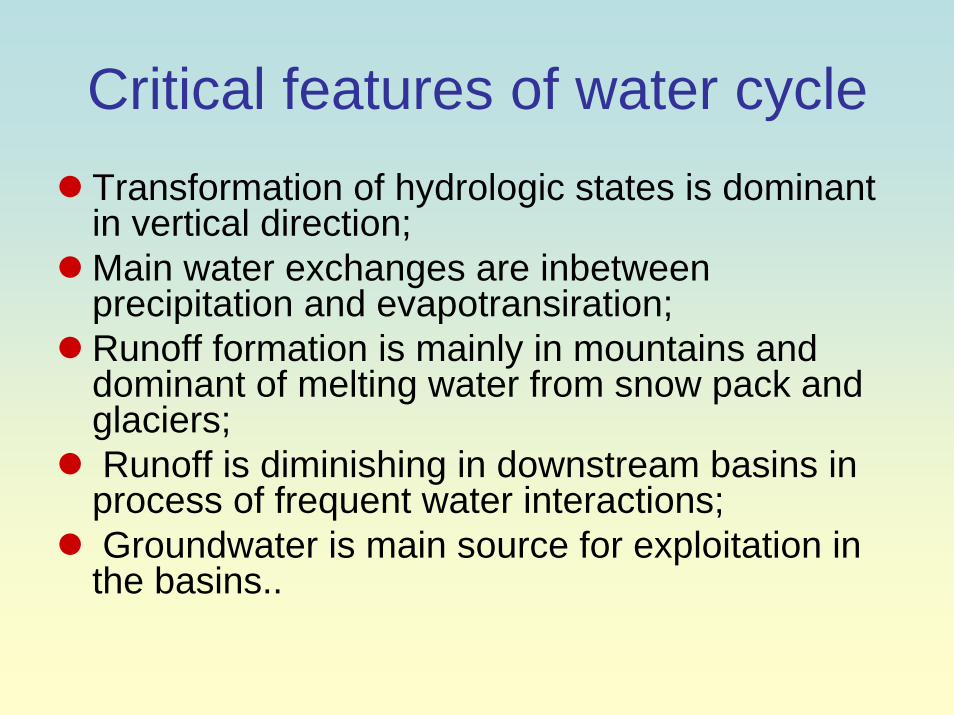
Critical features of water cycleTransformation of hydrologic states is dominant in vertical direction;Main water exchanges are inbetweenprecipitation and evapotransiration;Runoff formation is mainly in mountains and dominant of melting water from snow pack and glaciers;Runoff is diminishing in downstream basins in process of frequent water interactions;Groundwater is main source for exploitation in the basins..
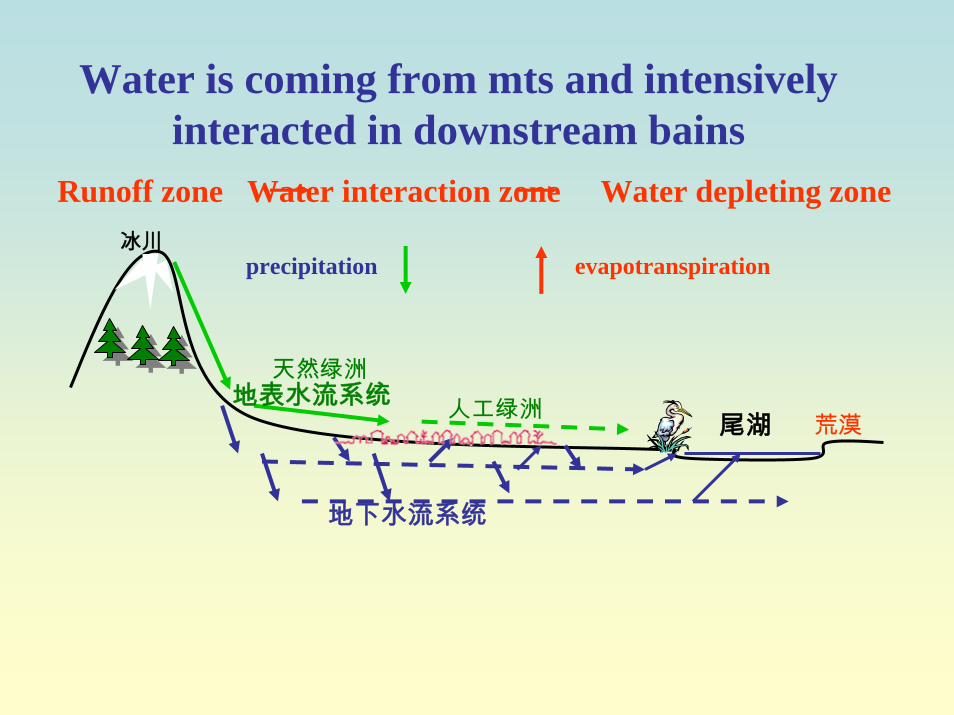
Water is coming from mts and intensivelyinteracted in downstream bains
冰川
地下水流系统
地表水流系统尾湖
Runoff zone Water interaction zone Water depleting zone
precipitation evapotranspiration
荒漠人工绿洲天然绿洲

Lake
RS RG
WiWi
W(d), W(p) Wn
RS RG
WEWn(In-stream / Inside channels)Wi ( Linked /Interacted)WE (Uplands Outside of
channels)
W(d) domestic sector W(p) production sector
RS:surface runoffRG:subsurface runoff
PE蒸发evapotranspiration
E E
P降水 precipitation
(Eco-environment Flows)
To better understand river flows interacting with the eco-environment
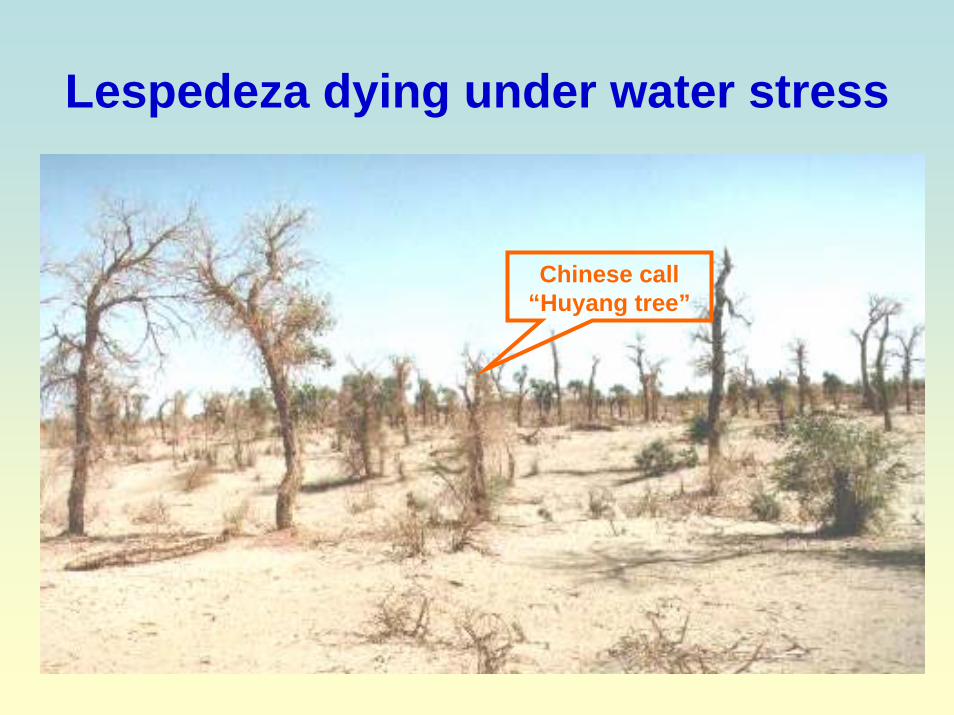
Lespedeza dying under water stress
Chinese call “Huyang tree”
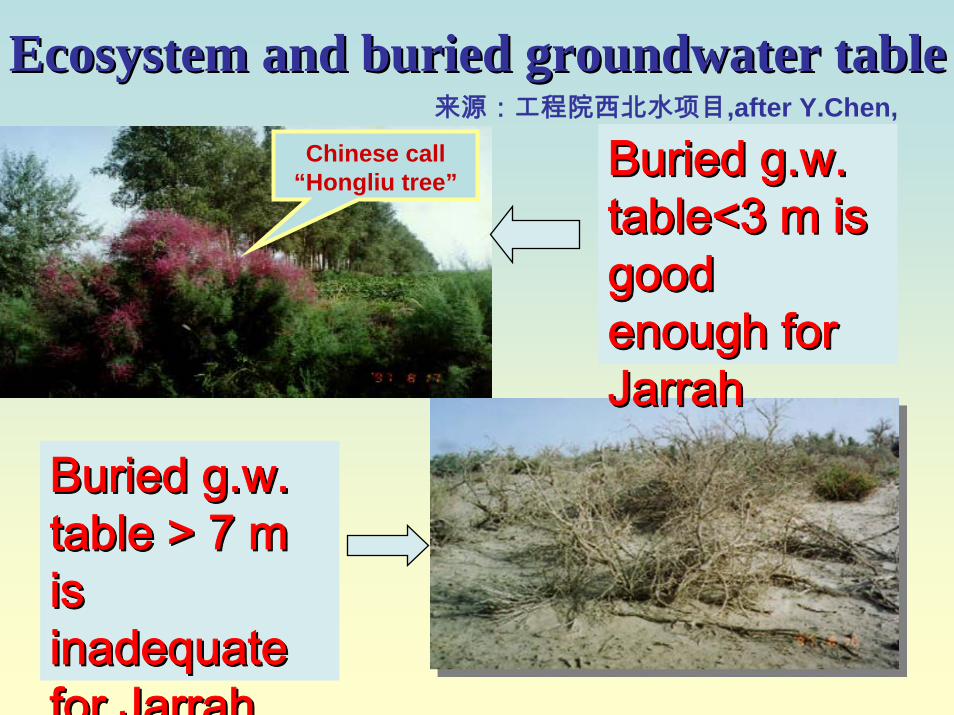
Ecosystem and buried groundwater tableEcosystem and buried groundwater table
Buried Buried g.wg.w. . table<3 m is table<3 m is good good enough for enough for JarrahJarrah
Buried Buried g.wg.w. . table > 7 m table > 7 m is is inadequate inadequate forfor JarrahJarrah
Chinese call “Hongliu tree”
来源:工程院西北水项目,after Y.Chen,

0
0. 1
0. 2
0. 3
0. 4
0. 5
0. 6
0. 7
0. 8
0. 9
1
10 8 5 3. 5 2. 8
地下水埋深( m)
胡杨
林质
量状
态
来源:工程院西北水项目,after Y.Chen,
“HUYANG” growth & buried g.w. tables
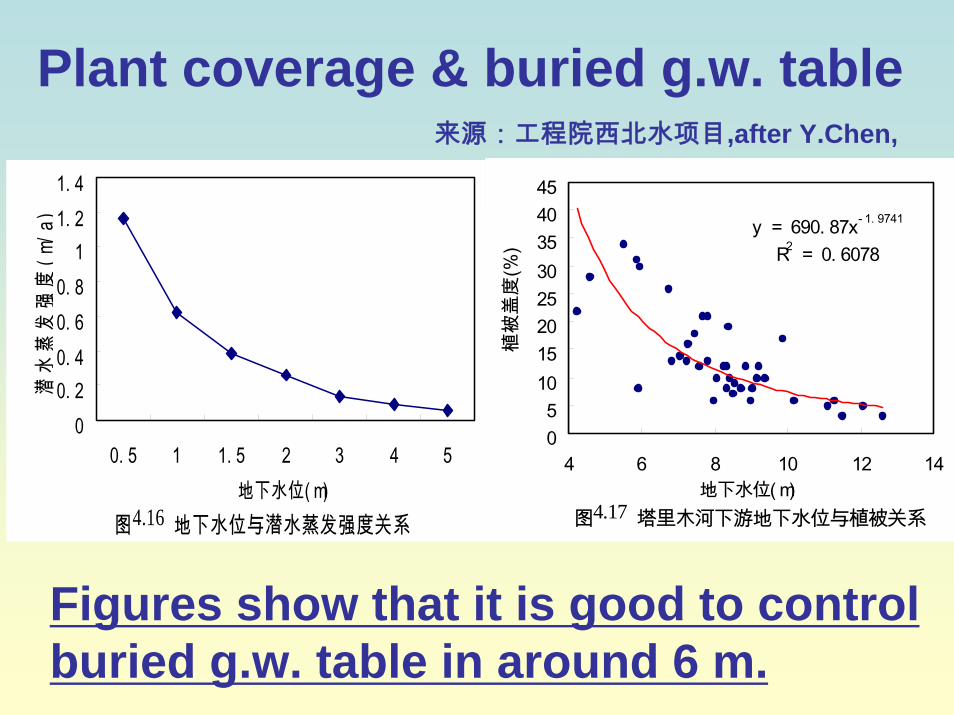
图4.16 地下水位与潜水蒸发强度关系
00. 20. 40. 60. 8
11. 21. 4
0. 5 1 1. 5 2 3 4 5地下水位( m)
潜水
蒸发
强度
(m/a
)
图4.17 塔里木河下游地下水位与植被关系
y = 690. 87x- 1. 9741
R2 = 0. 6078
05
1015202530354045
4 6 8 10 12 14地下水位( m)
植被
盖度
(%)
Plant coverage & buried g.w. table 来源:工程院西北水项目,after Y.Chen,
Figures show that it is good to control buried g.w. table in around 6 m.

地下潜水的动态平衡曲线
A model for regulating / balancing recharge & evaporation by controlling groundwater table :
FS-ET
Max recharge

dFS / dh = 0,h = Hm,
Dg = 10000 μ (Hc - h), (h < Hc)
As figure shown, we get:
[ ] 0/)()(0)()(
)( 32
=−>−
++++=
dhhEThFSdhEThFS
khjhnhmhFS LL..

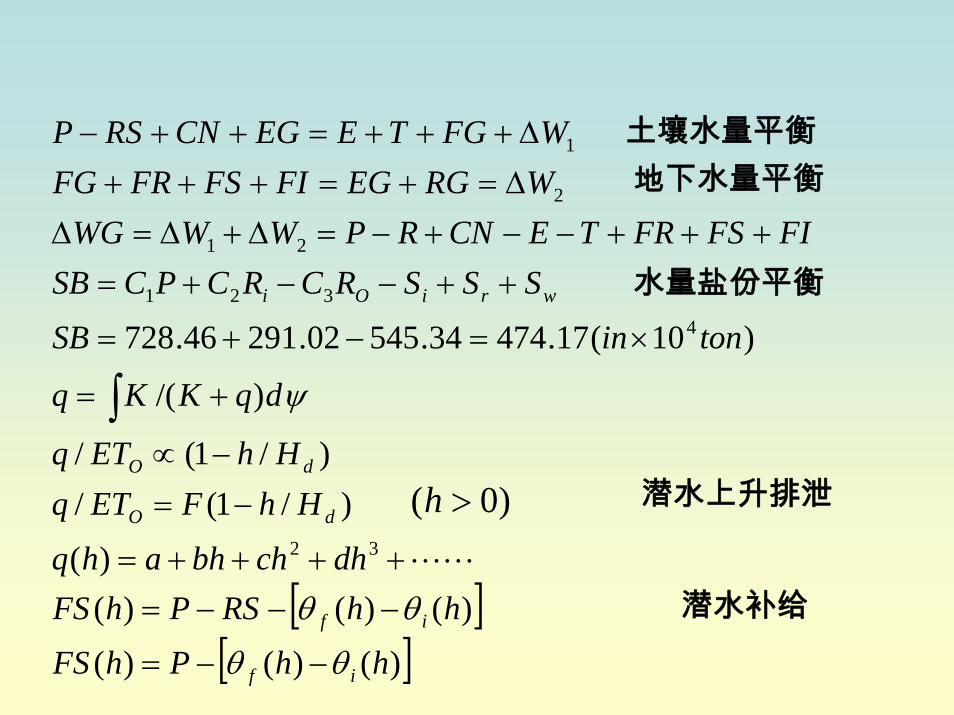
水循环中的水分与盐分运动的关系
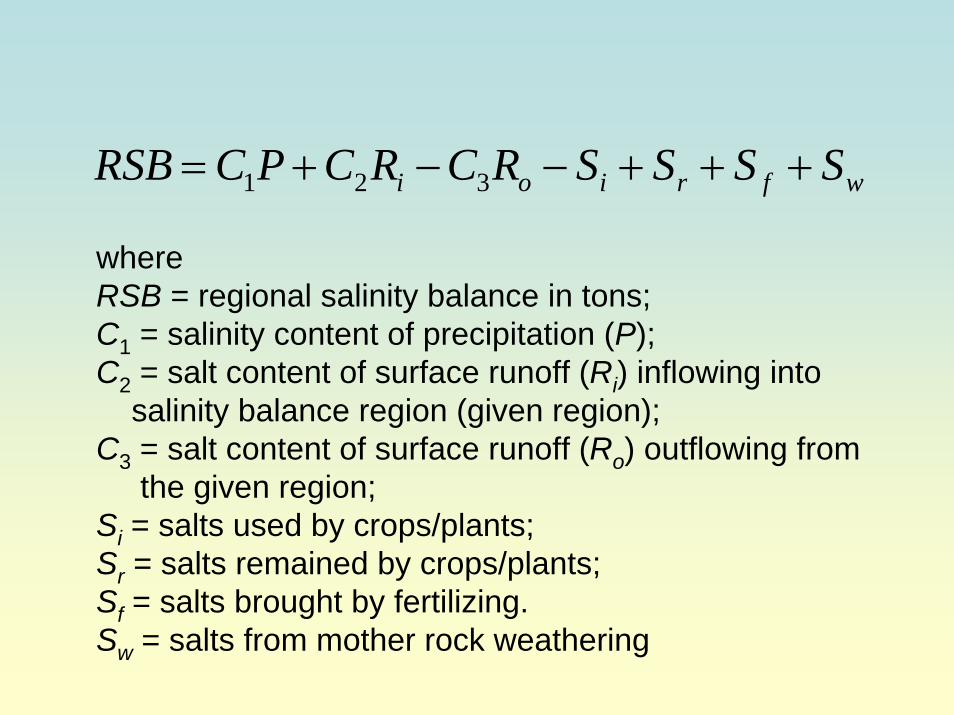
whereRSB = regional salinity balance in tons;C1 = salinity content of precipitation (P);C2 = salt content of surface runoff (Ri) inflowing into
salinity balance region (given region);C3 = salt content of surface runoff (Ro) outflowing from
the given region;Si = salts used by crops/plants;Sr = salts remained by crops/plants;Sf = salts brought by fertilizing.Sw = salts from mother rock weathering
wfrioi SSSSRCRCPCRSB +++−−+= 321
[ ][ ])()()(
)()()()(
)/1(/)/1(/
)/(
)10(17.47434.54502.29146.728
32
4321
21
2
1
hhPhFS
hhRSPhFSdhchbhahq
HhFETqHhETq
dqKKq
toninSB
SSSRCRCPCSBFIFSFRTECNRPWWWG
WRGEGFIFSFRFGWFGTEEGCNRSP
if
if
dO
dO
wriOi
θθ
θθ
ψ
−−=
−−−=++++=
−=−∝
+=
×=−+=
++−−+=+++−−+−=Δ+Δ=Δ
Δ=+=+++Δ+++=++−
∫
LL
)0( >h
土壤水量平衡地下水量平衡
水量盐份平衡
潜水上升排泄
潜水补给

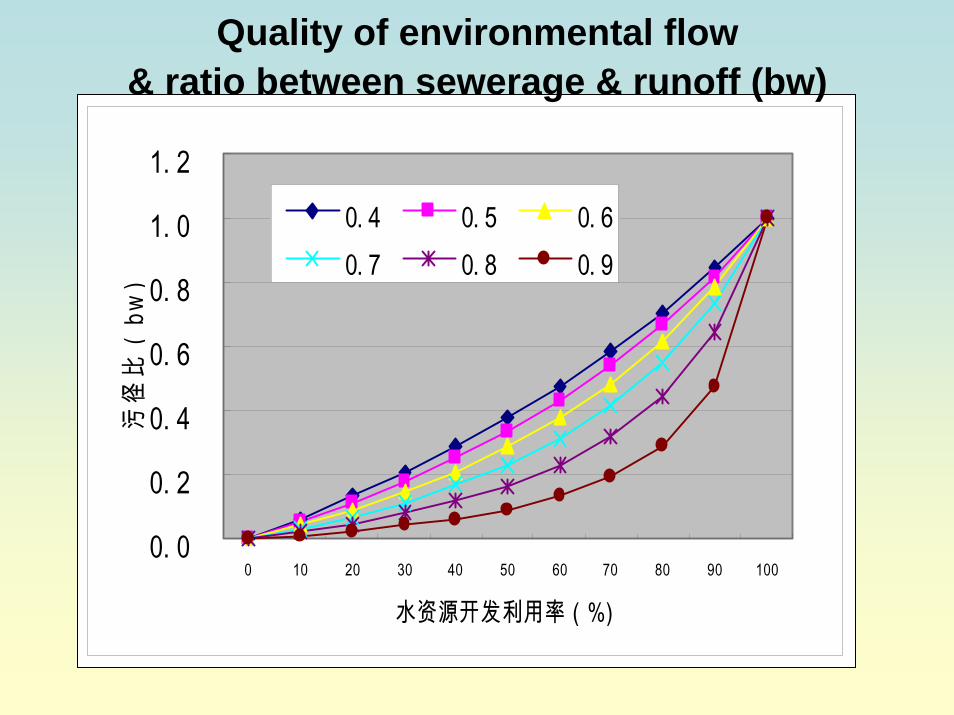
Water Competition estimation: A case of Xinjiang Uigur Auto. region
Water exploitation rate:u = 70 %Water returning rate:r = 30%
)1(1)(1 ruuruEa −−=−−=
Ea = part rate of streamflow remaining for the ecosystems, Ea = 51%
0. 0
0. 2
0. 4
0. 6
0. 8
1. 0
1. 2
0 10 20 30 40 50 60 70 80 90 100
水资源开发利用率(%)
污径
比(
bw)
0. 4 0. 5 0. 60. 7 0. 8 0. 9
Quality of environmental flow & ratio between sewerage & runoff (bw)

绿水
蓝水
用水的耗散
降水--实在水资源
After Malin FalkenmarkGWSP SSC Green & Blue Water
陆地宏观估计——绿水与蓝水的估算
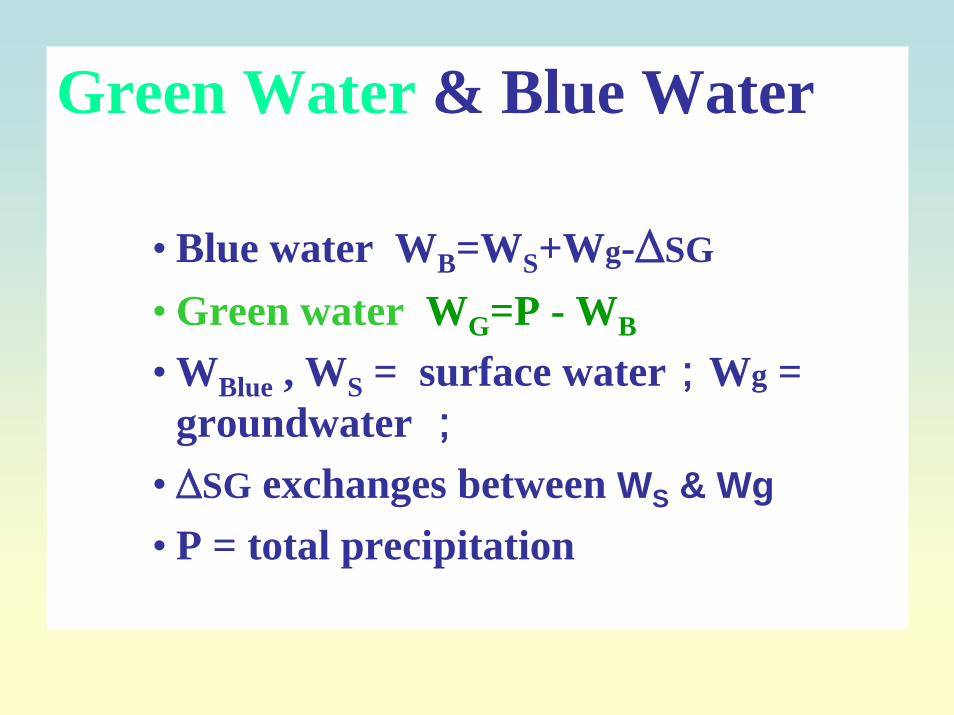
Green Water & Blue Water
• Blue water WB=WS+Wg-∆SG
• Green water WG=P - WB
• WBlue , WS = surface water;Wg = groundwater ;
• ∆SG exchanges between WS & Wg• P = total precipitation
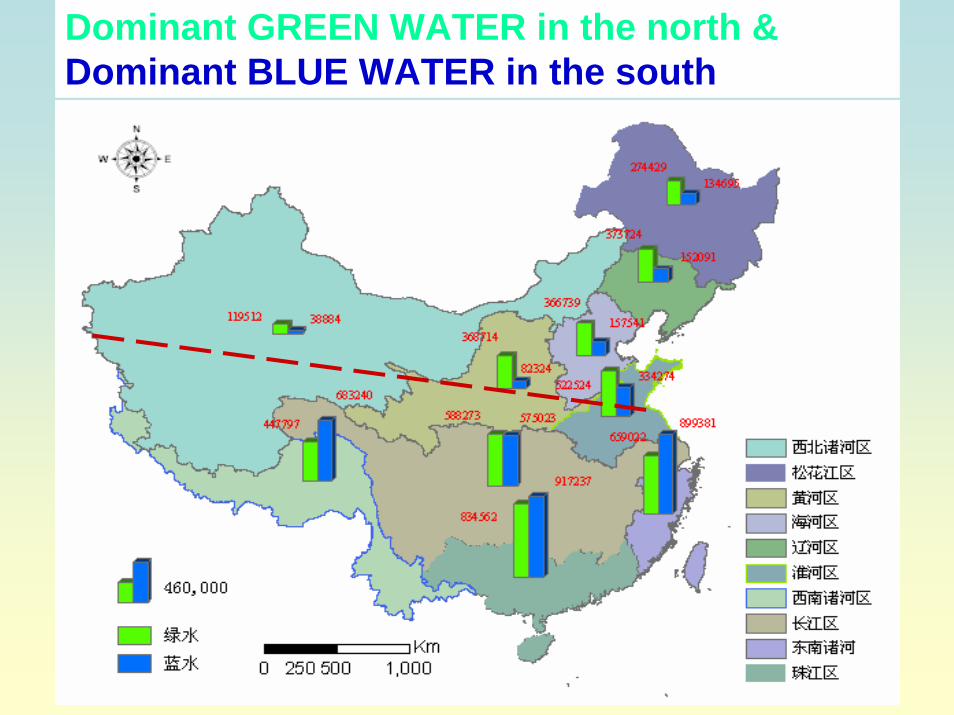
Dominant GREEN WATER in the north & Dominant BLUE WATER in the south
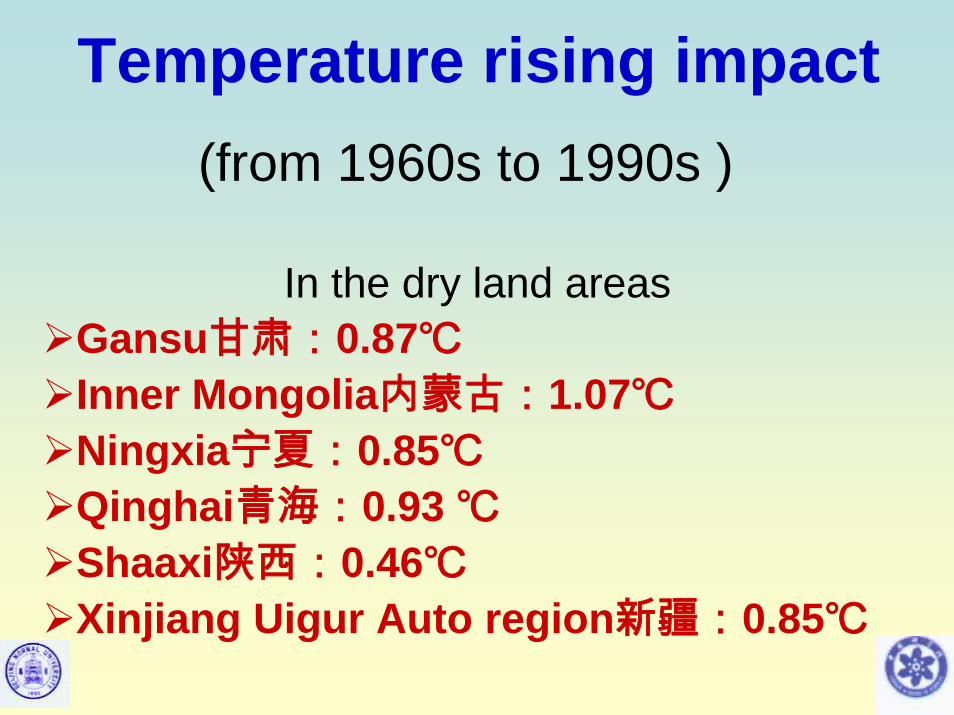
(from 1960s to 1990s )
In the dry land areasGansu甘肃:0.87℃Inner Mongolia内蒙古:1.07℃Ningxia宁夏:0.85℃Qinghai青海:0.93 ℃Shaaxi陕西:0.46℃Xinjiang Uigur Auto region新疆:0.85℃
Temperature rising impact
Precipitation has increased in Xinjiang since end of last century;
In Xinjiang It’s likely to be a warm-wet scenario, but eastern part is still warm-dry;
The Mt. glaciers are recessive obviously

1.Water shortage is the most crucial issue in development of dry land regions
2. The ecosystem degradation is common challenge for sustainable development in the dry land areas
3.Rational water allocation is urgent need for high competition in the water supply shared by various sectors

4. Hydrological responses to climate change impact are characterized by non-linearity and geographical differentiation in large extent of North Eurasia.
5. It’s necessary to distinguish climate change influence from human activities impact and to let decision makers to take countermeasures accordingly.
6. Hydrological cycle can provide a base for rational water management
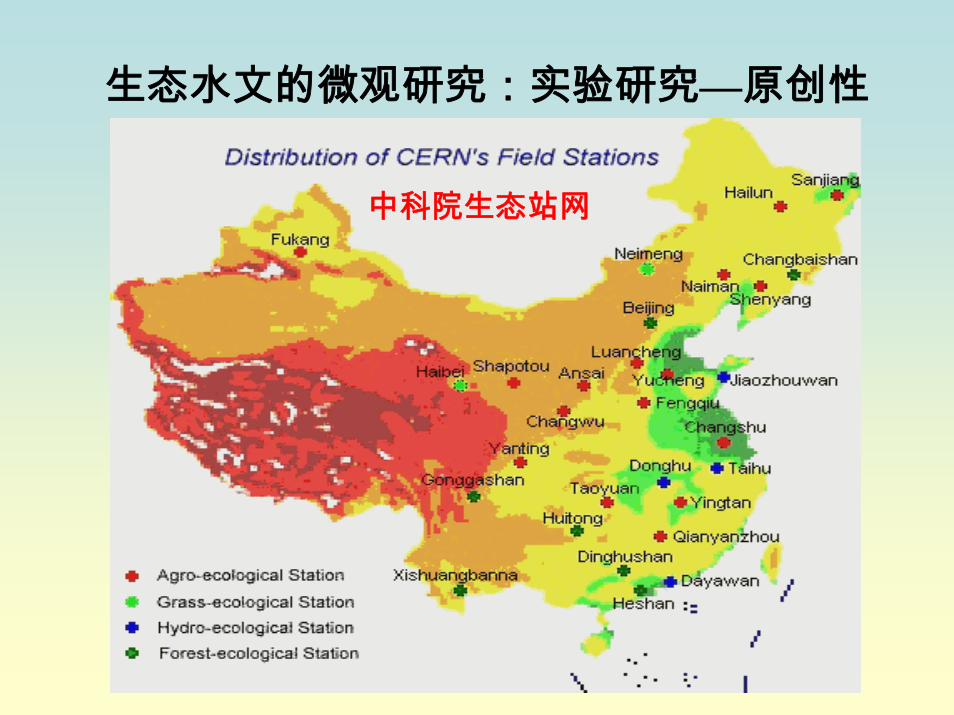
生态水文的微观研究:实验研究—原创性
中科院生态站网
Thanks for attention!

仅供参考,谢谢!


![Prehistoric Interactions in Eurasia: A Re-evaluation of ...Xinjiang Wenwu Kaogu Yanjiusuo [Xinjiang Institute of Archaeology] (Urumqi: Xinjiang meishu shejing chubanshe 1997: 44-56)](https://img.pdfslide.us/doc/110x75/5f18bffb0b48650cc441aaeb/prehistoric-interactions-in-eurasia-a-re-evaluation-of-xinjiang-wenwu-kaogu.jpg)