Embed Size (px)
Citation preview

Energy Efficiency & Renewable Energy
Sunita Sunita SatyapalSatyapalActing Program ManagerActing Program Manager
DOE Fuel Cell Technologies ProgramDOE Fuel Cell Technologies Program
Update for HTACUpdate for HTACNovember 5, 2009November 5, 2009
Overview of Hydrogen and Fuel Cell Activities

2
Fuel Cells — Where are we today?
Fuel Cells for Transportation
Production & Delivery of HydrogenIn the U.S., there are currently:
~9 million metric tons of H2 produced annually
> 1200 miles of H2 pipelines
Fuel Cells for Stationary Power, Auxiliary Power, and Specialty Vehicles
Fuel cells can be a cost-competitive option for critical-load facilities,
backup power, and forklifts.
The largest markets for fuel cells today are in stationary power, portable power, auxiliary power units, and forklifts.~52,000 fuel cells have been shipped worldwide.
~18,000 fuel cells were shipped in 2008 (> 50% increase over 2007).
In the U.S., there are currently:> 200 fuel cell vehicles > 20 fuel cell buses~ 60 fueling stations
A variety of technologies—including fuel cell vehicles, extended-range electric vehicles (or “plug-in hybrids”),
and all-battery powered vehicles—will be needed to meet our diverse transportation needs.
The most appropriate technology depends on the drive cycle and duty cycle of the application.
3
$100M
$200M
H2 Production & Delivery R&D
H2 Storage R&D
Fuel Cell R&D
Technology Validation
Crosscutting Activities*
= Congressionally Directed Activities
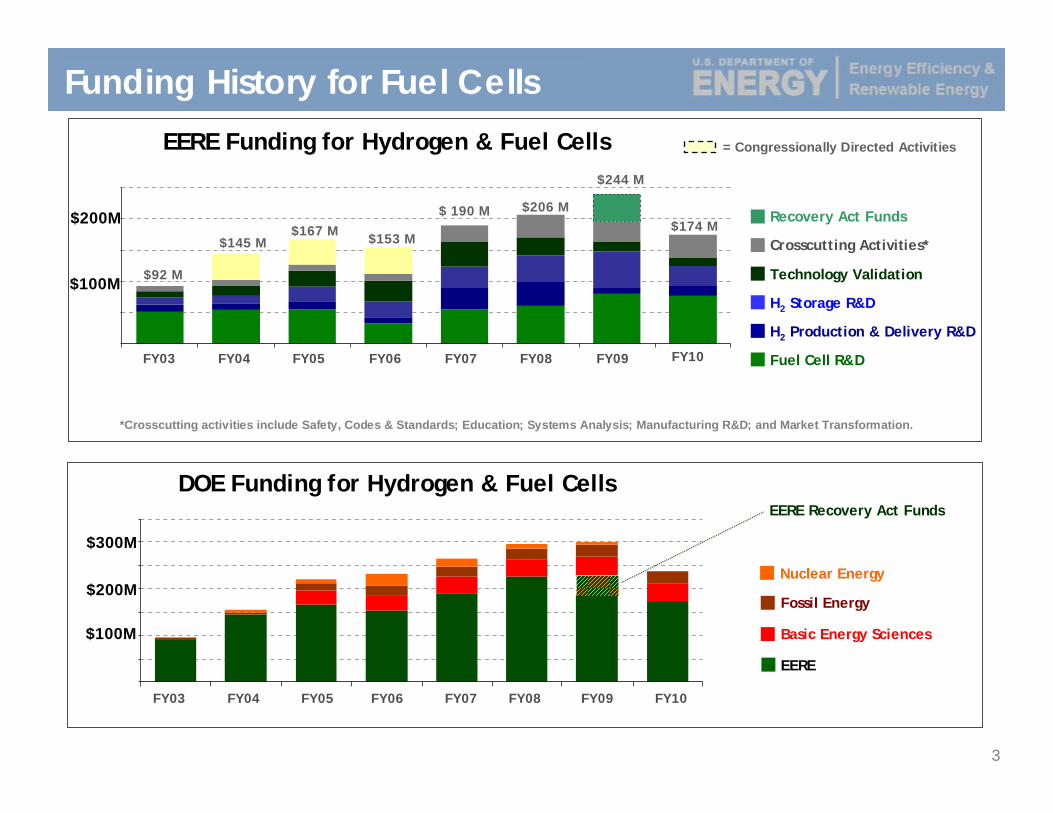
Funding History for Fuel Cells
*Crosscutting activities include Safety, Codes & Standards; Education; Systems Analysis; Manufacturing R&D; and Market Transformation.
$ 190 M
$153 M$167 M
$244 M
$206 M
$145 M
Recovery Act Funds$174 M
EERE
Basic Energy Sciences
Fossil Energy
Nuclear Energy
EERE Recovery Act Funds
$100M
$200M
$300M
$92 M
FY03 FY04 FY05 FY06 FY07 FY08 FY09 FY10
FY03 FY04 FY05 FY06 FY07 FY08 FY09 FY10
EERE Funding for Hydrogen & Fuel Cells
DOE Funding for Hydrogen & Fuel Cells

4
Budget — EERE Key Activities
EERE Hydrogen and Fuel Cells Budget (in thousands)
$174,000
15,026
5,000
5,556
2,000
8,839
171
11,410
3,201
13,097
62,700
32,000
15,000
FY 2010FY 2010
$200,449$206,241**$189,511**Total
4,74700Market Transformation
5,0004,8261,928Manufacturing R&D
7,71311,0999,637Systems Analysis
4,200*3,8651,978Education
12,500*15,44213,492Safety, Codes & Standards
3,0002,8963,952Fuel Processor R&D
10,0007,4617,257Distributed Energy Systems R&D
6,6007,7187,324Transportation Systems R&D
14,789*29,61239,413Technology Validation
62,70042,34437,100Fuel Cell Stack Component R&D
59,20042,37133,728Hydrogen Storage R&D
10,00038,60733,702Hydrogen Production & Delivery R&D
FY 2009FY 2009FY 2008FY 2008FY 2007FY 2007Key Activity
* Under Vehicle Technologies Budget in FY 2009** FY07 and FY08 numbers exclude SBIR/STTR funding

5
266,233
38,284
7,500
20,0001
200,449
FY 2010Approp.
155,961
0
6,201
4,879
144,881
FY 2004Approp.
~237,284
~38,2843
0
~25,0001,2
174,000
221,155
29,183
8,682
16,518
166,772
FY 2005Approp.
FY 2009Approp.
276,481266,267231,044DOE TOTAL
FY 2008Approp.
FY 2007Approp.
FY 2006Approp.
24,08821,51321,036Fossil Energy (FE)
206,241189,511153,451EERE Hydrogen
36,48436,38832,500Science (SC)
9,66818,85524,057Nuclear Energy (NE)
Funding ($ in thousands)
Hydrogen & Fuel Cells Budgets: FY07 – FY10
1 Does not include funding for program direction. 2 Includes coal to hydrogen and other fuels. Fossil Energy also plans $50M for SECA in FY10.3 Exact funding for hydrogen- and fuel cell–related projects to be determined. The Office of Science also plans
~$14M for hydrogen production research in the Office of Biological and Environmental Research in FY10.

6
As stack costs are reduced, balance-of-plant components are
responsible for a larger % of costs.
Fuel Cell R&D — Progress
We’ve reduced the cost of fuel cells to $61/kW*
• More than 35% reduction in the last two years
• More than 75% reduction since 2002
• 2008 cost projection was validated by independent panel**
*Based on projection to high-volume manufacturing (500,000 units/year).
**Panel found $60 – $80/kW to be a “valid estimate”: http://hydrogendoedev.nrel.gov/peer_reviews.html
$43$65
$34 $27Stack ($/kW)
Balance of Plant ($/kW, includes assembly & testing)
$275/kW
$108/kW
$30/kW
$94/kW
$61/kW*
$45/kW
$73/kW
TARGETS
$100/kW
$200/kW
$300/kW
2005 2010 20152000
Current ICE Cost
Projected Transportation Fuel Cell System Cost- projected to high volume (500,000 units per year) -
7
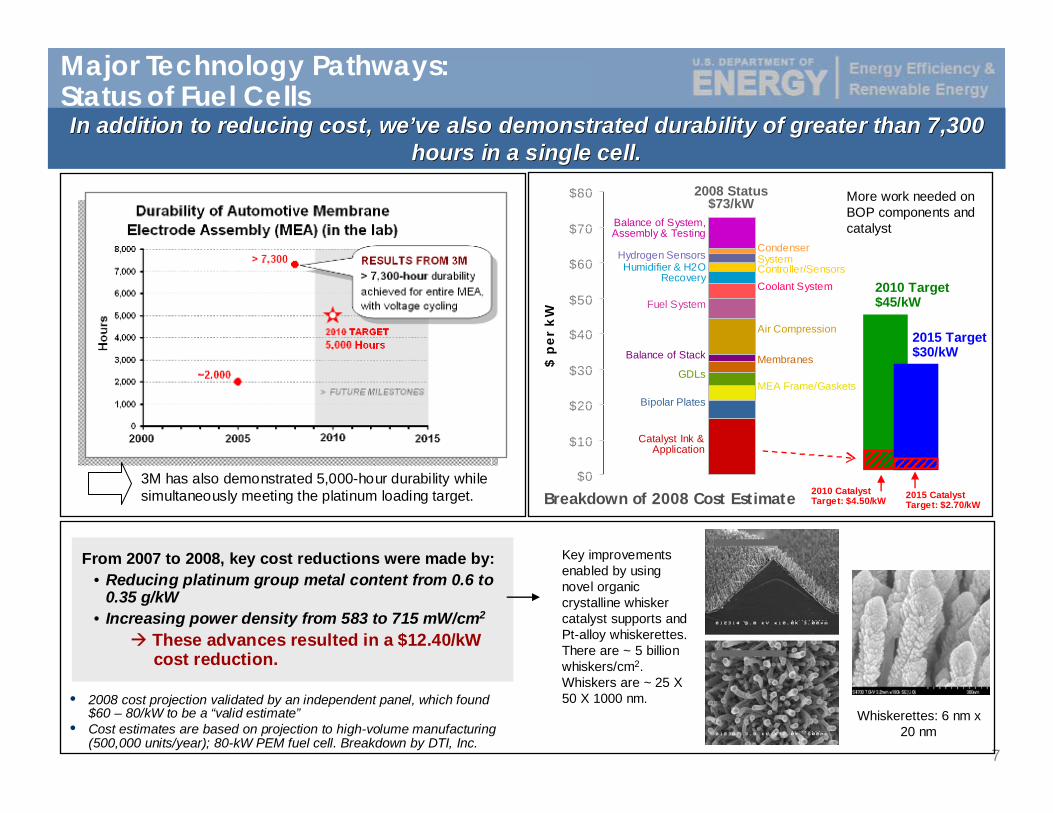
Major Technology Pathways: Status of Fuel Cells
• 2008 cost projection validated by an independent panel, which found $60 – 80/kW to be a “valid estimate”
• Cost estimates are based on projection to high-volume manufacturing (500,000 units/year); 80-kW PEM fuel cell. Breakdown by DTI, Inc.
From 2007 to 2008, key cost reductions were made by:• Reducing platinum group metal content from 0.6 to
0.35 g/kW • Increasing power density from 583 to 715 mW/cm2
These advances resulted in a $12.40/kW cost reduction.
Whiskerettes: 6 nm x 20 nm
Key improvements enabled by using novel organic crystalline whisker catalyst supports and Pt-alloy whiskerettes.There are ~ 5 billion whiskers/cm2.Whiskers are ~ 25 X 50 X 1000 nm.
3M has also demonstrated 5,000-hour durability while simultaneously meeting the platinum loading target.
In addition to reducing cost, weIn addition to reducing cost, we’’ve also demonstrated durability of greater than 7,300 ve also demonstrated durability of greater than 7,300 hours in a single cell.hours in a single cell.
Breakdown of 2008 Cost Estimate$0
$10
$20
$30
$40
$50
$60
$70
$80
$ p
er
kW
Balance of System, Assembly & Testing
CondenserHydrogen Sensors System
Controller/SensorsHumidifier & H2O Recovery
Coolant System
Fuel System
Air Compression
Balance of Stack MembranesGDLs
MEA Frame/GasketsBipolar Plates
Catalyst Ink & Application
2010 Target$45/kW
2015 Target$30/kW
2008 Status $73/kW
2010 Catalyst Target: $4.50/kW 2015 Catalyst
Target: $2.70/kW
More work needed on BOP components and catalyst

8
Hydrogen Production & Delivery R&DThe Program is developing technologies to produce hydrogen from The Program is developing technologies to produce hydrogen from clean, domestic clean, domestic
resources at reduced cost.resources at reduced cost.
KEY PRODUCTION OBJECTIVE: Reduce the cost of hydrogen (delivered & untaxed) to $2 – 3 per gge (gallon gasoline equivalent)
NEAR TERM:Distributed Production
H2 from Natural Gas
H2 from Electrolysis
H2 from Bio-Derived Renewable Liquids
2005 2010 2015 2020
Cost Target: $2 – 3/gge
$6
$4
$2
$5
$3
$1
FUTURE MILESTONES
LONGER TERM:Centralized Production
Biomass Gasification
Central Wind Electrolysis
Coal Gasification with Sequestration
Nuclear
Solar High-Temperature Thermochemical Cycle 0
2
4
6
8
0
2
2005 2010 2015 2020
$12
$10
$8
$6
$4
$2Cost Target: $2 – 3/gge
FUTURE MILESTONES
Projected* High-Volume Cost of Hydrogen (Delivered) — Status & Targets– $/gallon gasoline equivalent (gge), untaxed –
* Distributed status and targets assume station capacities of 1500 kg/day, with 500 stations built per year. Status and targets for centralized production assume the following production capacities: biomass gasification—155,000 to 194,000 kg/day; central wind electrolysis—50,000 kg/day; coal gasification—308,000 kg/day; nuclear—768,000 kg/day; and solar high-temperature thermochemical—100,000 kg/day.

9
$0
$2
$4
$6
$8
$10
$12
$14
Capital Cost Feedstock Cost
O&M Cost Other
Status of Hydrogen Production, Delivery & Storage
Modeled High-volume Cost of Major Hydrogen Production Pathways
Natural Gas
Reforming
Electrolysis Ethanol Reforming
Aqueous Phase
Reforming (other bio-
derived liquids)
Biomass Gasification
Electrolysis Pyrolysis Oil
High-Temp Solar
$/gg
e of
Hyd
roge
n
Distributed Production
Centralized Production (excludes delivery &
dispensing cost)
$0
$1
$2
$3
$4
Terminal Costs Liquid H2 TruckPipelines Tube TrailersStation Compression On-Site StorageOther Station Costs
Modeled High-volume Cost of Major Hydrogen Delivery Pathways
Cost Target: $2 – $3/ggeCost Target: < $1/gge
Key Assumptions:Distributed pathways: 500 units/year and station capacity of 1500 kg/day Central Biomass: ~150,000 kg/day, 90% operating capacity Central Electrolysis: ~ 50,000 kg/day, 98% operating capacity, $0.045/kWh, $50M
depreciable capital costPyrolysis oil: 1,500 kg/day, mixture of pyrolysis oil and methanol cost ~$0.34/kg mixtureSolar thermochemical: 100,000 kg/day, 70% operating capacity (uses thermal and
chemical storage to overcome diurnal limitations to get to 70%)Current Low-volume Costs (e.g., 10 kg/day, single-station): > $30/gge
Key Assumptions:Scenarios assume current technology with potential 2030 market penetration of 25%H2 is delivered 62 miles, from production plant to Los AngelesStations dispense 1000 kg/day at 350 bar
Pipelines (Gas)
Tube Trailers (Gas)
Tanker Trucks (Liquid)
$/gg
e of
Hyd
roge
n

10
Hydrogen Delivery R&D
KEY OBJECTIVEReduce the cost of delivering hydrogen to < $1/gge
PROGRESS
WeWe’’ve reduced the ve reduced the projectedprojected cost of cost of hydrogen deliveryhydrogen delivery
~30% reduction in ~30% reduction in tubetube--trailer coststrailer costs
>20% reduction in >20% reduction in pipeline costspipeline costs
~15% reduction in ~15% reduction in liquid hydrogen liquid hydrogen delivery costsdelivery costs
The Program is developing technologies to deliver hydrogen from The Program is developing technologies to deliver hydrogen from centralized centralized production facilities, efficiently and at low cost. production facilities, efficiently and at low cost.
$/gg
e
NOTE: This slide updates the original shown at the November 2009 HTAC meeting; this revised version reflects the example of the Sacramento market, with 20% market penetration.
Projected Cost of Delivering Hydrogen- assuming high-volume deliveries & widespread market penetration -

11
Updated Storage Targets
Storage System Capacities (weight vs. volume)
• Assessed and updated targets as planned — based on real-world experience with vehicles, weight and space allowances in vehicle platforms, and needs for market penetration
• Developed and evaluated more than 350 materials approaches
• Launched the Storage Engineering Center of Excellence — to address systems integration and prototype development; efforts coordinated with materials centers of excellence
High pressure tanks can already enable > 400 mile range on some High pressure tanks can already enable > 400 mile range on some vehicles. Costs must be reduced vehicles. Costs must be reduced from $13from $13--$20/kWh to $2$20/kWh to $2--$4/kWh and storage capacity must be increased for all vehicles.$4/kWh and storage capacity must be increased for all vehicles.

12
DOE Vehicle/Infrastructure DemonstrationFour teams in 50/50 cost-shared projects with DOE
• 140 fuel cell vehicles and 20 fueling stations demonstrated• > 2.3 million miles traveled, > 115,000 kg H2 produced & dispensed• Analysis by NREL shows:
• Efficiency: 53 – 59% (>2x higher than gasoline engines)• Range: ~196 – 254 miles • Fuel Cell System Durability: ~ 2,500 hrs (~75,000 miles)
Technology ValidationDemonstrations are essential for validating the performance of tDemonstrations are essential for validating the performance of technologies in echnologies in
integrated systems, under realintegrated systems, under real--world conditions.world conditions.
Demonstrations of Specialty Vehicles: NREL is collecting operating data from federal deployments and Recovery Act projects—to be aggregated, analyzed, and reported industry-wide.
Will include data such as: reliability & availability; time between refueling; operation hours & durability; efficiency; H2 production; refueling rate; costs (installation, operation, and lifecycle); and others.
40 forklifts at a Defense Logistics Agency site have already completed 7,000 refuelings in 7 months.
Other Demonstrations: DOE is also evaluating real-world bus fleet data (DOD and DOT collaboration) and demonstrating stationary fuel cells — e.g., tri-generation (combined heat, hydrogen & power with biogas).
1313
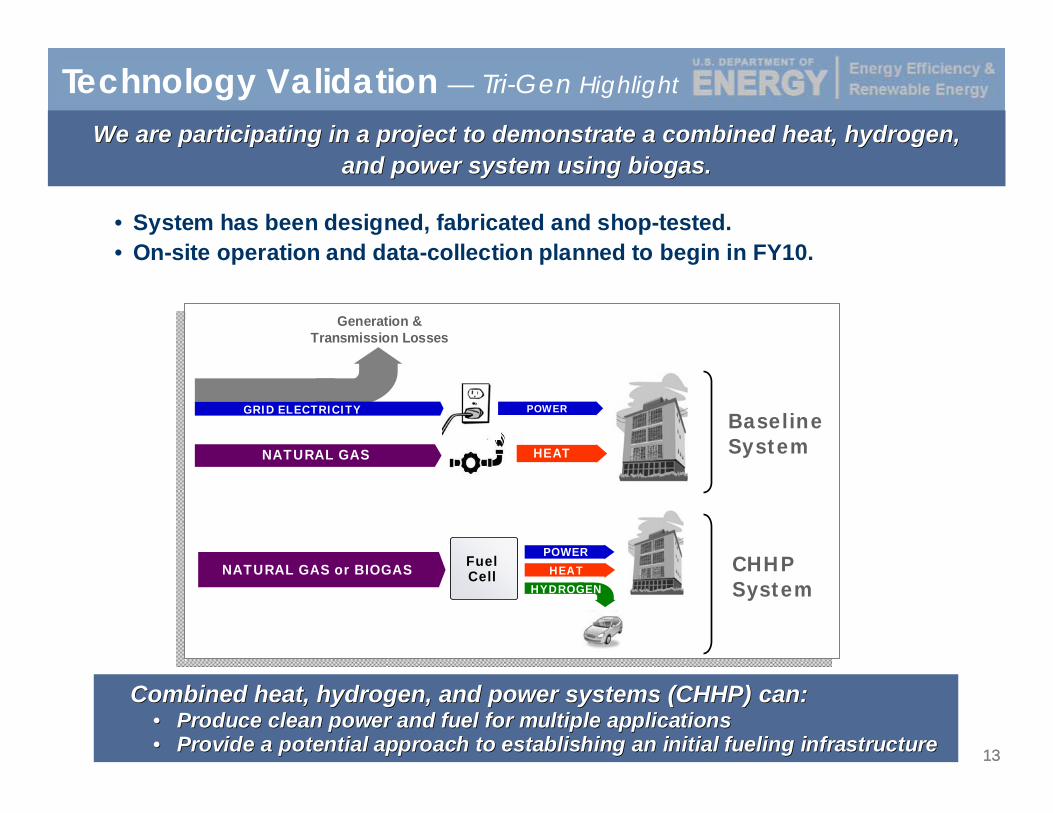
We are participating in a project to demonstrate a combined heatWe are participating in a project to demonstrate a combined heat, hydrogen, , hydrogen, and power system using biogas.and power system using biogas.
Fuel CellNATURAL GAS or BIOGAS
NATURAL GAS
GRID ELECTRICITY POWER
HEAT
POWERHEAT
HYDROGEN
Generation & Transmission Losses
Baseline System
CHHPSystem
Technology Validation — Tri-Gen Highlight
• System has been designed, fabricated and shop-tested.• On-site operation and data-collection planned to begin in FY10.
Combined heat, hydrogen, and power systems (CHHP) can:Combined heat, hydrogen, and power systems (CHHP) can:•• Produce clean power and fuel for multiple applicationsProduce clean power and fuel for multiple applications•• Provide a potential approach to establishing an initial fueling Provide a potential approach to establishing an initial fueling infrastructureinfrastructure

1414
Technology Validation — Tri-Gen Highlight
Sludge
Storage Tank
Sludge Digestion
Tank
ADG
Hydrogen
Hot Water
Energy Station
Fuel Treatment
Anaerobic Digestion
Gas Holder
Heat Exchanger
AC Power
Hydrogen Storage
Hydrogen Dispenser
Anode Exhaust Processing and H2 PSA
Preliminary Test Results
• Fuel cell with water-gas shift in operation > 6,000 hours
• Tri-generation results:
• Coproduced 5 to 10 lb/hr hydrogen with > 200 kW electricity
• Estimated hydrogen recovery at 80 to 85%
• Product purity <0.2 ppm CO; <2 ppmCO2
• Operation with simulated digester gas feed
• PSA operating map developed (cycle time vs. feed rate)
• Implemented automated system to switch to CHP mode when hydrogen tanks are filled.

15
Systems Analysis
Model Calculation of Energy Cost– Calculated cost of energy (electricity, heat, and hydrogen)– Electricity assumed to have the same value as purchased electricity– Heat valued at 1/2 value of electricity– Hydrogen value calculated by differenceNREL
Preliminary Cost Comparison for Production of Hydrogen in a CHHP Application v. at a Stand-Alone Station
The cost of hydrogen production from CHHP can be comparableThe cost of hydrogen production from CHHP can be comparableto distributed SMR at low volumes.to distributed SMR at low volumes.

16
New Project Kick Offs
Fuel Cell Projects Kick Off Sept 30 – Oct 1, 2009• 28 projects• Topics included catalysts, transport, durability, innovative concepts, and
portable power.• Details at
http://www1.eere.energy.gov/hydrogenandfuelcells/2009_projects_meeting.html
SBIR Projects Kick Off and Review Oct 13-15, 2009• Phase 1 Topics included: Production & Delivery (6 projects)• Phase 2 Topics included: Manufacturing and Fuel Cells (4 projects) and
Production & Delivery (6 projects)
Recovery Act Projects Kick-Off Aug 21, 2009• 13 projects initiated• $42 M in funding• Refueling ceremony celebrated 7,000 fuelings
in seven months of the 40 hydrogen fuel cell powered forklifts operating at Defense Distribution Depot Susquehanna, PA

17
012345678
Num
ber o
f Pro
ject
s
2004 2005 2006 2007 2008 2009*
Year
Storage
Manufacturing
Fuel Cells
Production &Delivery
Sub-Topics• Storage:
– Advanced Materials for Hydrogen Storage (1 project)
• Manufacturing:– Hydrogen Production Equipment (2 projects)– Hydrogen Storage Containers (2 projects)– Proton Exchange Membrane (PEM) Fuel
Cells (2 projects)– Bipolar Plates (2 projects)
• Fuel Cells Sub-Topics:– Fuel Cell Systems Coolants and Membranes
(2 projects)– Innovative Fuel Cell Concepts (2 projects)– Dimensionally Stable High Performance
Membrane (1 project)– Bio-Fueled Solid Oxide Fuel Cell (1 project)
• Production & Delivery:– Hydrogen Compression (4 projects)– Hydrogen from Waste (1 project)– Novel Carrier Technologies (1 project)– Hydrogen Production (4 projects)– Hydrogen Liquefaction (1 project)– Off-Board Hydrogen Bulk Storage (1 project)– Hydrogen Home Fueling Analysis (5 projects)– Hydrogen Production Process Intensification
Technology (1 project)– Modeling of Hydrogen-Dispensing Options
for Advanced Storage (1 project)*Only one round of 2009 SBIR project selection has been completed Funding is estimated for 2009 projects
$-
$0.10
$0.20
$0.30
$0.40
$0.50
$0.60
$0.70
$0.80
Mill
ion
$
2004 2005 2006 2007 2008 2009*
Year
Storage
Manufacturing
Fuel Cells
Production &Delivery
Total of 34 Projects & $3.4 Million in funding
HFCIT Phase 1 SBIR Funding by Sub-Program (2004 – 2009*)
HFCIT Phase 1 SBIR Projects by Sub-Program (2004 - 2009*)
FCT Phase 1 SBIR Projects 2004 – 2009*

18
0
1
2
3
4
2005 2006 2007 2008 2009Year
Manufacturing
Fuel Cells
Production &Delivery
Num
ber o
f Pro
ject
s
• Manufacturing Sub-Topics:– Manufacturing of Hydrogen Storage
Containers • Innosense, Loc
– Manufacturing of Proton Exchange Membrane (PEM) Fuel Cells
• Nanotek Instruments, Inc. • Scribner Associates Incorporated
– Manufacturing of Bipolar Plates• Faraday Technology, Inc.
• Fuel Cells Sub-Topics:– Fuel Cell Systems Coolants and Membranes
• Advanced Fluid Tech Inc., Dab Dynalene Heat Trans
– Dimensionally Stable High Performance Membrane
• Giner Electrochemical Systems, Loc– Bio-Fueled Solid Oxide Fuel Cell
• Innovatek, Inc
• Production & Delivery Sub-Topics:– Hydrogen Compression Technology
• Mohawk Innovative Technology (2 projects)• Fuelcell Energy
– Hydrogen Production • Genesis Fueltech• Physical Optics Corporation• Synkera Technologies Inc.
– Hydrogen from Waste• Directed Technologies, Inc.
Total of 14 Projects & $10.4 Million in fundingHFCIT Phase 2 SBIR Projects by Sub-Program (2005 - 2009)
HFCIT Phase 2 SBIR Funding by Sub-Program (2005 - 2009)
$-
$0.50
$1.00
$1.50
$2.00
$2.50
$3.00
Year
2005 2006 2007 2008 2009
mill
ion
$
Manufacturing
Fuel Cells
Production &Delivery
FCT Phase 2 SBIR Projects 2005 – 2009

19
SBIR Funding Opportunity Announcement
• SBIR FOA is currently open • Topics include:
a. Energy Storage for Intermittent Renewable Resources
b. Fuel Cell Balance-of-Plantc. Advanced Hydrogen Storage for Early Market
Applicationsd. Low-Cost Dispensing for Material Handling and
Specialty Vehicles
Closes November 20, 2009
http://www.science.doe.gov/sbir/solicitations/FY%202010/C30_Notice.htm

20
Upcoming Workshops
• Production & Delivery– Low temperature delivery working group: May 2010 at NHA conference
(tentative)• Storage
– Workshop on early markets: Nov 16, 2009 at the Fuel Cell Seminar, Palm Springs
– LANL-AIST-NEDO storage workshop: Dec 2009 at the MRS conference, Boston
• Fuel Cells– Workshop on high temperature fuel cell gaps: Nov 16, Fuel Cell
Seminar, Palm Springs– Workshop on bus targets and gaps: TBD– Pre-solicitation meeting (BOP, stationary); Jan/Feb 2010
• Market Transformation– Early markets & infrastructure workshop: Nov 2009, Fuel Cell Seminar,
Palm Springs• Safety, Codes & Standards
– DOE-DOT workshop on CNG-H2: Dec 2010, Washington, DC– NHA Codes & Standards– Insurance workshop– NASA-DOE tank safety workshop

21
Storage RFI
• Focus: Performance and cost requirements of fuel storage subsystems for early-market fuel cell applications.
• Target Audience: Prospective fuel cell system users, fuel cell component and system suppliers and other stakeholders.
• Objective: To develop consumer- and user-driven requirements and targets.
• Application Categories: Handheld and higher power portable applications; residential and commercial CHHP; APUs for trucks, RVs, etc.; stationary power for remote applications, back-up power and residential; and material handling.
Closes December 15, 2009
http://www1.eere.energy.gov/hydrogenandfuelcells/news_detail.html?news_id=15569

22
• Discusses worldwide trends in units shipped and financing in 2007
• Identifies trends for each major application area
• Focuses on North American and U.S. markets
• Update to be released in December 2009
2007 Market Report
http://www.nrel.gov/docs/fy09osti/46023.pdf

23
Program Priorities and Next Steps
•Publications• Fuel Cell Program Plan (replacement of
current Posture Plan) • Publication of Interagency Action Plan,
detailing interagency coordination• 2008 Market Report
• NAS study entitled “Assessment of Resource Needs for Development of Fuel Cell and Hydrogen Technology” to be updated to include PHEVs and published in November 2009*
• Workshop on infrastructure needs• Continued market and benefits analysis• Continued incorporation of feedback from
stakeholders
*http://www8.nationalacademies.org/cp/projectview.aspx?key=48717

24
Key Program Documents
Fuel Cell Program PlanOutlines a coordinated plan for fuel cell activities in the Department of Energy
Replacement for current Posture PlanTo be released in early 2010
Annual Merit Review ProceedingsIncludes downloadable versions of all presentations at the Annual Merit Review
Latest edition released June 2009www.hydrogen.energy.gov/annual_review09_proceedings.html
Annual Merit Review & Peer Evaluation ReportSummarizes the comments of the Peer Review Panel at the Annual Merit Review and Peer Evaluation Meeting
Next edition to be published in Fall 2009 www.hydrogen.energy.gov/annual_review08_report.html
Annual Progress ReportSummarizes activities and accomplishments within the Program over the preceding year, with reports on individual projects
Next edition to be published in Fall 2009www.hydrogen.energy.gov/annual_progress.html
www.hydrogen.energy.gov www.hydrogenandfuelcells.energy.gov
Next Annual Review: June 7 – 11, 2010Washington, D.C.
http://annualmeritreview.energy.gov/
Next Annual Review: June 7 – 11, 2010Washington, D.C.
http://annualmeritreview.energy.gov/

26
Additional Information

27
Fuel Cells — Worldwide Interest & Investment
Interest in fuel cells and hydrogen is global, with more than $1Interest in fuel cells and hydrogen is global, with more than $1 billion in public investment in RD&D billion in public investment in RD&D annually, and 17 members of the International Partnership for thannually, and 17 members of the International Partnership for the Hydrogen Economy (IPHE).e Hydrogen Economy (IPHE).
European Union
RD&D Funding: >$600 M (’08 – ’13)Fuel Cell and Hydrogen Joint Technology Initiative: 50/50 cost-shared with industry.
Germany
RD&D Funding: ~$1.0 Billion (’07 – ’16) Deployments/Demonstrations:
> 50 stationary fuel cells in government demonstrations8 companies signed MOU (Sept 2009) to launch infrastructure and hundreds of thousands of vehicles
Japan
RD&D Funding: ~$1.0 Billion (’08 – ’12) Deployments & Demonstrations:
> 3,000 stationary fuel cells 12 fueling stations45 fuel cell vehicles5 fuel cell buses
RD&D Funding: ~$500 M (FY09, total) ~$270 M (FY09, DOE)Deployments/Demonstrations:
~ 2,000 stationary fuel cells~ 60 fueling stations> 200 fuel cell vehicles> 20 fuel cell buses
U.S.A.
H2 Stations
China
RD&D Funding: ~$30 M (’08) Deployments & Demonstrations:
>3-6 buses in Shanghai for 2010 World Expo
South Korea
RD&D Funding: ~$586 M (‘04-’11)Policy:
80% subsidy for residential FCsFeed-in tariff for stationary generation
Deployments/Demonstrations:30 vehicles, 4 buses
28
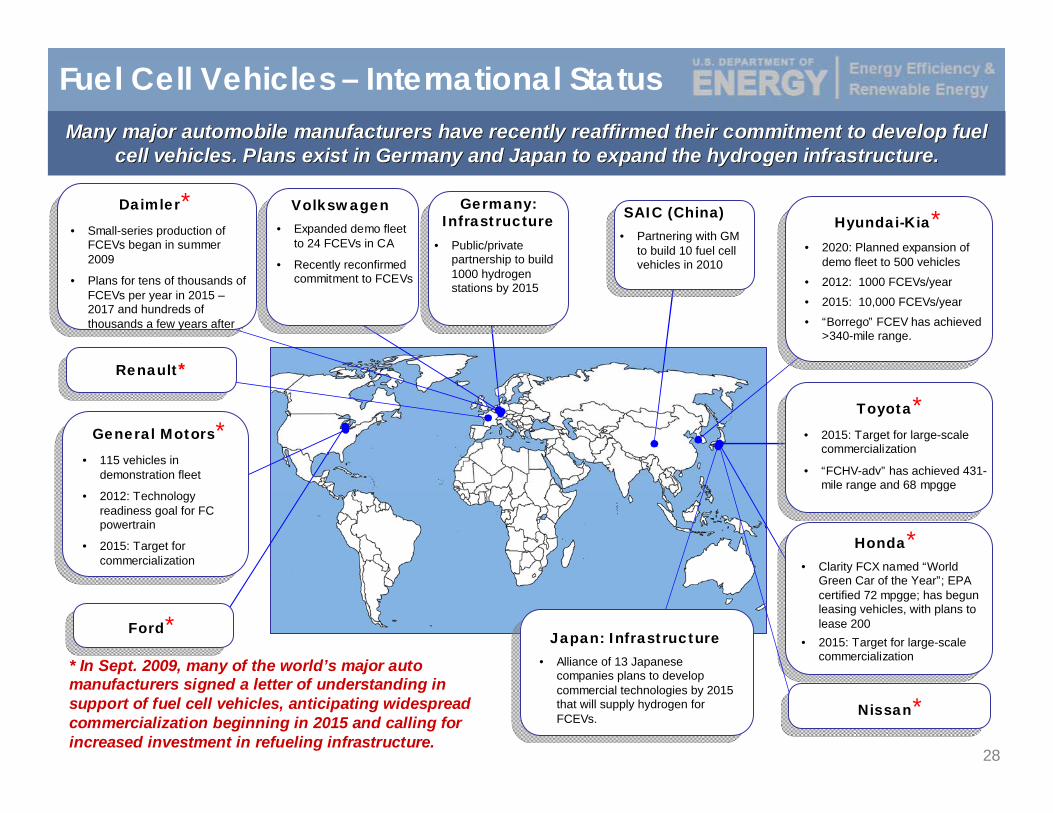
Fuel Cell Vehicles – International Status Many major automobile manufacturers have recently reaffirmed theMany major automobile manufacturers have recently reaffirmed their commitment to develop fuel ir commitment to develop fuel
cell vehicles. Plans exist in Germany and Japan to expand the hycell vehicles. Plans exist in Germany and Japan to expand the hydrogen infrastructure.drogen infrastructure.
Daimler*• Small-series production of
FCEVs began in summer 2009
• Plans for tens of thousands of FCEVs per year in 2015 –2017 and hundreds of thousands a few years after
Volkswagen • Expanded demo fleet
to 24 FCEVs in CA
• Recently reconfirmed commitment to FCEVs
Germany: Infrastructure
• Public/private partnership to build 1000 hydrogen stations by 2015
General Motors*• 115 vehicles in
demonstration fleet
• 2012: Technology readiness goal for FC powertrain
• 2015: Target for commercialization
Hyundai-Kia*• 2020: Planned expansion of
demo fleet to 500 vehicles
• 2012: 1000 FCEVs/year
• 2015: 10,000 FCEVs/year
• “Borrego” FCEV has achieved >340-mile range.
Toyota*• 2015: Target for large-scale
commercialization
• “FCHV-adv” has achieved 431-mile range and 68 mpgge
Honda*• Clarity FCX named “World
Green Car of the Year”; EPA certified 72 mpgge; has begun leasing vehicles, with plans to lease 200
• 2015: Target for large-scale commercialization
Japan: Infrastructure• Alliance of 13 Japanese
companies plans to develop commercial technologies by 2015 that will supply hydrogen for FCEVs.
Nissan*
Renault*
Ford** In Sept. 2009, many of the world’s major auto manufacturers signed a letter of understanding in support of fuel cell vehicles, anticipating widespread commercialization beginning in 2015 and calling for increased investment in refueling infrastructure.
SAIC (China)• Partnering with GM
to build 10 fuel cell vehicles in 2010
29
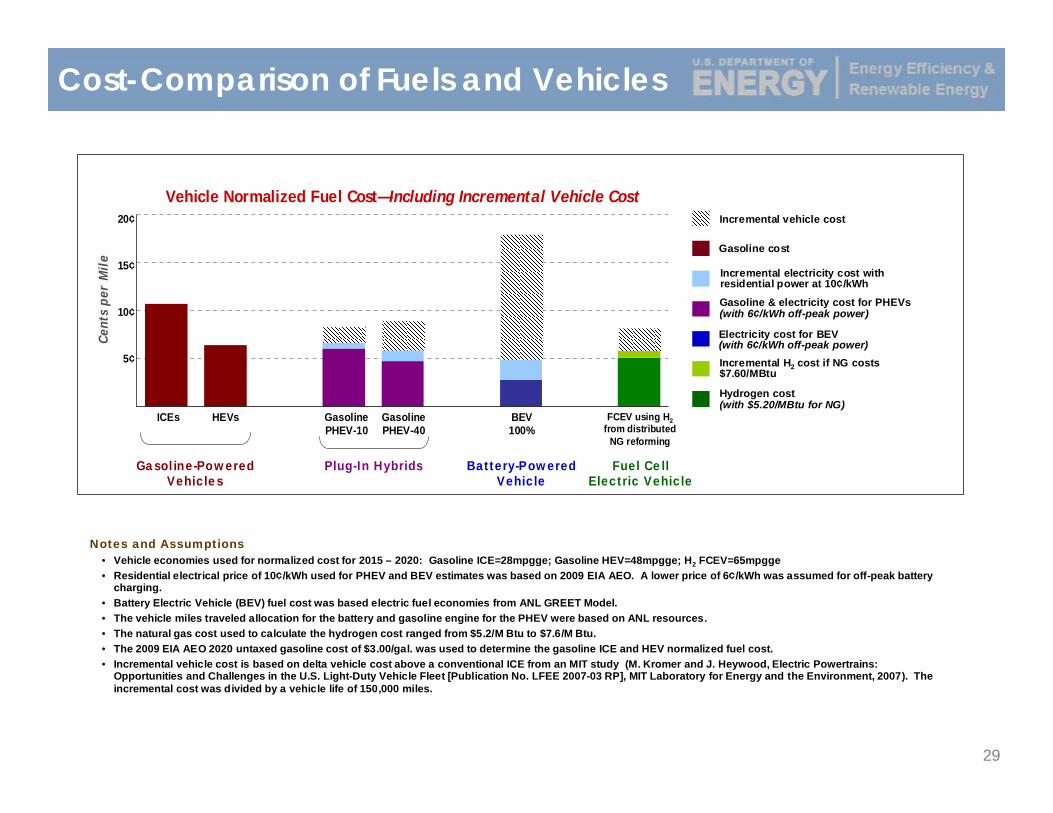
Cost-Comparison of Fuels and Vehicles
Incremental vehicle cost
Gasoline cost
Electricity cost for BEV (with 6¢/kWh off-peak power)
Gasoline & electricity cost for PHEVs(with 6¢/kWh off-peak power)
Incremental electricity cost with residential power at 10¢/kWh
Hydrogen cost(with $5.20/MBtu for NG)
Incremental H2 cost if NG costs $7.60/MBtu
Vehicle Normalized Fuel Cost—Including Incremental Vehicle Cost
Cent
s pe
r M
ile
5¢
10¢
15¢
20¢
Gasoline-Powered Vehicles
Plug-In Hybrids Battery-Powered Vehicle
Fuel Cell Electric Vehicle
ICEs HEVs Gasoline PHEV-10
Gasoline PHEV-40
BEV 100%
FCEV using H2from distributed
NG reforming
Notes and Assumptions• Vehicle economies used for normalized cost for 2015 – 2020: Gasoline ICE=28mpgge; Gasoline HEV=48mpgge; H2 FCEV=65mpgge• Residential electrical price of 10¢/kWh used for PHEV and BEV estimates was based on 2009 EIA AEO. A lower price of 6¢/kWh was assumed for off-peak battery
charging.• Battery Electric Vehicle (BEV) fuel cost was based electric fuel economies from ANL GREET Model.• The vehicle miles traveled allocation for the battery and gasoline engine for the PHEV were based on ANL resources.• The natural gas cost used to calculate the hydrogen cost ranged from $5.2/M Btu to $7.6/M Btu. • The 2009 EIA AEO 2020 untaxed gasoline cost of $3.00/gal. was used to determine the gasoline ICE and HEV normalized fuel cost.• Incremental vehicle cost is based on delta vehicle cost above a conventional ICE from an MIT study (M. Kromer and J. Heywood, Electric Powertrains:
Opportunities and Challenges in the U.S. Light-Duty Vehicle Fleet [Publication No. LFEE 2007-03 RP], MIT Laboratory for Energy and the Environment, 2007). The incremental cost was divided by a vehicle life of 150,000 miles.

30
As the Program continues to broaden its portfolio beyond automotAs the Program continues to broaden its portfolio beyond automotive applications, market ive applications, market penetration and benefits analyses for diverse applications will penetration and benefits analyses for diverse applications will be developed and refined.be developed and refined.
Estimated Potential Impacts —for Reducing GHG Emissions & Petroleum Use
0
20
40
60
80
100
120
140
160
180
2020 (low)
2020 (high)
2030 (low)
2030 (high)
Mil
lion
s of
Met
ric
Ton
s/ye
ar
Potential Annual Reductions in CO2 Emissions
Light-duty Vehicles
Stationary Power/CHPAuxiliary Power Forklifts
AssumptionsForklifts: 2020 Market Share = 12% or 36,000 units; 2030 Market Share = 85% or 300,000 unitsAuxiliary Power: 2020 Market Share = 10% of long-haul trucks; 2030 Market Share = 100% of long-haul trucksStationary Power/CHP: 2020 Market Share = 0.4% of U.S. Electricity; 2030 Market Share = 0.8 – 1% of U.S. ElectricityLight-duty Vehicles: 2020 Market Share = 0.7 – 1.5 million vehicles; 2030 Market Share = 25 – 30 million vehicles. (Light-duty vehicle assumptions are derived from a scenario in the 2008 National Academies report, Transitions to Alternative Transportation Technologies—A Focus on Hydrogen.)
14m MT 19m MT
144m MT
178m MT
0
200
400
600
800
1,000
1,200
Tho
usan
ds o
f Ba
rrel
s pe
r D
ay
Potential Reductions in Petroleum Use
2020 (low)
2020 (high)
2030 (low)
2030 (high)
Light-duty Vehicles
Auxiliary Power
25,700 bbl/day
52,700 bbl/day
0.92m bbl/day
1.02m bbl/day

31
Analysis shows Analysis shows DOEDOE’’ss portfolio of transportation technologies will reduce emissions portfolio of transportation technologies will reduce emissions of of greenhouse gases.greenhouse gases.
Systems Analysis —Greenhouse Gas Emissions
Program Record #9002, www.hydrogen.energy.gov/program_records.html.
Today’s Gasoline Vehicle
Well-to-Wheels Greenhouse Gas Emissions(life cycle emissions, based on a projected state of the technologies in 2020)
Conventional Vehicles
Hybrid Electric Vehicles
Plug-in Hybrid Electric Vehicles (40-mile all-electric range)
Fuel Cell Vehicles
Gasoline
Natural Gas
Gasoline
Diesel
Corn Ethanol – E85
Cellulosic Ethanol – E85
Gasoline
Cellulosic Ethanol – E85
H2 from Distributed Natural Gas
H2 from Coal w/Sequestration
H2 from Biomass Gasification
H2 from Central Wind Electrolysis
H2 from Nuclear High-Temp Electrolysis
410
320
250
220
190
<65*
240
<150*
200
<110*
<55*
<40*
50
100 200 300 400
Grams of CO2-equivalent per mile
540
*Net emissions from these pathways will be lower if these figures are adjusted to include:• The displacement of emissions from grid power–generation that will occur when surplus electricity is co-produced with cellulosic ethanol• The displacement of emissions from grid power–generation that may occur if electricity is co-produced with hydrogen in the biomass and
coal pathways, and if surplus wind power is generated in the wind-to-hydrogen pathway• Carbon dioxide sequestration in the biomass-to-hydrogen process

32
Well-to-Wheels Petroleum Energy Use(based on a projected state of the technologies in 2020)
Conventional Vehicles
Hybrid Electric Vehicles
Plug-in Hybrid Electric Vehicles(40-mile all-electric range)
Fuel Cell Vehicles
Gasoline
Natural Gas
Gasoline
Diesel
Corn Ethanol – E85
Cellulosic Ethanol – E85
Gasoline
Cellulosic Ethanol – E85
H2 from Distributed Natural Gas
H2 from Coal w/Sequestration
H2 from Biomass Gasification
H2 from Central Wind Electrolysis
Btu per mile
4550
25
2710
2370
850
860
1530
530
30
25
95
45
15
2000 3000 40001000 5000
Today’s Gasoline Vehicle
6070
H2 from Nuclear High-Temp Electrolysis
Analysis shows Analysis shows DOEDOE’’ss portfolio of transportation technologies will reduce oil consumportfolio of transportation technologies will reduce oil consumption.ption.
Systems Analysis — Petroleum Use
Program Record #9002, www.hydrogen.energy.gov/program_records.html.