Embed Size (px)
Citation preview
Overview of Fiscal Year 2010-11
Oakland Schools Proposed Budgets
Property Tax Forecast
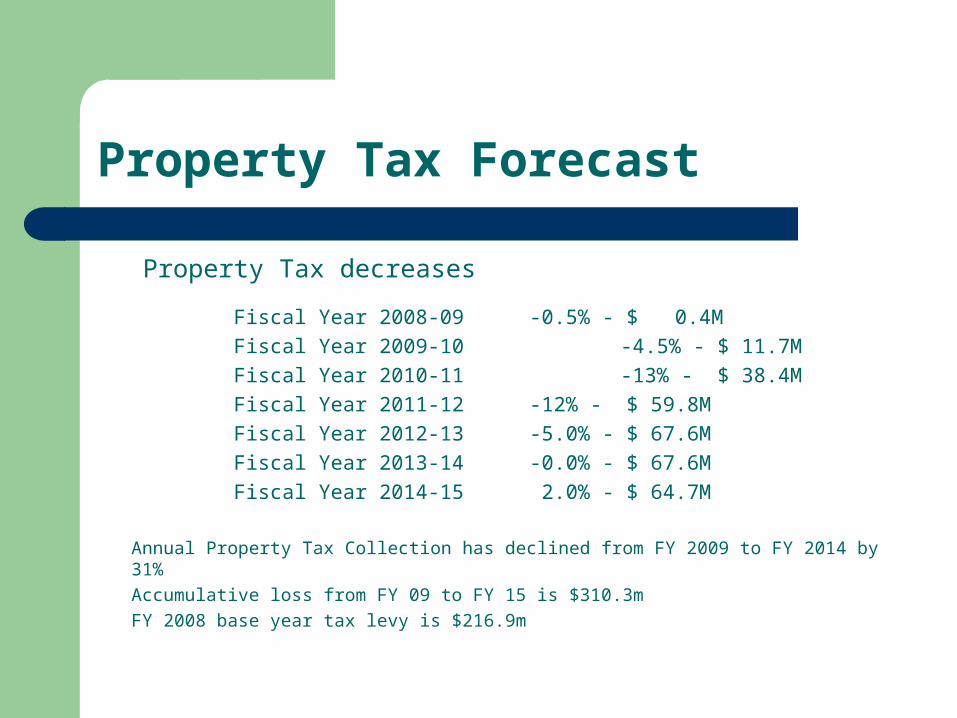
Property Tax decreases
Fiscal Year 2008-09 -0.5% - $ 0.4M
Fiscal Year 2009-10 -4.5% - $ 11.7M
Fiscal Year 2010-11 -13% - $ 38.4M
Fiscal Year 2011-12 -12% - $ 59.8M
Fiscal Year 2012-13 -5.0% - $ 67.6M
Fiscal Year 2013-14 -0.0% - $ 67.6M
Fiscal Year 2014-15 2.0% - $ 64.7M
Annual Property Tax Collection has declined from FY 2009 to FY 2014 by 31%
Accumulative loss from FY 09 to FY 15 is $310.3m
FY 2008 base year tax levy is $216.9m
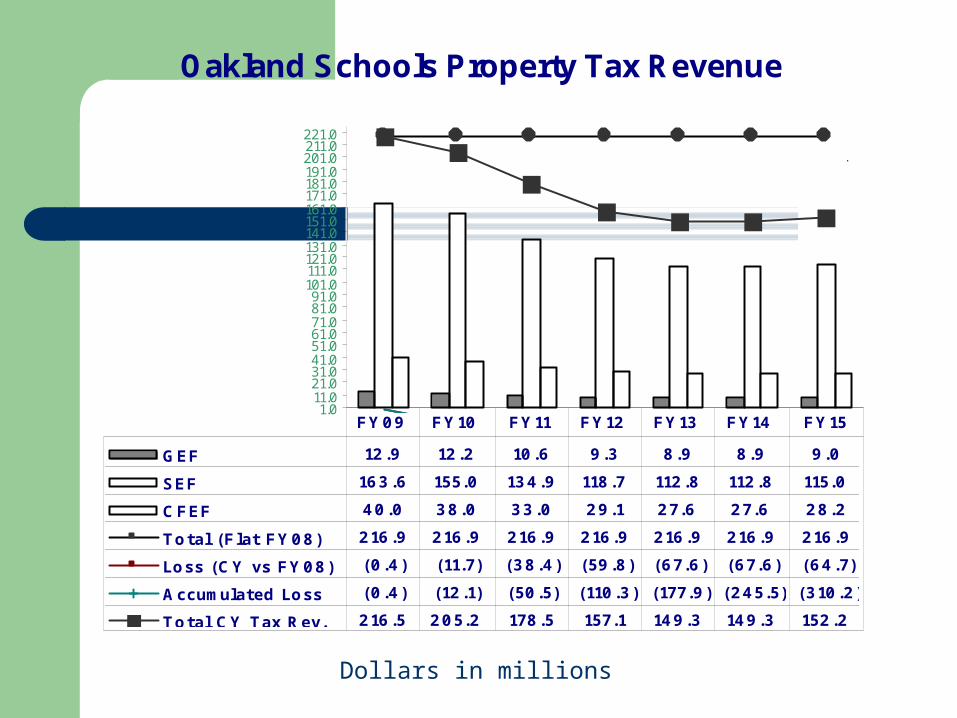
Oakland Schools Property Tax Revenue
1.011.021.031.041.051.061.071.081.091.0
101.0111.0121.0131.0141.0151.0161.0171.0181.0191.0201.0211.0221.0
GEF 12.9 12.2 10.6 9.3 8.9 8.9 9.0
SEF 163.6 155.0 134.9 118.7 112.8 112.8 115.0
CFEF 40.0 38.0 33.0 29.1 27.6 27.6 28.2
Total (Flat FY08) 216.9 216.9 216.9 216.9 216.9 216.9 216.9
Loss (CY vs FY08) (0.4) (11.7) (38.4) (59.8) (67.6) (67.6) (64.7)
Accumulated Loss (0.4) (12.1) (50.5) (110.3) (177.9) (245.5) (310.2)
Total CY Tax Rev. 216.5 205.2 178.5 157.1 149.3 149.3 152.2
FY09 FY10 FY11 FY12 FY13 FY14 FY15
FY 2007-08 Property Tax Level
Dollars in millions
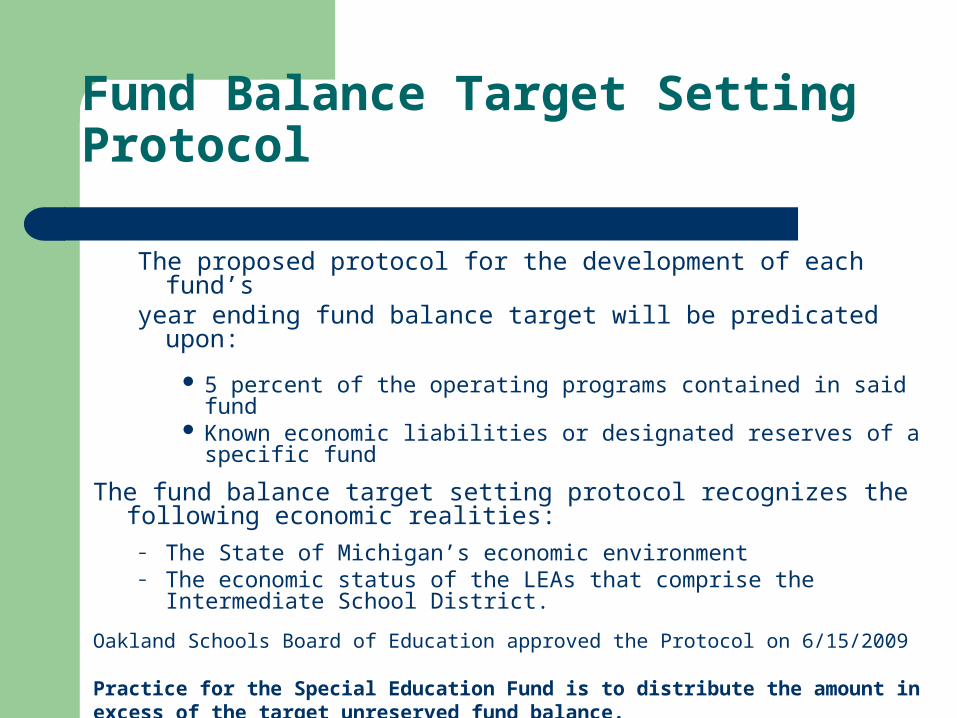
Fund Balance Target Setting Protocol
The proposed protocol for the development of each fund’s year ending fund balance target will be predicated upon:
5 percent of the operating programs contained in said fund Known economic liabilities or designated reserves of a specific
fund
The fund balance target setting protocol recognizes the following economic realities:
– The State of Michigan’s economic environment– The economic status of the LEAs that comprise the Intermediate
School District.
Oakland Schools Board of Education approved the Protocol on 6/15/2009
Practice for the Special Education Fund is to distribute the amount inexcess of the target unreserved fund balance.
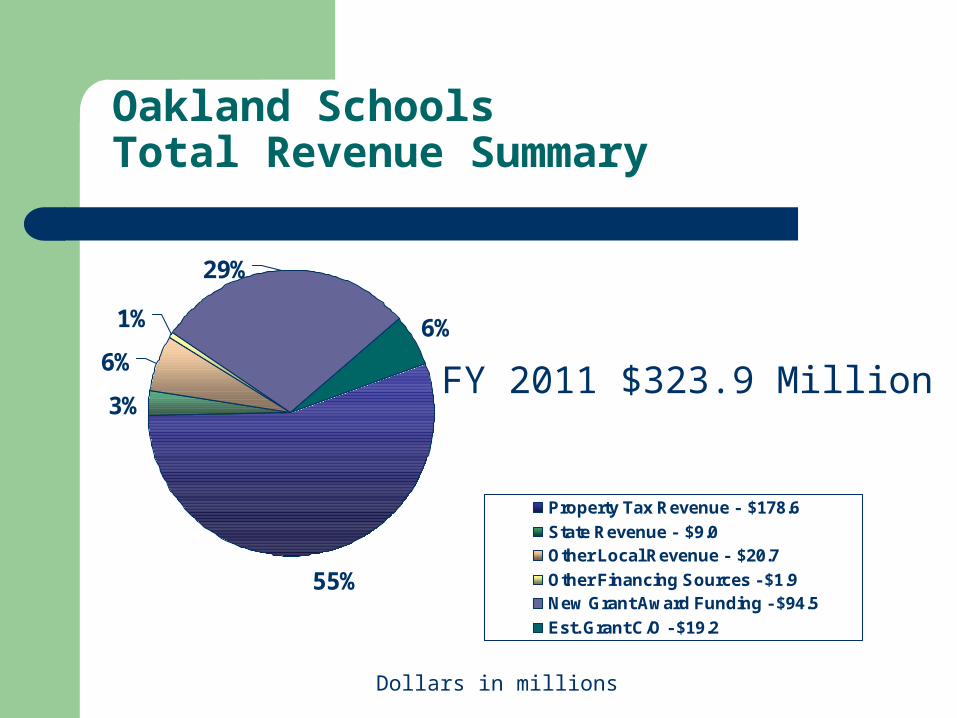
Oakland SchoolsTotal Revenue Summary
55%
3%
6%
1% 6%
29%
Property Tax Revenue - $178.6
State Revenue - $9.0Other Local Revenue - $20.7
Other Financing Sources - $1.9New Grant Award Funding - $94.5
Est. Grant C/O - $19.2
Dollars in millions
FY 2011 $323.9 Million
Revenue Assumptions
Property tax revenue decrease of 13% Expected investment rate of return is 1.5% on available
resources Increased local district utilization of our Finance, Human
Resource application, Benchmark & Inform system and Novanet fee-based software system.
General Education Section 81 reduced by 14.5% All other State Aid held flat
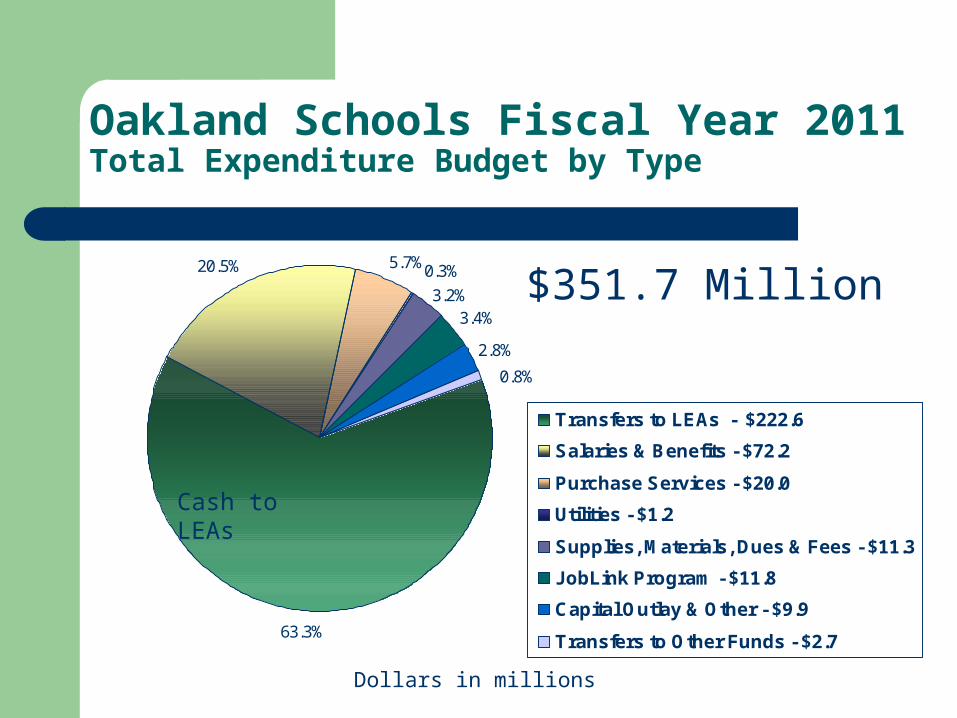
Oakland Schools Fiscal Year 2011Total Expenditure Budget by Type
63.3%
20.5% 5.7%
3.4%
2.8%
0.3%
3.2%
0.8%
Transfers to LEAs - $222.6
Salaries & Benefits - $72.2
Purchase Services - $20.0
Utilities - $1.2
Supplies, Materials, Dues & Fees - $11.3
JobLink Program - $11.8
Capital Outlay & Other - $9.9
Transfers to Other Funds - $2.7
Dollars in millions
$351.7 Million
Cash to LEAs
Difference between Revenue & Expenditures
Total Difference: $27.8 million
Capital Projects Funds $(10.9m) Debt Service payments $(5m) Special Education Fund $(11.0m) All other funds $(.9m)
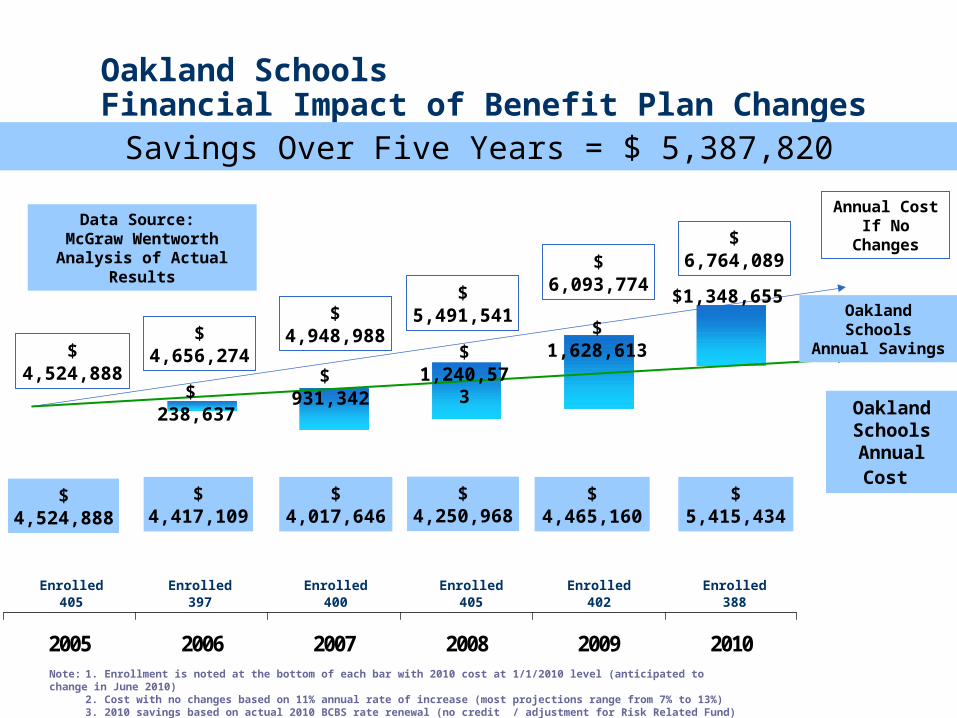
Oakland SchoolsFinancial Impact of Benefit Plan Changes
2005 2006 2007 2008 2009 2010
Oakland Schools
Annual Cost
Enrolled405
Enrolled400
Enrolled397
Enrolled405
Enrolled402
$ 4,656,274$ 4,948,988
$ 5,491,541
$ 6,093,774
$ 4,524,888
$ 4,417,109 $ 4,017,646 $ 4,250,968 $ 4,465,160$ 4,524,888
$ 238,637$ 931,342
$ 1,240,573
Oakland SchoolsAnnual Savings
Annual CostIf No Changes
Savings Over Five Years = $ 5,387,820
Data Source: McGraw Wentworth
Analysis of Actual Results
Enrolled388
$ 6,764,089
$1,348,655
$ 5,415,434
$ 1,628,613
Note: 1. Enrollment is noted at the bottom of each bar with 2010 cost at 1/1/2010 level (anticipated to change in June 2010)2. Cost with no changes based on 11% annual rate of increase (most projections range from 7% to 13%)3. 2010 savings based on actual 2010 BCBS rate renewal (no credit / adjustment for Risk Related Fund)
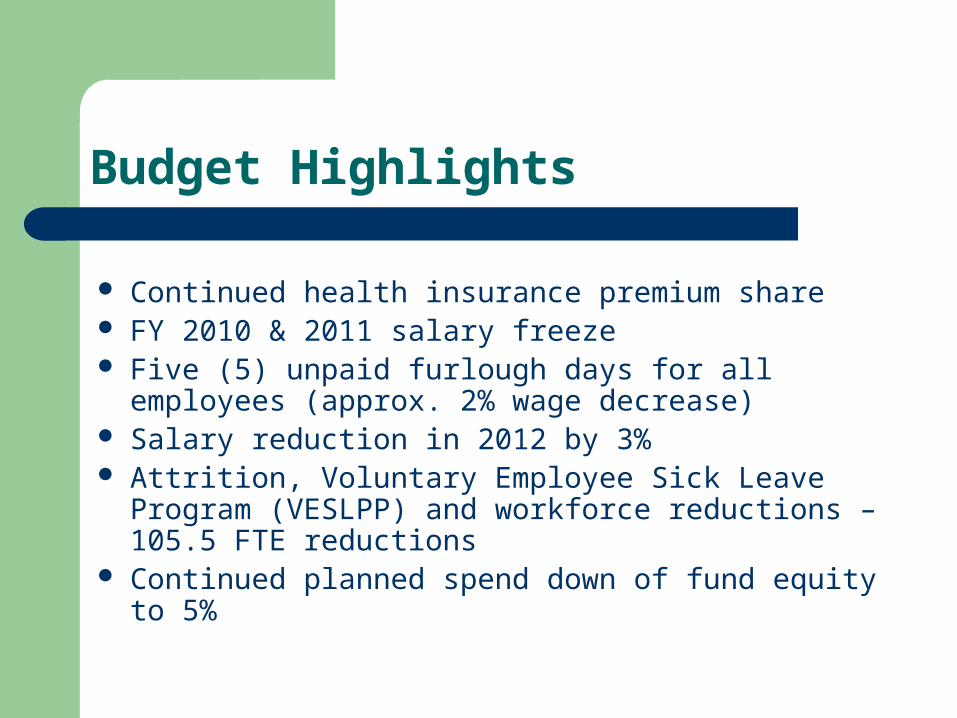
Budget Highlights
Continued health insurance premium share FY 2010 & 2011 salary freeze Five (5) unpaid furlough days for all employees
(approx. 2% wage decrease) Salary reduction in 2012 by 3% Attrition, Voluntary Employee Sick Leave Program
(VESLPP) and workforce reductions – 105.5 FTE reductions
Continued planned spend down of fund equity to 5%

Budget Highlights
• MPSERS retirement rate budgeted at the weighted average rate of 18.79% (19.41% effective October 1, 2010)
• Non union & union healthcare cost budgeted at annual increase of 13%
• Purchase Services, Supplies & Materials, Dues & Fees reduced by aggregate 10%
• Utilities reflect a 6% decrease from the prior year

Budget Highlights
FY 2011 proposed non-union salary & wage changes
A wage freeze was implemented on January 1, 2010 fornon union staff. Non-union wages follow the calendar year.
5 unpaid furlough days for 12 month staff (2% decrease)
Continuation of employee premium share based on paylevel (up to 4.5%)
The progression increment movement with in the market ranges plus the longevity stipends account for an average of 0.5% annually.
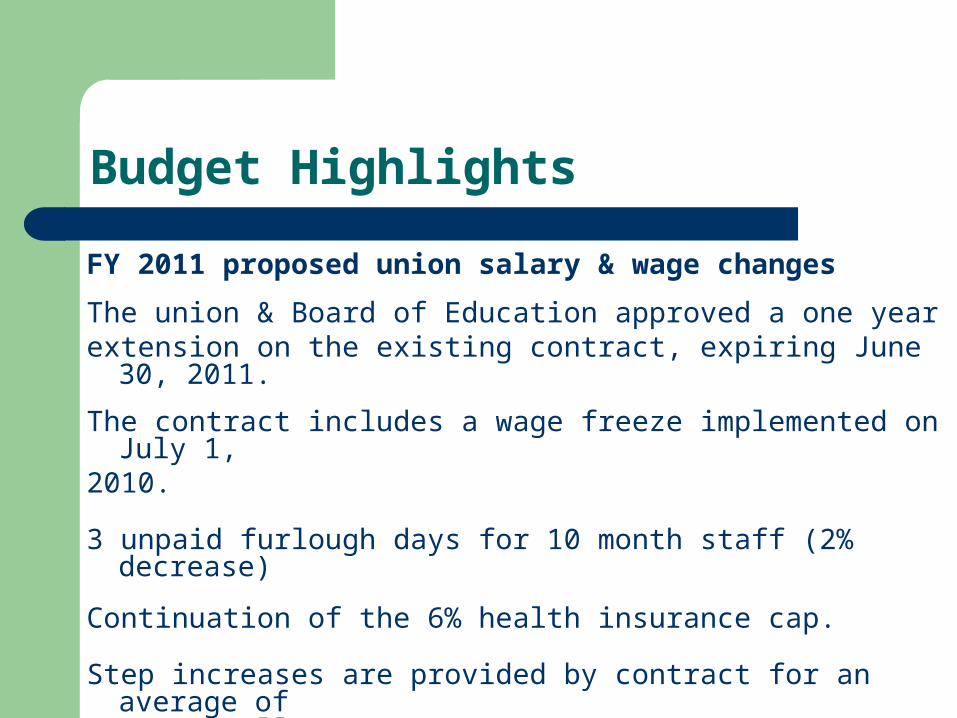
Budget Highlights
FY 2011 proposed union salary & wage changes
The union & Board of Education approved a one yearextension on the existing contract, expiring June 30, 2011.
The contract includes a wage freeze implemented on July 1,2010.
3 unpaid furlough days for 10 month staff (2% decrease)
Continuation of the 6% health insurance cap.
Step increases are provided by contract for an average of 1.2% annually.
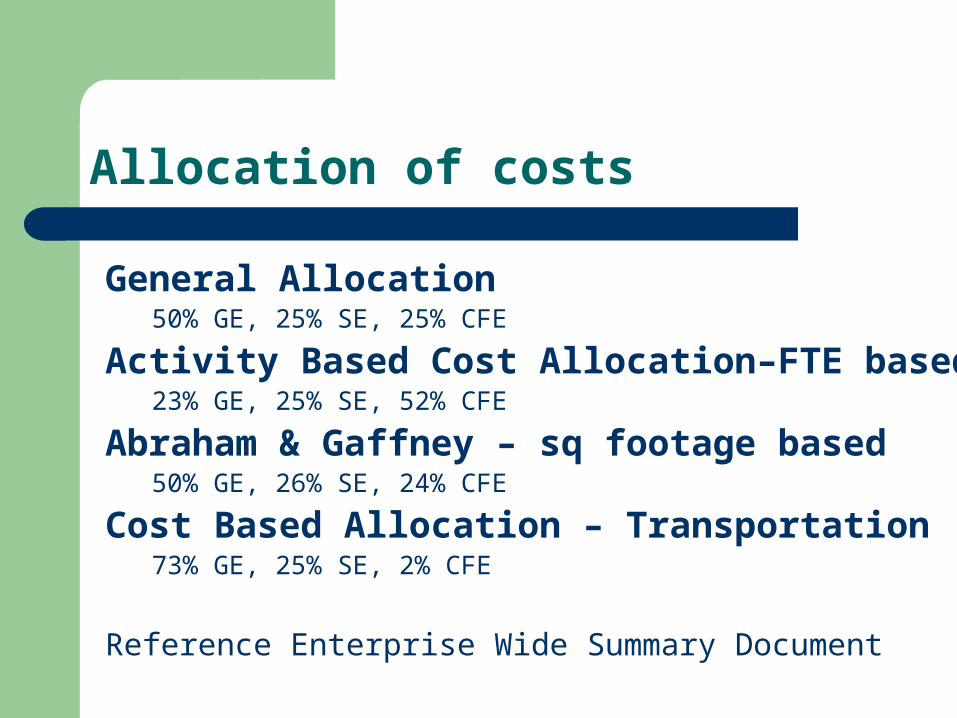
Allocation of costs
General Allocation50% GE, 25% SE, 25% CFE
Activity Based Cost Allocation–FTE based23% GE, 25% SE, 52% CFE
Abraham & Gaffney – sq footage based50% GE, 26% SE, 24% CFE
Cost Based Allocation – Transportation73% GE, 25% SE, 2% CFE
Reference Enterprise Wide Summary Document

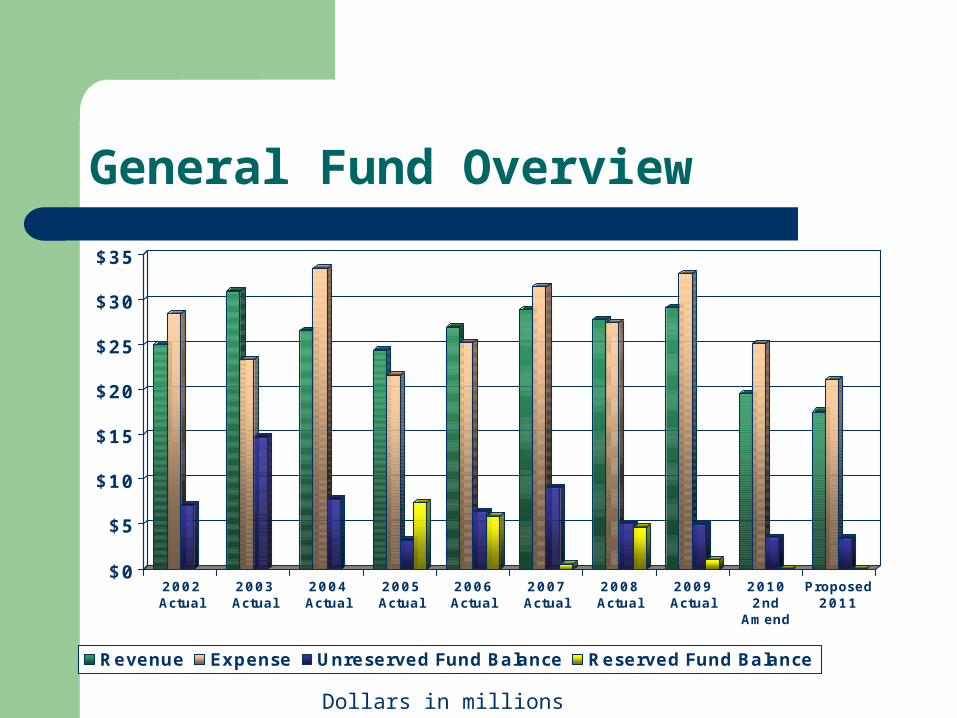
General Education Fund Summary
Total Revenue: $17.5 Million– Property tax – $10.6 M (60% of total revenue)– Other local revenues – $3.5 M– State sources revenues – $2.9 M– Other financing source revenues – $.5 M
Total Expenditures: $17.7 Million– General administration – $1.7 M– Finance and operations – $7.2 M– Instructional services – $8.7 M– Plant and fixed charges, transfers to LEAs – $.1 M
Note: Medicaid Revenue now reflected in Fund 273
$0
$5
$10
$15
$20
$25
$30
$35
2002Actual
2003Actual
2004Actual
2005Actual
2006Actual
2007Actual
2008Actual
2009Actual
20102nd
Amend
Proposed2011
Revenue Expense Unreserved Fund Balance Reserved Fund Balance
Dollars in millions
General Fund Overview
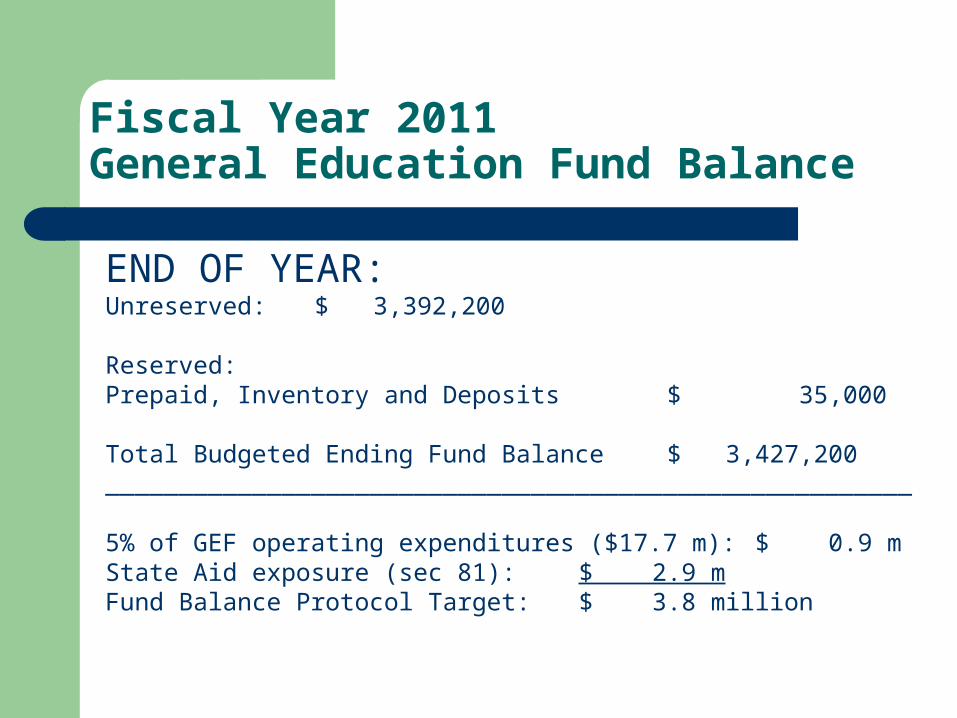
Fiscal Year 2011General Education Fund Balance
END OF YEAR:Unreserved: $ 3,392,200
Reserved:Prepaid, Inventory and Deposits $ 35,000
Total Budgeted Ending Fund Balance $ 3,427,200_______________________________________________________
5% of GEF operating expenditures ($17.7 m): $ 0.9 mState Aid exposure (sec 81): $ 2.9 mFund Balance Protocol Target: $ 3.8 million
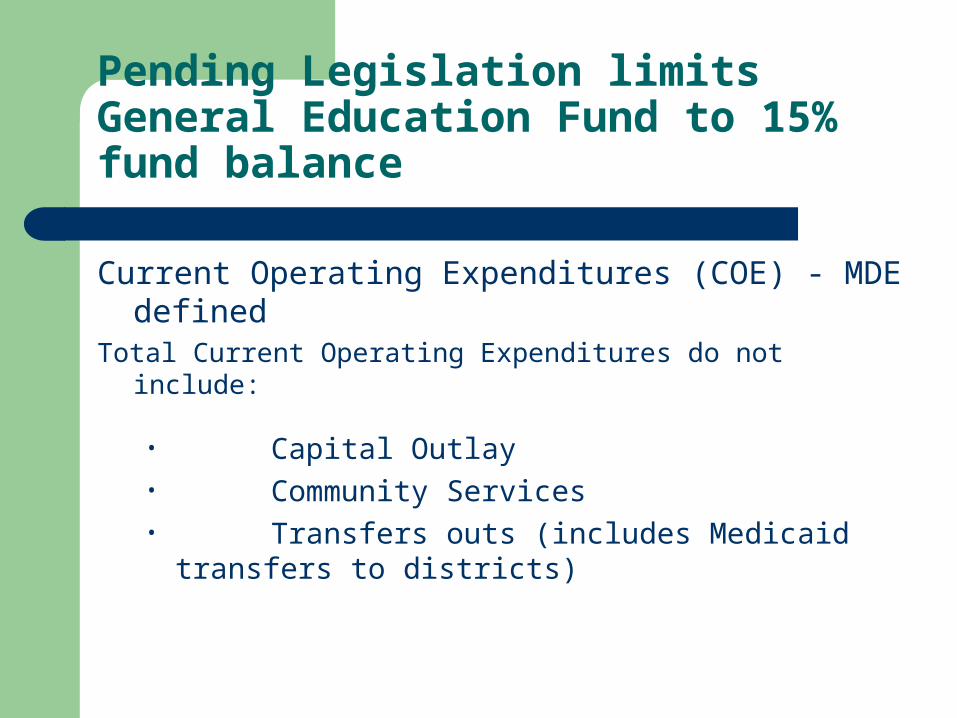
Pending Legislation limits General Education Fund to 15% fund balance
Current Operating Expenditures (COE) - MDE defined Total Current Operating Expenditures do not include:
• Capital Outlay• Community Services• Transfers outs (includes Medicaid transfers to
districts)
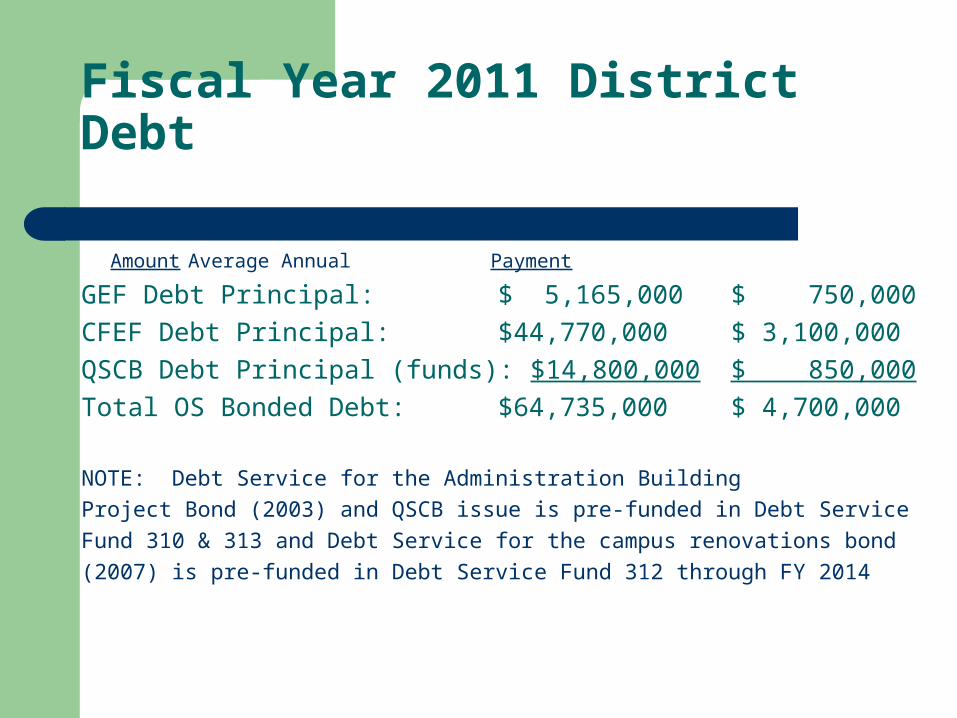
Fiscal Year 2011 District Debt
Amount Average Annual
Payment
GEF Debt Principal: $ 5,165,000 $ 750,000
CFEF Debt Principal: $44,770,000 $ 3,100,000
QSCB Debt Principal (funds): $14,800,000 $ 850,000
Total OS Bonded Debt: $64,735,000 $ 4,700,000
NOTE: Debt Service for the Administration Building
Project Bond (2003) and QSCB issue is pre-funded in Debt Service
Fund 310 & 313 and Debt Service for the campus renovations bond
(2007) is pre-funded in Debt Service Fund 312 through FY 2014
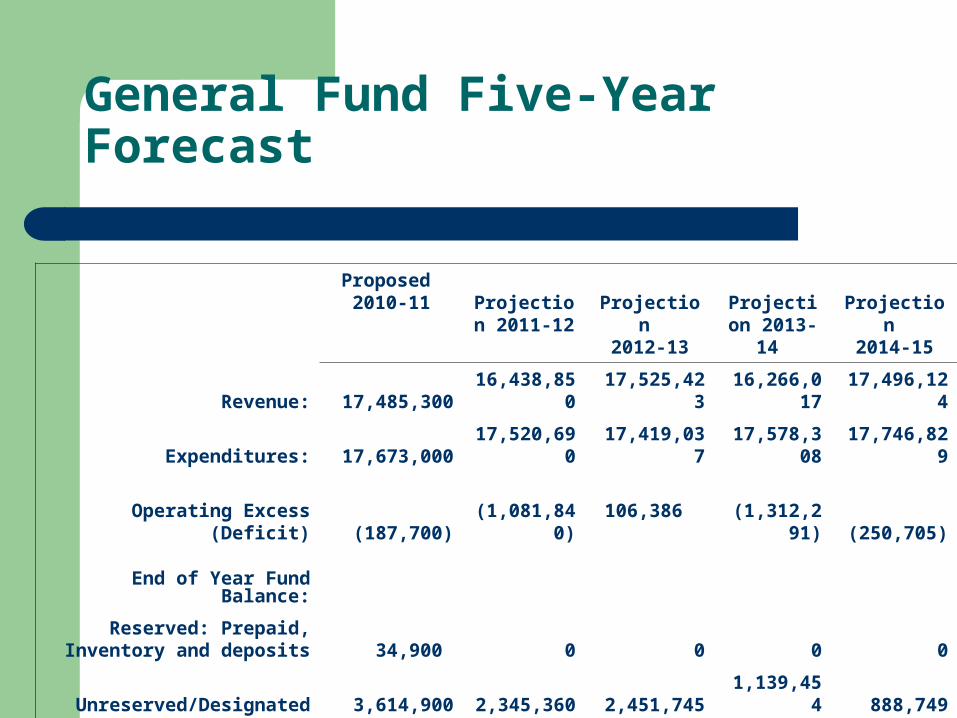
General Fund Five-Year Forecast
Proposed 2010-11
Projection 2011-12
Projection 2012-13
Projection 2013-14
Projection 2014-15
Revenue: 17,485,300 16,438,850 17,525,423 16,266,017 17,496,124
Expenditures: 17,673,000 17,520,690 17,419,037 17,578,308 17,746,829
Operating Excess (Deficit)
(187,700)
(1,081,840)106,386
(1,312,291) (250,705)
End of Year Fund Balance:
Reserved: Prepaid, Inventory and deposits 34,900 0 0 0 0
Unreserved/Designated 3,614,900 2,345,360 2,451,745 1,139,454 888,749
Total 3,392,300 2,345,360 2,451,745 1,139,454 888,749
End of Year Unreserved FB as % of Expenditures 19.19% 13.39% 14.08% 6.48% 5.01%
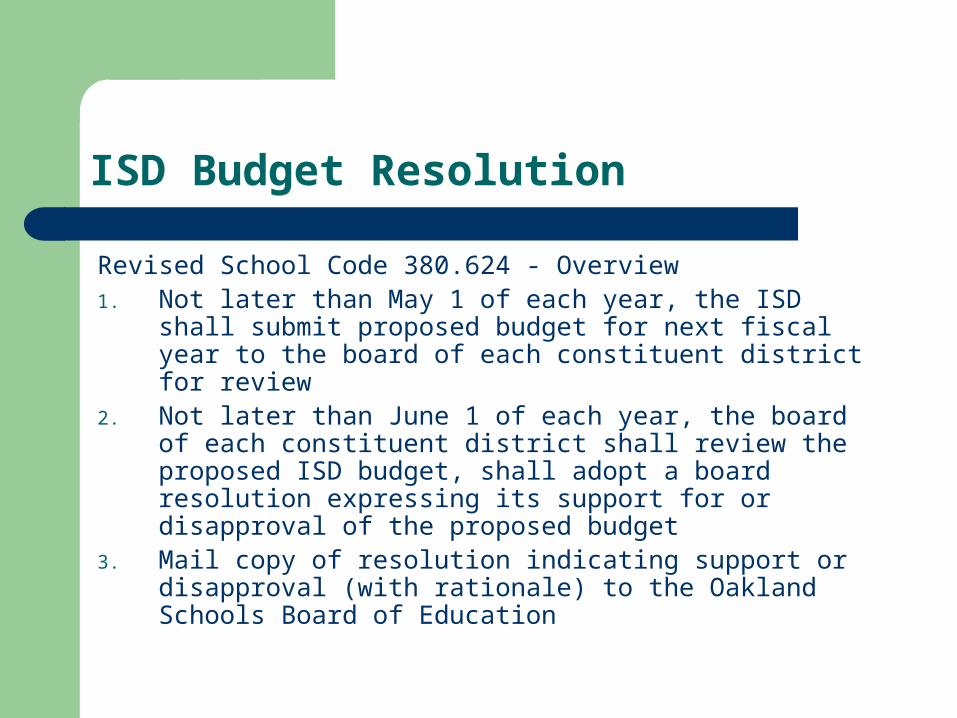
ISD Budget Resolution
Revised School Code 380.624 - Overview1. Not later than May 1 of each year, the ISD shall submit
proposed budget for next fiscal year to the board of each constituent district for review
2. Not later than June 1 of each year, the board of each constituent district shall review the proposed ISD budget, shall adopt a board resolution expressing its support for or disapproval of the proposed budget
3. Mail copy of resolution indicating support or disapproval (with rationale) to the Oakland Schools Board of Education

General Education Fund
Questions & Comments

Special Education Fund Summary
Total Revenue: $142.0 Million– Property tax – $134.9 M (95% of total revenue)– Other local revenues – $1.4 M– State sources revenues – $5.7 M
Total Expenditures: $153.0 Million– Program supervision and direction – $2.3 M– Program operations – $7.5 M– Plant and fixed charges – $5.7 M– LEA transfers and program subsidies – $137.5 M
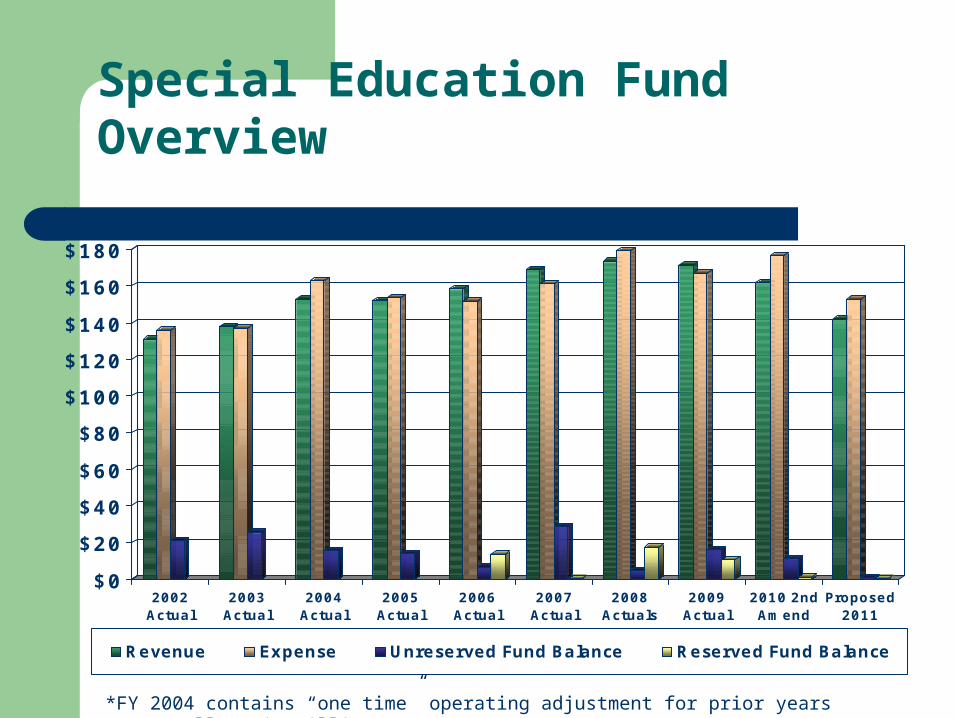
Special Education Fund Overview
$0
$20
$40
$60
$80
$100
$120
$140
$160
$180
2002Actual
2003Actual
2004Actual
2005Actual
2006Actual
2007Actual
2008Actuals
2009Actual
2010 2ndAmend
Proposed2011
Revenue Expense Unreserved Fund Balance Reserved Fund Balance
*FY 2004 contains “one time” operating adjustment for prior years **Dollars in millions
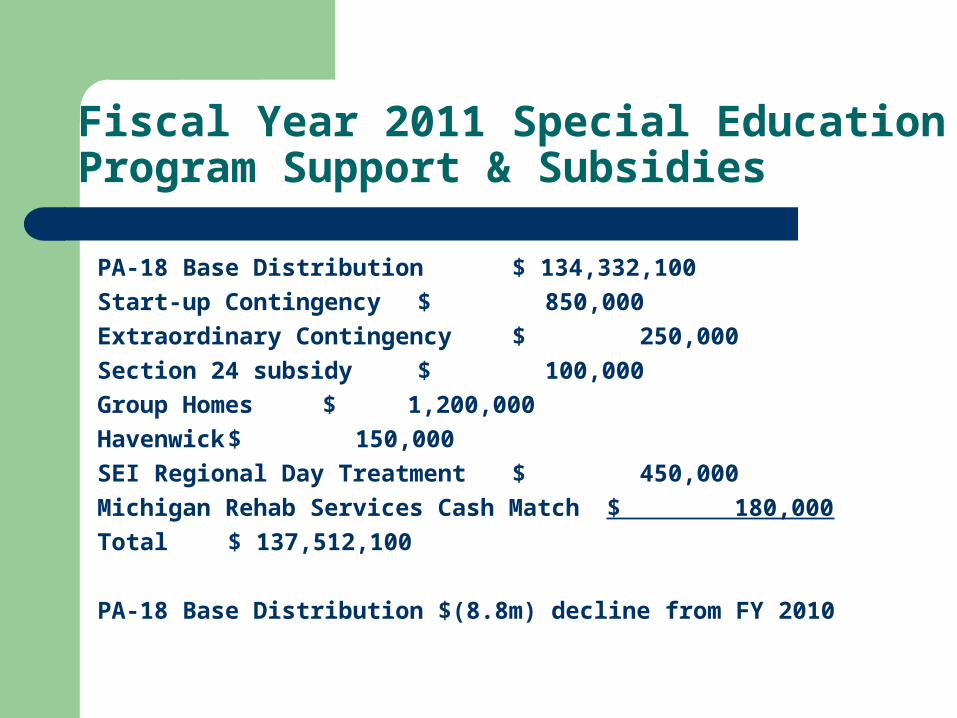
Fiscal Year 2011 Special Education Program Support & Subsidies
PA-18 Base Distribution $ 134,332,100
Start-up Contingency $ 850,000
Extraordinary Contingency $ 250,000
Section 24 subsidy $ 100,000
Group Homes $ 1,200,000
Havenwick $ 150,000
SEI Regional Day Treatment $ 450,000
Michigan Rehab Services Cash Match $ 180,000
Total $ 137,512,100
PA-18 Base Distribution $(8.8m) decline from FY 2010
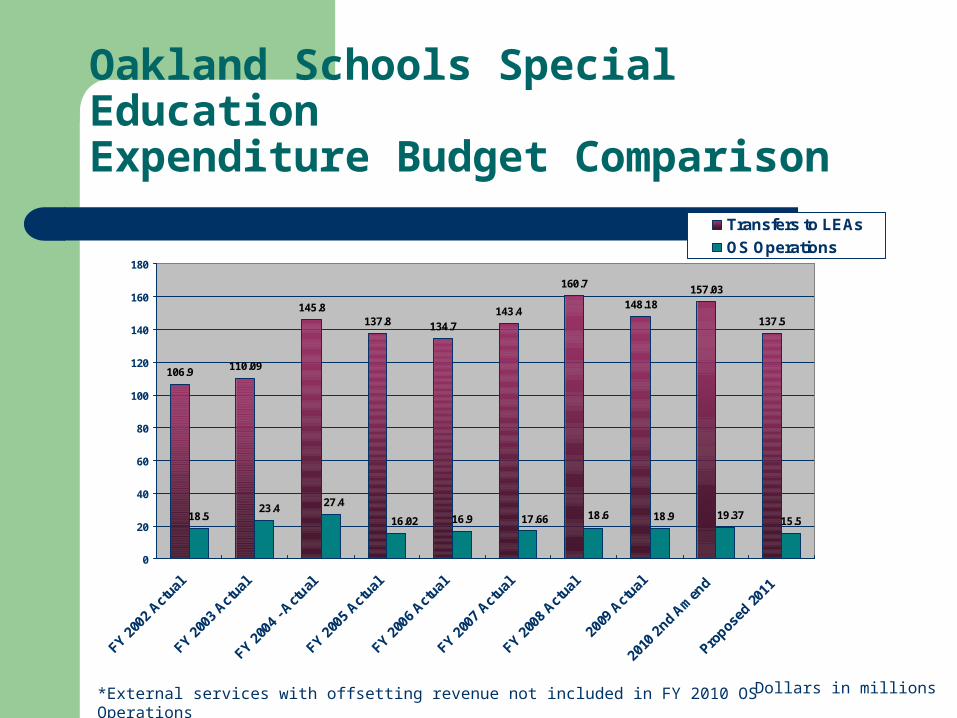
106.9 110.09
145.8137.8 134.7
143.4
160.7
148.18157.03
137.5
18.5 16.9 15.519.3718.918.617.6616.02
27.423.4
0
20
40
60
80
100
120
140
160
180
FY 200
2 Act
ual
FY 200
3 Act
ual
FY 200
4 - A
ctual
FY 200
5 Act
ual
FY 200
6 Act
ual
FY 200
7 Act
ual
FY 200
8 Act
ual
2009
Act
ual
2010
2nd
Amen
d
Propos
ed 20
11
Transfers to LEAs
OS Operations
Dollars in millions
Oakland Schools Special Education Expenditure Budget Comparison
*External services with offsetting revenue not included in FY 2010 OS Operations
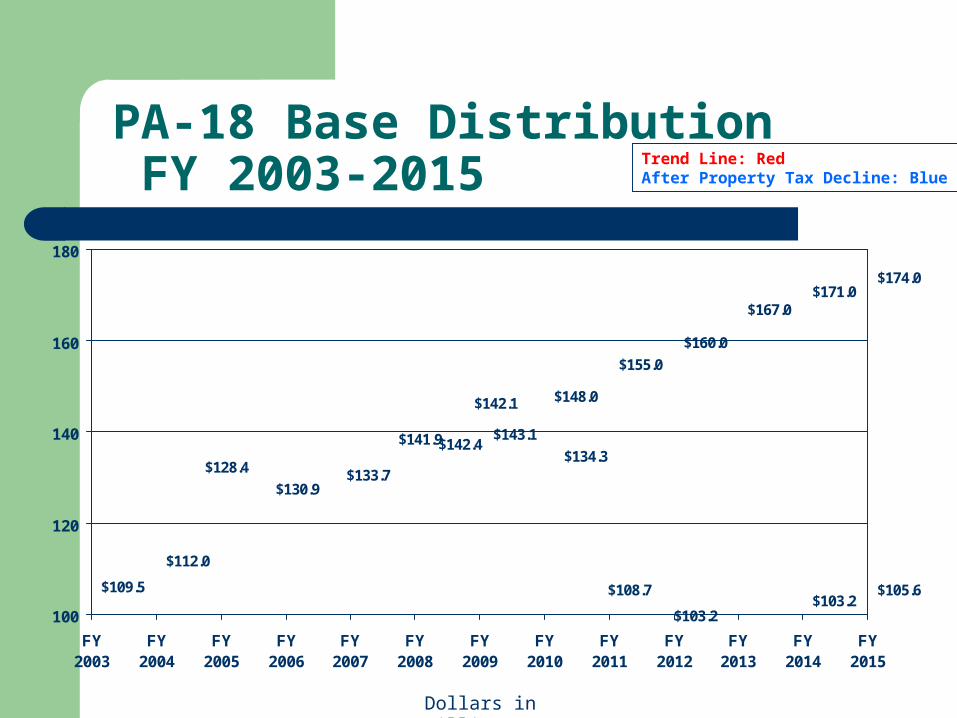
PA-18 Base Distribution FY 2003-2015
$103.2$105.6
$112.0
$148.0
$155.0
$160.0
$167.0$171.0
$174.0
$141.9$142.4$143.1
$108.7
$103.2
$128.4
$109.5
$134.3
$130.9$133.7
$142.1
100
120
140
160
180
FY2003
FY2004
FY2005
FY2006
FY2007
FY2008
FY2009
FY2010
FY2011
FY2012
FY2013
FY2014
FY2015
Dollars in millions
Trend Line: RedAfter Property Tax Decline: Blue

Fiscal Year 2011Special Education Fund Balance
END OF YEAR:Unreserved: $ 755,200
Reserved:Future SE Center Facility Renovations $ 286,000
Total Budgeted Ending Fund Balance $ 1,061,200
5% of SEF operating expenditures ($15.5 m): $ .775 mState Aid exposure (sec 51a, 51a.8) $ 3.9 mFund Balance Protocol Target: $ 4.675 million
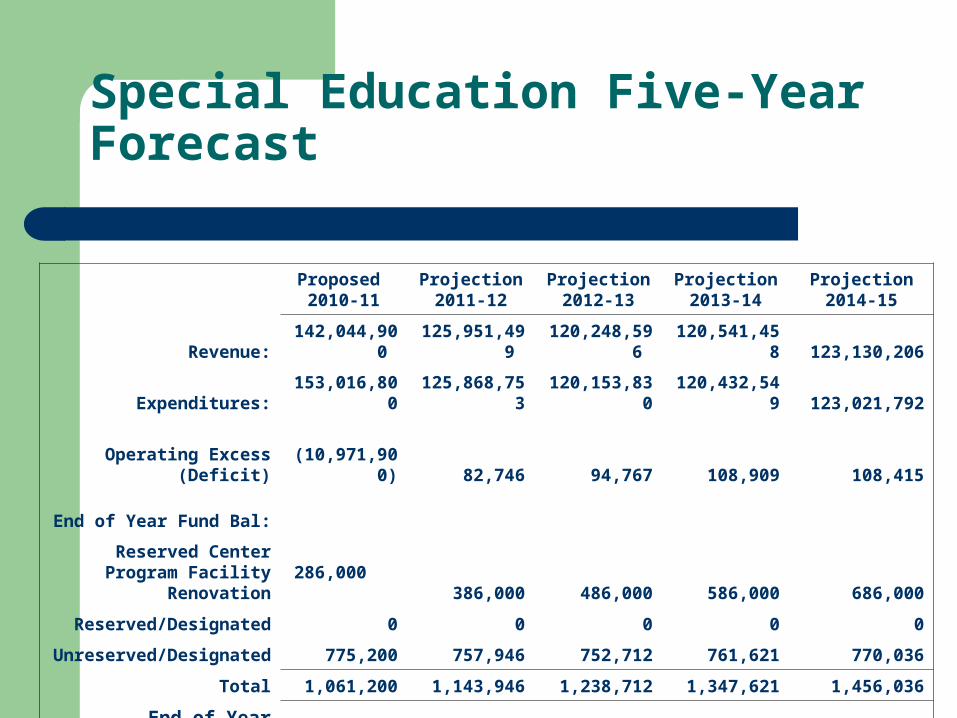
Special Education Five-Year Forecast
Proposed
2010-11Projection
2011-12Projection
2012-13Projection
2013-14Projection
2014-15
Revenue: 142,044,900 125,951,499 120,248,596 120,541,458 123,130,206
Expenditures: 153,016,800 125,868,753 120,153,830 120,432,549 123,021,792
Operating Excess (Deficit) (10,971,900) 82,746 94,767 108,909 108,415
End of Year Fund Bal:
Reserved Center Program Facility Renovation 286,000 386,000 486,000 586,000 686,000
Reserved/Designated 0 0 0 0 0
Unreserved/Designated 775,200 757,946 752,712 761,621 770,036
Total 1,061,200 1,143,946 1,238,712 1,347,621 1,456,036
End of Year Unreserved FB % net of LEA
O.T. 5.00% 5.00% 5.00% 5.00% 5.00%

Special Education Fund
Questions & Comments
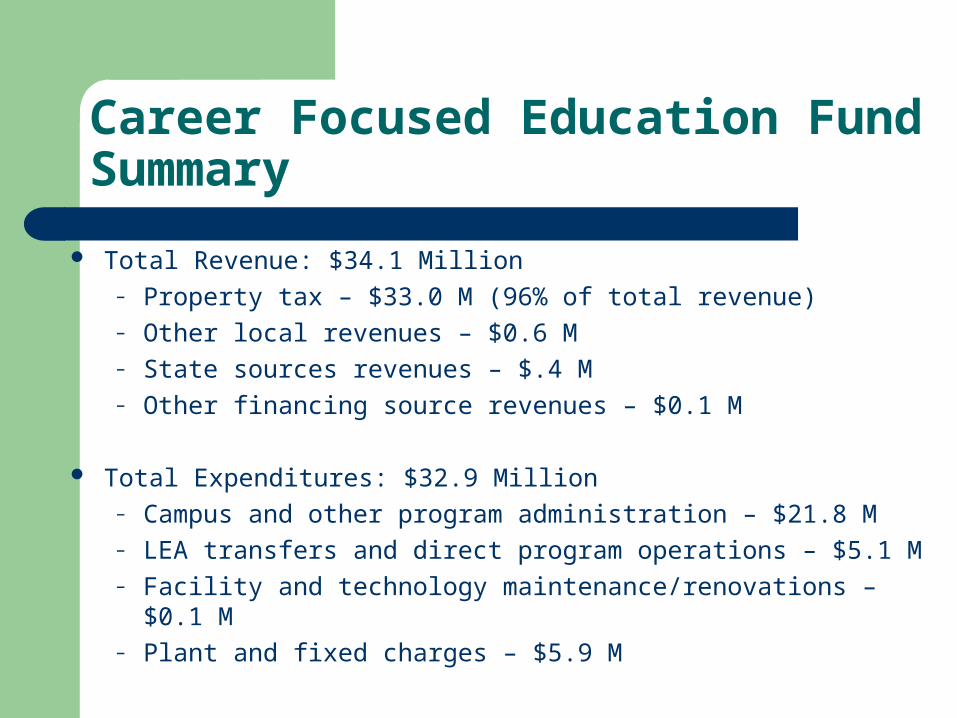
Career Focused Education Fund Summary
Total Revenue: $34.1 Million– Property tax – $33.0 M (96% of total revenue)– Other local revenues – $0.6 M– State sources revenues – $.4 M– Other financing source revenues – $0.1 M
Total Expenditures: $32.9 Million– Campus and other program administration – $21.8 M– LEA transfers and direct program operations – $5.1 M– Facility and technology maintenance/renovations – $0.1 M– Plant and fixed charges – $5.9 M
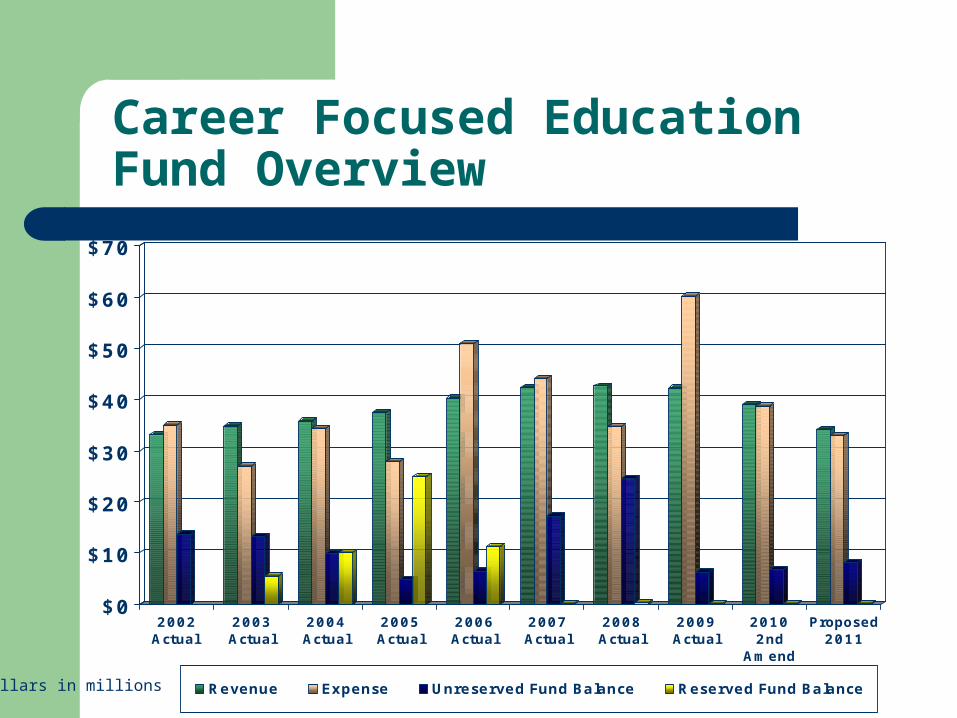
Career Focused EducationFund Overview
$0
$10
$20
$30
$40
$50
$60
$70
2002Actual
2003Actual
2004Actual
2005Actual
2006Actual
2007Actual
2008Actual
2009Actual
20102nd
Amend
Proposed2011
Revenue Expense Unreserved Fund Balance Reserved Fund BalanceDollars in millions
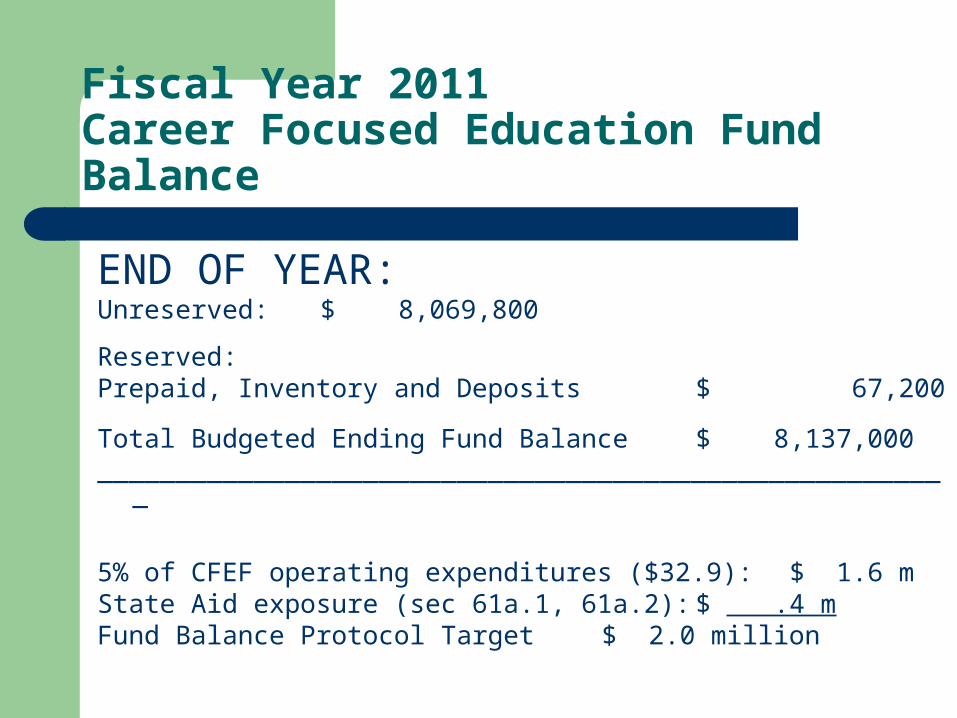
Fiscal Year 2011Career Focused Education Fund Balance
END OF YEAR:Unreserved: $ 8,069,800
Reserved:Prepaid, Inventory and Deposits $ 67,200
Total Budgeted Ending Fund Balance $ 8,137,000_______________________________________________________
5% of CFEF operating expenditures ($32.9): $ 1.6 mState Aid exposure (sec 61a.1, 61a.2): $ .4 mFund Balance Protocol Target $ 2.0 million
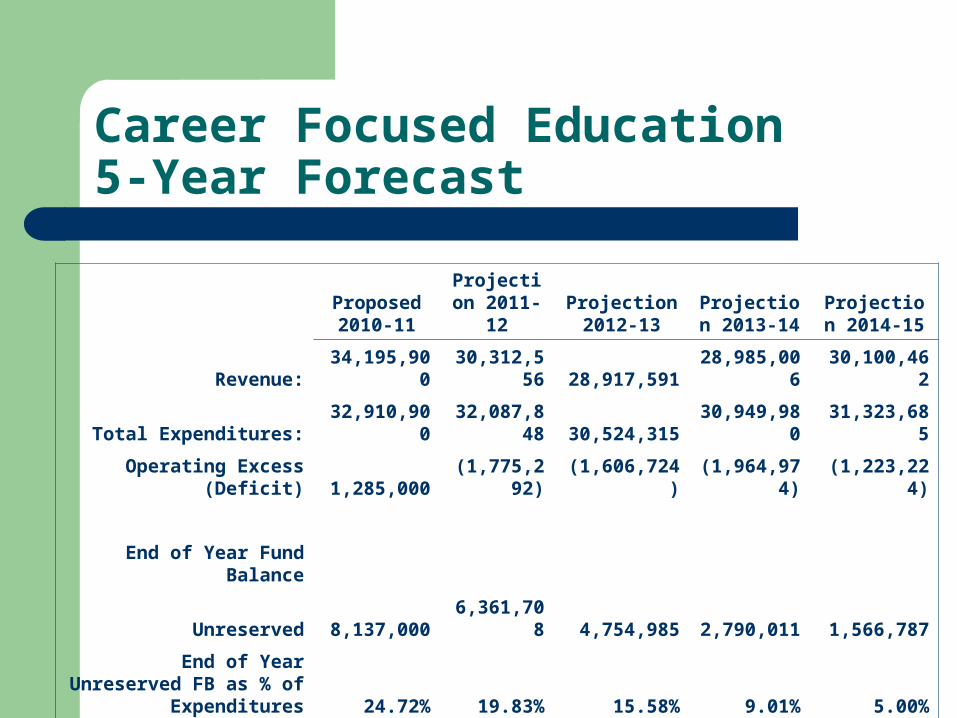
Career Focused Education5-Year Forecast
Proposed 2010-11
Projection 2011-12
Projection 2012-13
Projection 2013-14
Projection 2014-15
Revenue: 34,195,900 30,312,556 28,917,591 28,985,006 30,100,462
Total Expenditures: 32,910,900 32,087,848 30,524,315 30,949,980 31,323,685
Operating Excess (Deficit) 1,285,000(1,775,292
) (1,606,724) (1,964,974) (1,223,224)
End of Year Fund Balance
Unreserved 8,137,000 6,361,708 4,754,985 2,790,011 1,566,787
End of Year Unreserved FB as % of Expenditures 24.72% 19.83% 15.58% 9.01% 5.00%

Career Focused Education Fund
Questions & Comments
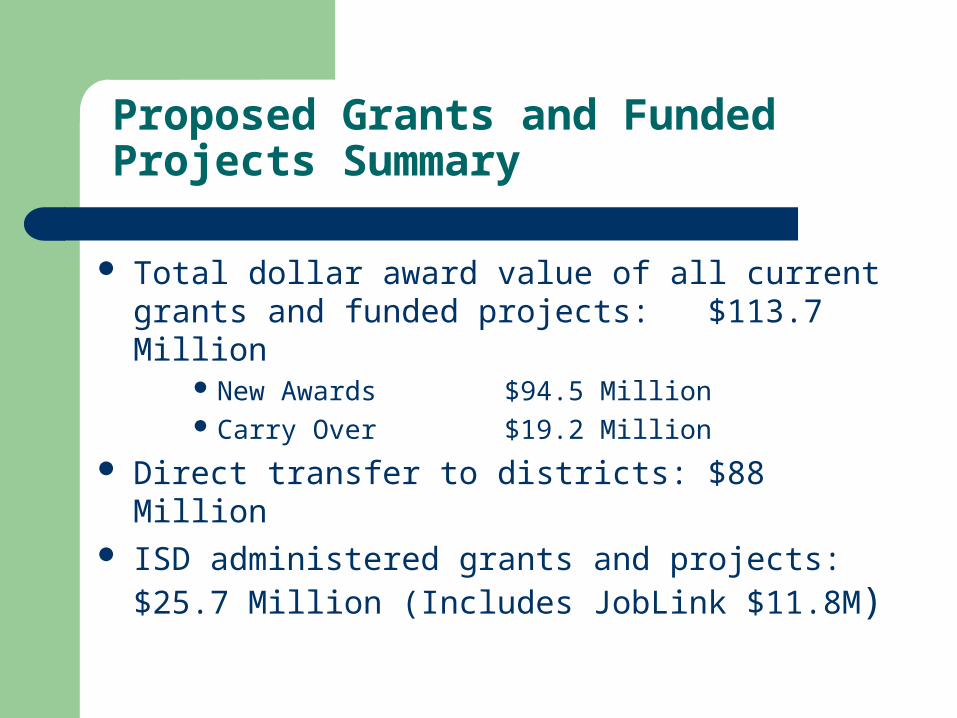
Proposed Grants and Funded Projects Summary
Total dollar award value of all current grants and funded projects: $113.7 Million
New Awards $94.5 Million Carry Over $19.2 Million
Direct transfer to districts: $88 Million ISD administered grants and projects: $25.7 Million
(Includes JobLink $11.8M)
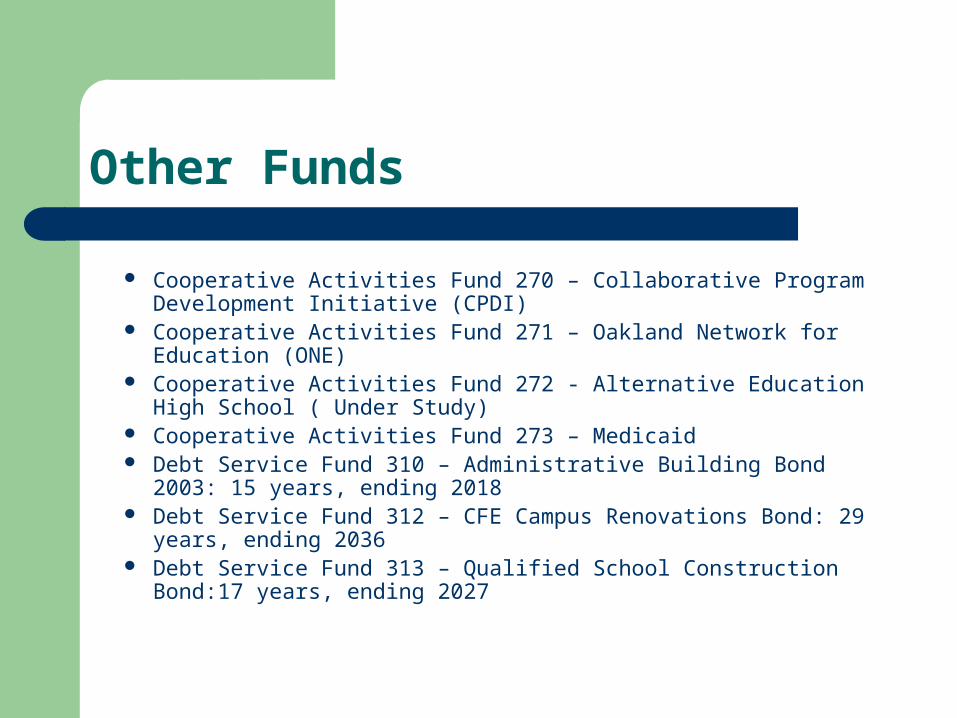
Other Funds
Cooperative Activities Fund 270 – Collaborative Program Development Initiative (CPDI)
Cooperative Activities Fund 271 – Oakland Network for Education (ONE)
Cooperative Activities Fund 272 - Alternative Education High School ( Under Study)
Cooperative Activities Fund 273 – Medicaid Debt Service Fund 310 – Administrative Building Bond 2003: 15
years, ending 2018 Debt Service Fund 312 – CFE Campus Renovations Bond: 29
years, ending 2036 Debt Service Fund 313 – Qualified School Construction Bond:17
years, ending 2027
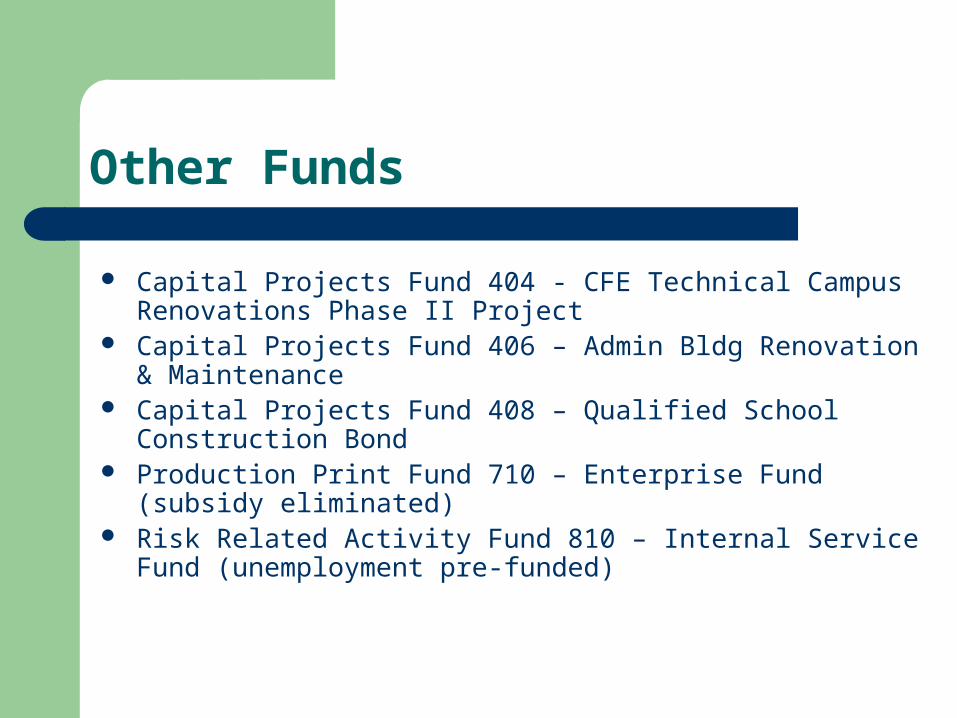
Other Funds
Capital Projects Fund 404 - CFE Technical Campus Renovations Phase II Project
Capital Projects Fund 406 – Admin Bldg Renovation & Maintenance Capital Projects Fund 408 – Qualified School Construction Bond Production Print Fund 710 – Enterprise Fund (subsidy eliminated) Risk Related Activity Fund 810 – Internal Service Fund
(unemployment pre-funded)

Questions & Comments


![REPUBLIC OF GHANA THE COMPOSITE BUDGET OF THE …€¦ · DORMAA CENTRAL MUNICIPAL ASSEMBLY FOR THE 2015 FISCAL YEAR [DCMA BUDGET 2015] ... Composite budgets which integrated budgets](https://img.pdfslide.us/doc/110x75/5f8a34cf6a73f4703d570074/republic-of-ghana-the-composite-budget-of-the-dormaa-central-municipal-assembly.jpg)