Embed Size (px)
Citation preview
Chapter 2
Overview of Energy Efficiency in the EAS Region
This chapter should be cited as
Li, Y. (2015), ‘Overview of Energy Efficiency in the EAS Region’, in Advancing the Energy
Management System in the East Asia Summit Region. ERIA Research Project Report
2014-39, Jakarta: ERIA, pp.3-73. Available at:
http://www.eria.org/RPR_FY2014_No.39_Chapter_2.pdf
3
Chapter 2
Overview of Energy Efficiency in the EAS Region
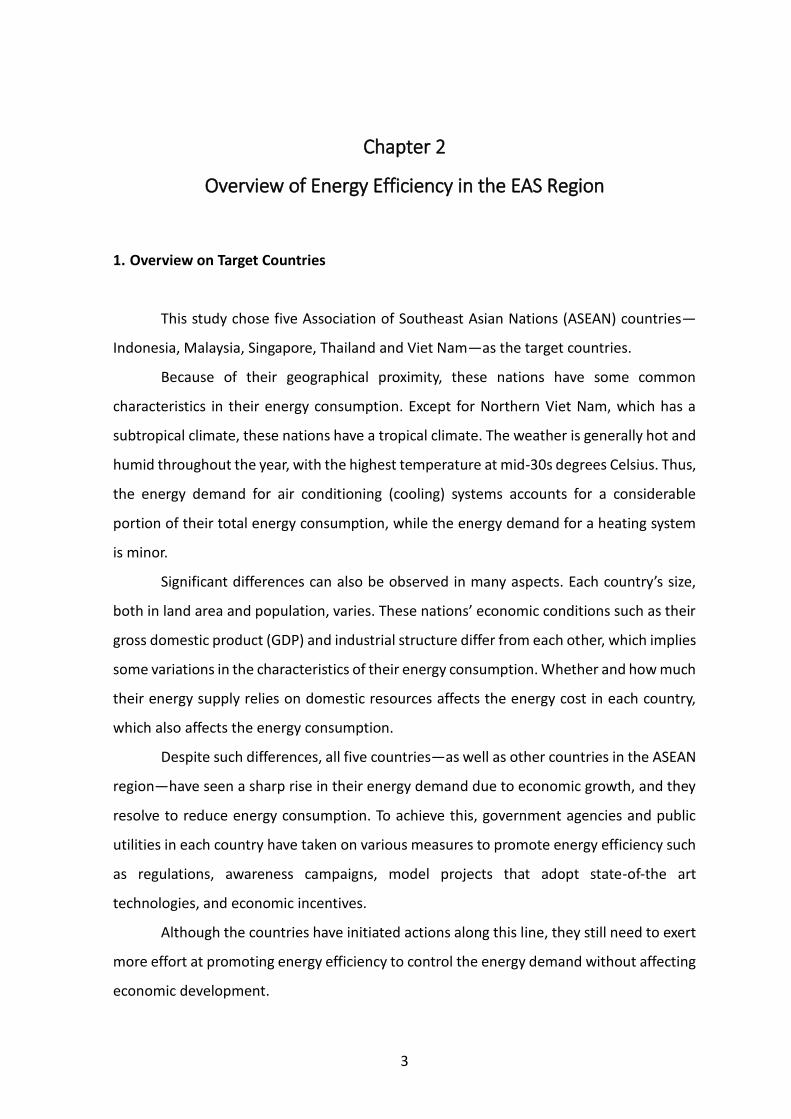
1. Overview on Target Countries
This study chose five Association of Southeast Asian Nations (ASEAN) countries—
Indonesia, Malaysia, Singapore, Thailand and Viet Nam—as the target countries.
Because of their geographical proximity, these nations have some common
characteristics in their energy consumption. Except for Northern Viet Nam, which has a
subtropical climate, these nations have a tropical climate. The weather is generally hot and
humid throughout the year, with the highest temperature at mid-30s degrees Celsius. Thus,
the energy demand for air conditioning (cooling) systems accounts for a considerable
portion of their total energy consumption, while the energy demand for a heating system
is minor.
Significant differences can also be observed in many aspects. Each country’s size,
both in land area and population, varies. These nations’ economic conditions such as their
gross domestic product (GDP) and industrial structure differ from each other, which implies
some variations in the characteristics of their energy consumption. Whether and how much
their energy supply relies on domestic resources affects the energy cost in each country,
which also affects the energy consumption.
Despite such differences, all five countries—as well as other countries in the ASEAN
region—have seen a sharp rise in their energy demand due to economic growth, and they
resolve to reduce energy consumption. To achieve this, government agencies and public
utilities in each country have taken on various measures to promote energy efficiency such
as regulations, awareness campaigns, model projects that adopt state-of-the art
technologies, and economic incentives.
Although the countries have initiated actions along this line, they still need to exert
more effort at promoting energy efficiency to control the energy demand without affecting
economic development.
4
The next section provides an overview of the structure of energy supply and
demand, as well as the current state of energy efficiency policies and regulations in each of
the five countries.
1.1. Statistical overview of five countries
(1) Indonesia
i. Population and GDP
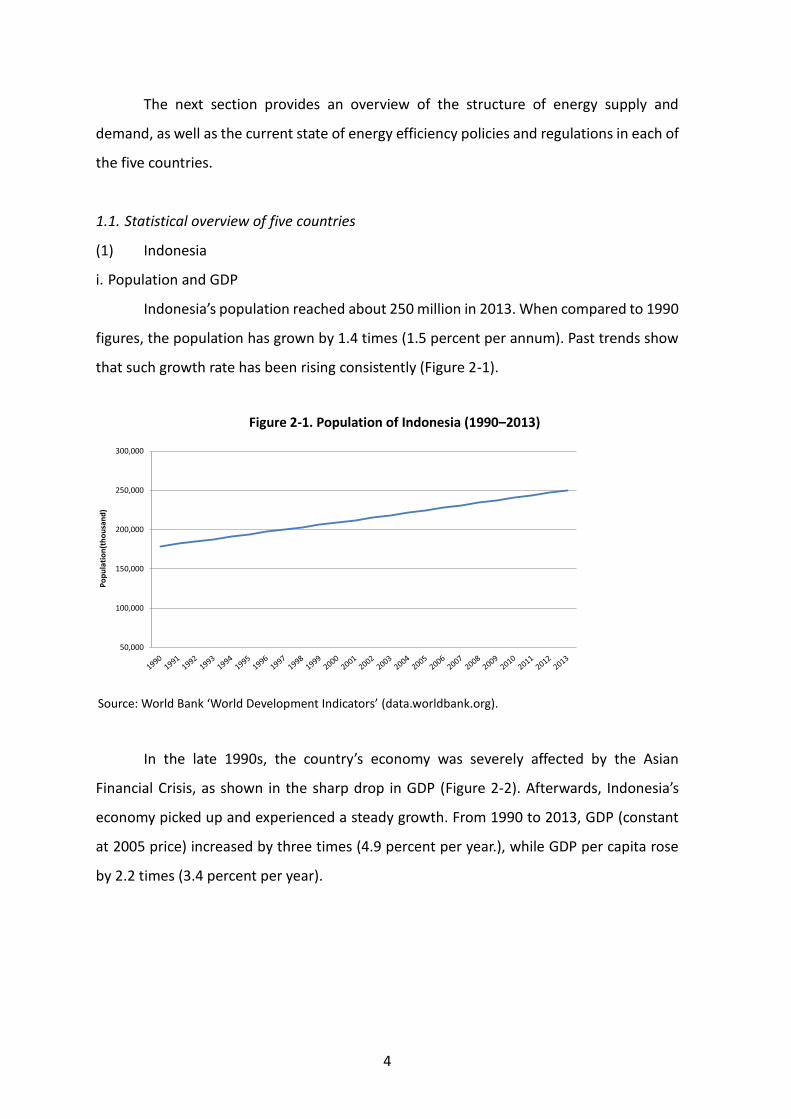
Indonesia’s population reached about 250 million in 2013. When compared to 1990
figures, the population has grown by 1.4 times (1.5 percent per annum). Past trends show
that such growth rate has been rising consistently (Figure 2-1).
Figure 2-1. Population of Indonesia (1990–2013)
Source: World Bank ‘World Development Indicators’ (data.worldbank.org).
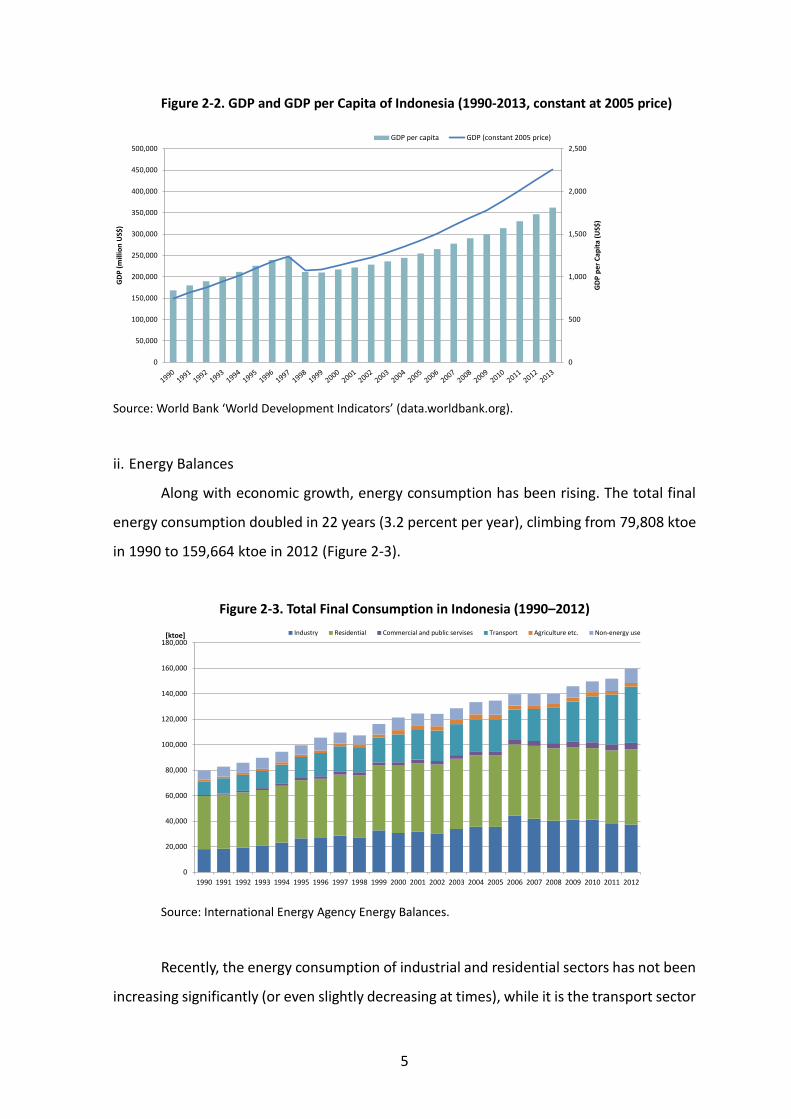
In the late 1990s, the country’s economy was severely affected by the Asian
Financial Crisis, as shown in the sharp drop in GDP (Figure 2-2). Afterwards, Indonesia’s
economy picked up and experienced a steady growth. From 1990 to 2013, GDP (constant
at 2005 price) increased by three times (4.9 percent per year.), while GDP per capita rose
by 2.2 times (3.4 percent per year).
50,000
100,000
150,000
200,000
250,000
300,000
Po
pu
lati
on
(th
ou
san
d)
5
Figure 2-2. GDP and GDP per Capita of Indonesia (1990-2013, constant at 2005 price)
Source: World Bank ‘World Development Indicators’ (data.worldbank.org).
ii. Energy Balances
Along with economic growth, energy consumption has been rising. The total final
energy consumption doubled in 22 years (3.2 percent per year), climbing from 79,808 ktoe
in 1990 to 159,664 ktoe in 2012 (Figure 2-3).
Figure 2-3. Total Final Consumption in Indonesia (1990–2012)
Source: International Energy Agency Energy Balances.
Recently, the energy consumption of industrial and residential sectors has not been
increasing significantly (or even slightly decreasing at times), while it is the transport sector
0
500
1,000
1,500
2,000
2,500
0
50,000
100,000
150,000
200,000
250,000
300,000
350,000
400,000
450,000
500,000
GD
P p
er
Cap
ita
(US$
)
GD
P (
mill
ion
US$
)
GDP per capita GDP (constant 2005 price)
0
20,000
40,000
60,000
80,000
100,000
120,000
140,000
160,000
180,000
1990 1991 1992 1993 1994 1995 1996 1997 1998 1999 2000 2001 2002 2003 2004 2005 2006 2007 2008 2009 2010 2011 2012
Industry Residential Commercial and public servises Transport Agriculture etc. Non-energy use[ktoe]
6
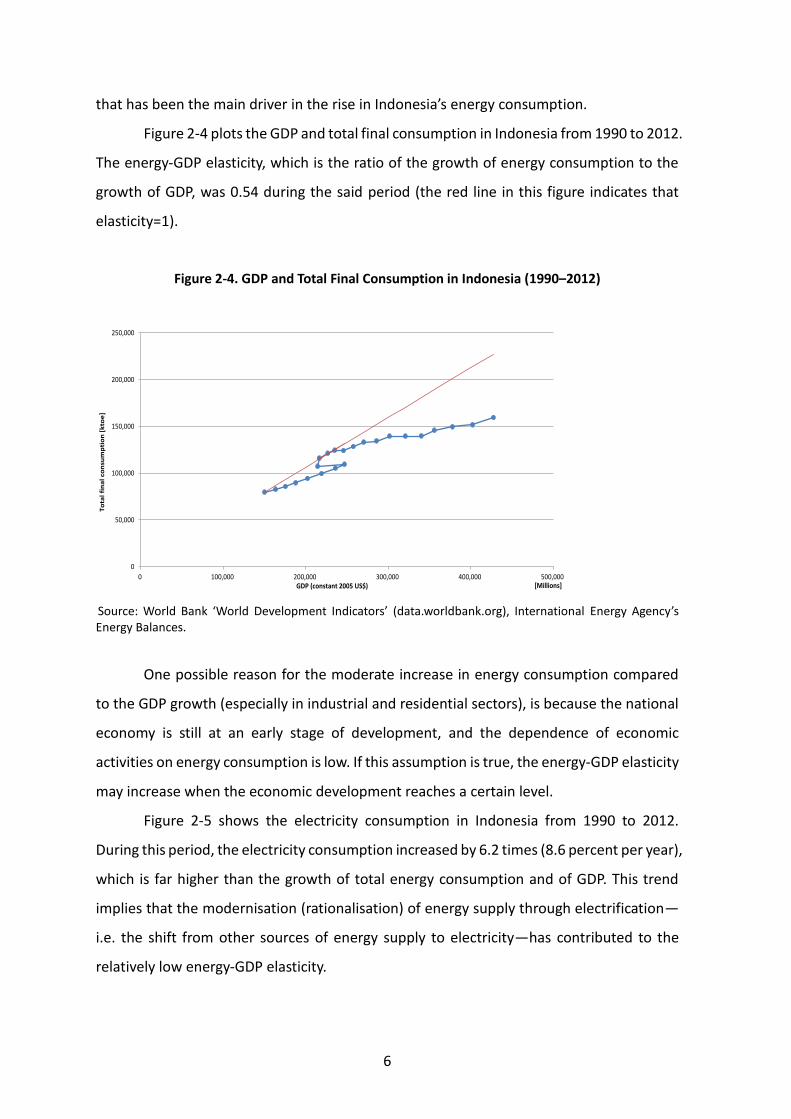
that has been the main driver in the rise in Indonesia’s energy consumption.
Figure 2-4 plots the GDP and total final consumption in Indonesia from 1990 to 2012.
The energy-GDP elasticity, which is the ratio of the growth of energy consumption to the
growth of GDP, was 0.54 during the said period (the red line in this figure indicates that
elasticity=1).
Figure 2-4. GDP and Total Final Consumption in Indonesia (1990–2012)
Source: World Bank ‘World Development Indicators’ (data.worldbank.org), International Energy Agency’s Energy Balances.
One possible reason for the moderate increase in energy consumption compared
to the GDP growth (especially in industrial and residential sectors), is because the national
economy is still at an early stage of development, and the dependence of economic
activities on energy consumption is low. If this assumption is true, the energy-GDP elasticity
may increase when the economic development reaches a certain level.
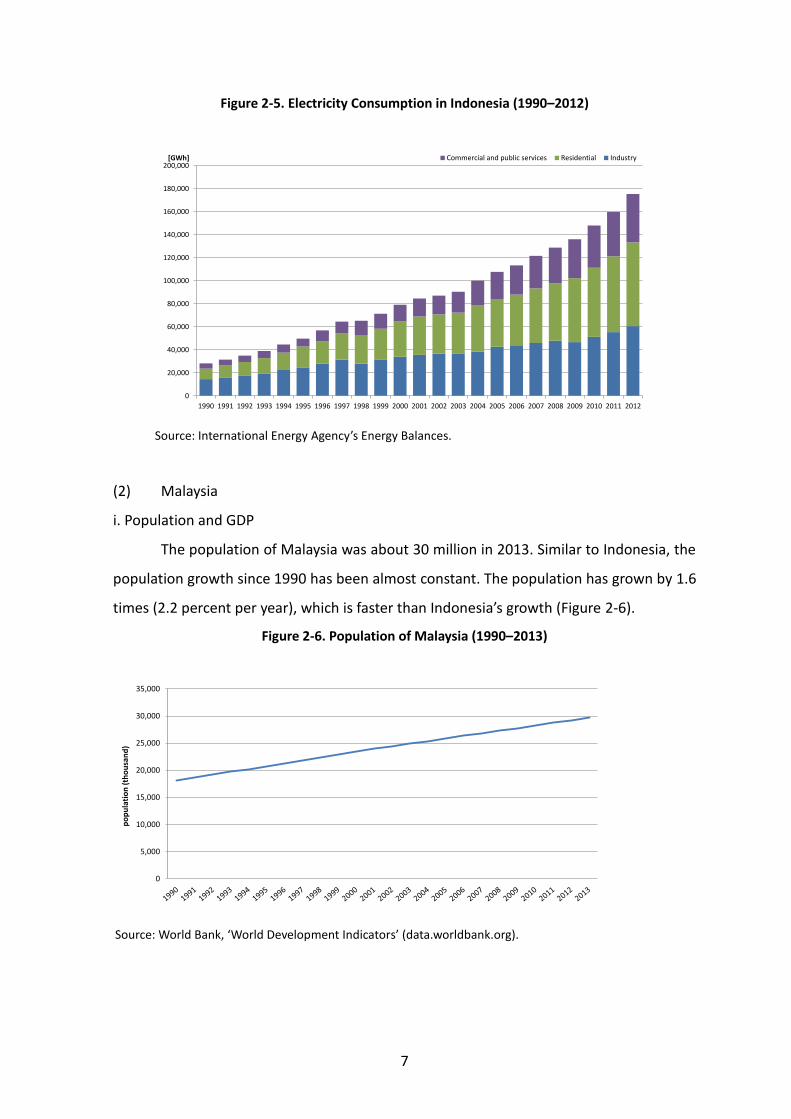
Figure 2-5 shows the electricity consumption in Indonesia from 1990 to 2012.
During this period, the electricity consumption increased by 6.2 times (8.6 percent per year),
which is far higher than the growth of total energy consumption and of GDP. This trend
implies that the modernisation (rationalisation) of energy supply through electrification—
i.e. the shift from other sources of energy supply to electricity—has contributed to the
relatively low energy-GDP elasticity.
0
50,000
100,000
150,000
200,000
250,000
0 100,000 200,000 300,000 400,000 500,000
To
tal
fin
al
con
sum
pti
on
[k
toe
]
GDP (constant 2005 US$) [Millions]
7
Figure 2-5. Electricity Consumption in Indonesia (1990–2012)
Source: International Energy Agency’s Energy Balances.
(2) Malaysia
i. Population and GDP
The population of Malaysia was about 30 million in 2013. Similar to Indonesia, the
population growth since 1990 has been almost constant. The population has grown by 1.6
times (2.2 percent per year), which is faster than Indonesia’s growth (Figure 2-6).
Figure 2-6. Population of Malaysia (1990–2013)
Source: World Bank, ‘World Development Indicators’ (data.worldbank.org).
0
20,000
40,000
60,000
80,000
100,000
120,000
140,000
160,000
180,000
200,000
1990 1991 1992 1993 1994 1995 1996 1997 1998 1999 2000 2001 2002 2003 2004 2005 2006 2007 2008 2009 2010 2011 2012
Commercial and public services Residential Industry[GWh]
0
5,000
10,000
15,000
20,000
25,000
30,000
35,000
po
pu
lati
on
(th
ou
san
d)
8
The Malaysian economy was also affected by the Asian Financial Crisis in the late
1990s although not as much as the impact on Indonesia. Figure 2-7 (which provides the
GDP and GDP per capita values in US dollars) shows another dip in GDP growth in the late
2000s due to the Global Financial Crisis.
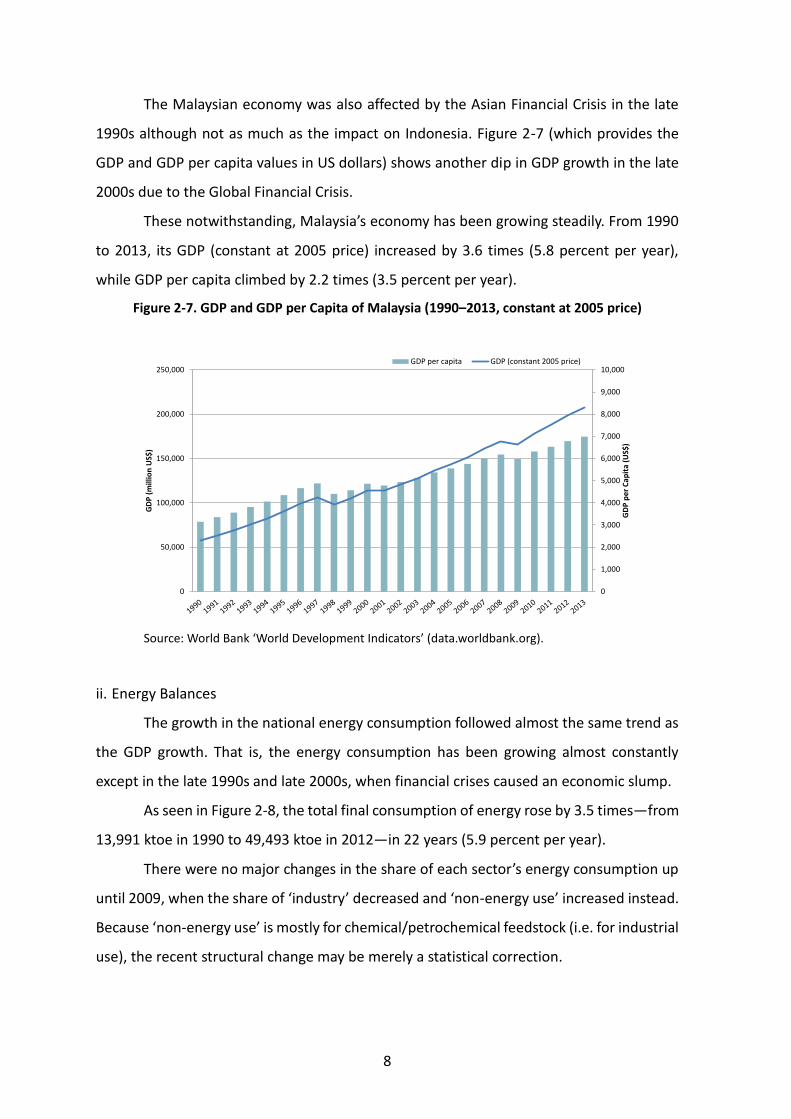
These notwithstanding, Malaysia’s economy has been growing steadily. From 1990
to 2013, its GDP (constant at 2005 price) increased by 3.6 times (5.8 percent per year),
while GDP per capita climbed by 2.2 times (3.5 percent per year).
Figure 2-7. GDP and GDP per Capita of Malaysia (1990–2013, constant at 2005 price)
Source: World Bank ‘World Development Indicators’ (data.worldbank.org).
ii. Energy Balances
The growth in the national energy consumption followed almost the same trend as
the GDP growth. That is, the energy consumption has been growing almost constantly
except in the late 1990s and late 2000s, when financial crises caused an economic slump.
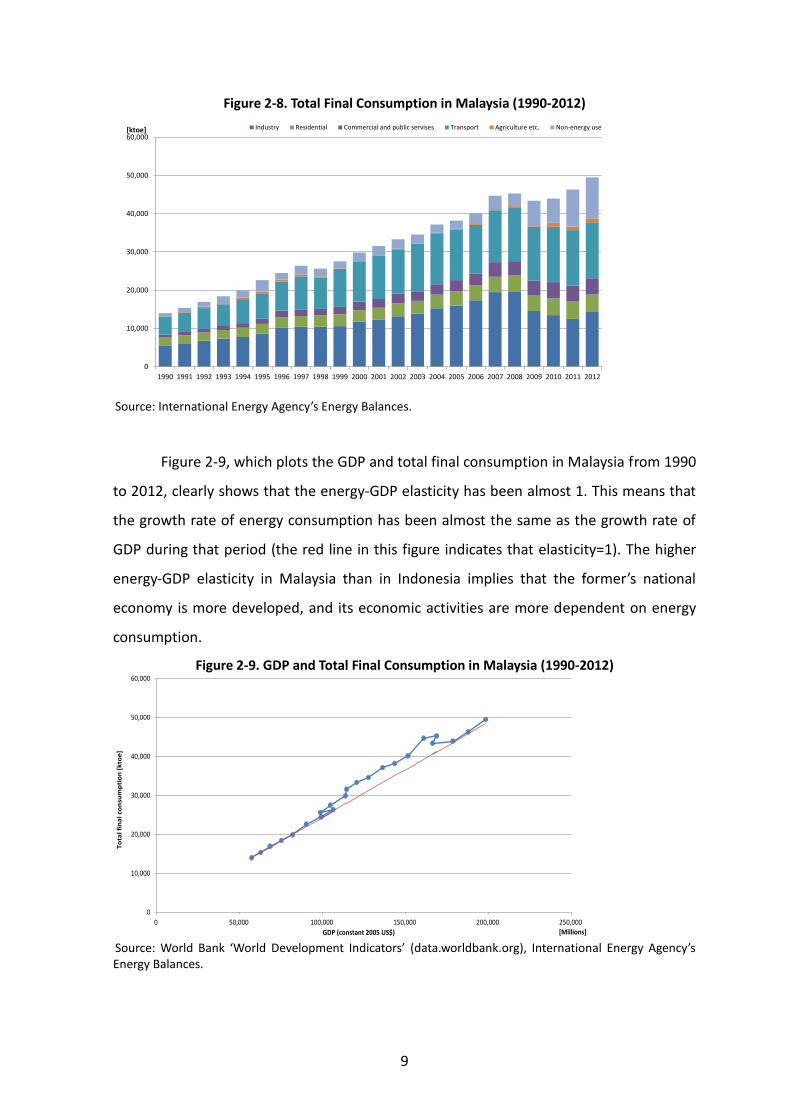
As seen in Figure 2-8, the total final consumption of energy rose by 3.5 times—from
13,991 ktoe in 1990 to 49,493 ktoe in 2012—in 22 years (5.9 percent per year).
There were no major changes in the share of each sector’s energy consumption up
until 2009, when the share of ‘industry’ decreased and ‘non-energy use’ increased instead.
Because ‘non-energy use’ is mostly for chemical/petrochemical feedstock (i.e. for industrial
use), the recent structural change may be merely a statistical correction.
0
1,000
2,000
3,000
4,000
5,000
6,000
7,000
8,000
9,000
10,000
0
50,000
100,000
150,000
200,000
250,000
GD
P p
er
Cap
ita
(US$
)
GD
P (
mill
ion
US$
)
GDP per capita GDP (constant 2005 price)
9
Figure 2-8. Total Final Consumption in Malaysia (1990-2012)
Source: International Energy Agency’s Energy Balances.
Figure 2-9, which plots the GDP and total final consumption in Malaysia from 1990
to 2012, clearly shows that the energy-GDP elasticity has been almost 1. This means that
the growth rate of energy consumption has been almost the same as the growth rate of
GDP during that period (the red line in this figure indicates that elasticity=1). The higher
energy-GDP elasticity in Malaysia than in Indonesia implies that the former’s national
economy is more developed, and its economic activities are more dependent on energy
consumption.
Figure 2-9. GDP and Total Final Consumption in Malaysia (1990-2012)
Source: World Bank ‘World Development Indicators’ (data.worldbank.org), International Energy Agency’s Energy Balances.
0
10,000
20,000
30,000
40,000
50,000
60,000
1990 1991 1992 1993 1994 1995 1996 1997 1998 1999 2000 2001 2002 2003 2004 2005 2006 2007 2008 2009 2010 2011 2012
Industry Residential Commercial and public servises Transport Agriculture etc. Non-energy use[ktoe]
0
10,000
20,000
30,000
40,000
50,000
60,000
0 50,000 100,000 150,000 200,000 250,000
To
tal
fin
al
con
sum
pti
on
[k
toe
]
GDP (constant 2005 US$) [Millions]
10
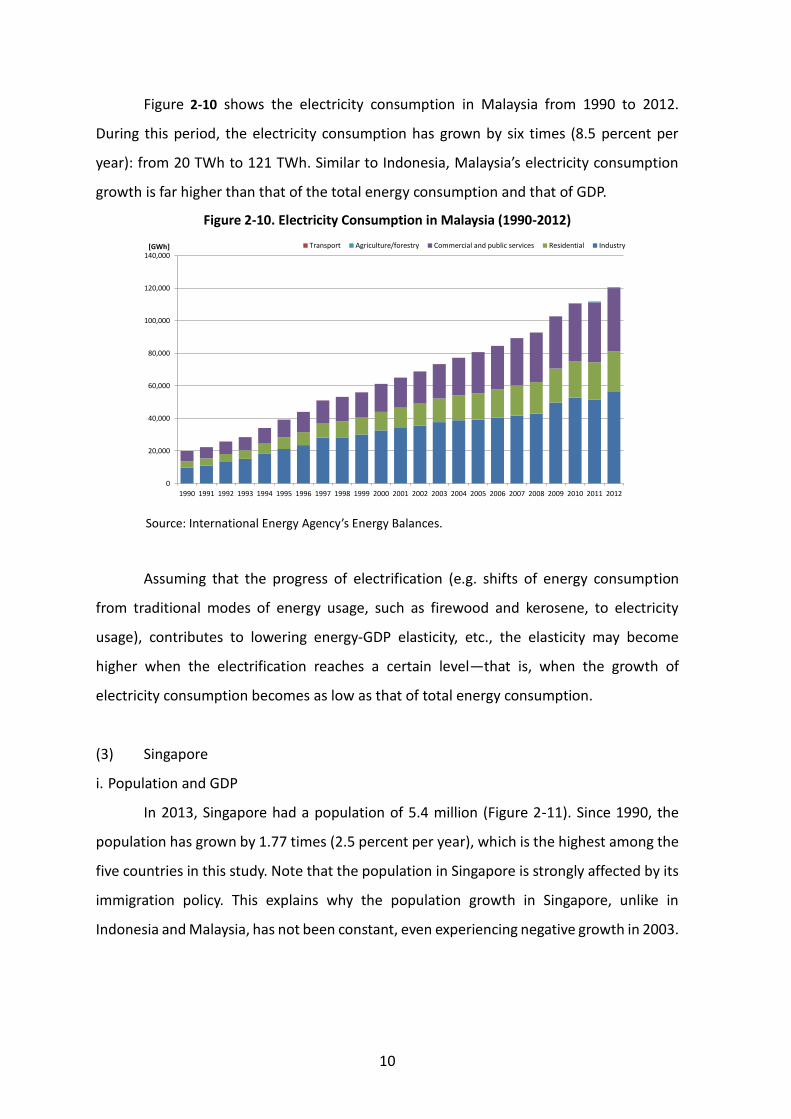
Figure 2-10 shows the electricity consumption in Malaysia from 1990 to 2012.
During this period, the electricity consumption has grown by six times (8.5 percent per
year): from 20 TWh to 121 TWh. Similar to Indonesia, Malaysia’s electricity consumption
growth is far higher than that of the total energy consumption and that of GDP.
Figure 2-10. Electricity Consumption in Malaysia (1990-2012)
Source: International Energy Agency’s Energy Balances.
Assuming that the progress of electrification (e.g. shifts of energy consumption
from traditional modes of energy usage, such as firewood and kerosene, to electricity
usage), contributes to lowering energy-GDP elasticity, etc., the elasticity may become
higher when the electrification reaches a certain level—that is, when the growth of
electricity consumption becomes as low as that of total energy consumption.
(3) Singapore
i. Population and GDP
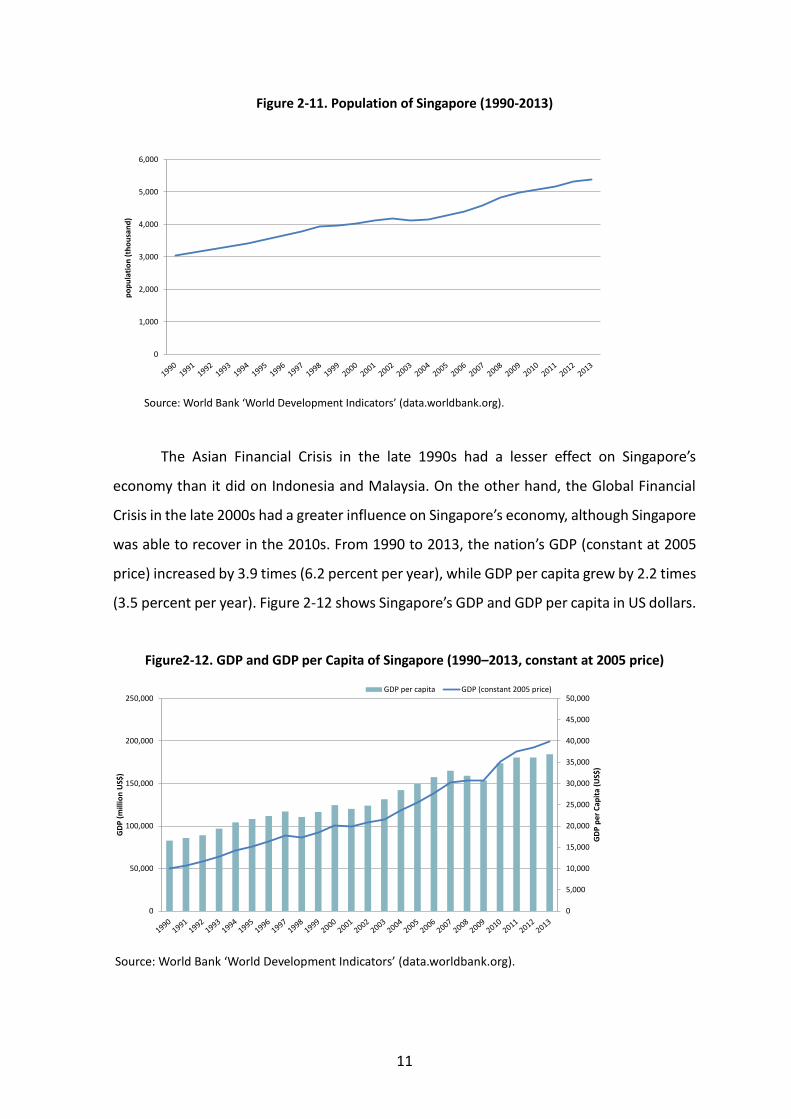
In 2013, Singapore had a population of 5.4 million (Figure 2-11). Since 1990, the
population has grown by 1.77 times (2.5 percent per year), which is the highest among the
five countries in this study. Note that the population in Singapore is strongly affected by its
immigration policy. This explains why the population growth in Singapore, unlike in
Indonesia and Malaysia, has not been constant, even experiencing negative growth in 2003.
0
20,000
40,000
60,000
80,000
100,000
120,000
140,000
1990 1991 1992 1993 1994 1995 1996 1997 1998 1999 2000 2001 2002 2003 2004 2005 2006 2007 2008 2009 2010 2011 2012
Transport Agriculture/forestry Commercial and public services Residential Industry[GWh]
11
Figure 2-11. Population of Singapore (1990-2013)
Source: World Bank ‘World Development Indicators’ (data.worldbank.org).
The Asian Financial Crisis in the late 1990s had a lesser effect on Singapore’s
economy than it did on Indonesia and Malaysia. On the other hand, the Global Financial
Crisis in the late 2000s had a greater influence on Singapore’s economy, although Singapore
was able to recover in the 2010s. From 1990 to 2013, the nation’s GDP (constant at 2005
price) increased by 3.9 times (6.2 percent per year), while GDP per capita grew by 2.2 times
(3.5 percent per year). Figure 2-12 shows Singapore’s GDP and GDP per capita in US dollars.
Figure2-12. GDP and GDP per Capita of Singapore (1990–2013, constant at 2005 price)
Source: World Bank ‘World Development Indicators’ (data.worldbank.org).
0
1,000
2,000
3,000
4,000
5,000
6,000
po
pu
lati
on
(th
ou
san
d)
0
5,000
10,000
15,000
20,000
25,000
30,000
35,000
40,000
45,000
50,000
0
50,000
100,000
150,000
200,000
250,000
GD
P p
er
Cap
ita
(US$
)
GD
P (
mill
ion
US$
)
GDP per capita GDP (constant 2005 price)
12
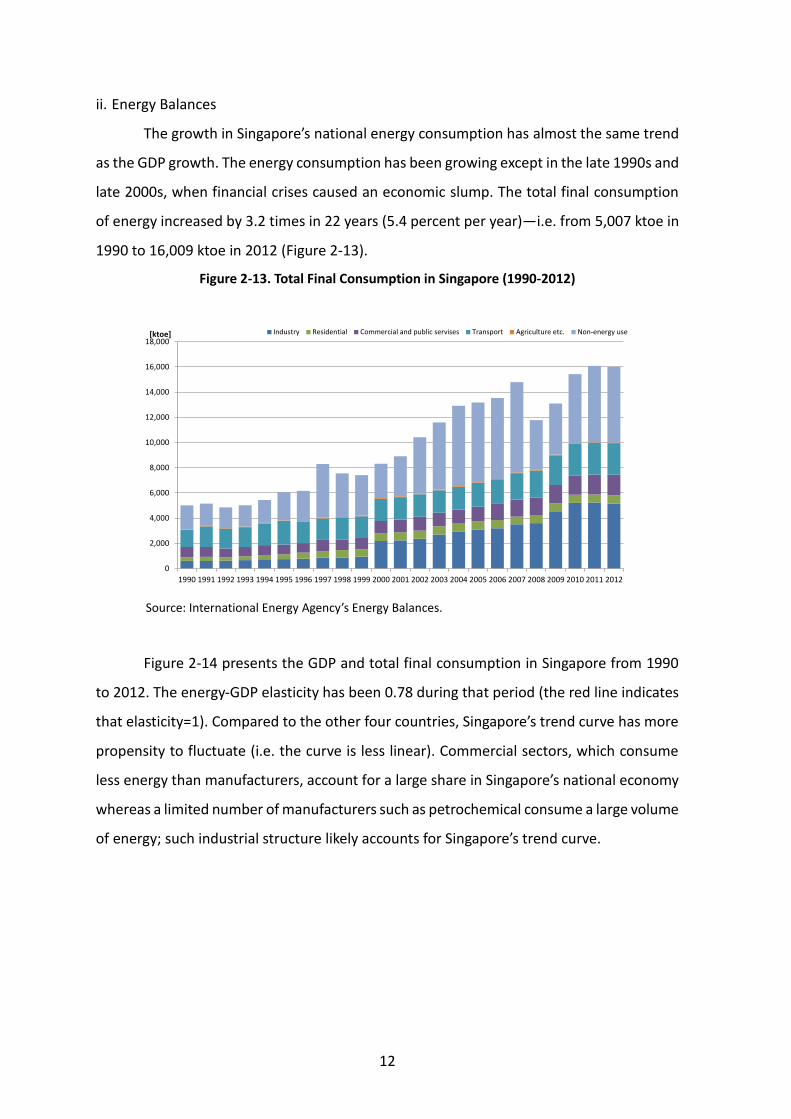
ii. Energy Balances
The growth in Singapore’s national energy consumption has almost the same trend
as the GDP growth. The energy consumption has been growing except in the late 1990s and
late 2000s, when financial crises caused an economic slump. The total final consumption
of energy increased by 3.2 times in 22 years (5.4 percent per year)—i.e. from 5,007 ktoe in
1990 to 16,009 ktoe in 2012 (Figure 2-13).
Figure 2-13. Total Final Consumption in Singapore (1990-2012)
Source: International Energy Agency’s Energy Balances.
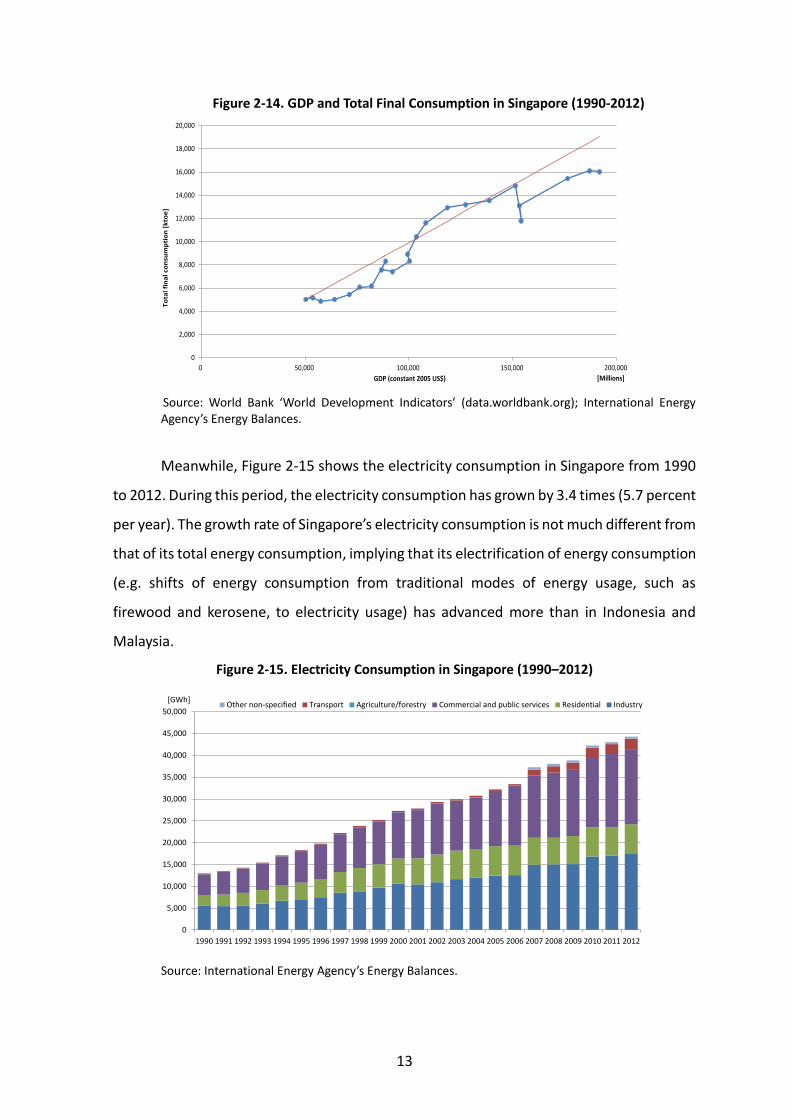
Figure 2-14 presents the GDP and total final consumption in Singapore from 1990
to 2012. The energy-GDP elasticity has been 0.78 during that period (the red line indicates
that elasticity=1). Compared to the other four countries, Singapore’s trend curve has more
propensity to fluctuate (i.e. the curve is less linear). Commercial sectors, which consume
less energy than manufacturers, account for a large share in Singapore’s national economy
whereas a limited number of manufacturers such as petrochemical consume a large volume
of energy; such industrial structure likely accounts for Singapore’s trend curve.
0
2,000
4,000
6,000
8,000
10,000
12,000
14,000
16,000
18,000
1990 1991 1992 1993 1994 1995 1996 1997 1998 1999 2000 2001 2002 2003 2004 2005 2006 2007 2008 2009 2010 2011 2012
Industry Residential Commercial and public servises Transport Agriculture etc. Non-energy use[ktoe]
13
Figure 2-14. GDP and Total Final Consumption in Singapore (1990-2012)
Source: World Bank ‘World Development Indicators’ (data.worldbank.org); International Energy Agency’s Energy Balances.
Meanwhile, Figure 2-15 shows the electricity consumption in Singapore from 1990
to 2012. During this period, the electricity consumption has grown by 3.4 times (5.7 percent
per year). The growth rate of Singapore’s electricity consumption is not much different from
that of its total energy consumption, implying that its electrification of energy consumption
(e.g. shifts of energy consumption from traditional modes of energy usage, such as
firewood and kerosene, to electricity usage) has advanced more than in Indonesia and
Malaysia.
Figure 2-15. Electricity Consumption in Singapore (1990–2012)
Source: International Energy Agency’s Energy Balances.
0
2,000
4,000
6,000
8,000
10,000
12,000
14,000
16,000
18,000
20,000
0 50,000 100,000 150,000 200,000
To
tal
fin
al
con
sum
pti
on
[k
toe
]
GDP (constant 2005 US$) [Millions]
0
5,000
10,000
15,000
20,000
25,000
30,000
35,000
40,000
45,000
50,000
1990 1991 1992 1993 1994 1995 1996 1997 1998 1999 2000 2001 2002 2003 2004 2005 2006 2007 2008 2009 2010 2011 2012
Other non-specified Transport Agriculture/forestry Commercial and public services Residential Industry[GWh]
14
(4) Thailand
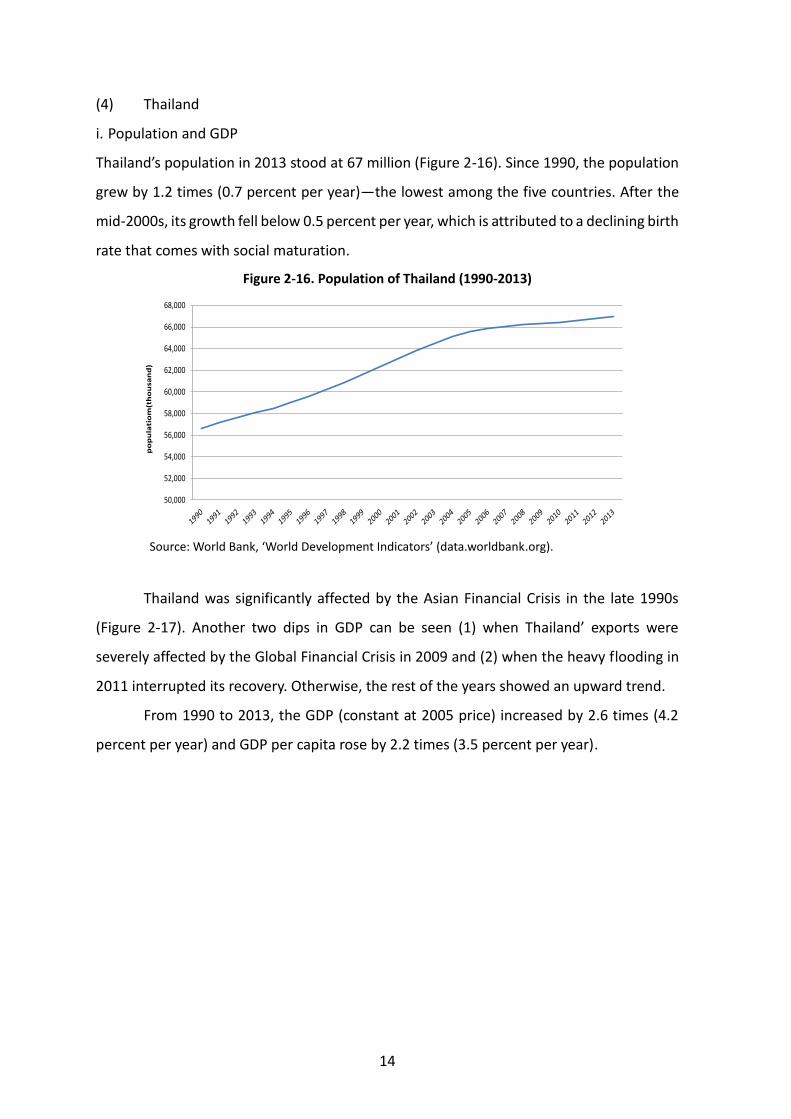
i. Population and GDP
Thailand’s population in 2013 stood at 67 million (Figure 2-16). Since 1990, the population
grew by 1.2 times (0.7 percent per year)—the lowest among the five countries. After the
mid-2000s, its growth fell below 0.5 percent per year, which is attributed to a declining birth
rate that comes with social maturation.
Figure 2-16. Population of Thailand (1990-2013)
Source: World Bank, ‘World Development Indicators’ (data.worldbank.org).
Thailand was significantly affected by the Asian Financial Crisis in the late 1990s
(Figure 2-17). Another two dips in GDP can be seen (1) when Thailand’ exports were
severely affected by the Global Financial Crisis in 2009 and (2) when the heavy flooding in
2011 interrupted its recovery. Otherwise, the rest of the years showed an upward trend.
From 1990 to 2013, the GDP (constant at 2005 price) increased by 2.6 times (4.2
percent per year) and GDP per capita rose by 2.2 times (3.5 percent per year).
50,000
52,000
54,000
56,000
58,000
60,000
62,000
64,000
66,000
68,000
po
pu
lati
om
(th
ou
san
d)
15
Figure 2-17. GDP and GDP per Capita of Thailand (1990-2013, constant at 2005 price)
Source: World Bank, ‘World Development Indicators’ (data.worldbank.org).
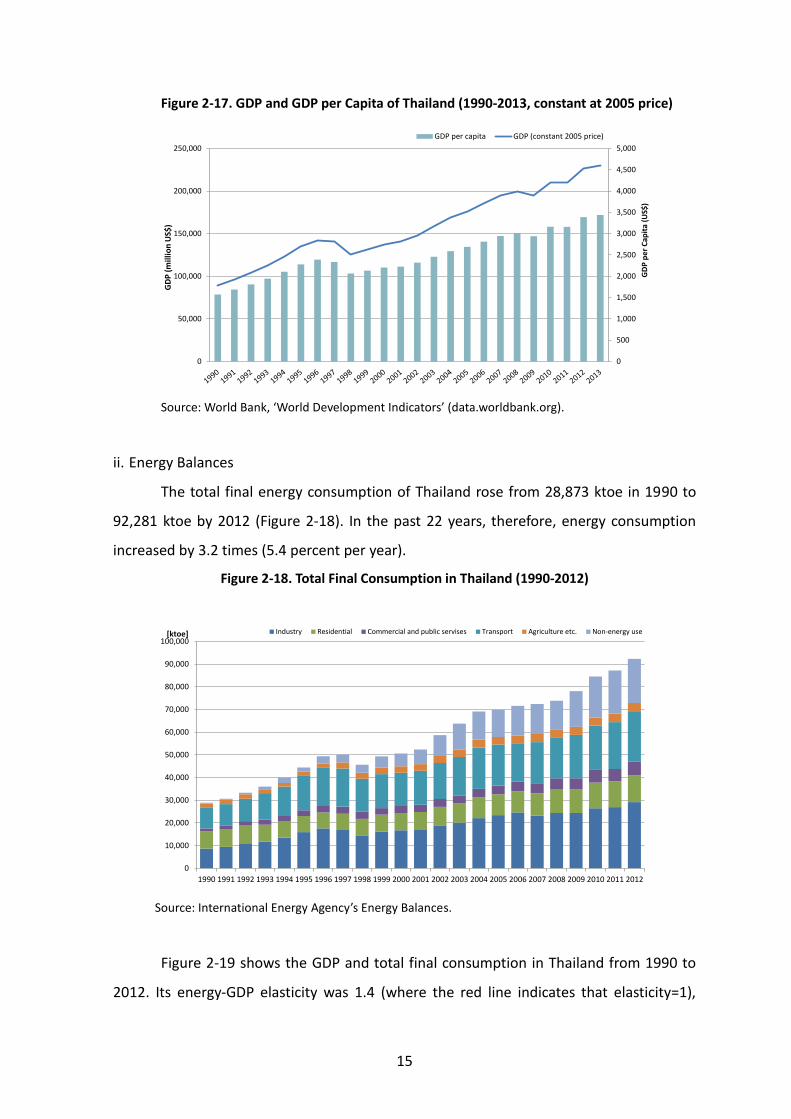
ii. Energy Balances
The total final energy consumption of Thailand rose from 28,873 ktoe in 1990 to
92,281 ktoe by 2012 (Figure 2-18). In the past 22 years, therefore, energy consumption
increased by 3.2 times (5.4 percent per year).
Figure 2-18. Total Final Consumption in Thailand (1990-2012)
Source: International Energy Agency’s Energy Balances.
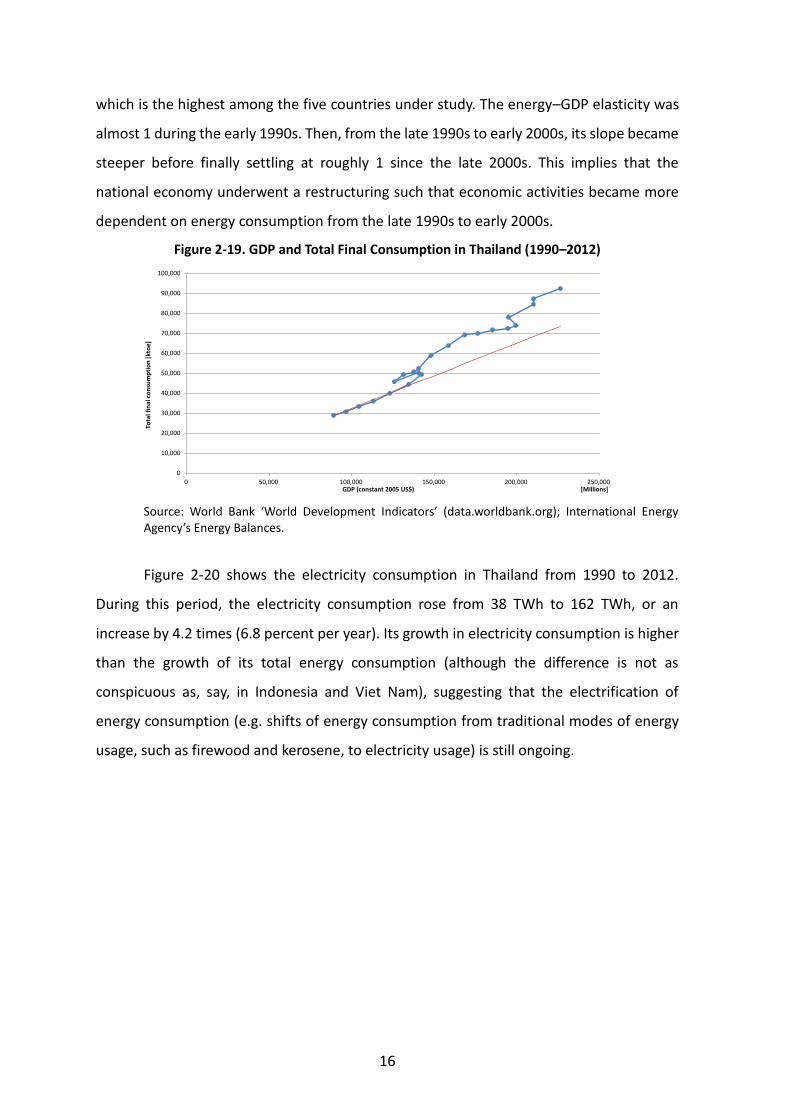
Figure 2-19 shows the GDP and total final consumption in Thailand from 1990 to
2012. Its energy-GDP elasticity was 1.4 (where the red line indicates that elasticity=1),
0
500
1,000
1,500
2,000
2,500
3,000
3,500
4,000
4,500
5,000
0
50,000
100,000
150,000
200,000
250,000
GD
P p
er
Cap
ita
(US$
)
GD
P (
mill
ion
US$
)
GDP per capita GDP (constant 2005 price)
0
10,000
20,000
30,000
40,000
50,000
60,000
70,000
80,000
90,000
100,000
1990 1991 1992 1993 1994 1995 1996 1997 1998 1999 2000 2001 2002 2003 2004 2005 2006 2007 2008 2009 2010 2011 2012
Industry Residential Commercial and public servises Transport Agriculture etc. Non-energy use[ktoe]
16
which is the highest among the five countries under study. The energy–GDP elasticity was
almost 1 during the early 1990s. Then, from the late 1990s to early 2000s, its slope became
steeper before finally settling at roughly 1 since the late 2000s. This implies that the
national economy underwent a restructuring such that economic activities became more
dependent on energy consumption from the late 1990s to early 2000s.
Figure 2-19. GDP and Total Final Consumption in Thailand (1990–2012)
Source: World Bank ‘World Development Indicators’ (data.worldbank.org); International Energy Agency’s Energy Balances.
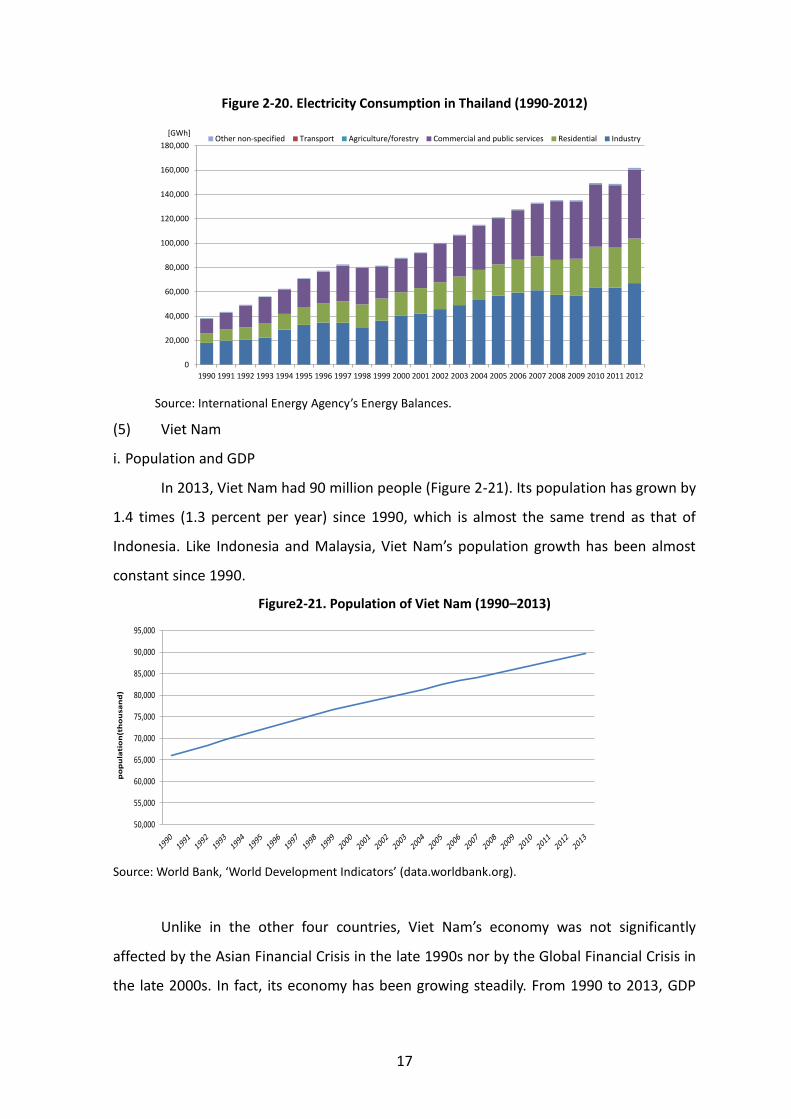
Figure 2-20 shows the electricity consumption in Thailand from 1990 to 2012.
During this period, the electricity consumption rose from 38 TWh to 162 TWh, or an
increase by 4.2 times (6.8 percent per year). Its growth in electricity consumption is higher
than the growth of its total energy consumption (although the difference is not as
conspicuous as, say, in Indonesia and Viet Nam), suggesting that the electrification of
energy consumption (e.g. shifts of energy consumption from traditional modes of energy
usage, such as firewood and kerosene, to electricity usage) is still ongoing.
0
10,000
20,000
30,000
40,000
50,000
60,000
70,000
80,000
90,000
100,000
0 50,000 100,000 150,000 200,000 250,000
Tota
l fin
al c
on
sum
pti
on
[kt
oe
]
GDP (constant 2005 US$) [Millions]
17
Figure 2-20. Electricity Consumption in Thailand (1990-2012)
Source: International Energy Agency’s Energy Balances.
(5) Viet Nam
i. Population and GDP
In 2013, Viet Nam had 90 million people (Figure 2-21). Its population has grown by
1.4 times (1.3 percent per year) since 1990, which is almost the same trend as that of
Indonesia. Like Indonesia and Malaysia, Viet Nam’s population growth has been almost
constant since 1990.
Figure2-21. Population of Viet Nam (1990–2013)
Source: World Bank, ‘World Development Indicators’ (data.worldbank.org).
Unlike in the other four countries, Viet Nam’s economy was not significantly
affected by the Asian Financial Crisis in the late 1990s nor by the Global Financial Crisis in
the late 2000s. In fact, its economy has been growing steadily. From 1990 to 2013, GDP
0
20,000
40,000
60,000
80,000
100,000
120,000
140,000
160,000
180,000
1990 1991 1992 1993 1994 1995 1996 1997 1998 1999 2000 2001 2002 2003 2004 2005 2006 2007 2008 2009 2010 2011 2012
Other non-specified Transport Agriculture/forestry Commercial and public services Residential Industry[GWh]
50,000
55,000
60,000
65,000
70,000
75,000
80,000
85,000
90,000
95,000
po
pu
lati
on
(th
ou
sa
nd
)
18
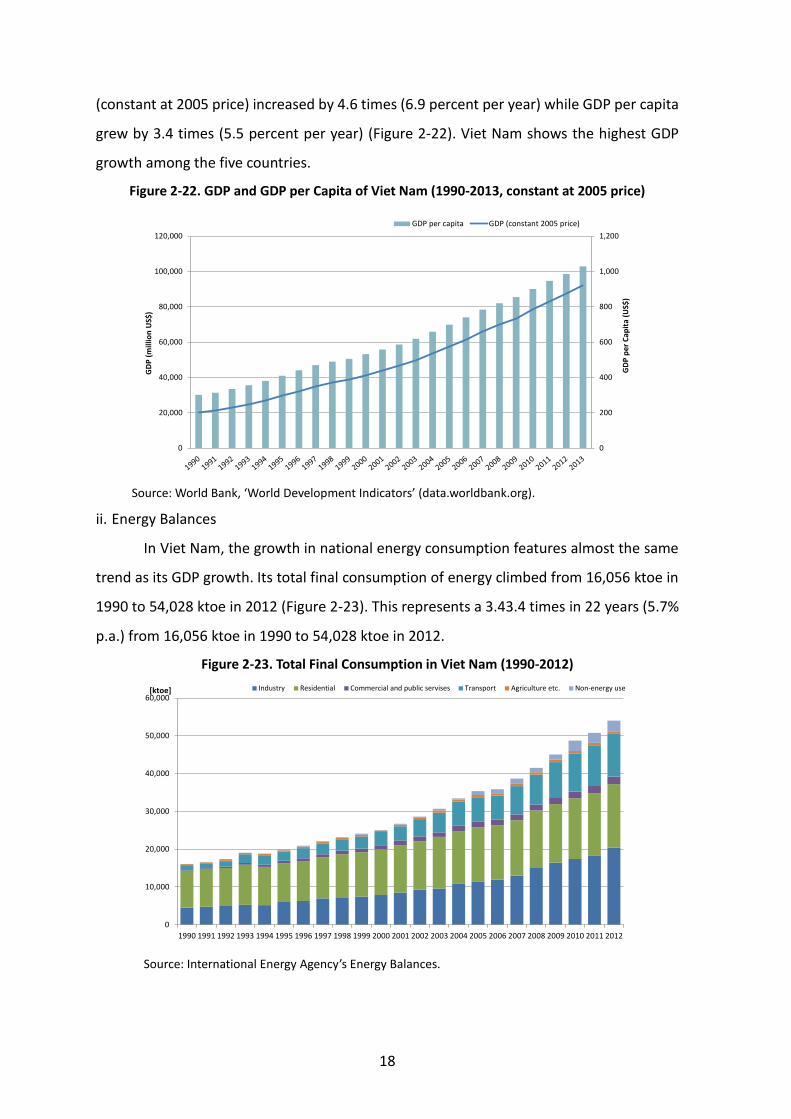
(constant at 2005 price) increased by 4.6 times (6.9 percent per year) while GDP per capita
grew by 3.4 times (5.5 percent per year) (Figure 2-22). Viet Nam shows the highest GDP
growth among the five countries.
Figure 2-22. GDP and GDP per Capita of Viet Nam (1990-2013, constant at 2005 price)
Source: World Bank, ‘World Development Indicators’ (data.worldbank.org).
ii. Energy Balances
In Viet Nam, the growth in national energy consumption features almost the same
trend as its GDP growth. Its total final consumption of energy climbed from 16,056 ktoe in
1990 to 54,028 ktoe in 2012 (Figure 2-23). This represents a 3.43.4 times in 22 years (5.7%
p.a.) from 16,056 ktoe in 1990 to 54,028 ktoe in 2012.
Figure 2-23. Total Final Consumption in Viet Nam (1990-2012)
Source: International Energy Agency’s Energy Balances.
0
200
400
600
800
1,000
1,200
0
20,000
40,000
60,000
80,000
100,000
120,000
GD
P p
er
Cap
ita
(US$
)
GD
P (
mill
ion
US$
)
GDP per capita GDP (constant 2005 price)
0
10,000
20,000
30,000
40,000
50,000
60,000
1990 1991 1992 1993 1994 1995 1996 1997 1998 1999 2000 2001 2002 2003 2004 2005 2006 2007 2008 2009 2010 2011 2012
Industry Residential Commercial and public servises Transport Agriculture etc. Non-energy use[ktoe]
19
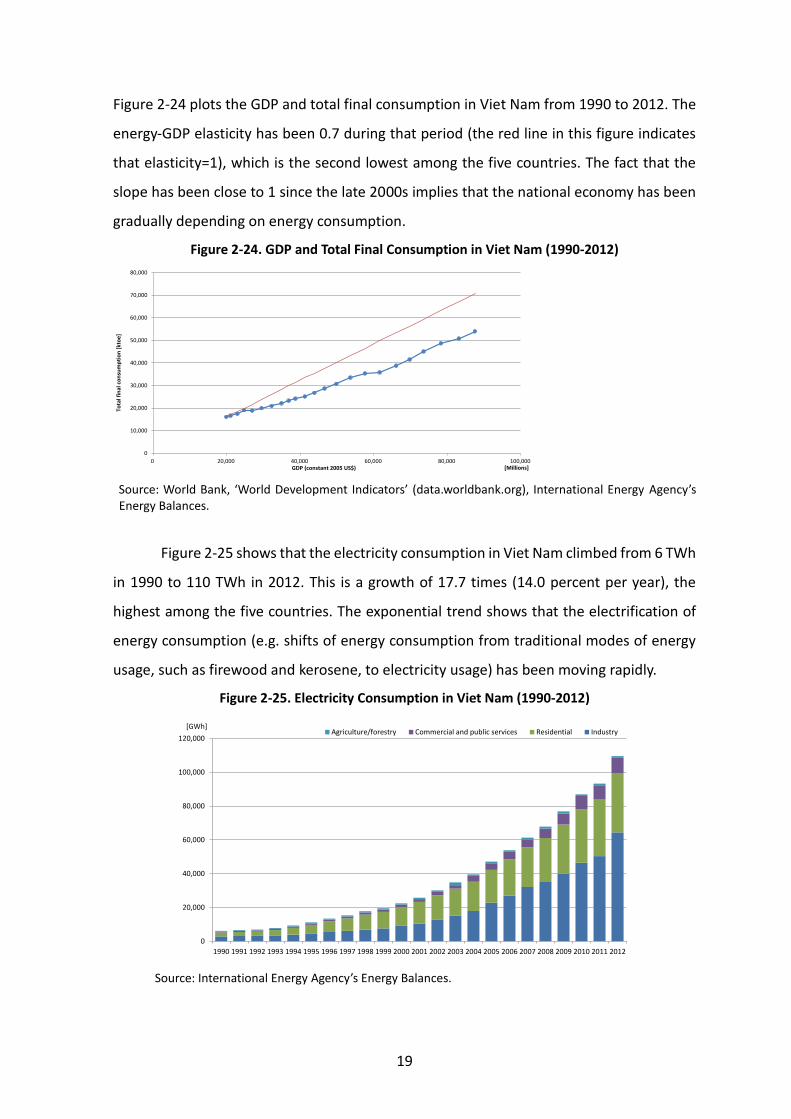
Figure 2-24 plots the GDP and total final consumption in Viet Nam from 1990 to 2012. The
energy-GDP elasticity has been 0.7 during that period (the red line in this figure indicates
that elasticity=1), which is the second lowest among the five countries. The fact that the
slope has been close to 1 since the late 2000s implies that the national economy has been
gradually depending on energy consumption.
Figure 2-24. GDP and Total Final Consumption in Viet Nam (1990-2012)
Source: World Bank, ‘World Development Indicators’ (data.worldbank.org), International Energy Agency’s Energy Balances.
Figure 2-25 shows that the electricity consumption in Viet Nam climbed from 6 TWh
in 1990 to 110 TWh in 2012. This is a growth of 17.7 times (14.0 percent per year), the
highest among the five countries. The exponential trend shows that the electrification of
energy consumption (e.g. shifts of energy consumption from traditional modes of energy
usage, such as firewood and kerosene, to electricity usage) has been moving rapidly.
Figure 2-25. Electricity Consumption in Viet Nam (1990-2012)
Source: International Energy Agency’s Energy Balances.
0
10,000
20,000
30,000
40,000
50,000
60,000
70,000
80,000
0 20,000 40,000 60,000 80,000 100,000
Tota
l fin
al c
on
sum
pti
on
[kt
oe
]
GDP (constant 2005 US$) [Millions]
0
20,000
40,000
60,000
80,000
100,000
120,000
1990 1991 1992 1993 1994 1995 1996 1997 1998 1999 2000 2001 2002 2003 2004 2005 2006 2007 2008 2009 2010 2011 2012
Agriculture/forestry Commercial and public services Residential Industry[GWh]
20
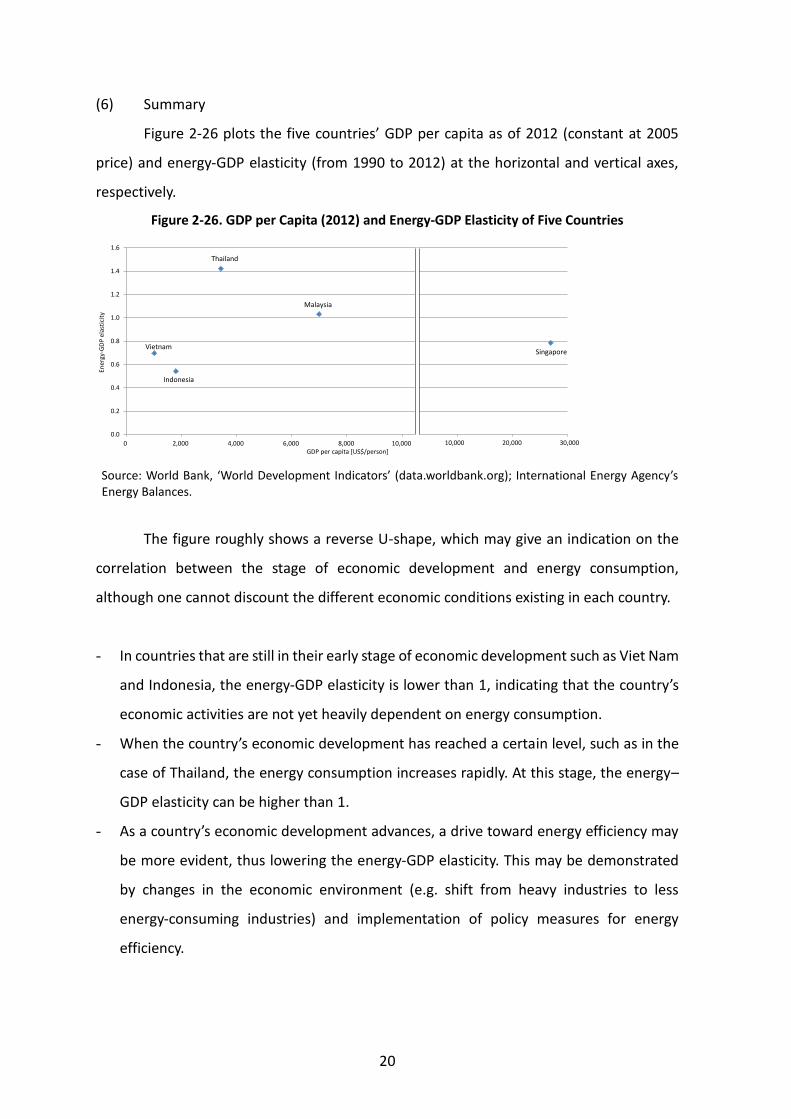
(6) Summary
Figure 2-26 plots the five countries’ GDP per capita as of 2012 (constant at 2005
price) and energy-GDP elasticity (from 1990 to 2012) at the horizontal and vertical axes,
respectively.
Figure 2-26. GDP per Capita (2012) and Energy-GDP Elasticity of Five Countries
Source: World Bank, ‘World Development Indicators’ (data.worldbank.org); International Energy Agency’s Energy Balances.
The figure roughly shows a reverse U-shape, which may give an indication on the
correlation between the stage of economic development and energy consumption,
although one cannot discount the different economic conditions existing in each country.
- In countries that are still in their early stage of economic development such as Viet Nam
and Indonesia, the energy-GDP elasticity is lower than 1, indicating that the country’s
economic activities are not yet heavily dependent on energy consumption.
- When the country’s economic development has reached a certain level, such as in the
case of Thailand, the energy consumption increases rapidly. At this stage, the energy–
GDP elasticity can be higher than 1.
- As a country’s economic development advances, a drive toward energy efficiency may
be more evident, thus lowering the energy-GDP elasticity. This may be demonstrated
by changes in the economic environment (e.g. shift from heavy industries to less
energy-consuming industries) and implementation of policy measures for energy
efficiency.
0.0
0.2
0.4
0.6
0.8
1.0
1.2
1.4
1.6
0 2,000 4,000 6,000 8,000 10,000 12,000 14,000 16,000
Ener
gy-G
DP
ela
stic
ity
GDP per capita [US$/person]
VietnamSingapore
Malaysia
Thailand
Indonesia
10,000 20,000 30,000
21
Following such assumptions, this study recommends that countries such as Viet
Nam and Indonesia should prioritise relatively basic energy efficiency measures over highly
advanced but costly measures.
On the other hand, nations such as Malaysia and Singapore, where certain
measures for energy efficiency are already in place, would be ready to implement highly
advanced technologies for energy efficiency with certain initial costs where economically
feasible.
Thailand, which falls between the above-mentioned development stages, may have
to look for areas where it makes sense to implement basic measures for energy efficiency
considering that it still has a high energy-GDP elasticity. Having said that, it should also start
discussions on the applicability of more advanced measures.
1.2. Institutional framework related to energy efficiency
This section provides an overview of five countries’ institutional framework on
energy efficiency, based largely on materials provided by this study’s Working Group
members.
(1) Indonesia
i. Organisations on energy efficiency and conservation policy
The Ministry of Energy and Mineral Resources (MEMR) is Indonesia’s administrative
body for general policies on the promotion of energy conservation in collaboration with
the government-owned electric utility, PT PLN.
a. Ministry of Energy and Mineral Resources
The MEMR oversees the resource and energy sectors. The Directorate General of
new Renewable Energy and Energy Conservation, which was established as a unit under
MEMR in 2010, is in charge of developing energy conservation-related policies and
technology standards.
b. PT PLN (Persero)
PT PLN is a stock company that is 100 percent-owned by the Government of
Indonesia. Indonesia’s power generation sector has PLN, its subsidiary, and Independent
Power Producers as key players, while the transmission and distribution sectors are
exclusively under the purview of PLN. The company plans to complete its PLN Smart Grids
22
Road Map in 2015.
c. Others
Several government agencies are involved in the promotion of Indonesia’s energy
conservation. Among these agencies are the National Energy Council (Dewan Energi
Nasional)—responsible for the development of general policies on energy development
and utilisation—and the Ministry of Industry (MOI), which looks after the industry sector.
ii. Laws and regulations related to energy conservation
a. Government Regulation No. 70/2009 on Energy Conservation
On 16 November 2009, the government issued Governmental Regulation No.
70/2009 on Energy Conservation. This regulation mandates large energy users to
implement energy management by engaging in the following activities:
1. to nominate an energy manager,
2. to formulate energy conservation programmes,
3. to implement energy audits periodically,
4. to implement energy audit recommendations, and
5. to report on its energy conservation measures to the government.
Large energy users are users of 6,000 toe, which is equivalent to 251,400 GJ or
69,780 MWh, per year or more. Indonesia has a limited number of these large energy users,
but their total energy consumption accounts for about 60 percent of the total energy use
in the industrial sector.
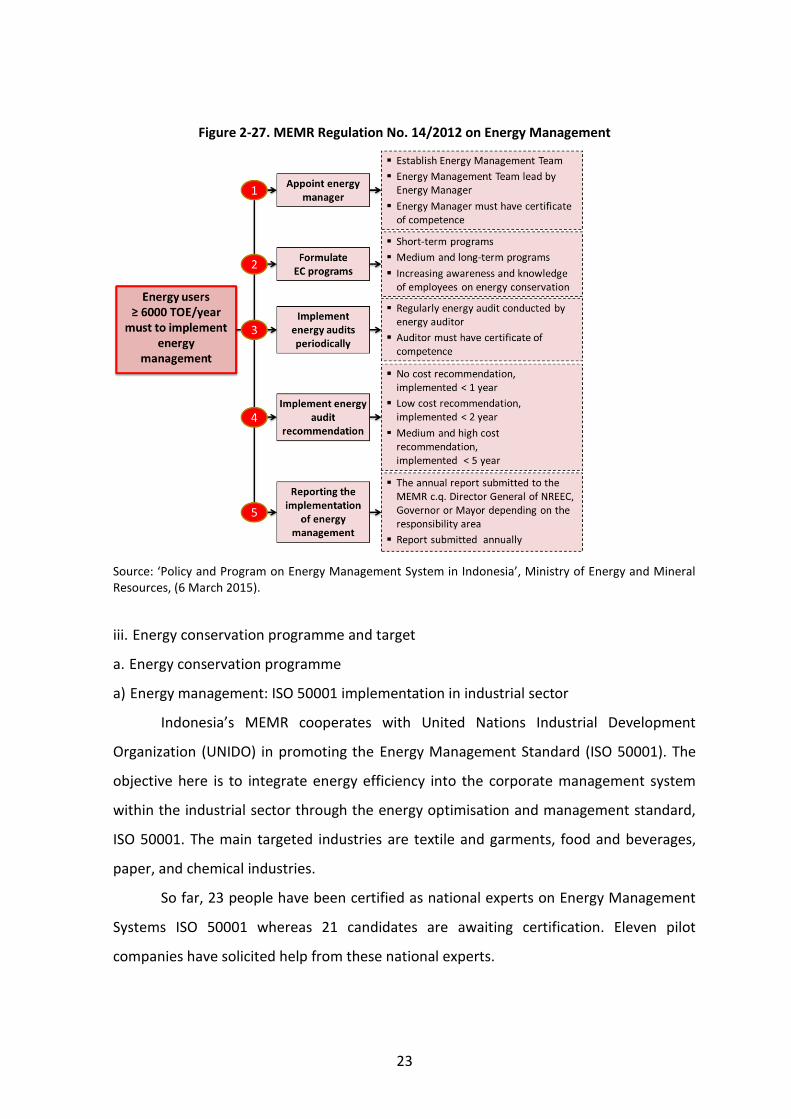
b. MEMR Regulation No.14/2012 on Energy Management
The MEMR Regulation No. 14/2012 provides more details on the energy
management implementation than the earlier governmental regulation. Figure 2-27
summarises these provisions.
23
Figure 2-27. MEMR Regulation No. 14/2012 on Energy Management
Source: ‘Policy and Program on Energy Management System in Indonesia’, Ministry of Energy and Mineral Resources, (6 March 2015).
iii. Energy conservation programme and target
a. Energy conservation programme
a) Energy management: ISO 50001 implementation in industrial sector
Indonesia’s MEMR cooperates with United Nations Industrial Development
Organization (UNIDO) in promoting the Energy Management Standard (ISO 50001). The
objective here is to integrate energy efficiency into the corporate management system
within the industrial sector through the energy optimisation and management standard,
ISO 50001. The main targeted industries are textile and garments, food and beverages,
paper, and chemical industries.
So far, 23 people have been certified as national experts on Energy Management
Systems ISO 50001 whereas 21 candidates are awaiting certification. Eleven pilot
companies have solicited help from these national experts.
24
b) Partnership Programme of Energy Conservation
The Partnership Programme on Energy Conservation is a government-funded
energy audit service conducted by MEMR on industries and commercial buildings. From
2003 to 2014, MEMR had audited 805 industries and 469 buildings.
According to MEMR, the total potential savings as of 2012 was 1,532 GWh, whereas
the total energy savings achieved was only 46 GWh because only energy saving measures
with no cost or low cost have been preferred by the industries audited. The programme
thus hopes to develop more medium- and high-cost alternatives to achieving greater
energy savings with the support of the government. At present, some of the measures
recommended in this programme have not been implemented due to limited financial
resources.
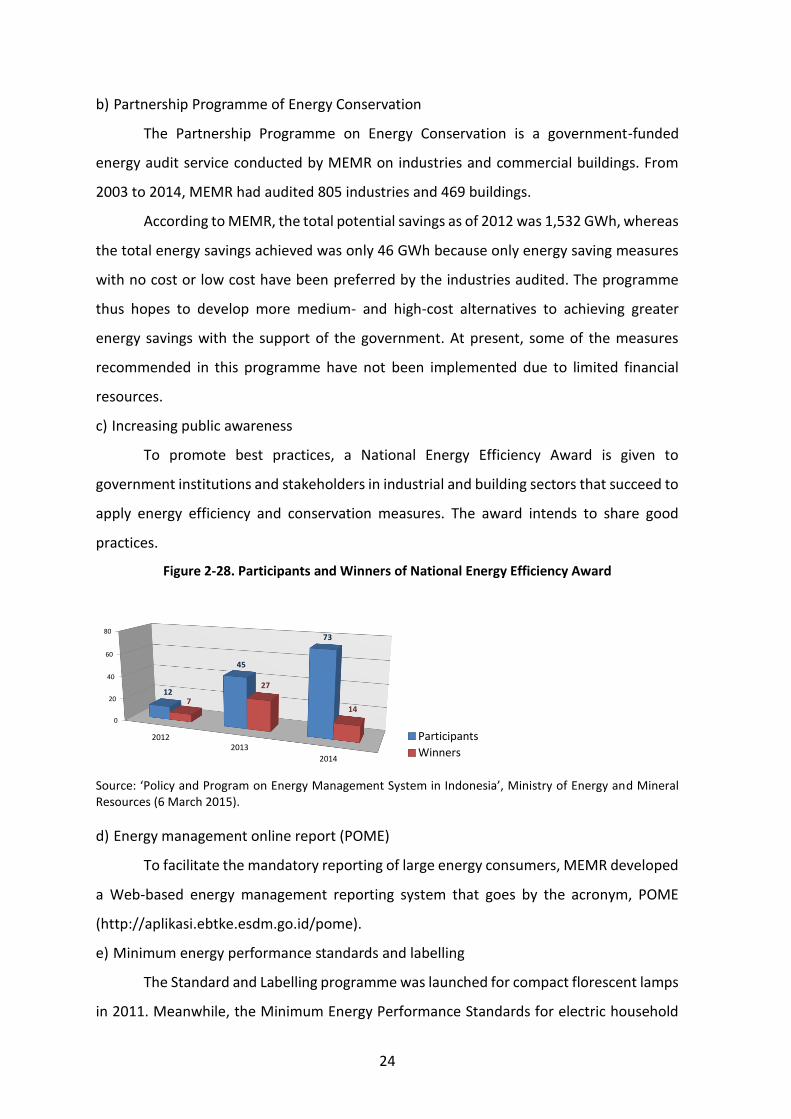
c) Increasing public awareness
To promote best practices, a National Energy Efficiency Award is given to
government institutions and stakeholders in industrial and building sectors that succeed to
apply energy efficiency and conservation measures. The award intends to share good
practices.
Figure 2-28. Participants and Winners of National Energy Efficiency Award
Source: ‘Policy and Program on Energy Management System in Indonesia’, Ministry of Energy and Mineral Resources (6 March 2015).
d) Energy management online report (POME)
To facilitate the mandatory reporting of large energy consumers, MEMR developed
a Web-based energy management reporting system that goes by the acronym, POME
(http://aplikasi.ebtke.esdm.go.id/pome).
e) Minimum energy performance standards and labelling
The Standard and Labelling programme was launched for compact florescent lamps
in 2011. Meanwhile, the Minimum Energy Performance Standards for electric household
0
20
40
60
80
20122013
2014
12
45
73
7
27
14
PARTICIPANTS AND WINNERS
0
20
40
60
80
20122013
2014
12
45
73
7
27
14
PARTICIPANTS AND WINNERS
Participants
Winners
25
appliances such as air conditioning systems, refrigerators, electric motors, rice cookers,
electric irons, etc. were also introduced.
f) Development of smart street lighting
The MEMR develops standards for street lighting systems and guidelines for
implementing energy-efficient technology in street lighting. The smart street lighting was
implemented in Makasar, Solo, Semarang, Batang, Tulung Agung, and Magetan.
g) Human resource development
Through government-led programmes, 131 energy managers and 76 energy
auditors were certified.
b. Target of energy conservation
The objectives of Indonesia’s National Energy Conservation Master Plan in 2025
are:
To reduce energy intensity by 1 percent per year in all sectors
To attain an energy elasticity of less than 1 in year 2025
To reduce the final energy consumption by 17 percent
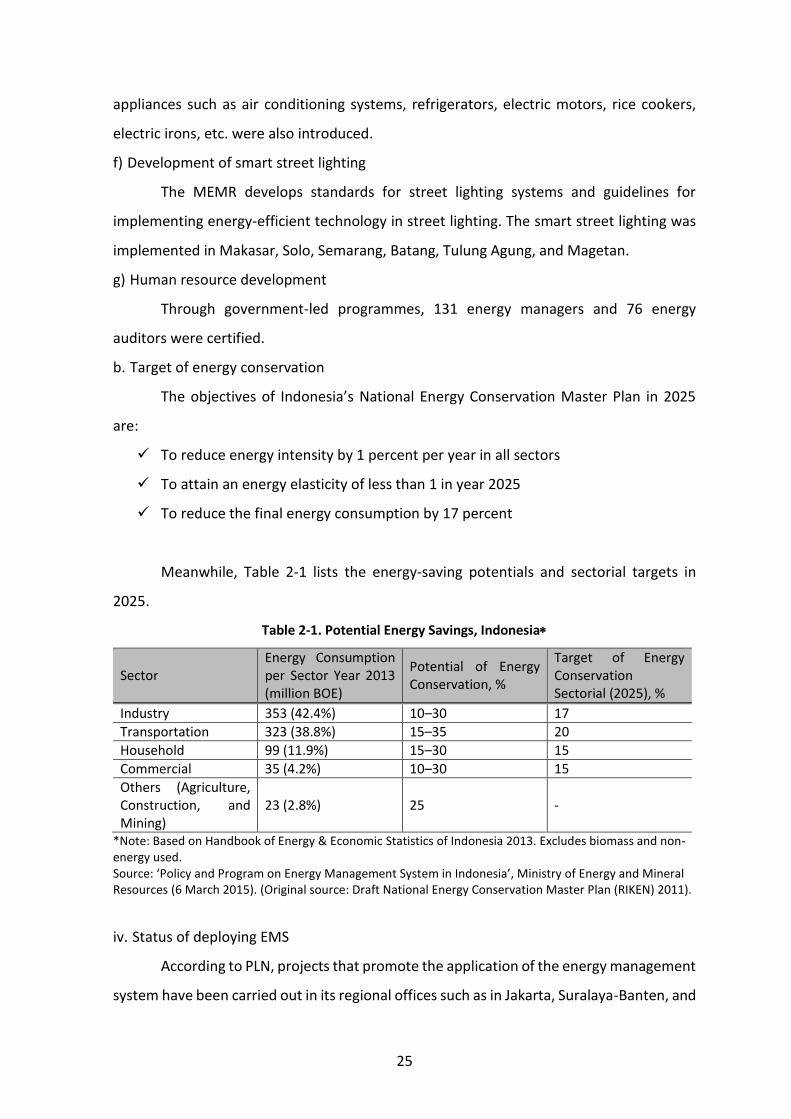
Meanwhile, Table 2-1 lists the energy-saving potentials and sectorial targets in
2025.
Table 2-1. Potential Energy Savings, Indonesia
Sector Energy Consumption per Sector Year 2013 (million BOE)
Potential of Energy Conservation, %
Target of Energy Conservation Sectorial (2025), %
Industry 353 (42.4%) 10–30 17
Transportation 323 (38.8%) 15–35 20
Household 99 (11.9%) 15–30 15
Commercial 35 (4.2%) 10–30 15
Others (Agriculture, Construction, and Mining)
23 (2.8%) 25 -
*Note: Based on Handbook of Energy & Economic Statistics of Indonesia 2013. Excludes biomass and non-energy used. Source: ‘Policy and Program on Energy Management System in Indonesia’, Ministry of Energy and Mineral Resources (6 March 2015). (Original source: Draft National Energy Conservation Master Plan (RIKEN) 2011).
iv. Status of deploying EMS
According to PLN, projects that promote the application of the energy management
system have been carried out in its regional offices such as in Jakarta, Suralaya-Banten, and
26
Malang-East Java. In addition, PLN cooperates with the New Energy and Industrial
Technology Development Organization (NEDO) a unit of the Ministry of Economy, Trade
and Industry of Japan, to implement energy efficiency programmes, including the
deployment of the BEMS and Factory Energy Management System.
(2) Malaysia
i.Organisations on energy efficiency and conservation policy
In Malaysia, the main government agency responsible for energy efficiency policies
is the Ministry of Energy, Green Technology and Water (MEGTW). The Energy Commission
and the energy sub-unit of the Economic Planning Unit under the Prime Minister’s Office
also support the country’s energy efficiency programmes.
a. Ministry of Energy, Green Technology and Water
The MEGTW, also known as KeTTHA (Kementerian Tenaga, Teknologi Hijau dan Air)
in Malay, was established in 2009 as a result of the reshuffle and restructuring of ministries.
It succeeded the former Ministry of Energy, Water and Communications (MEWC). The
ministry acknowledges that there are now new functions and responsibilities for planning
as well as policies and programme formulation to address evolving global issues such as
environmental pollution, ozone depletion, and global warming. The MEGTW is responsible
for defining efficiency standards, and setting and implementing efficiency requirements.
b. Energy Commission
According to Malaysia’s Energy Commission Act 2001, the Energy Commission was
established to replace the Department of Electricity and Gas Supply. It is the entity that
issues the certificate of approval on standards and labelling schemes.
ii.Laws and regulations related to energy conservation
The legal framework for Malaysia’s energy efficiency is summarised as follows:
a. Electricity Supply (Amendment) 2001 - Act A1116
This act empowers the Minister to promote the efficient use of electricity, such as
by determining efficiency standards and installing equipment to meet efficiency
requirements.
b. Efficient Management of Electrical Energy Regulations 2008
Under this regulation, users consuming 3 million kWh or more over a six-month
27
period must commission a registered energy manager to analyse their total consumption
of electrical energy, advise them on how to efficiently manage their electrical energy and
monitor the effectiveness of the implemented measures.
c. Amendment of Electrical Supply Regulations 1994 (Gazetted in May 2013)
On 3 May 2013, the MEGTW gazetted the amendment of the 1994 Electricity
Regulations. Such amendment enabled the enforcement of the MEPS on electrical
appliances and lighting equipment (incandescent, compact florescent lamps, and light
emitting diodes or LEDs).
MS1525: Code of Practice for Energy Efficiency and Use of Renewable Energy for Non-
Residential Buildings
Under this code, the energy efficiency requirements were incorporated in the
Uniform Building By-laws (UBBL). According to the UBBL’s, all non-residential buildings
must comply with the UBBL’s energy efficiency requirements, which allows for integration
of renewable energy systems and energy saving features in buildings. This was introduced
in 2001 and updated in 2008.
iii. Energy conservation programme and target
a.Energy conservation programme
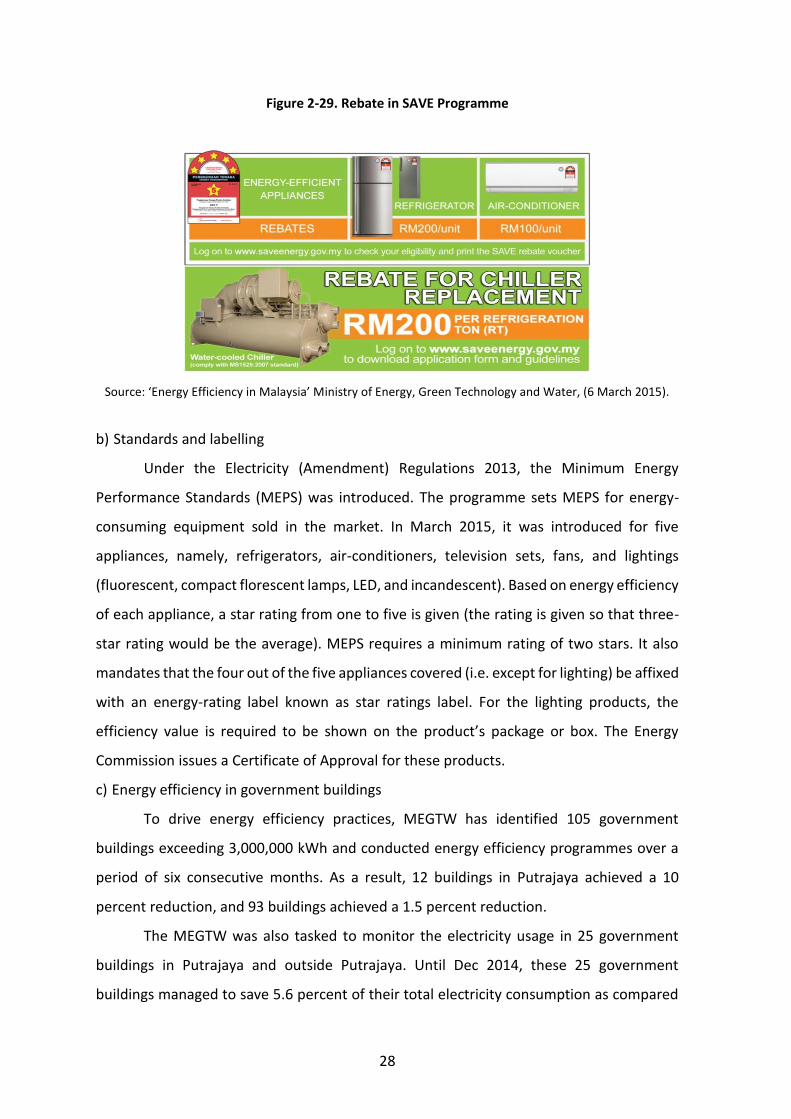
a) SAVE Programme
The SAVE programme was launched on July 2011, with two main objectives:
to increase the total number of energy-efficient electrical equipment, five-star and
energy efficient appliances on the market; and
to increase public awareness on the need to choose energy-efficient equipment to
reduce the use of electricity.
Through this programme, purchase of refrigerators, air conditioning systems, and
energy efficient chillers is entitled to a cash rebate of MYR100–200 per refrigeration tonne.
The programme has successfully reduced domestic electricity consumption by 158.1 GWh
per year—or equal to the electricity bill savings of MYR34.4 million. Overall, the reduction
in the emission of carbon dioxide (CO2) through this programme is approximately
167,568,689 tonnes.
28
Figure 2-29. Rebate in SAVE Programme
Source: ‘Energy Efficiency in Malaysia’ Ministry of Energy, Green Technology and Water, (6 March 2015).
b) Standards and labelling
Under the Electricity (Amendment) Regulations 2013, the Minimum Energy
Performance Standards (MEPS) was introduced. The programme sets MEPS for energy-
consuming equipment sold in the market. In March 2015, it was introduced for five
appliances, namely, refrigerators, air-conditioners, television sets, fans, and lightings
(fluorescent, compact florescent lamps, LED, and incandescent). Based on energy efficiency
of each appliance, a star rating from one to five is given (the rating is given so that three-
star rating would be the average). MEPS requires a minimum rating of two stars. It also
mandates that the four out of the five appliances covered (i.e. except for lighting) be affixed
with an energy-rating label known as star ratings label. For the lighting products, the
efficiency value is required to be shown on the product’s package or box. The Energy
Commission issues a Certificate of Approval for these products.
c) Energy efficiency in government buildings
To drive energy efficiency practices, MEGTW has identified 105 government
buildings exceeding 3,000,000 kWh and conducted energy efficiency programmes over a
period of six consecutive months. As a result, 12 buildings in Putrajaya achieved a 10
percent reduction, and 93 buildings achieved a 1.5 percent reduction.
The MEGTW was also tasked to monitor the electricity usage in 25 government
buildings in Putrajaya and outside Putrajaya. Until Dec 2014, these 25 government
buildings managed to save 5.6 percent of their total electricity consumption as compared
29
to their usage in 2013.
In 2014, energy audit was done for three government buildings, and retrofitting
was done in two audited government buildings.
The Energy Performance Contracting initiative was started in January 2013 to
promote energy efficiency in government buildings. It is an initiative to overcome capital
cost barriers in implementing energy efficiency measures. The cost of investments in
energy efficiency improvements would be covered by the Energy Service Company (ESCO),
while the owner of government buildings would be required to reimburse ESCOs for the
cost of investments from the savings made.
d) Incentives for energy efficiency
Owners of buildings with Green Building Index (GBI) Certificate are eligible for a tax
exemption equivalent to 100 percent of the additional capital spent to be GBI certified.
Also, those who purchase the GBI-certified buildings and residential properties from
developers are eligible for stamp duty exemption on instruments for the transfer of
ownership of such buildings. The amount of the stamp duty exemption is on the additional
cost incurred to obtain a GBI certificate. This exemption is given only once to the first owner
of the building.
b.Target of energy conservation
The target value on energy conservation is not yet set.
iv. Status of deploying EMS
Government buildings in Putrajaya have been installed with a Building Control
System (BCS) and BEMS. These systems allow buildings’ energy consumption from cooling
systems, lighting equipment and others to be monitored and controlled. Continuous
monitoring and optimisation of energy performance vis-a-vis human comfort parameters
resulted in a significant energy reduction.
HEMS is relatively new and focused only on high-end urban residences. A few pilot
projects on smart metering and smart grid were commenced in selected areas in March
2015.
(3) Singapore
i.Organizations on energy efficiency and conservation policy
In Singapore, a multi-agency committee called the Energy Efficiency Programme
30
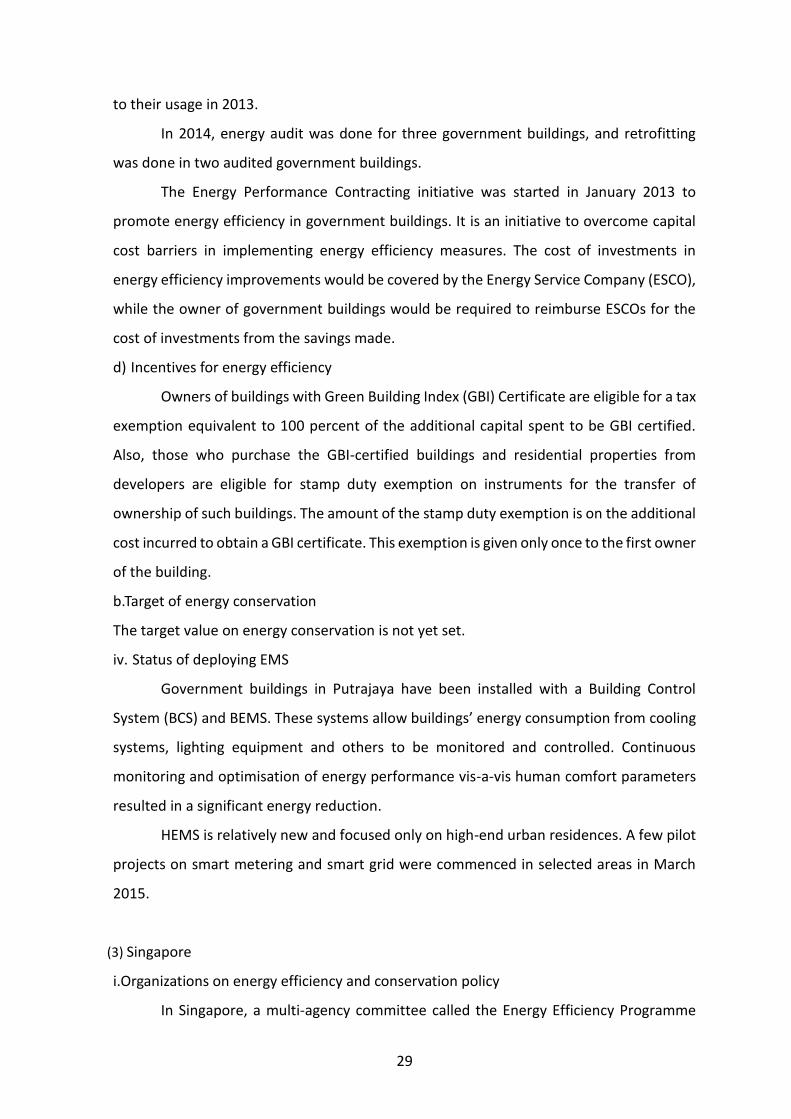
Office was formed to promote energy conservation. The office is jointly managed by the
National Environmental Agency, an affiliate of the Ministry of the Environment and Water
Resources, as the lead manager, and the Energy Market Authority, an unit of the Ministry
of Trade and Industry, as co-manager.
To promote energy saving among industry, residential and transportation sectors,
the Energy Efficiency Programme Office is engaged in raising consciousness in energy-
saving, training of experts, promotion of technological development, management of
regional bases, etc.
Government agencies responsible for energy saving programmes are shown in
Figure 2-30.
Figure 2-30. Holistic Approach to Implementing Mitigation Measures, Singapore
Source: ‘Energy Efficiency in Singapore’, National Environmental Agency, (6 March 2015).
ii. Laws and regulations related to energy conservation
a.Energy Conservation Act
Singapore’s Energy Conservation Act, which took effect in April 2013, requires large
energy users in the industry sector to implement mandatory energy management
practices. Large energy users are those corporations that meet the following qualifications:
Annual energy consumption ≥ 54 TJ /year
The business activity is attributable to one of the following sectors:
- Manufacturing and manufacturing-related services
- Supply of electricity, gas, steam, compressed air, and chilled water
- Water supply, and sewage and waste management
Power
GenerationIndustry Buildings Transport Households
31
These large energy users must appoint an energy manager to monitor and report
energy use and greenhouse gas emissions, and to submit energy efficiency improvement
plans annually.
b. Building Control (Environmental Sustainability) Regulations 2008
The Building Control (Environmental Sustainability) Regulations 2008 sets out a
minimum environmental sustainability standard equivalent to the Building and
Construction Authority’s Green Mark certification for new buildings and existing ones that
undergo major retrofitting.
c. Building Control Regulations 2013 (Environmental Sustainability Measure for Existing
Buildings)
Under the Building Control Regulations 2013, building owners are required to
submit building information and energy consumption data as well as periodic energy
efficiency audits of building cooling systems, and to comply with the minimum
environmental sustainability standard (Green Mark Standard) for existing buildings.
iii.Energy conservation programme and target
a.Energy conservation programme
a) Green Mark Certification
The Green Mark Scheme of the Building and Construction Authority was launched
in 2005. It is a benchmarking scheme that incorporates internationally recognised best
practices in environmental design and performance.
The minimum environmental sustainability standard (Green Mark-Certified Level)
is required for new buildings with an area of at least 2,000 m2, and existing buildings
consisting of hotels, retail businesses, or offices with an area of 15,000 m2 or more when
the building cooling system is installed or replaced.
b) Green Mark Incentive Schemes
Once higher-tier Green Mark levels are achieved, developers can build an additional
floor area. If significant improvement in energy efficiency is achieved by retrofits, owners
of existing buildings are eligible for grants to undertake retrofits. The government provides
building owners and tenants with grants to undertake energy improvement works that
involve the installation of energy-efficient equipment.
32
As to design prototypes, the government provides developers and building owners
with grants to focus their effort on the design stage to attain higher energy efficiency levels
beyond Green Mark Platinum standards.
The scheme called the Building Retrofit Energy Efficiency Financing provides loans
to building owners and energy services companies wanting to carry out energy retrofits.
c) Minimum Energy Performance Standards
Minimum energy-efficiency standards improve the average efficiency of household
appliances such as air conditioners, refrigerators, and clothes dryers.
d) Mandatory Energy Labelling Scheme
The Mandatory Energy Labelling Scheme allows consumers to compare energy
efficiency performance and lifecycle costs of different appliance models for the consumers
to make informed purchasing decisions. It covers air conditioners, refrigerators, clothes
dryers, and television sets.
b.Target of energy conservation
The greenhouse gas emission in BAU (business-as-usual) level is expected to reach
77.2 MT in 2020. Thus, the target is to reduce emissions by 7 percent to 11 percent below
2020 BAU levels. Key mitigation measures are energy efficiency and fuel switching.
iv.Status of deploying EMS
a.Industry sector
Most industrial companies are not equipped with any Energy Management
Information System 3 . Costs and benefits are not yet clear. Such is the case because
advanced modules require software and consultancy, which doubles the cost of
implementation. This can be addressed by a variety of policy tools such as legislative acts,
incentives, demonstration projects, activities that raise awareness, and training.
b.Buildings sector
The Energy Innovation Research Programme, administered by the Building and
Construction Authority, invests SG$15 million to support research in two areas, namely,
Building Management and Information Systems, and air conditioning and mechanical
ventilation.
3 Based on National Environmental Agency’s industry consultations from March to June 2012 with companies
under Energy Conservation Act.
33
Eight projects were awarded in June 2014. Examples of Building Management and
Information Systems are ‘Intelligent Information Management System for Smart Buildings
Using MultiAgent-enabled Wireless Sensor-Actuator Networks’ and ‘Optimized Energy
Measurement and Verification Protocol for Existing Buildings’.
Some BEMSs have been implemented in public-sector buildings. For example, JTC
(Jurong Town Corporation) Summit piloted the Integrated Estate Management System in
2014. Fusionopolis (120,000 m2) has 18,000 data points on its 2,500 pieces of equipment.
The electricity savings by 15 percent were achieved within six months of implementation.
The Fault Detection-and-Diagnosis algorithm was used. Inefficient equipment or systems
were identified and resolutions were explored.
c.Households sector
The HEMS can help households manage energy use, but its deployment is still at a
pilot stage. Singaporean authorities opt to test the effectiveness of HEMS through trials
under local conditions before they proceed to deploy. How the population interacts with
HEMS, its ability to nudgeusers’ energy-efficient behaviour, and the cost of HEMS vis-a-vis
electricity savings are some factors to consider when planning to introduce HEMS. As one
objective of HEMS is to visualize energy consumption and induce behaviour changes, its
features such as display, automation, and feedback shall be also considered.
(4) Thailand
i.Organisations on energy efficiency and conservation policy
The principal organisation in charge of energy saving policies in Thailand is the
Department of Alternative Energy Development and Efficiency (DEDE), a unit of the
Ministry of Energy (MOE). The Energy Policy and Planning Office, another affiliate agency
of the MOE, supports the energy efficiency programmes as part of the country’s energy
policies. In addition, the Thailand Industrial Standard Institute serves as the regulator of
the Minimum Energy Performance Standards, while the Electricity Generating Authority of
Thailand shares responsibility with DEDE for the labelling scheme of the High-Energy
Performance Standards.
a.Department of Alternative Energy Development and Efficiency
Formerly called the National Energy Authority, DEDE was established in 1953 under
the National Energy Authority Act, and acquired its current name by virtue of the Ministry
34
of Energy’s Government Administrative Act B.E. 2545 (2002).
Under the Act on Administrative Organisation of State Affairs, DEDE is responsible
for energy efficiency promotion, energy conservation regulation, energy sources provision,
alternative development of integrated energy uses, and energy technology dissemination.
b. Energy Policy and Planning Office
Thailand’s Energy Policy and Planning Office is in charge of energy policies and
planning and engaged in the promotion of energy savings and use of alternative energy;
preparation of short- and long-term measures to solve oil shortage; supervision and
assessment of the effectiveness of national energy policy and energy management plans,
etc.
ii.Laws and regulations related to energy conservation
a.Energy Conservation and Promotion Act. (B.E. 1992 (Revision B.E. 2007))
The Energy Conservation and Promotion Act came into effect on 2 April 1992. That
year, the act focused on engineering solutions and paid little attention on the value of
people. In 2007, the act was revised to introduce EMS and systematic approach of energy
conservation.
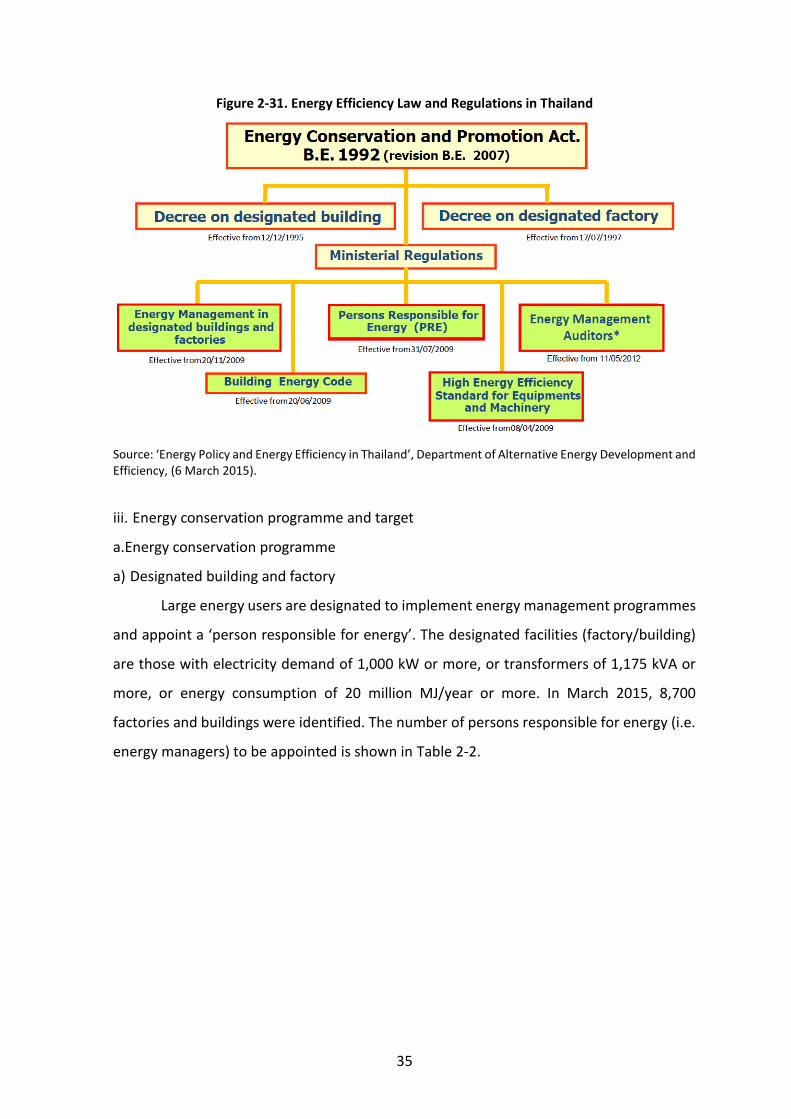
Figure 2-31 presents the energy efficiency laws and regulations in Thailand.
35
Figure 2-31. Energy Efficiency Law and Regulations in Thailand
Source: ‘Energy Policy and Energy Efficiency in Thailand’, Department of Alternative Energy Development and Efficiency, (6 March 2015).
iii. Energy conservation programme and target
a.Energy conservation programme
a) Designated building and factory
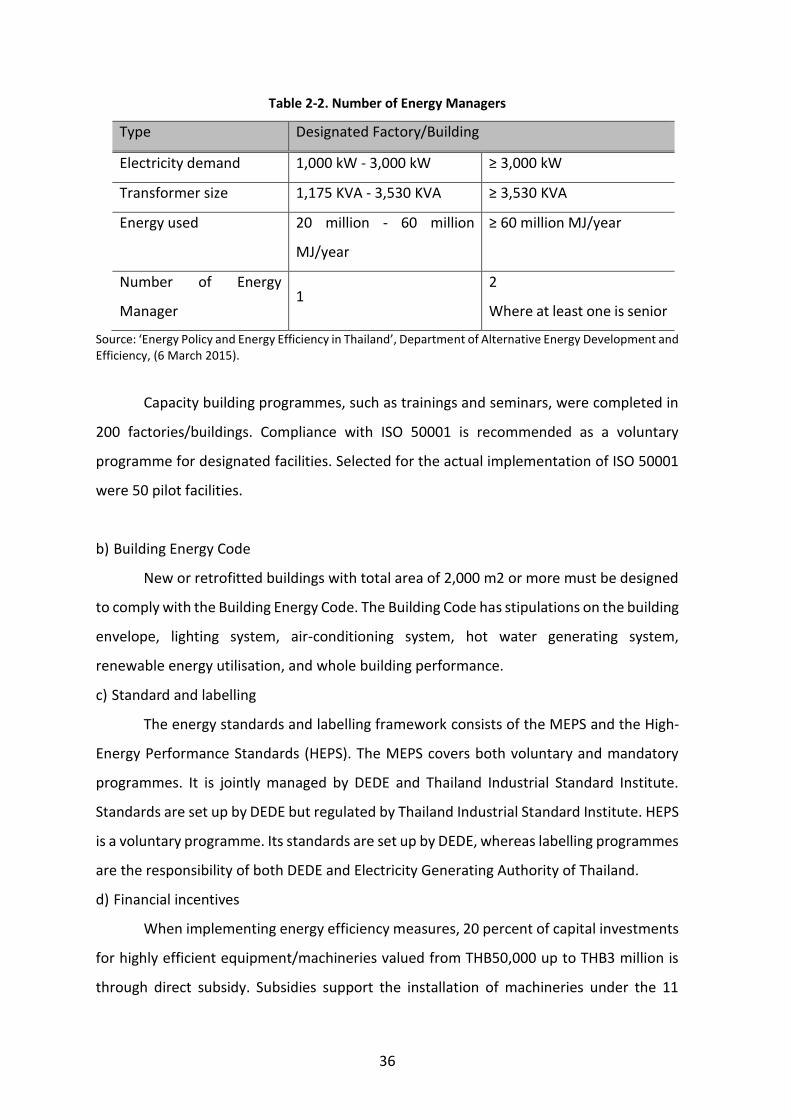
Large energy users are designated to implement energy management programmes
and appoint a ‘person responsible for energy’. The designated facilities (factory/building)
are those with electricity demand of 1,000 kW or more, or transformers of 1,175 kVA or
more, or energy consumption of 20 million MJ/year or more. In March 2015, 8,700
factories and buildings were identified. The number of persons responsible for energy (i.e.
energy managers) to be appointed is shown in Table 2-2.
36
Table 2-2. Number of Energy Managers
Type Designated Factory/Building
Electricity demand 1,000 kW - 3,000 kW ≥ 3,000 kW
Transformer size 1,175 KVA - 3,530 KVA ≥ 3,530 KVA
Energy used 20 million - 60 million
MJ/year
≥ 60 million MJ/year
Number of Energy
Manager 1
2
Where at least one is senior
Source: ‘Energy Policy and Energy Efficiency in Thailand’, Department of Alternative Energy Development and Efficiency, (6 March 2015).
Capacity building programmes, such as trainings and seminars, were completed in
200 factories/buildings. Compliance with ISO 50001 is recommended as a voluntary
programme for designated facilities. Selected for the actual implementation of ISO 50001
were 50 pilot facilities.
b) Building Energy Code
New or retrofitted buildings with total area of 2,000 m2 or more must be designed
to comply with the Building Energy Code. The Building Code has stipulations on the building
envelope, lighting system, air-conditioning system, hot water generating system,
renewable energy utilisation, and whole building performance.
c) Standard and labelling
The energy standards and labelling framework consists of the MEPS and the High-
Energy Performance Standards (HEPS). The MEPS covers both voluntary and mandatory
programmes. It is jointly managed by DEDE and Thailand Industrial Standard Institute.
Standards are set up by DEDE but regulated by Thailand Industrial Standard Institute. HEPS
is a voluntary programme. Its standards are set up by DEDE, whereas labelling programmes
are the responsibility of both DEDE and Electricity Generating Authority of Thailand.
d) Financial incentives
When implementing energy efficiency measures, 20 percent of capital investments
for highly efficient equipment/machineries valued from THB50,000 up to THB3 million is
through direct subsidy. Subsidies support the installation of machineries under the 11
37
DEDE standard measures (such as those covering LED, voltage regulators, etc.) and the
installation of 12 advanced technologies (such as absorption chillers and other approved
technologies). Besides subsidies support, ESCO fund, tax incentive, and soft loan are
provided. Subsidies support the installation of machineries under the 11 DEDE Standard
Measures (such as those covering LED, voltage regulators, etc.) and the installation of 12
advanced technologies (such as absorption chiller and other approved technologies).
Besides subsidies support, ESCO fund, tax incentive, and soft loan are provided.
e) Social / awareness raising
Some recognition programmes such as the Thailand Energy Awards, ASEAN Energy
Awards, and School Energy Conservation Competitions have been implemented. Mass
media—TV, radio, internet, newspaper, magazines, etc.—are utilised to effectively
promote the awareness programmes.
b.Target of energy conservation
As of 23 August 2011, the government policy aimed to reduce Thailand’s energy
intensity by 25 percent within 20 years. The final energy consumption in 2030 was
expected to be reduced by at least 38,200 ktoe. In the draft version of the new Energy
Efficiency Plan (2015-2036), the final energy consumption in 2036 is expected to be
reduced by at least 57,400 ktoe, while a 30 percent reduction in energy intensity is
targeted.
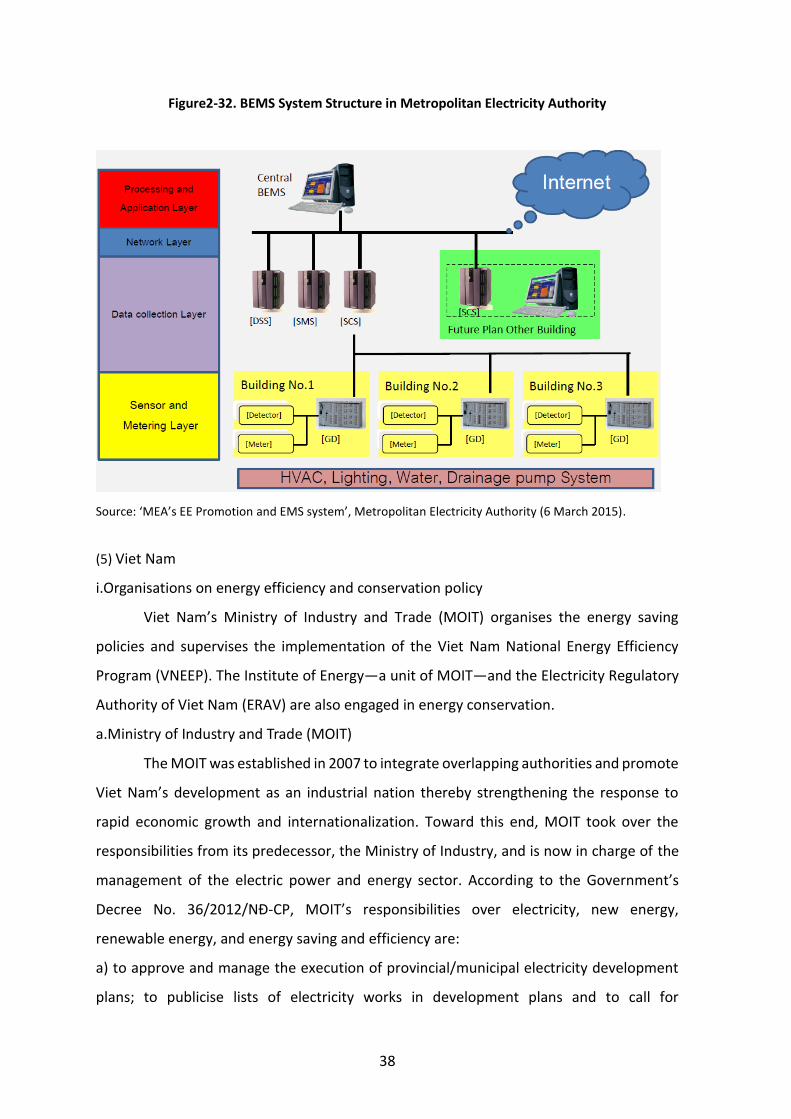
iv. Status of deploying EMS
Electric power utilities have initiated several projects to promote EMS.
Metropolitan Electricity Authority (MEA), the power distribution utility covering
Metropolitan Bangkok, completed the pilot phase of a smart energy building project in
2010. Its aim here is to implement a BEMS in MEA offices and later, to expand the system
to offices of business customers. The project was deployed from 2012 to 2016. In addition,
a telecommunication networking among district offices has been established as an energy
management network.
38
Figure2-32. BEMS System Structure in Metropolitan Electricity Authority
Source: ‘MEA’s EE Promotion and EMS system’, Metropolitan Electricity Authority (6 March 2015).
(5) Viet Nam
i.Organisations on energy efficiency and conservation policy
Viet Nam’s Ministry of Industry and Trade (MOIT) organises the energy saving
policies and supervises the implementation of the Viet Nam National Energy Efficiency
Program (VNEEP). The Institute of Energy—a unit of MOIT—and the Electricity Regulatory
Authority of Viet Nam (ERAV) are also engaged in energy conservation.
a.Ministry of Industry and Trade (MOIT)
The MOIT was established in 2007 to integrate overlapping authorities and promote
Viet Nam’s development as an industrial nation thereby strengthening the response to
rapid economic growth and internationalization. Toward this end, MOIT took over the
responsibilities from its predecessor, the Ministry of Industry, and is now in charge of the
management of the electric power and energy sector. According to the Government’s
Decree No. 36/2012/NĐ-CP, MOIT’s responsibilities over electricity, new energy,
renewable energy, and energy saving and efficiency are:
a) to approve and manage the execution of provincial/municipal electricity development
plans; to publicise lists of electricity works in development plans and to call for
39
investments;
b) to approve cascade hydropower, new energy and renewable energy plans;
c) to perform tasks related to nuclear power, new energy, and renewable energy in
accordance with existing laws;
d) to perform tasks related to electricity regulation in accordance with laws;
e) to manage energy saving and efficiency efforts in fields under its purview.
In 2011, the General Department of Energy was formed within MOIT, and the
Energy Conservation Office was established.
b. Institute of Energy
Institute of Energy, which is under the jurisdiction and management by MOIT, is
responsible for drafting the plan on energy policies, formulating an electric power
development plan on the national and regional levels as well as the researching on power
equipment, energy savings and new energy, etc.
ii.Laws and regulations related to energy conservation
Law No. 50/2010/QH12 (dated 17 June 2010) is a fundamental law on energy
efficiency and conservation. Viet Nam’s legal framework for energy efficiency is
summarised in Table 2-3.
40
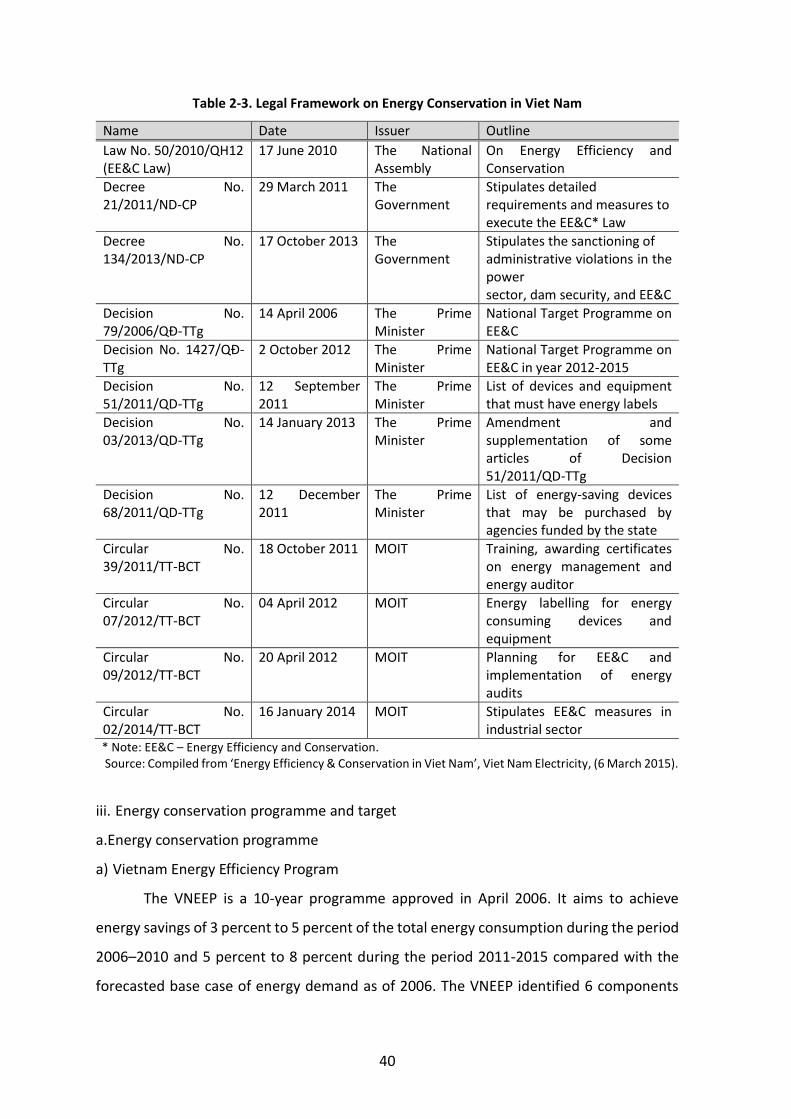
Table 2-3. Legal Framework on Energy Conservation in Viet Nam
Name Date Issuer Outline
Law No. 50/2010/QH12 (EE&C Law)
17 June 2010 The National Assembly
On Energy Efficiency and Conservation
Decree No. 21/2011/ND-CP
29 March 2011 The Government
Stipulates detailed requirements and measures to execute the EE&C* Law
Decree No. 134/2013/ND-CP
17 October 2013 The Government
Stipulates the sanctioning of administrative violations in the power sector, dam security, and EE&C
Decision No. 79/2006/QĐ-TTg
14 April 2006 The Prime Minister
National Target Programme on EE&C
Decision No. 1427/QĐ-TTg
2 October 2012 The Prime Minister
National Target Programme on EE&C in year 2012-2015
Decision No. 51/2011/QD-TTg
12 September 2011
The Prime Minister
List of devices and equipment that must have energy labels
Decision No. 03/2013/QD-TTg
14 January 2013 The Prime Minister
Amendment and supplementation of some articles of Decision 51/2011/QD-TTg
Decision No. 68/2011/QD-TTg
12 December 2011
The Prime Minister
List of energy-saving devices that may be purchased by agencies funded by the state
Circular No. 39/2011/TT-BCT
18 October 2011 MOIT Training, awarding certificates on energy management and energy auditor
Circular No. 07/2012/TT-BCT
04 April 2012 MOIT Energy labelling for energy consuming devices and equipment
Circular No. 09/2012/TT-BCT
20 April 2012 MOIT Planning for EE&C and implementation of energy audits
Circular No. 02/2014/TT-BCT
16 January 2014 MOIT Stipulates EE&C measures in industrial sector
* Note: EE&C – Energy Efficiency and Conservation. Source: Compiled from ‘Energy Efficiency & Conservation in Viet Nam’, Viet Nam Electricity, (6 March 2015).
iii. Energy conservation programme and target
a.Energy conservation programme
a) Vietnam Energy Efficiency Program
The VNEEP is a 10-year programme approved in April 2006. It aims to achieve
energy savings of 3 percent to 5 percent of the total energy consumption during the period
2006–2010 and 5 percent to 8 percent during the period 2011-2015 compared with the
forecasted base case of energy demand as of 2006. The VNEEP identified 6 components
41
and 11 projects to achieve these targets.
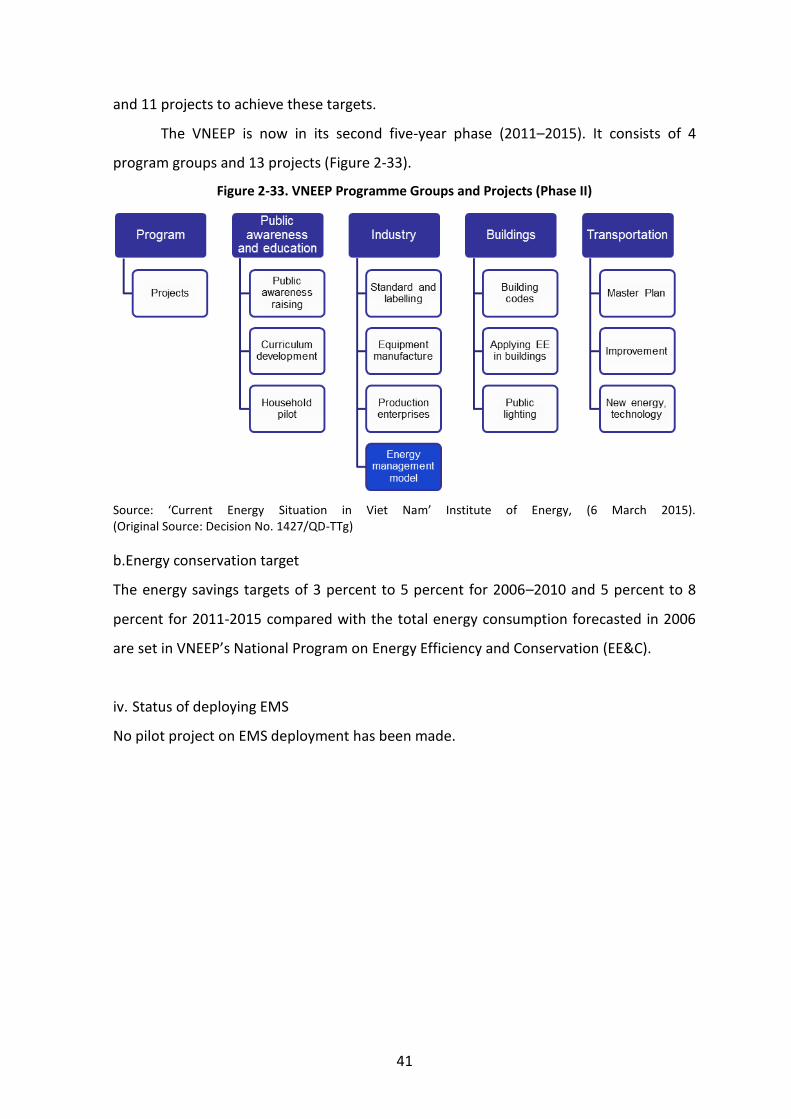
The VNEEP is now in its second five-year phase (2011–2015). It consists of 4
program groups and 13 projects (Figure 2-33).
Figure 2-33. VNEEP Programme Groups and Projects (Phase II)
Source: ‘Current Energy Situation in Viet Nam’ Institute of Energy, (6 March 2015). (Original Source: Decision No. 1427/QD-TTg)
b.Energy conservation target
The energy savings targets of 3 percent to 5 percent for 2006–2010 and 5 percent to 8
percent for 2011-2015 compared with the total energy consumption forecasted in 2006
are set in VNEEP’s National Program on Energy Efficiency and Conservation (EE&C).
iv. Status of deploying EMS
No pilot project on EMS deployment has been made.
42
2. Basic Functions and Benefits of xEMS Technologies
2.1. Overview of xEMS technologies
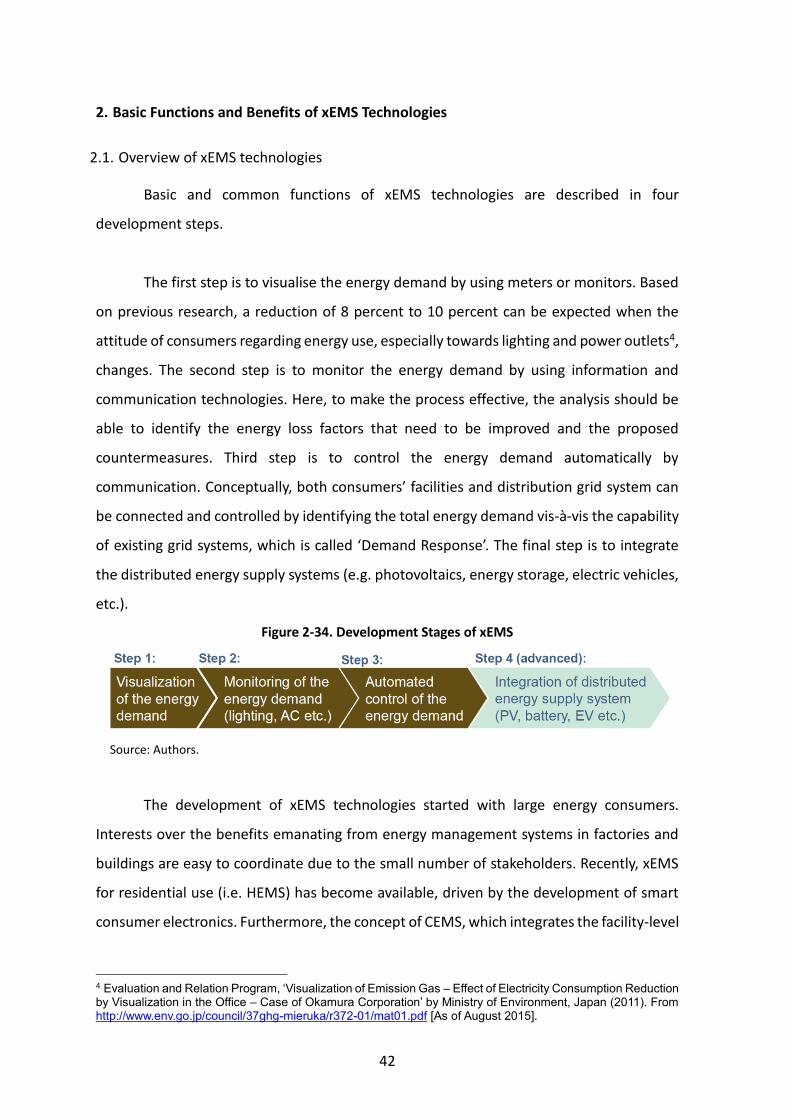
Basic and common functions of xEMS technologies are described in four
development steps.
The first step is to visualise the energy demand by using meters or monitors. Based
on previous research, a reduction of 8 percent to 10 percent can be expected when the
attitude of consumers regarding energy use, especially towards lighting and power outlets4,
changes. The second step is to monitor the energy demand by using information and
communication technologies. Here, to make the process effective, the analysis should be
able to identify the energy loss factors that need to be improved and the proposed
countermeasures. Third step is to control the energy demand automatically by
communication. Conceptually, both consumers’ facilities and distribution grid system can
be connected and controlled by identifying the total energy demand vis-à-vis the capability
of existing grid systems, which is called ‘Demand Response’. The final step is to integrate
the distributed energy supply systems (e.g. photovoltaics, energy storage, electric vehicles,
etc.).
Figure 2-34. Development Stages of xEMS
Source: Authors.
The development of xEMS technologies started with large energy consumers.
Interests over the benefits emanating from energy management systems in factories and
buildings are easy to coordinate due to the small number of stakeholders. Recently, xEMS
for residential use (i.e. HEMS) has become available, driven by the development of smart
consumer electronics. Furthermore, the concept of CEMS, which integrates the facility-level
4 Evaluation and Relation Program, ‘Visualization of Emission Gas – Effect of Electricity Consumption Reduction by Visualization in the Office – Case of Okamura Corporation’ by Ministry of Environment, Japan (2011). From http://www.env.go.jp/council/37ghg-mieruka/r372-01/mat01.pdf [As of August 2015].
43
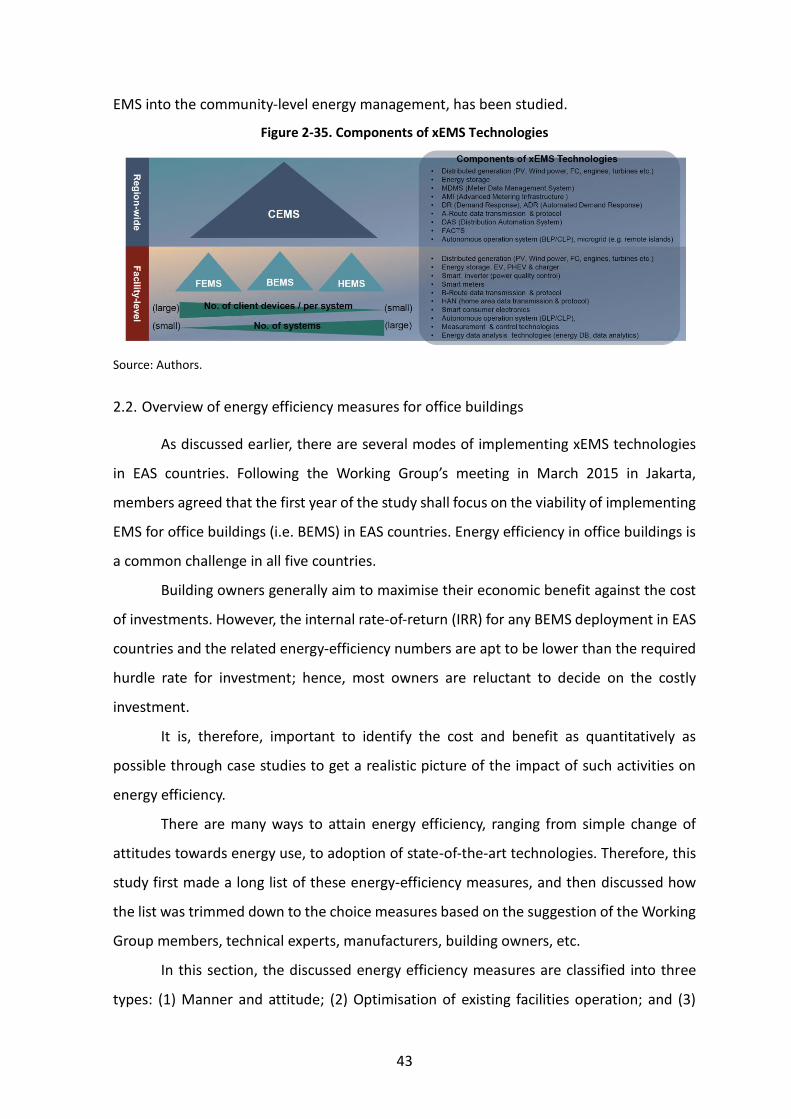
EMS into the community-level energy management, has been studied.
Figure 2-35. Components of xEMS Technologies
Source: Authors.
2.2. Overview of energy efficiency measures for office buildings
As discussed earlier, there are several modes of implementing xEMS technologies
in EAS countries. Following the Working Group’s meeting in March 2015 in Jakarta,
members agreed that the first year of the study shall focus on the viability of implementing
EMS for office buildings (i.e. BEMS) in EAS countries. Energy efficiency in office buildings is
a common challenge in all five countries.
Building owners generally aim to maximise their economic benefit against the cost
of investments. However, the internal rate-of-return (IRR) for any BEMS deployment in EAS
countries and the related energy-efficiency numbers are apt to be lower than the required
hurdle rate for investment; hence, most owners are reluctant to decide on the costly
investment.
It is, therefore, important to identify the cost and benefit as quantitatively as
possible through case studies to get a realistic picture of the impact of such activities on
energy efficiency.
There are many ways to attain energy efficiency, ranging from simple change of
attitudes towards energy use, to adoption of state-of-the-art technologies. Therefore, this
study first made a long list of these energy-efficiency measures, and then discussed how
the list was trimmed down to the choice measures based on the suggestion of the Working
Group members, technical experts, manufacturers, building owners, etc.
In this section, the discussed energy efficiency measures are classified into three
types: (1) Manner and attitude; (2) Optimisation of existing facilities operation; and (3)
44
Investment in highly efficient technologies. Those categorised in (1) are the simplest
measures with low cost of implementation. Those categorised in (2) are also relatively low-
cost measures compared to (3) but some technical experiences are needed compared to
those in type (1). Those categorised in (3) are generally the most advanced but require a
certain initial amount of investment.
(1) Manner and attitude
i. Adjusting room temperature settings
Energy is saved by adjusting room temperature settings appropriately. In Japan, the
government recommends the temperature setting at 28°C in the summer, 20°C during
winter. Raising the temperature setting of air conditioners helps to reduce electricity
consumption.
ii. Switching off lights during lunch break
Lighting accounts for a significant part of the energy used in office buildings.
Accordingly, a lot of energy can be saved also by improving employees’ energy conservation
awareness. One of the ways to save is to turn off lightings in offices during lunch break.
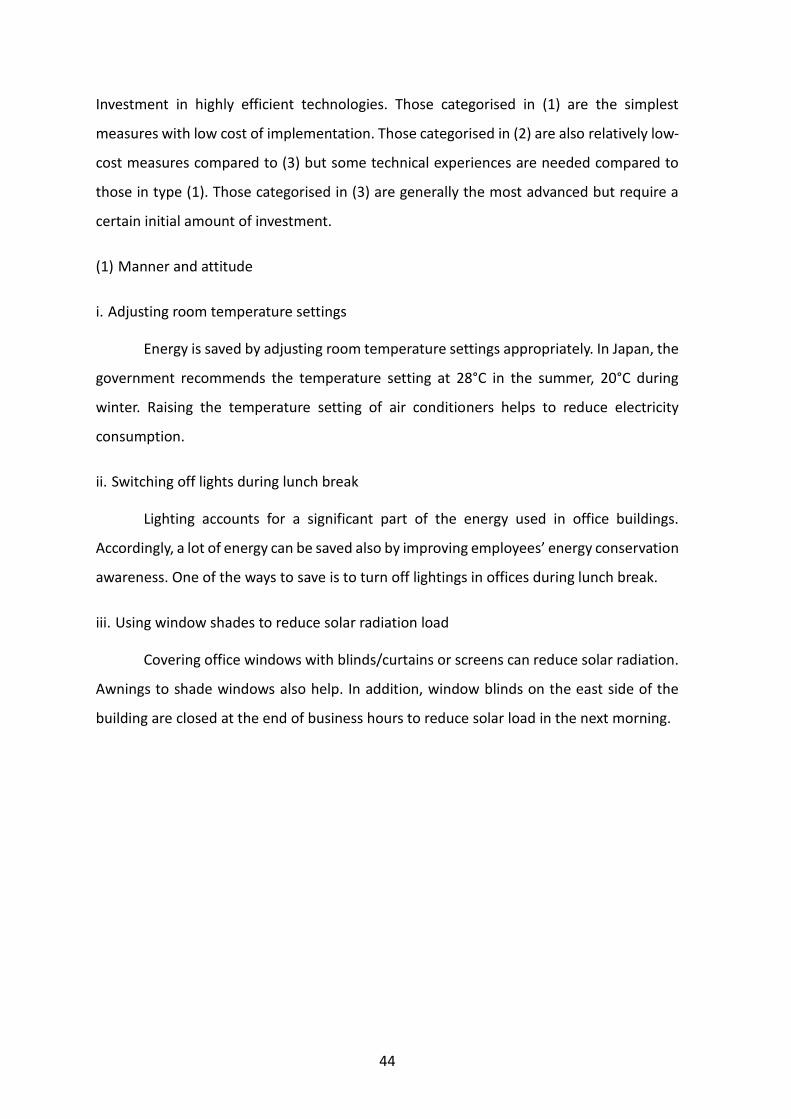
iii. Using window shades to reduce solar radiation load
Covering office windows with blinds/curtains or screens can reduce solar radiation.
Awnings to shade windows also help. In addition, window blinds on the east side of the
building are closed at the end of business hours to reduce solar load in the next morning.
45
Figure 2-36. Using Window Shades to Reduce Solar Radiation Load
Source: ‘Office-based Companies’, The Carbon Trust (2010).
iv. Controlling lighting block-by-block
To reduce energy waste, lighting fixtures in unused areas are turned off. When
rendering overtime work, employees should turn on those lightings only in the space where
they continue to work.
v. Controlling air conditioning system block-by-block
A person sitting near the window may feel warm during the summer, while those
far from the window may feel cold. To improve occupants’ comfort and save on energy, the
air conditioning system in offices must be one that can be controlled in blocks so that rooms
or spaces are heated or cooled independent of each other.
vi. Switching off air conditioners in unused rooms/off-working hours
Air conditioners should be switched off in rooms where there are no workers (i.e.
vacant room, at night, during weekends and holidays).
46
(2) Optimisation of existing facilities’ operation
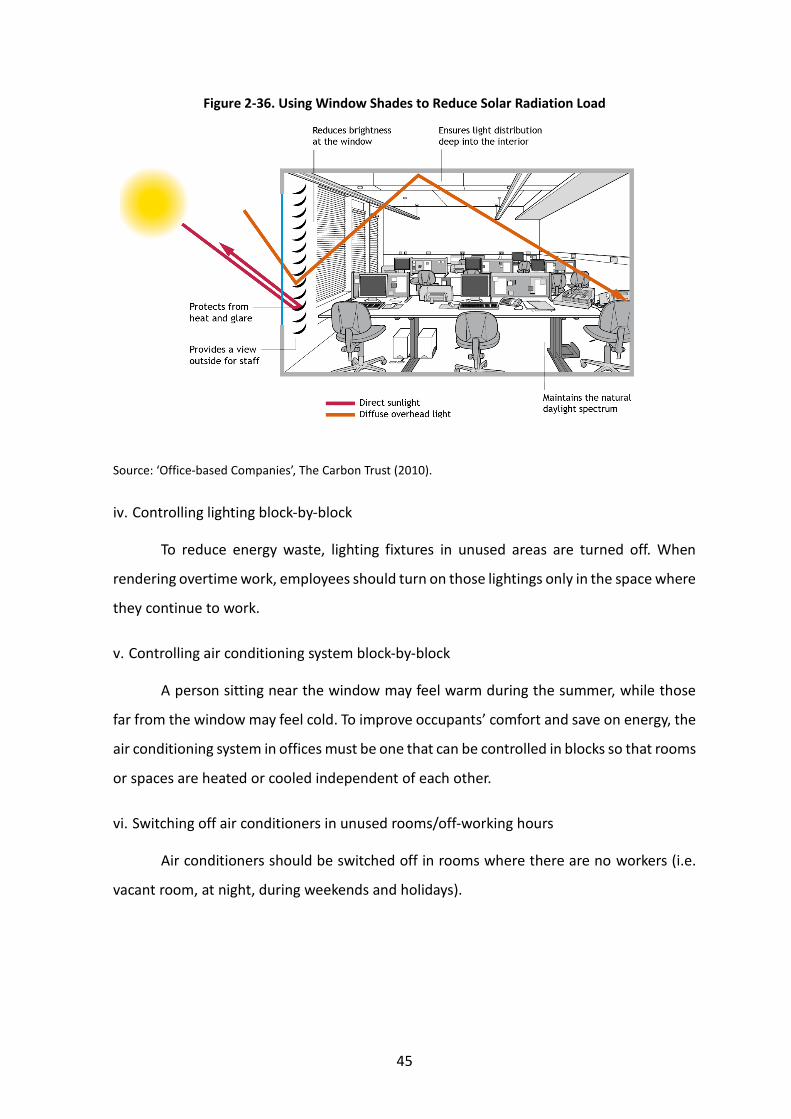
i. Adjusting the heat source and auxiliary equipment
Depending on the difference in the load by season, the operational parameters of
equipment such as air conditioning/heat source equipment and auxiliary machines are
adjusted to optimise the costs. Figure 2-37 illustrates the main components of the heat
source controlling system. A good example is the Marunouchi Heat Supply (to be discussed
in Section 3.5), where the operation of turbo chillers and absorption chillers are changed
across seasons.
Figure 2-37. Adjustment of Heat Source and Auxiliary Equipment
Source: Mitsubishi Heavy Industries, Ltd. From http://www.mhi-global.com/products/detail/centrifugal_chiller_enecon.html [As of August 2015].
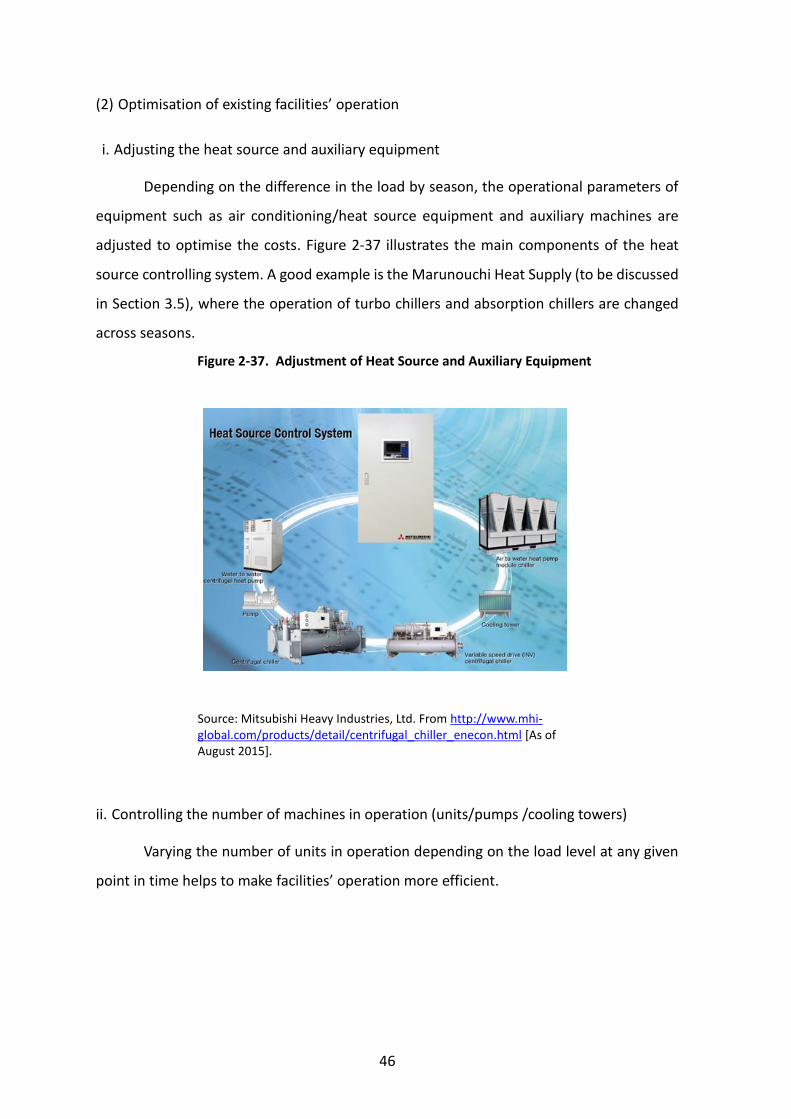
ii. Controlling the number of machines in operation (units/pumps /cooling towers)
Varying the number of units in operation depending on the load level at any given
point in time helps to make facilities’ operation more efficient.
47
Figure 2-38. Machine-numbers Control
Source: Mitsubishi Heavy Industries, Ltd. From https://www.mhi-global.com/products/detail/distributed_power_case_turbo.html [As of August 2015].
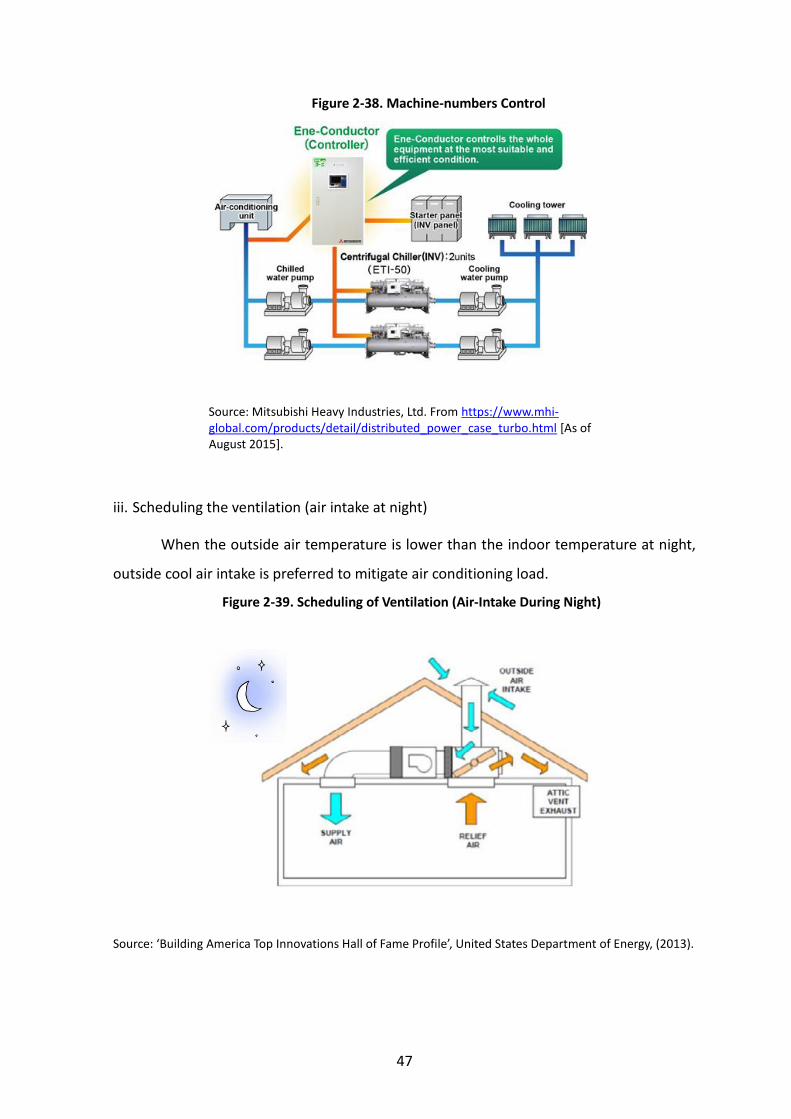
iii. Scheduling the ventilation (air intake at night)
When the outside air temperature is lower than the indoor temperature at night,
outside cool air intake is preferred to mitigate air conditioning load.
Figure 2-39. Scheduling of Ventilation (Air-Intake During Night)
Source: ‘Building America Top Innovations Hall of Fame Profile’, United States Department of Energy, (2013).
48
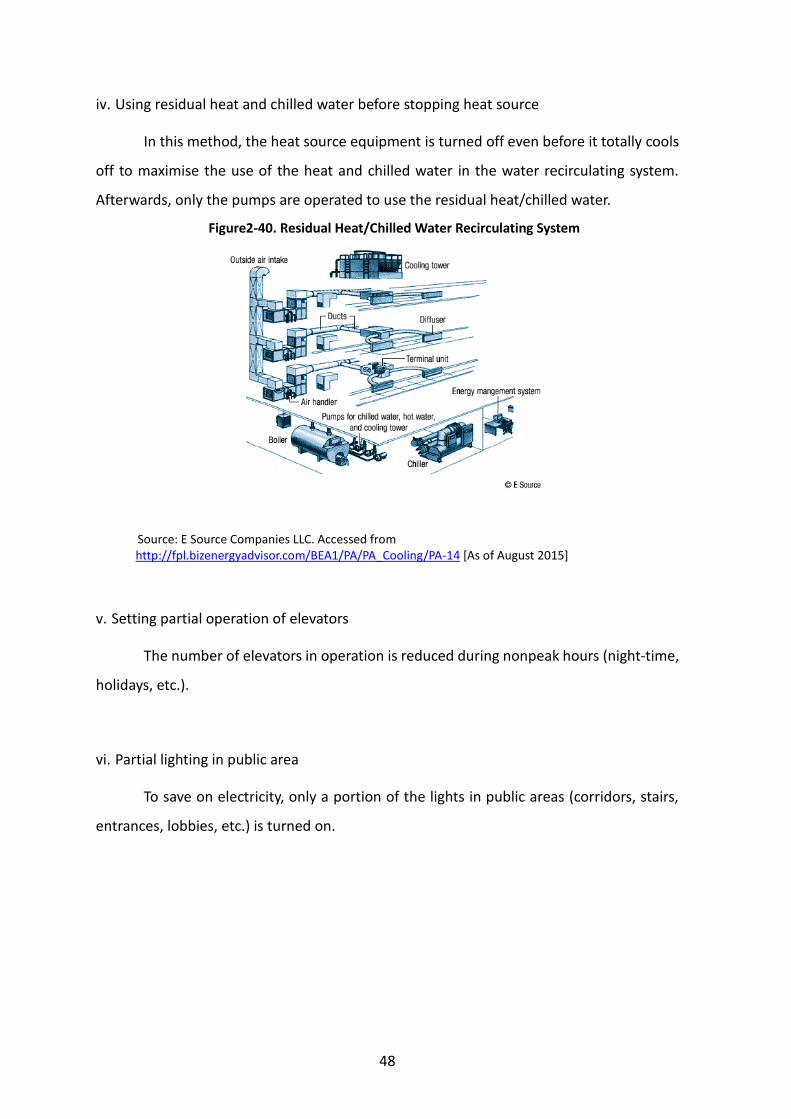
iv. Using residual heat and chilled water before stopping heat source
In this method, the heat source equipment is turned off even before it totally cools
off to maximise the use of the heat and chilled water in the water recirculating system.
Afterwards, only the pumps are operated to use the residual heat/chilled water.
Figure2-40. Residual Heat/Chilled Water Recirculating System
Source: E Source Companies LLC. Accessed from http://fpl.bizenergyadvisor.com/BEA1/PA/PA_Cooling/PA-14 [As of August 2015]
v. Setting partial operation of elevators
The number of elevators in operation is reduced during nonpeak hours (night-time,
holidays, etc.).
vi. Partial lighting in public area
To save on electricity, only a portion of the lights in public areas (corridors, stairs,
entrances, lobbies, etc.) is turned on.
49
Figure 2-41. Partial Lighting in Public Areas
Source: WASEDA University. From http://www.waseda.jp/student/weekly/contents/2010a/1217/217a.html [as of August 2015.
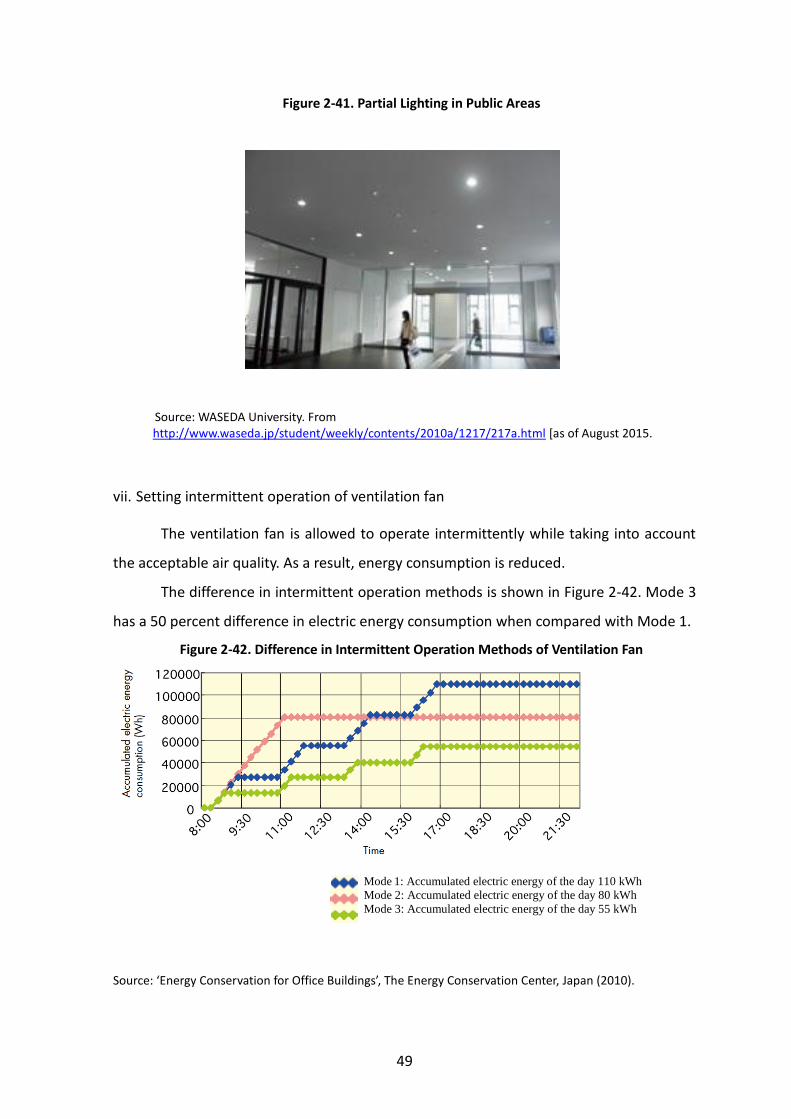
vii. Setting intermittent operation of ventilation fan
The ventilation fan is allowed to operate intermittently while taking into account
the acceptable air quality. As a result, energy consumption is reduced.
The difference in intermittent operation methods is shown in Figure 2-42. Mode 3
has a 50 percent difference in electric energy consumption when compared with Mode 1.
Figure 2-42. Difference in Intermittent Operation Methods of Ventilation Fan
Source: ‘Energy Conservation for Office Buildings’, The Energy Conservation Center, Japan (2010).
Mode 1: Accumulated electric energy of the day 110 kWh
Mode 2: Accumulated electric energy of the day 80 kWh
Mode 3: Accumulated electric energy of the day 55 kWh
50
(3) Invest in highly efficient technologies
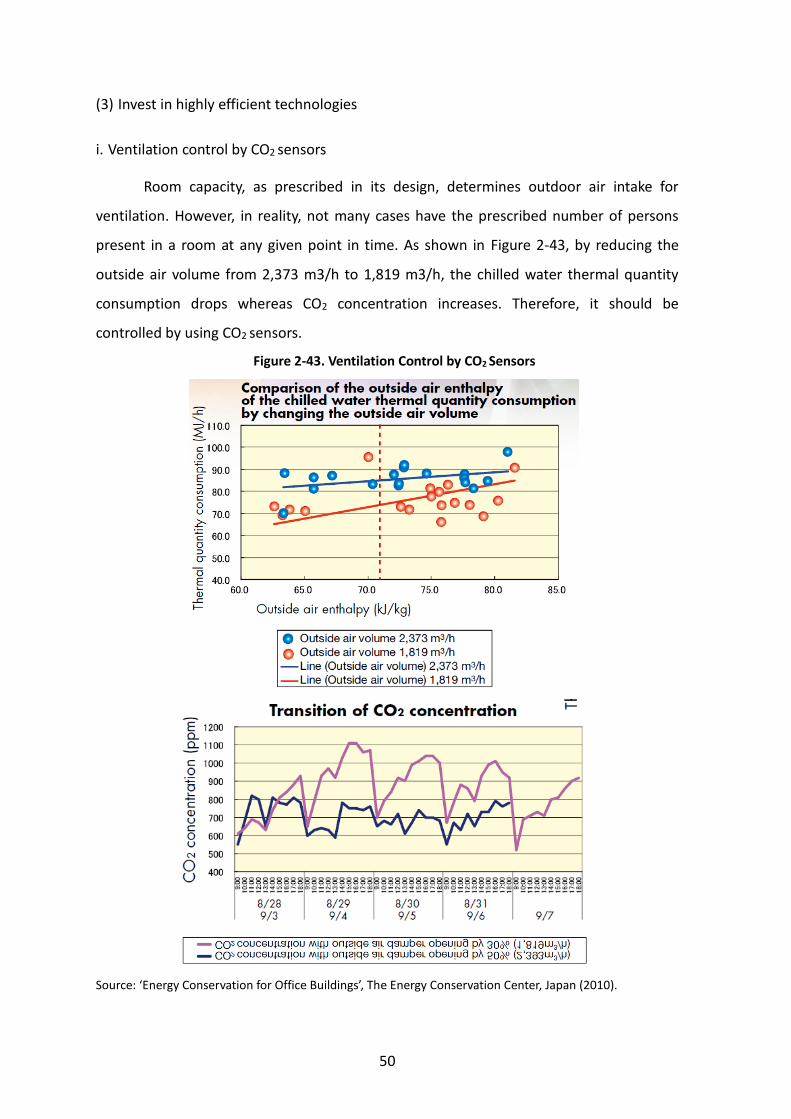
i. Ventilation control by CO2 sensors
Room capacity, as prescribed in its design, determines outdoor air intake for
ventilation. However, in reality, not many cases have the prescribed number of persons
present in a room at any given point in time. As shown in Figure 2-43, by reducing the
outside air volume from 2,373 m3/h to 1,819 m3/h, the chilled water thermal quantity
consumption drops whereas CO2 concentration increases. Therefore, it should be
controlled by using CO2 sensors.
Figure 2-43. Ventilation Control by CO2 Sensors
Source: ‘Energy Conservation for Office Buildings’, The Energy Conservation Center, Japan (2010).
51
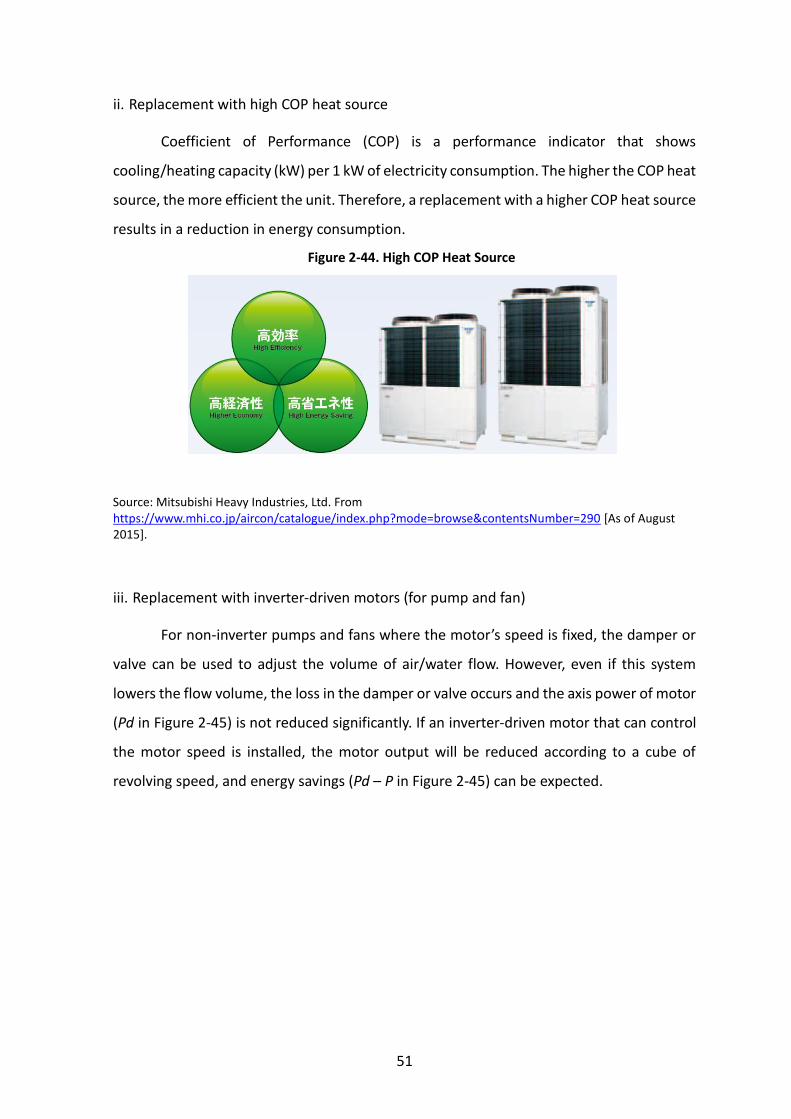
ii. Replacement with high COP heat source
Coefficient of Performance (COP) is a performance indicator that shows
cooling/heating capacity (kW) per 1 kW of electricity consumption. The higher the COP heat
source, the more efficient the unit. Therefore, a replacement with a higher COP heat source
results in a reduction in energy consumption.
Figure 2-44. High COP Heat Source
Source: Mitsubishi Heavy Industries, Ltd. From https://www.mhi.co.jp/aircon/catalogue/index.php?mode=browse&contentsNumber=290 [As of August 2015].
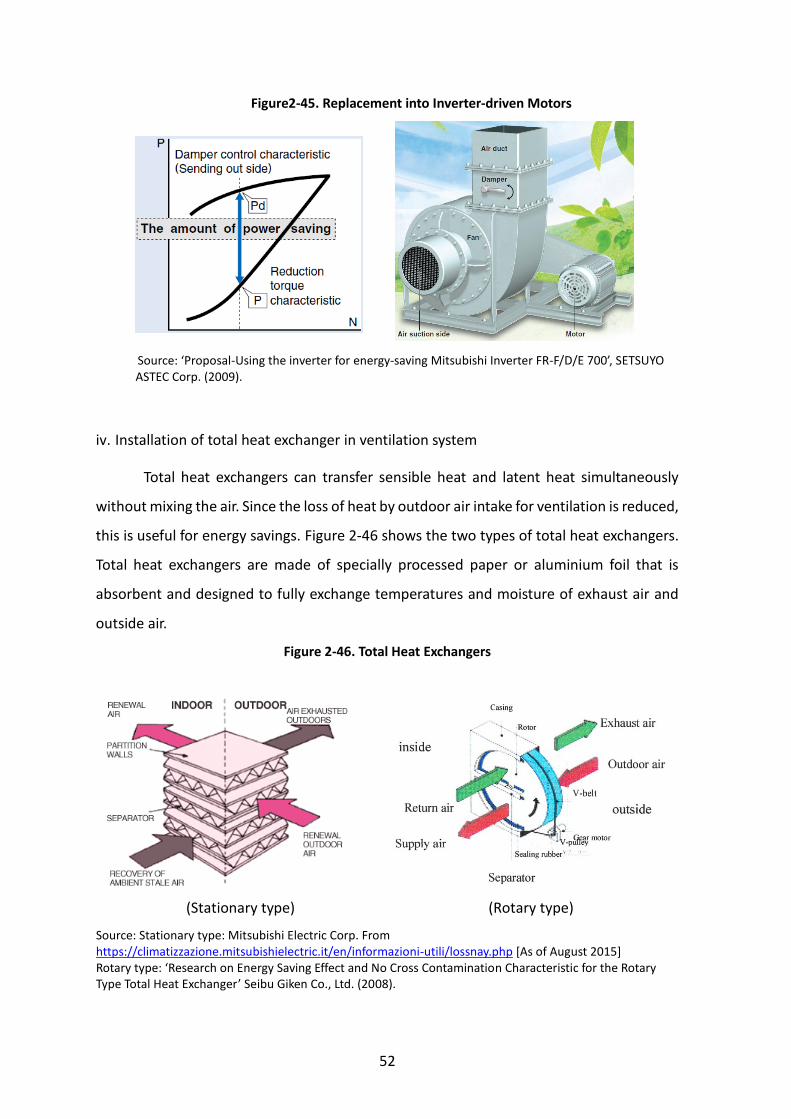
iii. Replacement with inverter-driven motors (for pump and fan)
For non-inverter pumps and fans where the motor’s speed is fixed, the damper or
valve can be used to adjust the volume of air/water flow. However, even if this system
lowers the flow volume, the loss in the damper or valve occurs and the axis power of motor
(Pd in Figure 2-45) is not reduced significantly. If an inverter-driven motor that can control
the motor speed is installed, the motor output will be reduced according to a cube of
revolving speed, and energy savings (Pd – P in Figure 2-45) can be expected.
52
Figure2-45. Replacement into Inverter-driven Motors
Source: ‘Proposal-Using the inverter for energy-saving Mitsubishi Inverter FR-F/D/E 700’, SETSUYO ASTEC Corp. (2009).
iv. Installation of total heat exchanger in ventilation system
Total heat exchangers can transfer sensible heat and latent heat simultaneously
without mixing the air. Since the loss of heat by outdoor air intake for ventilation is reduced,
this is useful for energy savings. Figure 2-46 shows the two types of total heat exchangers.
Total heat exchangers are made of specially processed paper or aluminium foil that is
absorbent and designed to fully exchange temperatures and moisture of exhaust air and
outside air.
Figure 2-46. Total Heat Exchangers
(Stationary type) (Rotary type)
Source: Stationary type: Mitsubishi Electric Corp. From https://climatizzazione.mitsubishielectric.it/en/informazioni-utili/lossnay.php [As of August 2015] Rotary type: ‘Research on Energy Saving Effect and No Cross Contamination Characteristic for the Rotary Type Total Heat Exchanger’ Seibu Giken Co., Ltd. (2008).
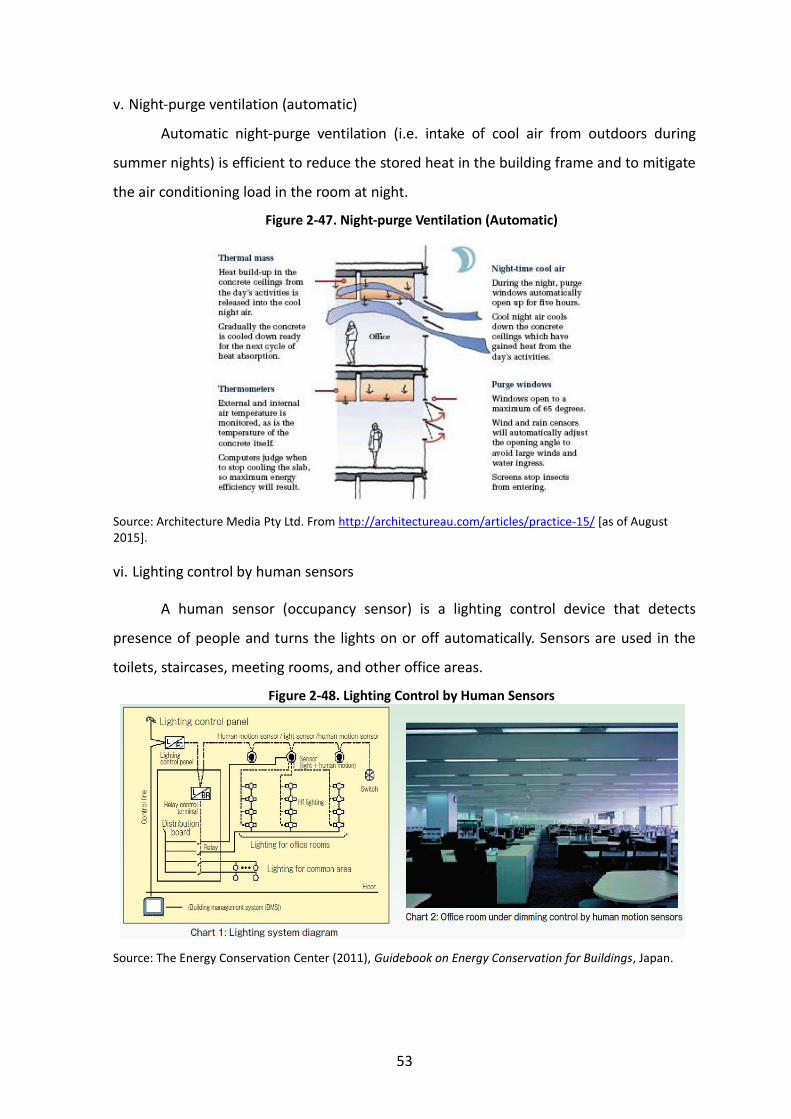
53
v. Night-purge ventilation (automatic)
Automatic night-purge ventilation (i.e. intake of cool air from outdoors during
summer nights) is efficient to reduce the stored heat in the building frame and to mitigate
the air conditioning load in the room at night.
Figure 2-47. Night-purge Ventilation (Automatic)
Source: Architecture Media Pty Ltd. From http://architectureau.com/articles/practice-15/ [as of August 2015].
vi. Lighting control by human sensors
A human sensor (occupancy sensor) is a lighting control device that detects
presence of people and turns the lights on or off automatically. Sensors are used in the
toilets, staircases, meeting rooms, and other office areas.
Figure 2-48. Lighting Control by Human Sensors
Source: The Energy Conservation Center (2011), Guidebook on Energy Conservation for Buildings, Japan.
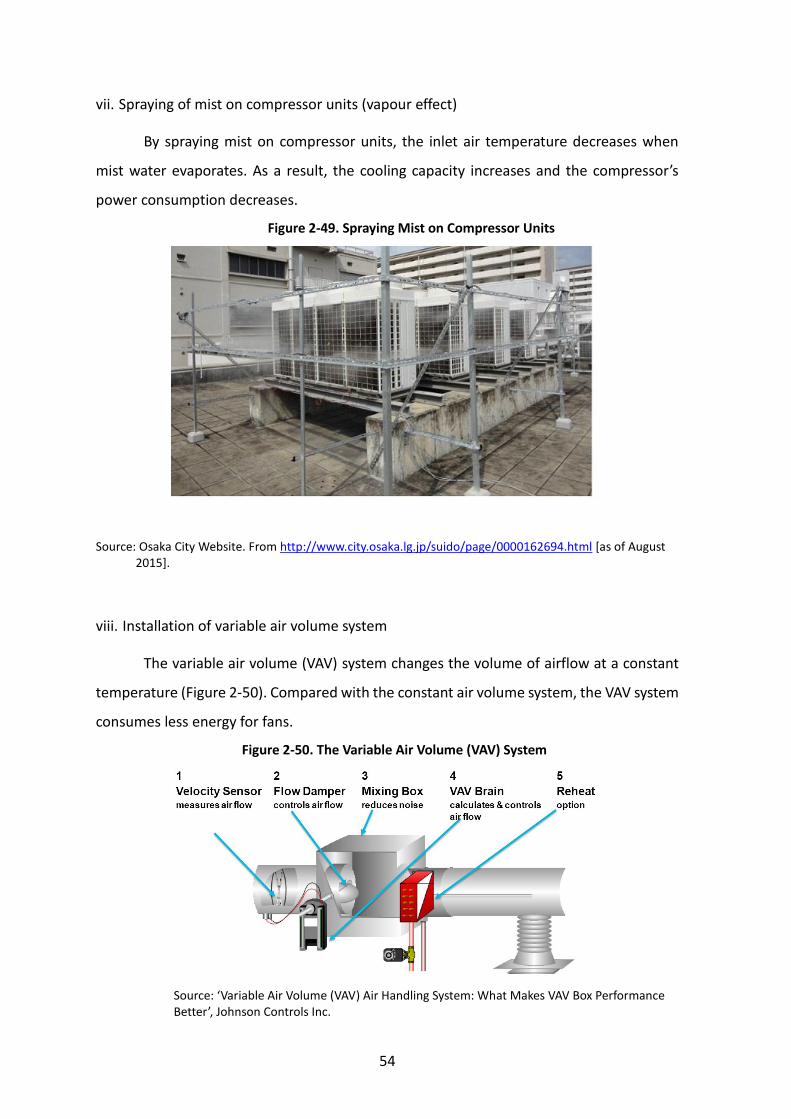
54
vii. Spraying of mist on compressor units (vapour effect)
By spraying mist on compressor units, the inlet air temperature decreases when
mist water evaporates. As a result, the cooling capacity increases and the compressor’s
power consumption decreases.
Figure 2-49. Spraying Mist on Compressor Units
Source: Osaka City Website. From http://www.city.osaka.lg.jp/suido/page/0000162694.html [as of August 2015].
viii. Installation of variable air volume system
The variable air volume (VAV) system changes the volume of airflow at a constant
temperature (Figure 2-50). Compared with the constant air volume system, the VAV system
consumes less energy for fans.
Figure 2-50. The Variable Air Volume (VAV) System
Source: ‘Variable Air Volume (VAV) Air Handling System: What Makes VAV Box Performance Better’, Johnson Controls Inc.
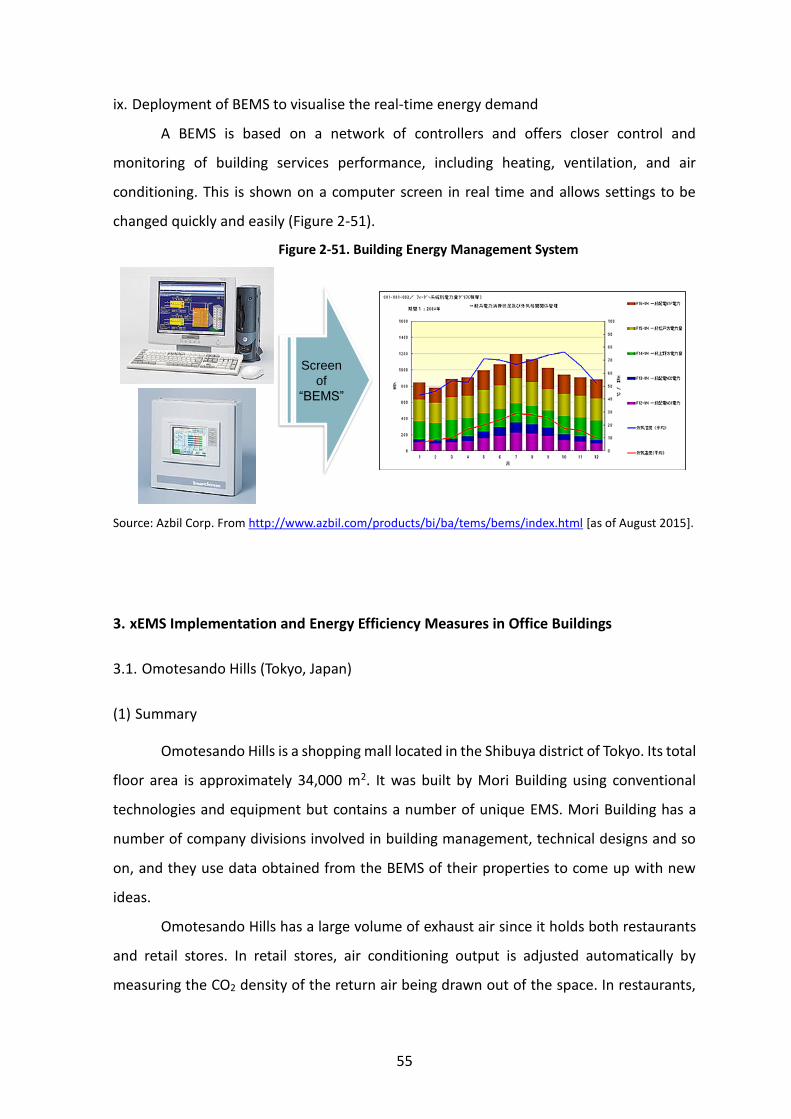
55
ix. Deployment of BEMS to visualise the real-time energy demand
A BEMS is based on a network of controllers and offers closer control and
monitoring of building services performance, including heating, ventilation, and air
conditioning. This is shown on a computer screen in real time and allows settings to be
changed quickly and easily (Figure 2-51).
Figure 2-51. Building Energy Management System
Source: Azbil Corp. From http://www.azbil.com/products/bi/ba/tems/bems/index.html [as of August 2015].
3. xEMS Implementation and Energy Efficiency Measures in Office Buildings
3.1. Omotesando Hills (Tokyo, Japan)
(1) Summary
Omotesando Hills is a shopping mall located in the Shibuya district of Tokyo. Its total
floor area is approximately 34,000 m2. It was built by Mori Building using conventional
technologies and equipment but contains a number of unique EMS. Mori Building has a
number of company divisions involved in building management, technical designs and so
on, and they use data obtained from the BEMS of their properties to come up with new
ideas.
Omotesando Hills has a large volume of exhaust air since it holds both restaurants
and retail stores. In retail stores, air conditioning output is adjusted automatically by
measuring the CO2 density of the return air being drawn out of the space. In restaurants,
Screen
of
“BEMS”
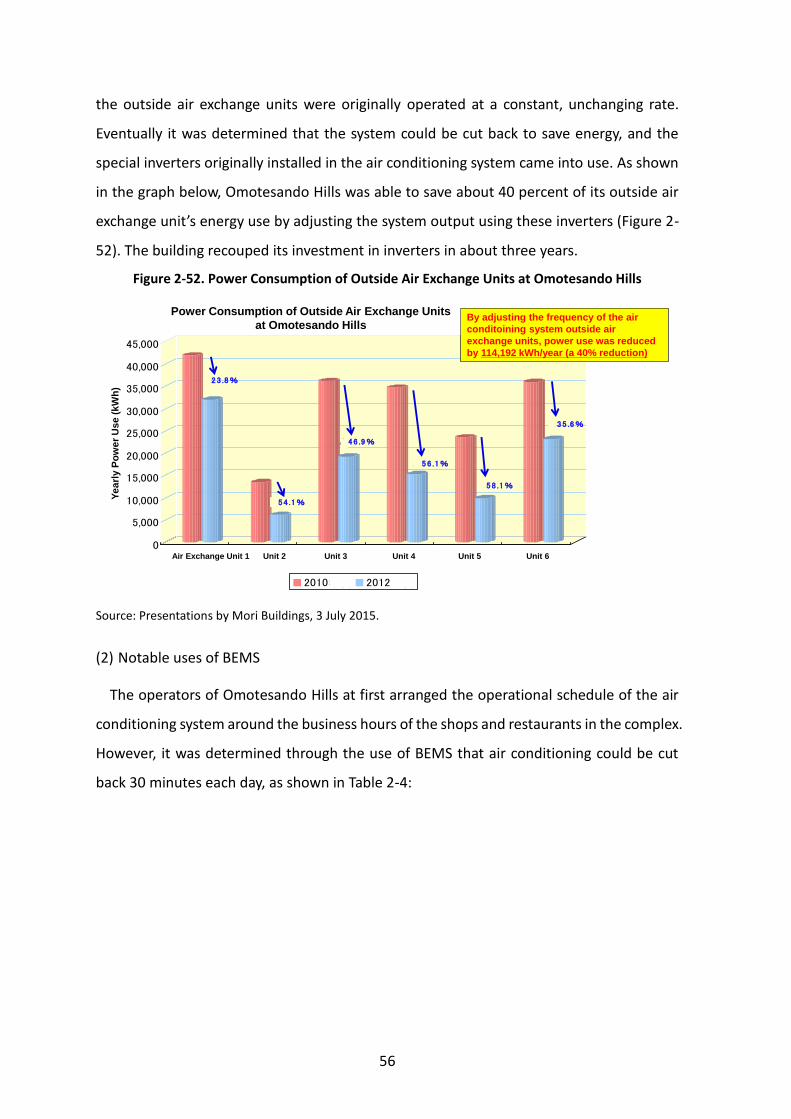
56
the outside air exchange units were originally operated at a constant, unchanging rate.
Eventually it was determined that the system could be cut back to save energy, and the
special inverters originally installed in the air conditioning system came into use. As shown
in the graph below, Omotesando Hills was able to save about 40 percent of its outside air
exchange unit’s energy use by adjusting the system output using these inverters (Figure 2-
52). The building recouped its investment in inverters in about three years.
Figure 2-52. Power Consumption of Outside Air Exchange Units at Omotesando Hills
Source: Presentations by Mori Buildings, 3 July 2015.
(2) Notable uses of BEMS
The operators of Omotesando Hills at first arranged the operational schedule of the air
conditioning system around the business hours of the shops and restaurants in the complex.
However, it was determined through the use of BEMS that air conditioning could be cut
back 30 minutes each day, as shown in Table 2-4:
0
5,000
10,000
15,000
20,000
25,000
30,000
35,000
40,000
45,000
OAC-3-1 OAC-3-2 OAC-2-2 OAC-1-2 OAC-B1-1 OAC-B2-1
外調機 周波数調整による電力使用量
2010年度 2012年度
▲23 .8%
▲54 .1%
▲46 .9%
▲56 .1%
▲58 .1%
▲35 .6%
By adjusting the frequency of the air
conditoining system outside air
exchange units, power use was reduced
by 114,192 kWh/year (a 40% reduction)
Power Consumption of Outside Air Exchange Units
at Omotesando Hills
Air Exchange Unit 1 Unit 2 Unit 3 Unit 4 Unit 5 Unit 6
Ye
arl
y P
ow
er
Use
(kW
h)
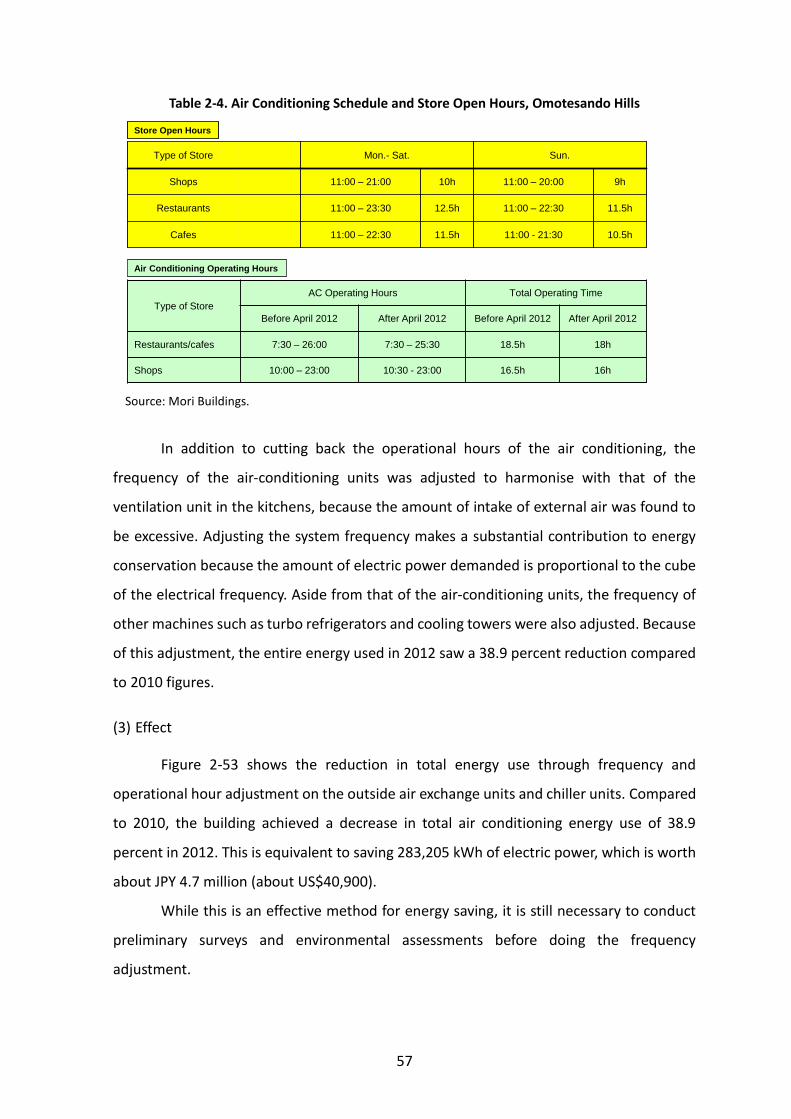
57
Table 2-4. Air Conditioning Schedule and Store Open Hours, Omotesando Hills
Source: Mori Buildings.
In addition to cutting back the operational hours of the air conditioning, the
frequency of the air-conditioning units was adjusted to harmonise with that of the
ventilation unit in the kitchens, because the amount of intake of external air was found to
be excessive. Adjusting the system frequency makes a substantial contribution to energy
conservation because the amount of electric power demanded is proportional to the cube
of the electrical frequency. Aside from that of the air-conditioning units, the frequency of
other machines such as turbo refrigerators and cooling towers were also adjusted. Because
of this adjustment, the entire energy used in 2012 saw a 38.9 percent reduction compared
to 2010 figures.
(3) Effect
Figure 2-53 shows the reduction in total energy use through frequency and
operational hour adjustment on the outside air exchange units and chiller units. Compared
to 2010, the building achieved a decrease in total air conditioning energy use of 38.9
percent in 2012. This is equivalent to saving 283,205 kWh of electric power, which is worth
about JPY 4.7 million (about US$40,900).
While this is an effective method for energy saving, it is still necessary to conduct
preliminary surveys and environmental assessments before doing the frequency
adjustment.
10.5h11:00 - 21:3011.5h11:00 – 22:30Cafes
11.5h11:00 – 22:3012.5h11:00 – 23:30Restaurants
9h11:00 – 20:0010h11:00 – 21:00Shops
Sun.Mon.- Sat.Type of Store
Store Open Hours
Air Conditioning Operating Hours
Type of Store
AC Operating Hours Total Operating Time
Before April 2012 After April 2012 Before April 2012 After April 2012
Restaurants/cafes 7:30 – 26:00 7:30 – 25:30 18.5h 18h
Shops 10:00 – 23:00 10:30 - 23:00 16.5h 16h
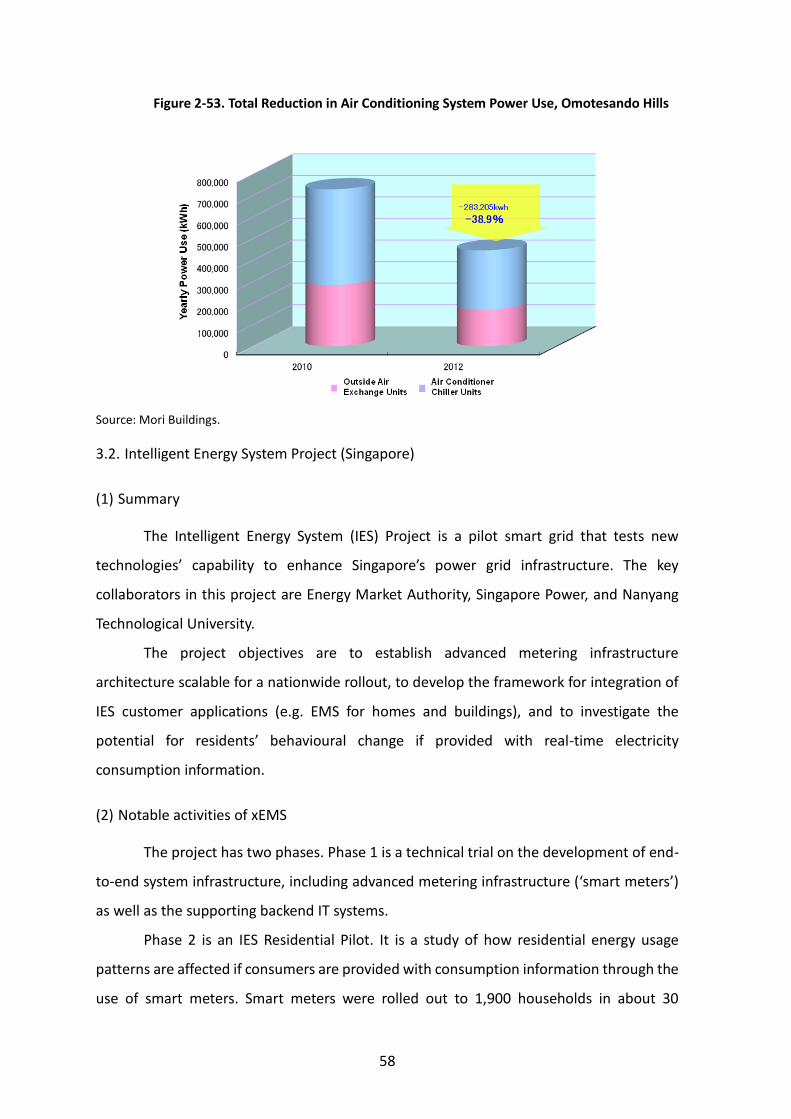
58
Figure 2-53. Total Reduction in Air Conditioning System Power Use, Omotesando Hills
Source: Mori Buildings.
3.2. Intelligent Energy System Project (Singapore)
(1) Summary
The Intelligent Energy System (IES) Project is a pilot smart grid that tests new
technologies’ capability to enhance Singapore’s power grid infrastructure. The key
collaborators in this project are Energy Market Authority, Singapore Power, and Nanyang
Technological University.
The project objectives are to establish advanced metering infrastructure
architecture scalable for a nationwide rollout, to develop the framework for integration of
IES customer applications (e.g. EMS for homes and buildings), and to investigate the
potential for residents’ behavioural change if provided with real-time electricity
consumption information.
(2) Notable activities of xEMS
The project has two phases. Phase 1 is a technical trial on the development of end-
to-end system infrastructure, including advanced metering infrastructure (‘smart meters’)
as well as the supporting backend IT systems.
Phase 2 is an IES Residential Pilot. It is a study of how residential energy usage
patterns are affected if consumers are provided with consumption information through the
use of smart meters. Smart meters were rolled out to 1,900 households in about 30
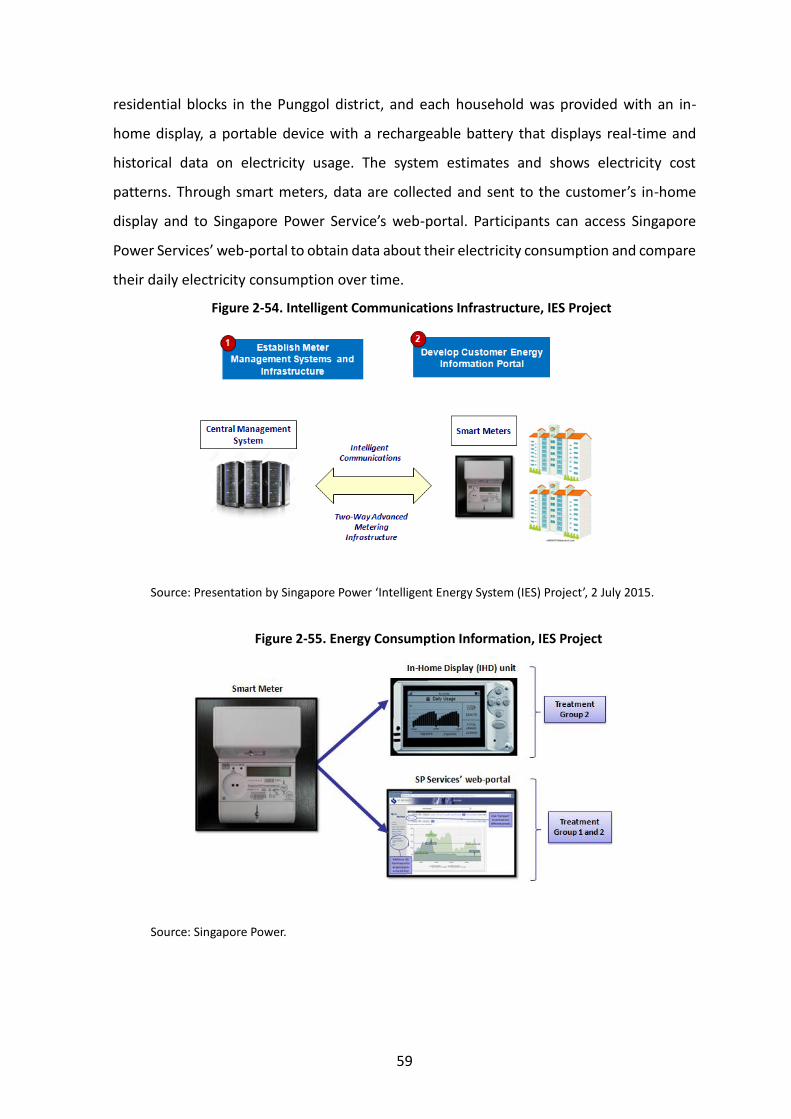
59
residential blocks in the Punggol district, and each household was provided with an in-
home display, a portable device with a rechargeable battery that displays real-time and
historical data on electricity usage. The system estimates and shows electricity cost
patterns. Through smart meters, data are collected and sent to the customer’s in-home
display and to Singapore Power Service’s web-portal. Participants can access Singapore
Power Services’ web-portal to obtain data about their electricity consumption and compare
their daily electricity consumption over time.
Figure 2-54. Intelligent Communications Infrastructure, IES Project
Source: Presentation by Singapore Power ‘Intelligent Energy System (IES) Project’, 2 July 2015.
Figure 2-55. Energy Consumption Information, IES Project
Source: Singapore Power.
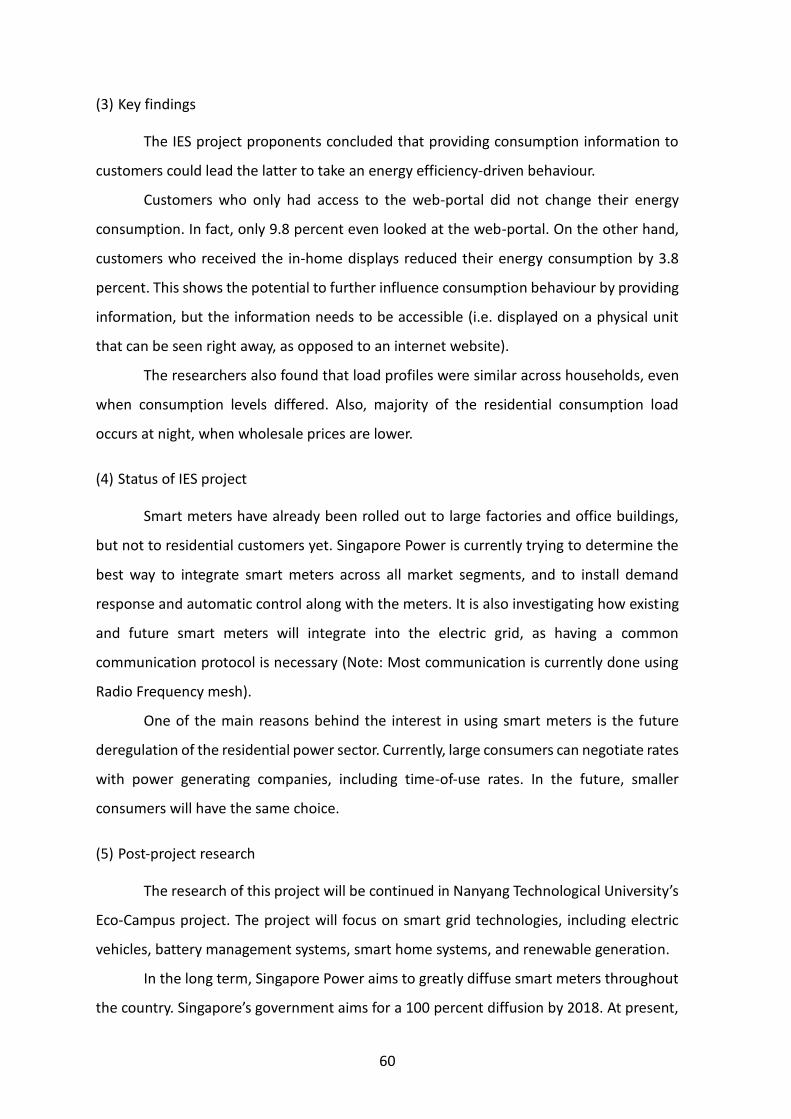
60
(3) Key findings
The IES project proponents concluded that providing consumption information to
customers could lead the latter to take an energy efficiency-driven behaviour.
Customers who only had access to the web-portal did not change their energy
consumption. In fact, only 9.8 percent even looked at the web-portal. On the other hand,
customers who received the in-home displays reduced their energy consumption by 3.8
percent. This shows the potential to further influence consumption behaviour by providing
information, but the information needs to be accessible (i.e. displayed on a physical unit
that can be seen right away, as opposed to an internet website).
The researchers also found that load profiles were similar across households, even
when consumption levels differed. Also, majority of the residential consumption load
occurs at night, when wholesale prices are lower.
(4) Status of IES project
Smart meters have already been rolled out to large factories and office buildings,
but not to residential customers yet. Singapore Power is currently trying to determine the
best way to integrate smart meters across all market segments, and to install demand
response and automatic control along with the meters. It is also investigating how existing
and future smart meters will integrate into the electric grid, as having a common
communication protocol is necessary (Note: Most communication is currently done using
Radio Frequency mesh).
One of the main reasons behind the interest in using smart meters is the future
deregulation of the residential power sector. Currently, large consumers can negotiate rates
with power generating companies, including time-of-use rates. In the future, smaller
consumers will have the same choice.
(5) Post-project research
The research of this project will be continued in Nanyang Technological University’s
Eco-Campus project. The project will focus on smart grid technologies, including electric
vehicles, battery management systems, smart home systems, and renewable generation.
In the long term, Singapore Power aims to greatly diffuse smart meters throughout
the country. Singapore’s government aims for a 100 percent diffusion by 2018. At present,
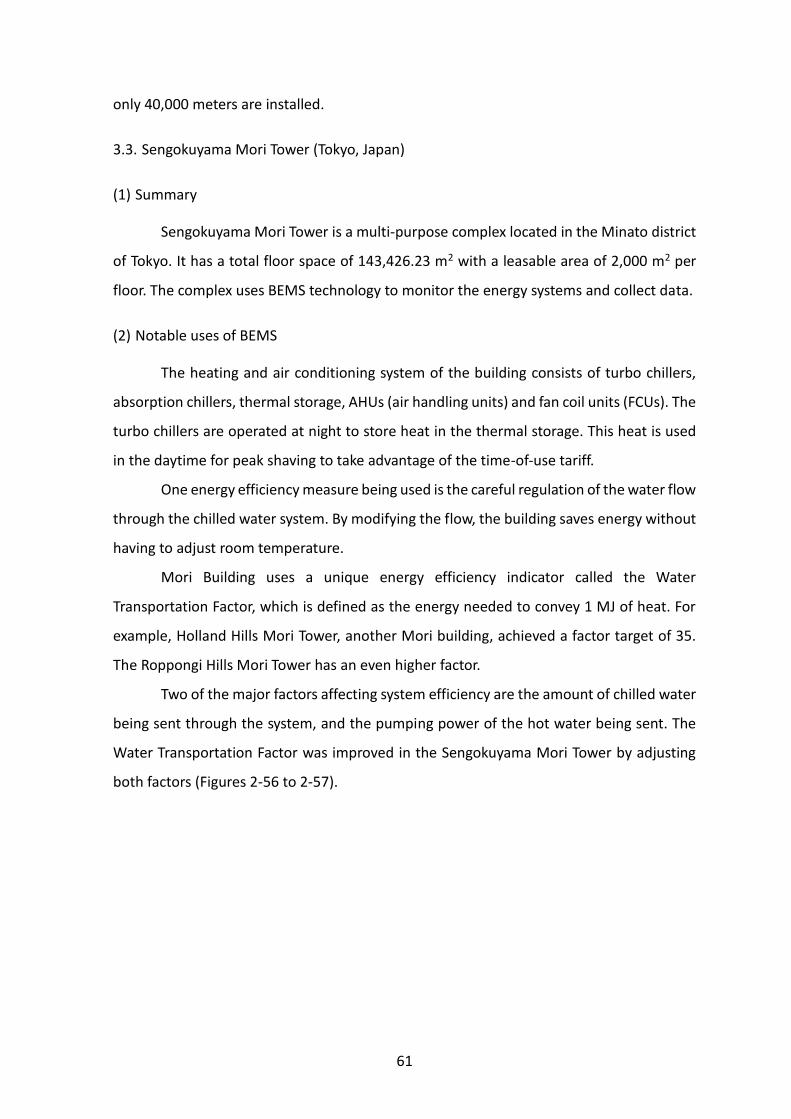
61
only 40,000 meters are installed.
3.3. Sengokuyama Mori Tower (Tokyo, Japan)
(1) Summary
Sengokuyama Mori Tower is a multi-purpose complex located in the Minato district
of Tokyo. It has a total floor space of 143,426.23 m2 with a leasable area of 2,000 m2 per
floor. The complex uses BEMS technology to monitor the energy systems and collect data.
(2) Notable uses of BEMS
The heating and air conditioning system of the building consists of turbo chillers,
absorption chillers, thermal storage, AHUs (air handling units) and fan coil units (FCUs). The
turbo chillers are operated at night to store heat in the thermal storage. This heat is used
in the daytime for peak shaving to take advantage of the time-of-use tariff.
One energy efficiency measure being used is the careful regulation of the water flow
through the chilled water system. By modifying the flow, the building saves energy without
having to adjust room temperature.
Mori Building uses a unique energy efficiency indicator called the Water
Transportation Factor, which is defined as the energy needed to convey 1 MJ of heat. For
example, Holland Hills Mori Tower, another Mori building, achieved a factor target of 35.
The Roppongi Hills Mori Tower has an even higher factor.
Two of the major factors affecting system efficiency are the amount of chilled water
being sent through the system, and the pumping power of the hot water being sent. The
Water Transportation Factor was improved in the Sengokuyama Mori Tower by adjusting
both factors (Figures 2-56 to 2-57).
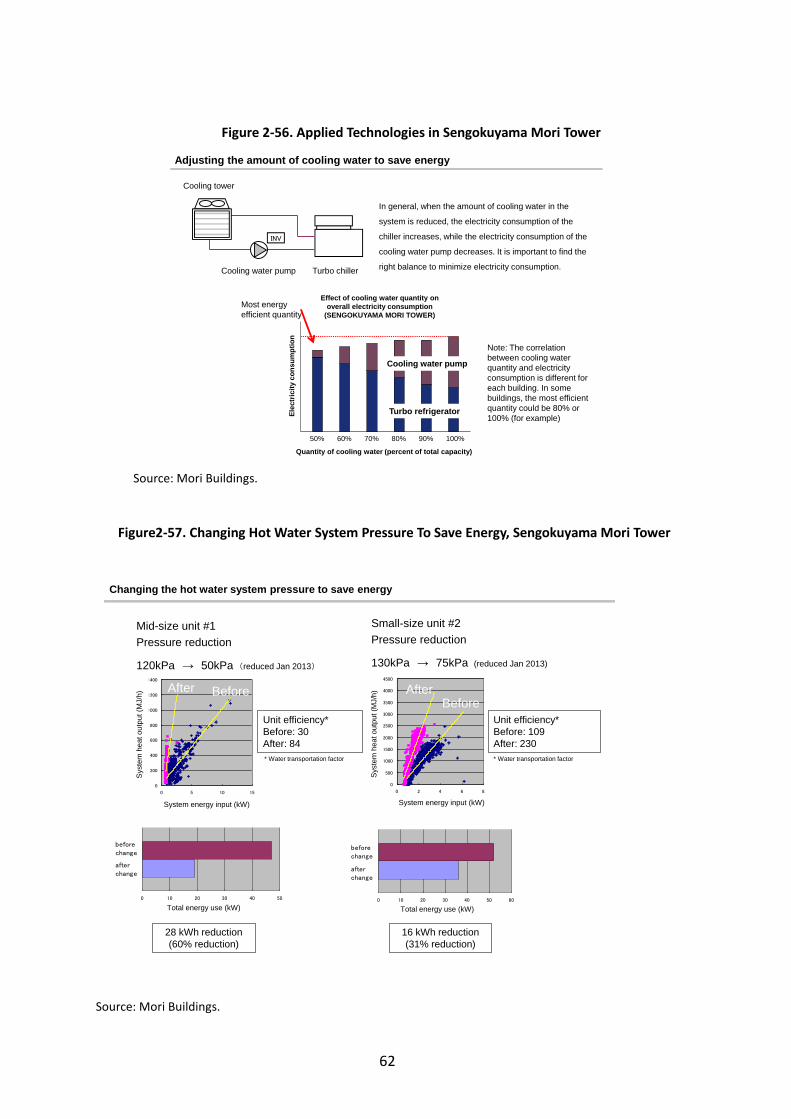
62
Figure 2-56. Applied Technologies in Sengokuyama Mori Tower
Source: Mori Buildings.
Figure2-57. Changing Hot Water System Pressure To Save Energy, Sengokuyama Mori Tower
Source: Mori Buildings.
INV
Cooling tower
Cooling water pump Turbo chiller
50% 60% 70% 80% 90% 100%
In general, when the amount of cooling water in the
system is reduced, the electricity consumption of the
chiller increases, while the electricity consumption of the
cooling water pump decreases. It is important to find the
right balance to minimize electricity consumption.
Adjusting the amount of cooling water to save energy
Effect of cooling water quantity on
overall electricity consumption
(SENGOKUYAMA MORI TOWER)
Quantity of cooling water (percent of total capacity)
Ele
ctr
icit
y c
on
su
mp
tio
n
Cooling water pump
Turbo refrigerator
Most energy
efficient quantity
Note: The correlation
between cooling water
quantity and electricity
consumption is different for
each building. In some
buildings, the most efficient
quantity could be 80% or
100% (for example)
C-HP-B401A・B WFT
0
500
1000
1500
2000
2500
3000
3500
4000
4500
0 2 4 6 8
搬送電力(kw)
搬送
熱量
(MJ/h
)
C-HP-B401A・B WFT 2012年12月 C-HP-B401A・B WFT 2013年2月
線形 (C-HP-B401A・B WFT 2012年12月) 線形 (C-HP-B401A・B WFT 2013年2月)
C-HP-B402A・B WTF
0
200
400
600
800
1000
1200
1400
0 5 10 15
搬送電力(kw)
搬送
熱量
(MJ/h
)
C-HP-B402A・B WFT 2012年12月 C-HP-B402A・B WFT 2013年2月
線形 (C-HP-B402A・B WFT 2012年12月) 線形 (C-HP-B402A・B WFT 2013年2月)
Unit efficiency*
Before: 30
After: 84
Small-size unit #2
Pressure reduction
130kPa → 75kPa (reduced Jan 2013)
Mid-size unit #1
Pressure reduction
120kPa → 50kPa (reduced Jan 2013)
Unit efficiency*
Before: 109
After: 230
Changing the hot water system pressure to save energy
Syste
m h
ea
t o
utp
ut (M
J/h
)
System energy input (kW)
* Water transportation factor
Syste
m h
eat outp
ut (M
J/h
)
System energy input (kW)
* Water transportation factor
C-HP-B402A・B 電力量比較 (月平均日報)
0 10 20 30 40 50
電力量(kwh)
2012年12月
2013年2月
28 kWh reduction
(60% reduction)
beforechange
after change
Total energy use (kW)
C-HP-B401A・B 電力量比較 (月平均日報)
0 10 20 30 40 50 60
電力量(kwh)
2012年12月
2013年2月
16 kWh reduction
(31% reduction)
after change
beforechange
Total energy use (kW)
BeforeAfter
BeforeAfter
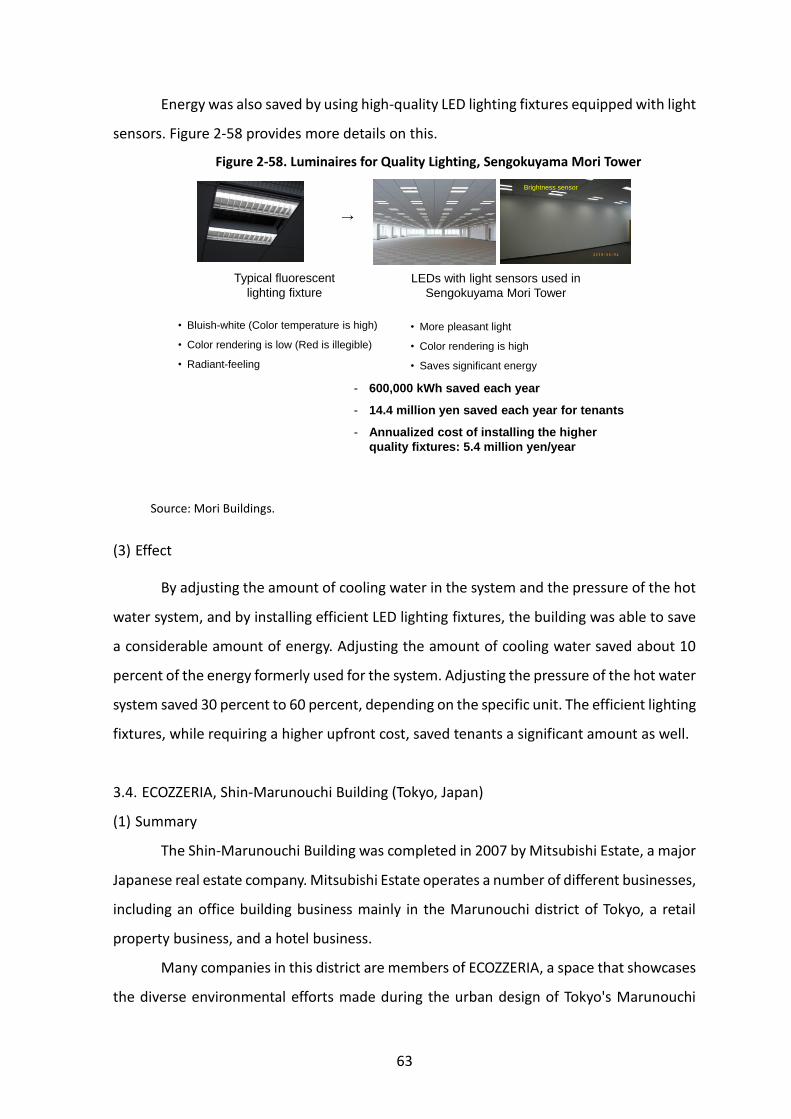
63
Energy was also saved by using high-quality LED lighting fixtures equipped with light
sensors. Figure 2-58 provides more details on this.
Figure 2-58. Luminaires for Quality Lighting, Sengokuyama Mori Tower
Source: Mori Buildings.
(3) Effect
By adjusting the amount of cooling water in the system and the pressure of the hot
water system, and by installing efficient LED lighting fixtures, the building was able to save
a considerable amount of energy. Adjusting the amount of cooling water saved about 10
percent of the energy formerly used for the system. Adjusting the pressure of the hot water
system saved 30 percent to 60 percent, depending on the specific unit. The efficient lighting
fixtures, while requiring a higher upfront cost, saved tenants a significant amount as well.
3.4. ECOZZERIA, Shin-Marunouchi Building (Tokyo, Japan)
(1) Summary
The Shin-Marunouchi Building was completed in 2007 by Mitsubishi Estate, a major
Japanese real estate company. Mitsubishi Estate operates a number of different businesses,
including an office building business mainly in the Marunouchi district of Tokyo, a retail
property business, and a hotel business.
Many companies in this district are members of ECOZZERIA, a space that showcases
the diverse environmental efforts made during the urban design of Tokyo's Marunouchi
Typical fluorescent
lighting fixture
• Bluish-white (Color temperature is high)
• Color rendering is low (Red is illegible)
• Radiant-feeling
→
Brightness sensor
- 600,000 kWh saved each year
- 14.4 million yen saved each year for tenants
- Annualized cost of installing the higher
quality fixtures: 5.4 million yen/year
LEDs with light sensors used in
Sengokuyama Mori Tower
• More pleasant light
• Color rendering is high
• Saves significant energy
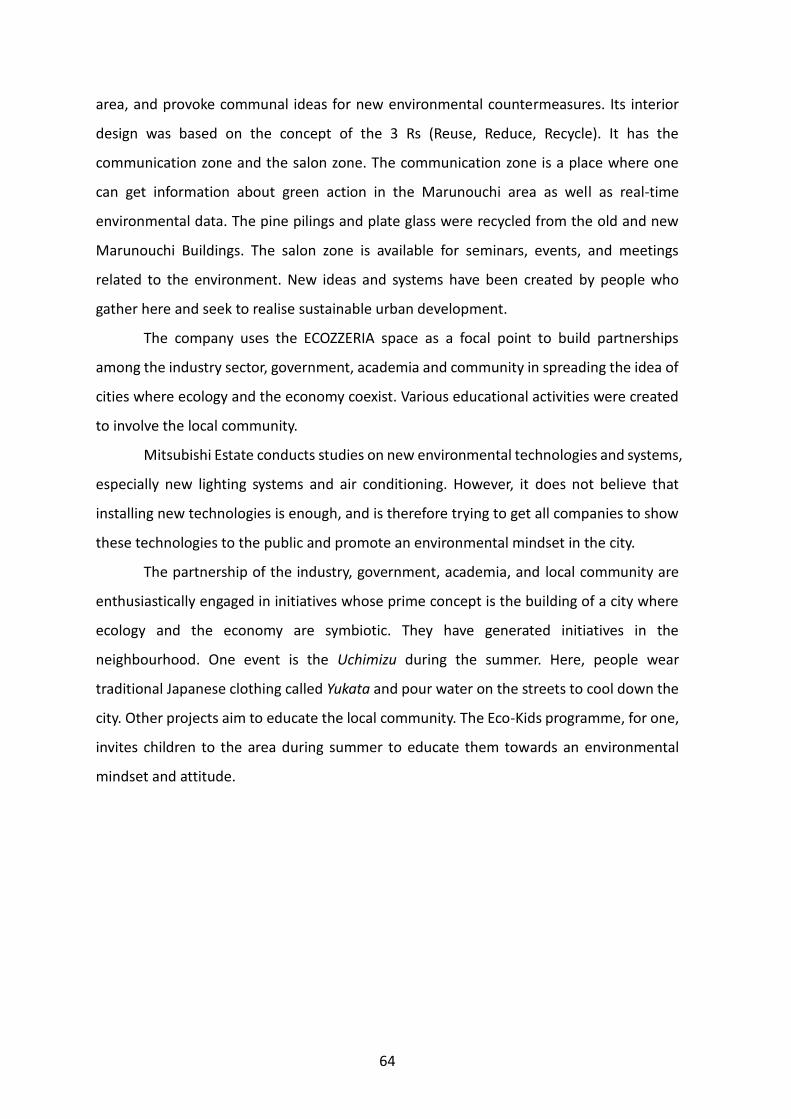
64
area, and provoke communal ideas for new environmental countermeasures. Its interior
design was based on the concept of the 3 Rs (Reuse, Reduce, Recycle). It has the
communication zone and the salon zone. The communication zone is a place where one
can get information about green action in the Marunouchi area as well as real-time
environmental data. The pine pilings and plate glass were recycled from the old and new
Marunouchi Buildings. The salon zone is available for seminars, events, and meetings
related to the environment. New ideas and systems have been created by people who
gather here and seek to realise sustainable urban development.
The company uses the ECOZZERIA space as a focal point to build partnerships
among the industry sector, government, academia and community in spreading the idea of
cities where ecology and the economy coexist. Various educational activities were created
to involve the local community.
Mitsubishi Estate conducts studies on new environmental technologies and systems,
especially new lighting systems and air conditioning. However, it does not believe that
installing new technologies is enough, and is therefore trying to get all companies to show
these technologies to the public and promote an environmental mindset in the city.
The partnership of the industry, government, academia, and local community are
enthusiastically engaged in initiatives whose prime concept is the building of a city where
ecology and the economy are symbiotic. They have generated initiatives in the
neighbourhood. One event is the Uchimizu during the summer. Here, people wear
traditional Japanese clothing called Yukata and pour water on the streets to cool down the
city. Other projects aim to educate the local community. The Eco-Kids programme, for one,
invites children to the area during summer to educate them towards an environmental
mindset and attitude.
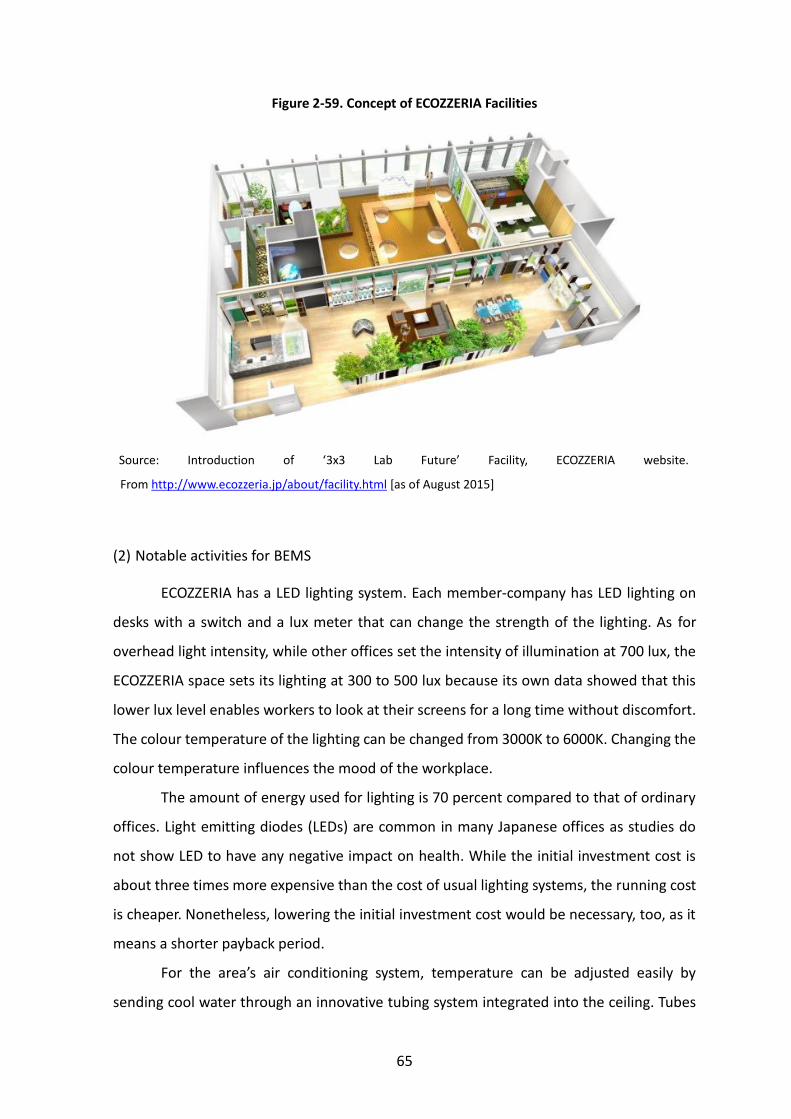
65
Figure 2-59. Concept of ECOZZERIA Facilities
Source: Introduction of ‘3x3 Lab Future’ Facility, ECOZZERIA website.
From http://www.ecozzeria.jp/about/facility.html [as of August 2015]
(2) Notable activities for BEMS
ECOZZERIA has a LED lighting system. Each member-company has LED lighting on
desks with a switch and a lux meter that can change the strength of the lighting. As for
overhead light intensity, while other offices set the intensity of illumination at 700 lux, the
ECOZZERIA space sets its lighting at 300 to 500 lux because its own data showed that this
lower lux level enables workers to look at their screens for a long time without discomfort.
The colour temperature of the lighting can be changed from 3000K to 6000K. Changing the
colour temperature influences the mood of the workplace.
The amount of energy used for lighting is 70 percent compared to that of ordinary
offices. Light emitting diodes (LEDs) are common in many Japanese offices as studies do
not show LED to have any negative impact on health. While the initial investment cost is
about three times more expensive than the cost of usual lighting systems, the running cost
is cheaper. Nonetheless, lowering the initial investment cost would be necessary, too, as it
means a shorter payback period.
For the area’s air conditioning system, temperature can be adjusted easily by
sending cool water through an innovative tubing system integrated into the ceiling. Tubes
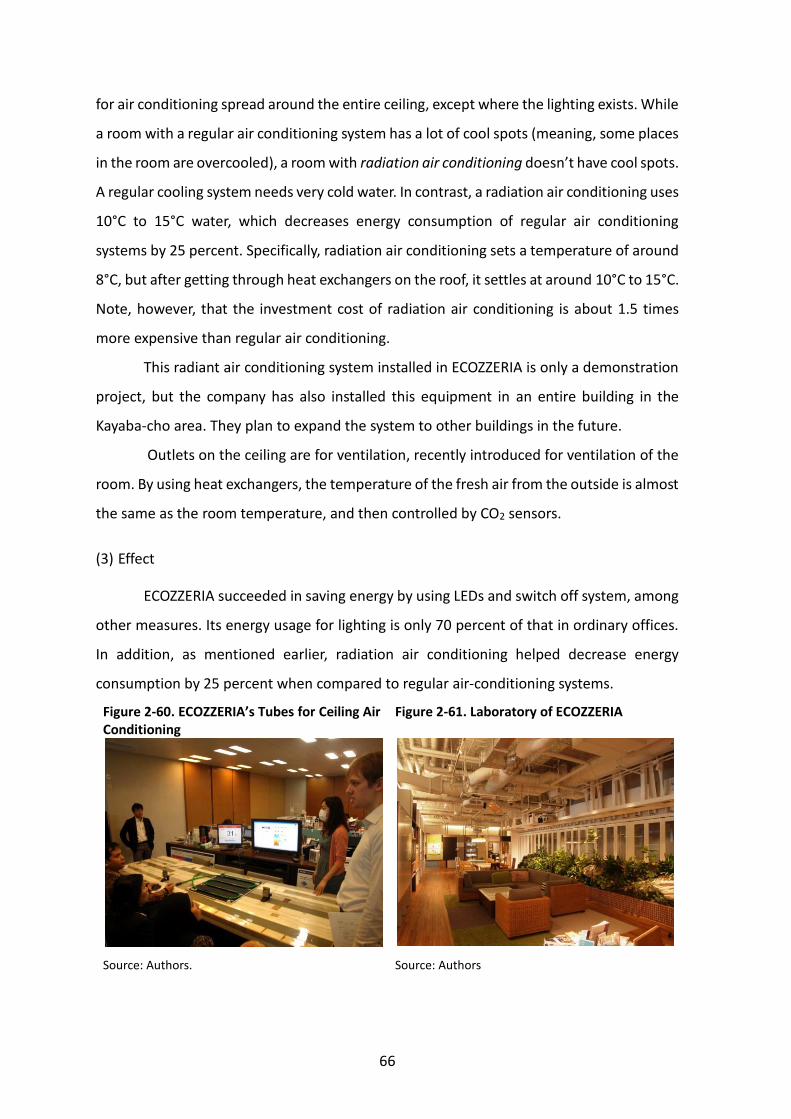
66
for air conditioning spread around the entire ceiling, except where the lighting exists. While
a room with a regular air conditioning system has a lot of cool spots (meaning, some places
in the room are overcooled), a room with radiation air conditioning doesn’t have cool spots.
A regular cooling system needs very cold water. In contrast, a radiation air conditioning uses
10°C to 15°C water, which decreases energy consumption of regular air conditioning
systems by 25 percent. Specifically, radiation air conditioning sets a temperature of around
8°C, but after getting through heat exchangers on the roof, it settles at around 10°C to 15°C.
Note, however, that the investment cost of radiation air conditioning is about 1.5 times
more expensive than regular air conditioning.
This radiant air conditioning system installed in ECOZZERIA is only a demonstration
project, but the company has also installed this equipment in an entire building in the
Kayaba-cho area. They plan to expand the system to other buildings in the future.
Outlets on the ceiling are for ventilation, recently introduced for ventilation of the
room. By using heat exchangers, the temperature of the fresh air from the outside is almost
the same as the room temperature, and then controlled by CO2 sensors.
(3) Effect
ECOZZERIA succeeded in saving energy by using LEDs and switch off system, among
other measures. Its energy usage for lighting is only 70 percent of that in ordinary offices.
In addition, as mentioned earlier, radiation air conditioning helped decrease energy
consumption by 25 percent when compared to regular air-conditioning systems.
Figure 2-60. ECOZZERIA’s Tubes for Ceiling Air Conditioning
Figure 2-61. Laboratory of ECOZZERIA
Source: Authors. Source: Authors
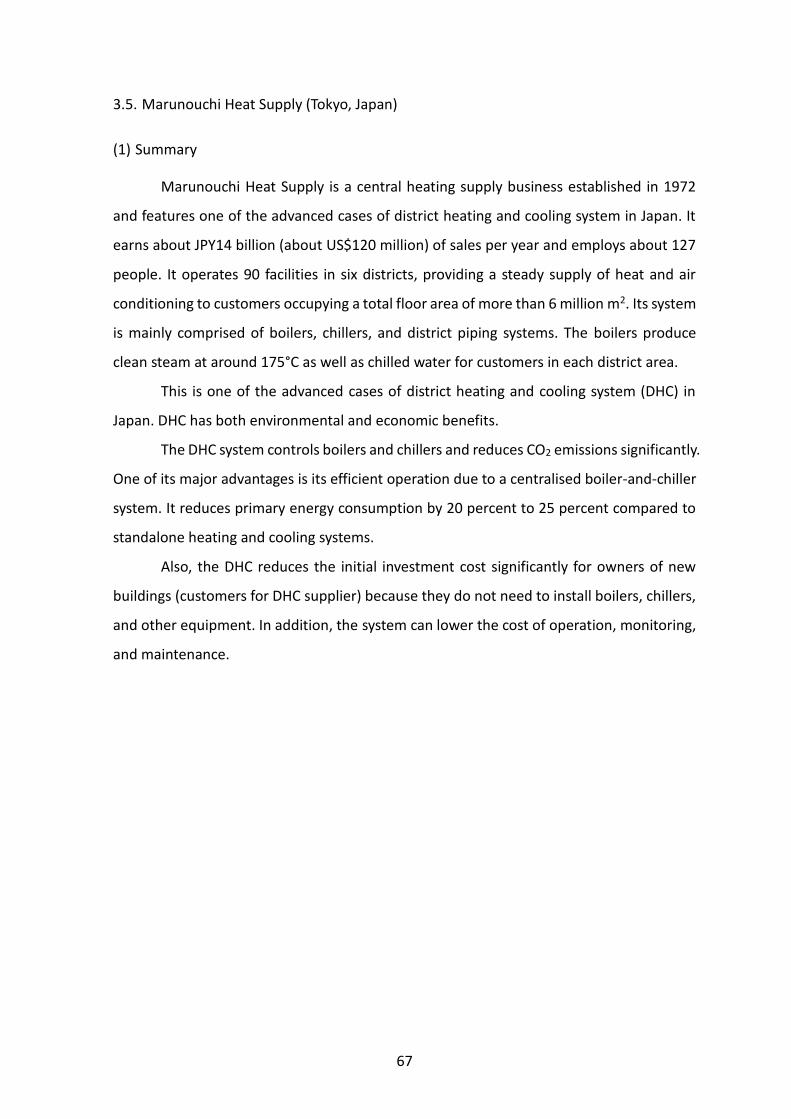
67
3.5. Marunouchi Heat Supply (Tokyo, Japan)
(1) Summary
Marunouchi Heat Supply is a central heating supply business established in 1972
and features one of the advanced cases of district heating and cooling system in Japan. It
earns about JPY14 billion (about US$120 million) of sales per year and employs about 127
people. It operates 90 facilities in six districts, providing a steady supply of heat and air
conditioning to customers occupying a total floor area of more than 6 million m2. Its system
is mainly comprised of boilers, chillers, and district piping systems. The boilers produce
clean steam at around 175°C as well as chilled water for customers in each district area.
This is one of the advanced cases of district heating and cooling system (DHC) in
Japan. DHC has both environmental and economic benefits.
The DHC system controls boilers and chillers and reduces CO2 emissions significantly.
One of its major advantages is its efficient operation due to a centralised boiler-and-chiller
system. It reduces primary energy consumption by 20 percent to 25 percent compared to
standalone heating and cooling systems.
Also, the DHC reduces the initial investment cost significantly for owners of new
buildings (customers for DHC supplier) because they do not need to install boilers, chillers,
and other equipment. In addition, the system can lower the cost of operation, monitoring,
and maintenance.
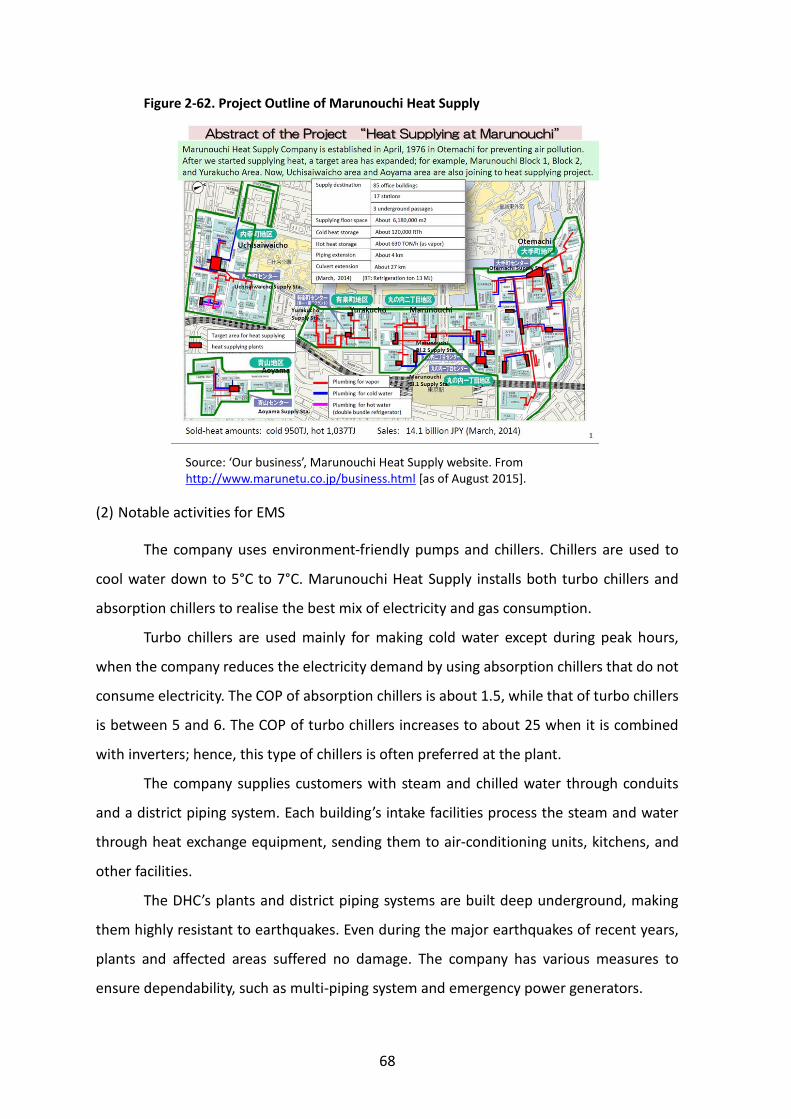
68
Figure 2-62. Project Outline of Marunouchi Heat Supply
Source: ‘Our business’, Marunouchi Heat Supply website. From http://www.marunetu.co.jp/business.html [as of August 2015].
(2) Notable activities for EMS
The company uses environment-friendly pumps and chillers. Chillers are used to
cool water down to 5°C to 7°C. Marunouchi Heat Supply installs both turbo chillers and
absorption chillers to realise the best mix of electricity and gas consumption.
Turbo chillers are used mainly for making cold water except during peak hours,
when the company reduces the electricity demand by using absorption chillers that do not
consume electricity. The COP of absorption chillers is about 1.5, while that of turbo chillers
is between 5 and 6. The COP of turbo chillers increases to about 25 when it is combined
with inverters; hence, this type of chillers is often preferred at the plant.
The company supplies customers with steam and chilled water through conduits
and a district piping system. Each building’s intake facilities process the steam and water
through heat exchange equipment, sending them to air-conditioning units, kitchens, and
other facilities.
The DHC’s plants and district piping systems are built deep underground, making
them highly resistant to earthquakes. Even during the major earthquakes of recent years,
plants and affected areas suffered no damage. The company has various measures to
ensure dependability, such as multi-piping system and emergency power generators.
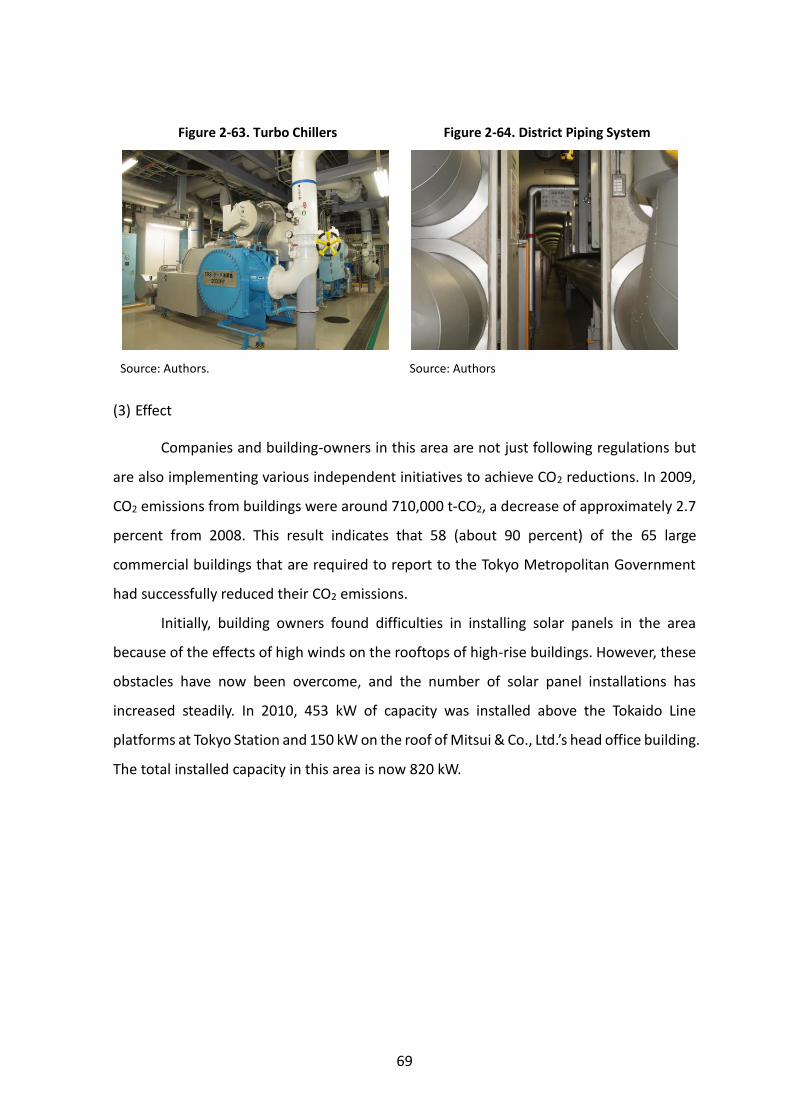
69
Figure 2-63. Turbo Chillers Figure 2-64. District Piping System
Source: Authors. Source: Authors
(3) Effect
Companies and building-owners in this area are not just following regulations but
are also implementing various independent initiatives to achieve CO2 reductions. In 2009,
CO2 emissions from buildings were around 710,000 t-CO2, a decrease of approximately 2.7
percent from 2008. This result indicates that 58 (about 90 percent) of the 65 large
commercial buildings that are required to report to the Tokyo Metropolitan Government
had successfully reduced their CO2 emissions.
Initially, building owners found difficulties in installing solar panels in the area
because of the effects of high winds on the rooftops of high-rise buildings. However, these
obstacles have now been overcome, and the number of solar panel installations has
increased steadily. In 2010, 453 kW of capacity was installed above the Tokaido Line
platforms at Tokyo Station and 150 kW on the roof of Mitsui & Co., Ltd.’s head office building.
The total installed capacity in this area is now 820 kW.
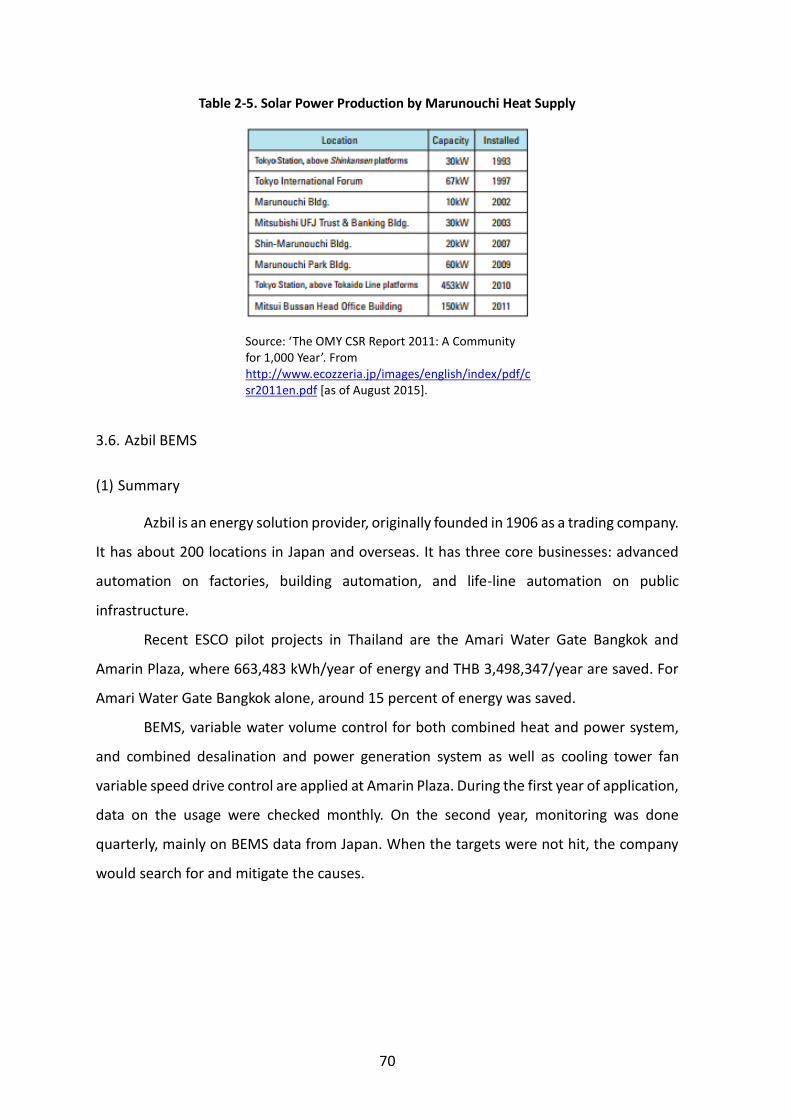
70
Table 2-5. Solar Power Production by Marunouchi Heat Supply
Source: ‘The OMY CSR Report 2011: A Community for 1,000 Year’. From http://www.ecozzeria.jp/images/english/index/pdf/csr2011en.pdf [as of August 2015].
3.6. Azbil BEMS
(1) Summary
Azbil is an energy solution provider, originally founded in 1906 as a trading company.
It has about 200 locations in Japan and overseas. It has three core businesses: advanced
automation on factories, building automation, and life-line automation on public
infrastructure.
Recent ESCO pilot projects in Thailand are the Amari Water Gate Bangkok and
Amarin Plaza, where 663,483 kWh/year of energy and THB 3,498,347/year are saved. For
Amari Water Gate Bangkok alone, around 15 percent of energy was saved.
BEMS, variable water volume control for both combined heat and power system,
and combined desalination and power generation system as well as cooling tower fan
variable speed drive control are applied at Amarin Plaza. During the first year of application,
data on the usage were checked monthly. On the second year, monitoring was done
quarterly, mainly on BEMS data from Japan. When the targets were not hit, the company
would search for and mitigate the causes.
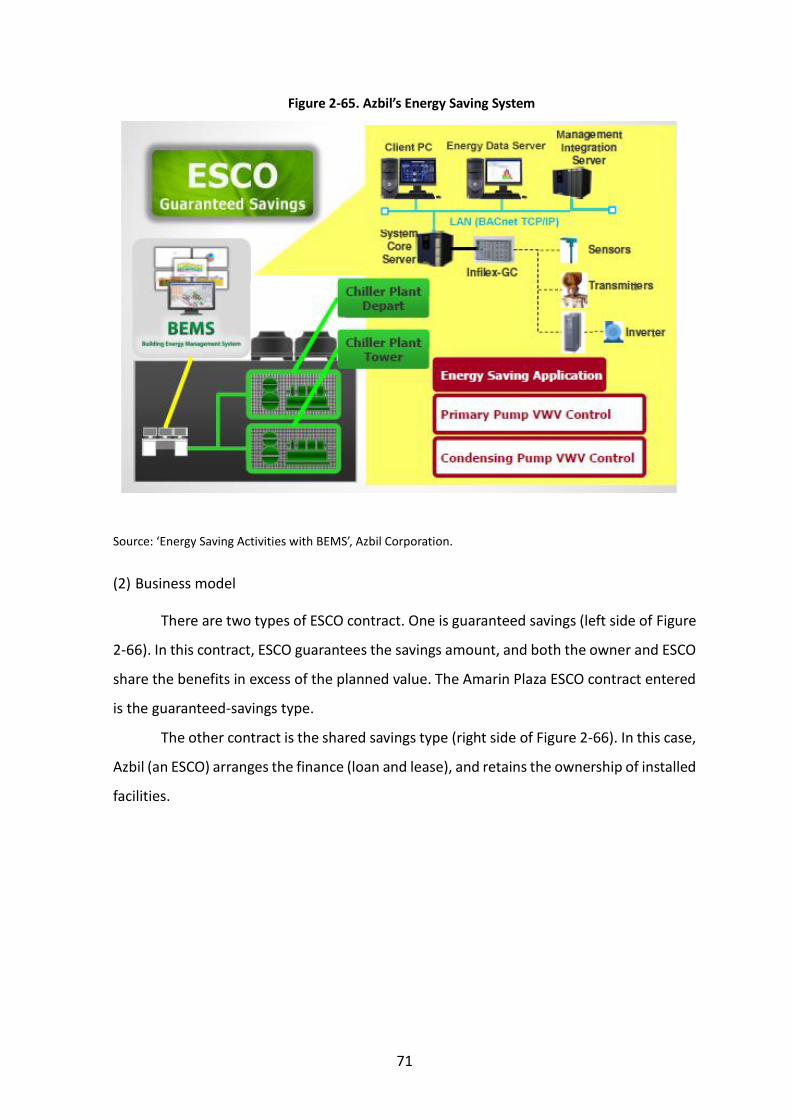
71
Figure 2-65. Azbil’s Energy Saving System
Source: ‘Energy Saving Activities with BEMS’, Azbil Corporation.
(2) Business model
There are two types of ESCO contract. One is guaranteed savings (left side of Figure
2-66). In this contract, ESCO guarantees the savings amount, and both the owner and ESCO
share the benefits in excess of the planned value. The Amarin Plaza ESCO contract entered
is the guaranteed-savings type.
The other contract is the shared savings type (right side of Figure 2-66). In this case,
Azbil (an ESCO) arranges the finance (loan and lease), and retains the ownership of installed
facilities.
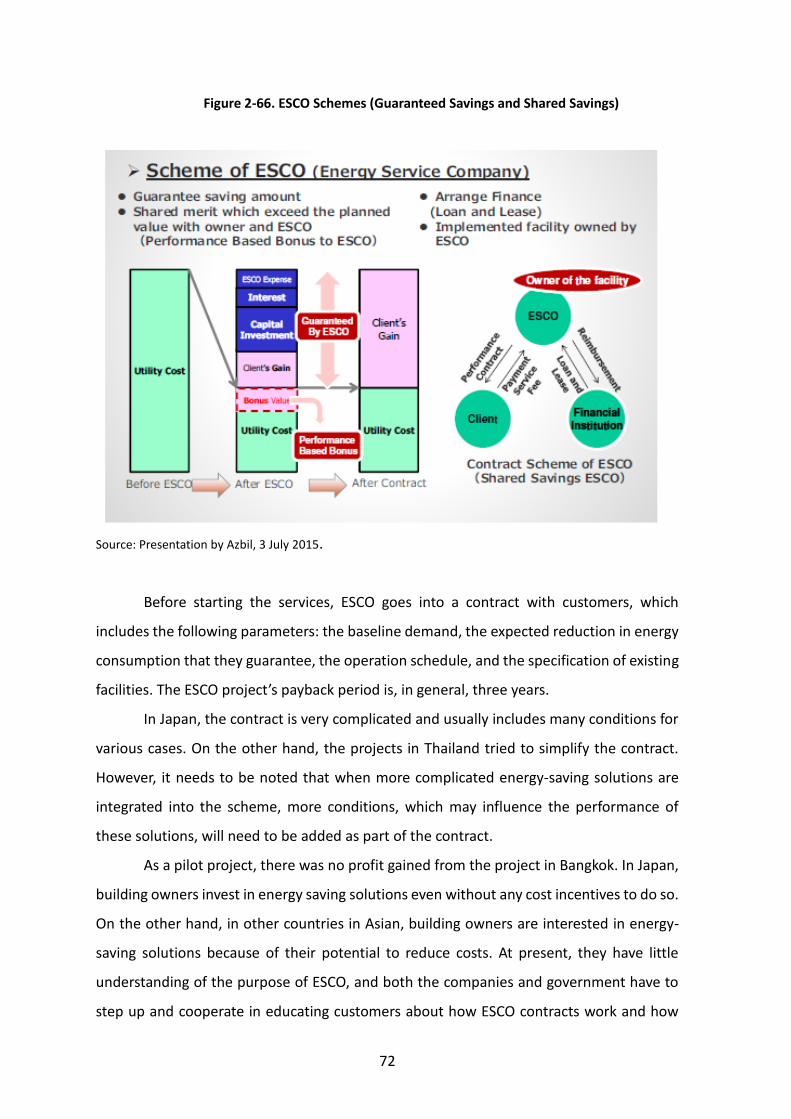
72
Figure 2-66. ESCO Schemes (Guaranteed Savings and Shared Savings)
Source: Presentation by Azbil, 3 July 2015.
Before starting the services, ESCO goes into a contract with customers, which
includes the following parameters: the baseline demand, the expected reduction in energy
consumption that they guarantee, the operation schedule, and the specification of existing
facilities. The ESCO project’s payback period is, in general, three years.
In Japan, the contract is very complicated and usually includes many conditions for
various cases. On the other hand, the projects in Thailand tried to simplify the contract.
However, it needs to be noted that when more complicated energy-saving solutions are
integrated into the scheme, more conditions, which may influence the performance of
these solutions, will need to be added as part of the contract.
As a pilot project, there was no profit gained from the project in Bangkok. In Japan,
building owners invest in energy saving solutions even without any cost incentives to do so.
On the other hand, in other countries in Asian, building owners are interested in energy-
saving solutions because of their potential to reduce costs. At present, they have little
understanding of the purpose of ESCO, and both the companies and government have to
step up and cooperate in educating customers about how ESCO contracts work and how
73
energy can be used more efficiently.
Nowadays, Asian countries consume more energy than ever before, with some
starting to import oil and gas to supplement their own production. As a business, ESCO is
still small, but it has the potential to be viable once such countries need to pay more for
energy. The ESCO business contributes not only to energy savings but to improving foreign
trade balance, too.
In the future, the ESCO business will be extended to renewable energy integration
as well and ESCO will not only provide energy service but also be a kind of energy service
provider.