Embed Size (px)
Citation preview
1
Overview of Electric Vehicle Market Issues in the U.S.
Jeff AlsonU.S. Environmental Protection Agency
EVE Informal Working Group Meeting #2
September 13, 2012
2
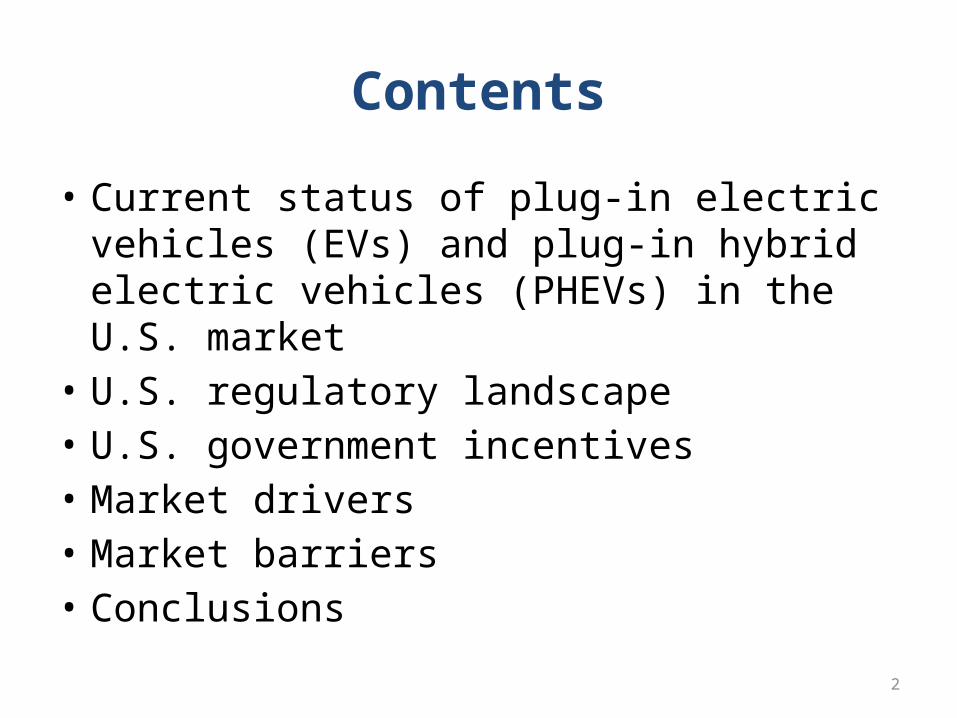
Contents
• Current status of plug-in electric vehicles (EVs) and plug-in hybrid electric vehicles (PHEVs) in the U.S. market
• U.S. regulatory landscape• U.S. government incentives• Market drivers• Market barriers• Conclusions

History of EVs in the U.S.• EVs held at least 30% of the market in 1900
– EVs disappeared as gasoline became more available and less expensive and gasoline vehicles improved in power, reliability, and cost.
• Small revival during energy crisis in 1970s• Another revival after initial CA ZEV mandate in early 1990s
– GM EV1– Toyota RAV4 EV

4
Current U.S. Market Status

5
EVs and PHEVs in U.S. Market
• Many new vehicle models entering market– 2011
• Two major introductions: Nissan Leaf EV and Chevrolet Volt PHEV• Also Tesla Roadster, BMW ActiveE EV and Smart fortwo EV
– 2012• Mitsubishi i EV, Ford Focus EV, Tesla Model S EV, Toyota Prius PHEV,
and Fisker Karma PHEV
– 2013• Honda Fit EV, Toyota RAV4 EV, Ford C-Max Energi PHEV, …
• Total sales remain relatively small– 0.1% of overall sales in 2011, 0.2-0.3% of sales in 2012

6
U.S. Refueling Infrastructure
• Home charging– Nationwide, 50-60% of all U.S. households have garages– 61% of new vehicle buying households in California have
access to an electrical outlet within 50 feet of parking location
– Level 1 (120 v) systems can work for PHEVs– Level 2 (240 v) are best for EVs
• GE WattStation sold to consumers for $1,000 plus installation
• Public charging stations– About 4500 public charging stations in U.S.– Mostly Level 2 (240 v) systems, a few Level 3 (480 v) systems

7
Utility Programs in U.S.
• Promoting consumer interest– Offering new pricing options
• Lower rates for nighttime charging • Dedicated meters with lower rates for home charging• Fixed monthly price for unlimited EV charging at public stations
– Free or reduced price Level 2 charging stations and home installation
• Evaluating potential impacts on electric grid– distribution infrastructure (e.g., transformers)– “smart charging” and vehicle-to-grid technology
• Operating EV/PHEV fleets for research purposes• Collaborating with cities, local governments, and other
stakeholders on plug-in vehicle readiness planning

Lifecycle GHG Emissions Performance(Real world, based on EPA eGRID2012)
0
50
100
150
200
250
300
350
400
Gasoline Electricity Gas Elec. Gas/Elec.
GH
G E
mis
sion
s (gr
ams C
O2e
/mile
)
Upstream EmissionsTailpipe Emissions
2012 Cruze 2012 Leaf EV 2012 Volt PHEV

9
U.S. Regulatory Landscape

10
U.S. Health-Related Emissions Standards
• U.S. (EPA and the California Air Resources Board) was the global pioneer in reducing automotive health-related pollution in the 1970s and 1980s
• EPA “Tier 2” standards now in effect represent 98-99% reductions, relative to 1970, for hydrocarbons, carbon monoxide, and oxides of nitrogen emissions– Technologies such as fuel injection and on-board electronic
controls have led to cars that are not only cleaner, but better performing and more reliable and durable as well
• EPA considering future “Tier 3” standards that could tighten both vehicle and fuel standards
• Unlikely to have major effect on future EV market

U.S. National Program GHG/CAFE Standards(www.epa.gov/otaq/climate/regulations.htm)
MY 2010Baseline
MY 2016Standards
MY 2025Standards
GHG emissions
351 g/mi(218 g/km)
250 g/mi(155 g/km)
163 g/mi(101 g/km)
Fuel economy 25.3 mpg(9.3 L/100 km)
34.1 mpg(6.9 L/100 km)
49.6 mpg(4.7 L/100 km)
11

12
U.S. National ProgramGHG Compliance Incentives for EV/PHEVs
Timeframe GHG Emissions Compliance Treatment for Grid Electricity
ComplianceMultiplier
2012-2016 Below sales limit: 0 grams/mileAbove sales limit: Net upstream
None
2017-2021 0 grams/mile EV: 2.0 … 1.5PHEV: 1.6 … 1.3
2022-2025 Below sales limit: 0 grams/mileAbove sales limit: Net upstream
None
13
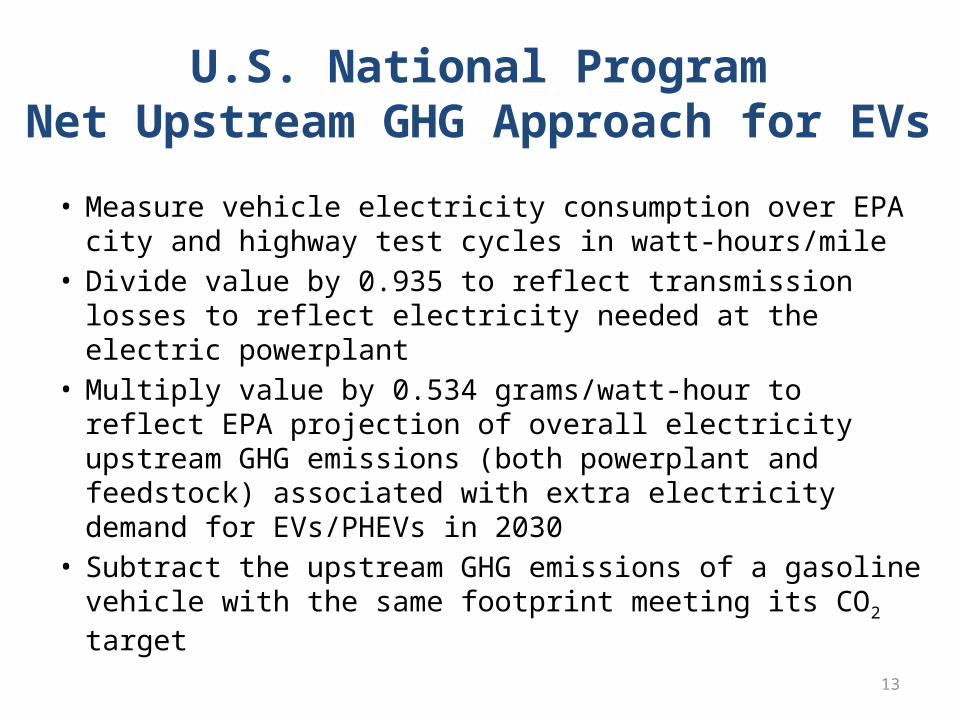
U.S. National ProgramNet Upstream GHG Approach for EVs• Measure vehicle electricity consumption over EPA city
and highway test cycles in watt-hours/mile• Divide value by 0.935 to reflect transmission losses to
reflect electricity needed at the electric powerplant• Multiply value by 0.534 grams/watt-hour to reflect EPA
projection of overall electricity upstream GHG emissions (both powerplant and feedstock) associated with extra electricity demand for EVs/PHEVs in 2030
• Subtract the upstream GHG emissions of a gasoline vehicle with the same footprint meeting its CO2 target

14
CAFE Treatment for EVs
• Based on “petroleum equivalency factor” per DOE regulations, reflecting that little or no oil is used in U.S. electricity generation
• CAFE rating = 82,049 Wh/gal divided by electricity consumption in Wh/mile over EPA tests– Nissan Leaf uses 238 Wh/mile, so CAFE = 347 miles/gallon

15
California ZEV Program(www.arb.ca.gov)
• Originally established in 1990 to require a fraction of sales of advanced technology vehicles with zero or near-zero health-related emissions– Mostly met by ultra-low emissions gasoline and hybrid cars– Smaller number of EVs, often “Neighborhood EVs”
• Evolving to greater focus on vehicles that use fuels with “zero emission” tailpipe GHG emissions– Grid electricity and hydrogen
• Compliance based on credit system reflecting technology, EV range, hydrogen fuel cell storage pressure, etc.
• EPA currently reviewing “waiver” for 2018-2025 that could be met by, for example, 13% EV 100 and 4% PHEV– Or fewer fuel cell vehicles, or EVs with longer range
16
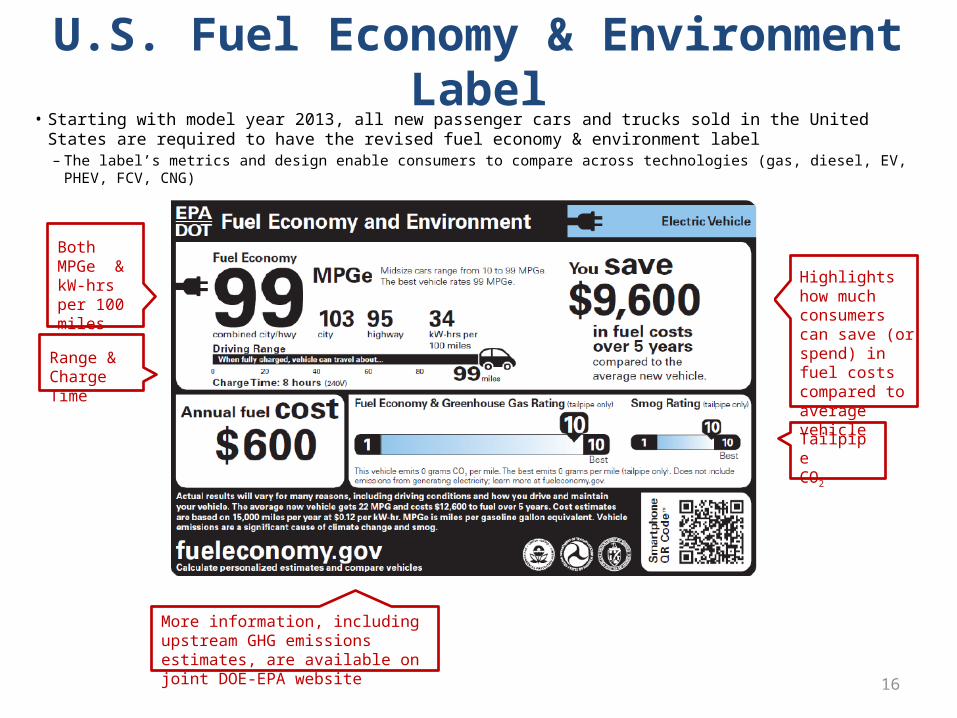
U.S. Fuel Economy & Environment Label
Both MPGe & kW-hrs per 100 miles
Range &Charge Time
More information, including upstream GHG emissions estimates, are available on joint DOE-EPA website
Tailpipe CO2
Highlights how much consumers can save (or spend) in fuel costs compared to average vehicle
• Starting with model year 2013, all new passenger cars and trucks sold in the United States are required to have the revised fuel economy & environment label– The label’s metrics and design enable consumers to compare across technologies (gas, diesel, EV, PHEV, FCV, CNG)

17
U.S. Government Incentives

18
U.S. DOE Funding to support EVs/PHEVs• American Recovery and Reinvestment Act of 2009
– $2 billion in grants for advanced battery manufacturing and recycling & electric drive component manufacturing
– $400 million for transportation electrification program to install charging infrastructure and purchase EVs/PHEVs for demonstrations—The EV Project• 20+ cities• Over 8000 Evs and PHEVs• 14,000 Level 2 chargers and 300 Level 3 chargers• Data at http://avt.inl.gov/evproject.shtml
• Recent Research & Development programs– EV Everywhere Grand Challenge, announced March, 2012
• Goal to enable US companies to develop an EV that is cost competitive with conventional vehicles (payback < 5 years) and has a range that meet s average Americans’ needs by 2022
• Working with industry, academia, state and local governments, and other stakeholders
– $4 million to develop a wireless charging system for EVs, announced April 2012– $43 million for breakthrough energy storage technologies for electric vehicles and the grid
• through the DOE’s Advanced Research Projects Agency-Energy , announced Aug 2012
• Advanced Technology Vehicles Manufacturing Loan Program– Loans help fund domestic manufacturing facilities for EVs and batteries (as well as other advanced
technology vehicles) – $25 billion authorized, $8,4 billion spent so far

19
U.S. EV/PHEV Tax Credits• Primary economic incentive to promote consumer
interest in EVs/PHEVs• Federal tax credit– $2500 credit for EV/PHEV with battery capacity of 4 kWh– Credit increases by $417 for every kWh in excess of 4 kWh– Maximum credit of $7500 for battery capacity of 16+ kWh– Credit begins to phase down after a manufacturer’s
cumulative EV/PHEV sales reaches 200,000 units
• Some individual states also offer EV/PHEV tax credits– Highest credit is $5000 in Georgia– California state incentive ended June 30, 2012

20
HOV Lane Access in U.S.
• Primary non-economic incentive to promote consumer interest in EVs/PHEVs
• High-occupancy vehicle (HOV) lanes are normally restricted to vehicles carrying a certain minimum number of passengers to encourage car-pooling
• 11 states allow EV and PHEV drivers to use HOV lanes– Including California, New York, New Jersey, Florida, Illinois,
Virginia, and Maryland
• In some areas, this can be a very powerful incentive

21
Fuel Road Taxes in U.S.
• U.S. fuel taxes– Federal: 18.4 cents per gallon– State: vary, but typically average about 30 cents per gallon
• Vehicles that use electricity generally pay no fuel taxes– One state, Washington state, has a $100 annual EV tax
• This yields an annual benefit of about $250 relative to a gasoline car that pays fuel taxes, or $2500 over a 10-year period

22
U.S. Market Drivers and Barriersfor EVs

23
U.S. Market Drivers
• Direct benefits to vehicle owner– Fuel prices
• Much lower• Much more predictable
– Refueling• Can do so at home and avoid gasoline stations
– Reduce personal oil use and carbon emissions– No tailpipe/noise may be perceived as more “elegant”
• Collective societal benefits– Large carbon savings, especially if electric grid is transformed to
low-carbon feedstocks– Large oil savings can also reduce oil prices, reduce trade deficit,
and keep more dollars in local economies
24
U. S. Market Barriers• Much higher vehicle cost, due primarily to batteries• Vehicle range
– Lower– More variable due to climate and driving behavior
• Inconvenience and flexibility– Loss of peak vehicle utility– Longer refueling time– Greater need for household planning for vehicle use
• Lack of widespread public charging infrastructure• Consumer reluctance to try very different car technology• Cost and challenge of transforming electric grid to low-
carbon feedstocks

25
Perspective• EVs are a “bigger change” than any other alternative vehicle
technology option for the U.S. market• U.S. gov’t has done more to promote EV/PHEVs than other
advanced technologies, but sales remain low so far• It is impossible to predict whether EVs will be successful
– Plausible that EVs will gain only a very small market share, e.g., as a second or third “city car” for high-income families
– Plausible that EVs will become a mainstream competitor and the “technology of choice” for those consumers who want to nearly zero out their oil and carbon footprints
• Major determinants of future EV success in U.S.– Oil prices– Battery innovation and cost– Ability to transform U.S. electric grid to low-carbon feedstocks– Cultural attitudes toward oil and carbon

26
Thank You
Jeff AlsonU.S. Environmental Protection Agency