Embed Size (px)
Citation preview
International Journal of Scientific and Research Publications, Volume 7, Issue 5, May 2017 74 ISSN 2250-3153
www.ijsrp.org
Overview of Degrading Agriculture in Jaunpur branchCanal Command: A GIS/Remote Sensing
Based Approach
S. K. Singh1, S.K. Tripathi1, S.P. Singh2 andR.K. Prajapati1* 1Remote Sensing and GIS Lab, MGCG University, Chitrakoot-485334, Satna (M.P.) India
2Institute of Earth Science, Bundelkhand University, Jhansi (U.P.) INDIA
Abstract - This paper discusses the pilot study area between the Gomti and Sai Rivers 550000 ha. The entire study area is commanded by the Jaunpur Branch canal with 123-cumec design capacity under the SardaSahayak system. In the study geo-database has been prepared based on data collection and to capture information on climate, agriculture, surface and groundwater hydrology, irrigation and drainage network, water demands (Irrigation, domestic, industrial, hydropower, environment), socio-economic and demographic details, topography, water quality etc. The finding reveals that apart from canals, a significant amount of groundwater resources is also being utilized by private and government tubewells. Contribution of government tubewells is much less. Waterlogging appears to be localized in nature and exists predominantly in canal head and middle reaches where groundwater utilization is comparatively less and seepage from canals is higher. It is clear from these illustrations that rice being less sensitive to waterlogging, it exhibits higher productivity in head and middle reaches of canal where canal supply is adequate and reliable in the Kharif. Quite expectedly, it shows lower productivity in the canal tails and out of command areas as canal irrigation is either not available or unreliable. Wheat scenario suggests that the productivity is higher in middle and tail reaches where waterlogging is less and groundwater is used more. The cropping intensity during both Kharif and Rabi seasons is comparatively low along head reaches of canals. RS analyses clearly suggest that cropping intensity is lesser especially along branch and distributary canals in head and middle reaches. Index Term: Gaghra-Gomti Basin, Waterlogging, crop intensity, Conjunctive use and Demographic
I. INTRODUCTION
Over the past decades the satellite based techniques and the use of remotely sensed data have
achieved a major progress and is now becoming a promising approach in wider range of disciplines.
Remote sensing is the science and art of obtaining information about an object, area or phenomenon
on the earth surface without being in contact with it (Agyepong, 1988, Agyepong and Kufogbe,
1997). The technique, according to Benneh (1997), overcomes the two major problems inherent in
ground survey, that is, area coverage and time. GIS is a too! For collecting, storing, retrieving at
will, transforming, and displaying spatial data from the real world for a particular set of purposes
(Bourrough, 1986). As a database system, it facilitates spatial data indexing and enables the
performance of sets of operations to answer queries about spatial entities in the database (Smith et
a/., 1987). The GIS technique has, thus, become very useful aiding decision making in planning and
development, including irrigation and agriculture.
The most populous state, Uttar Pradesh, is also endowed with the largest water resources in the
country. A large network of perennial rivers contributes to its vast water resources potential and
International Journal of Scientific and Research Publications, Volume 7, Issue 5, May 2017 75 ISSN 2250-3153
www.ijsrp.org
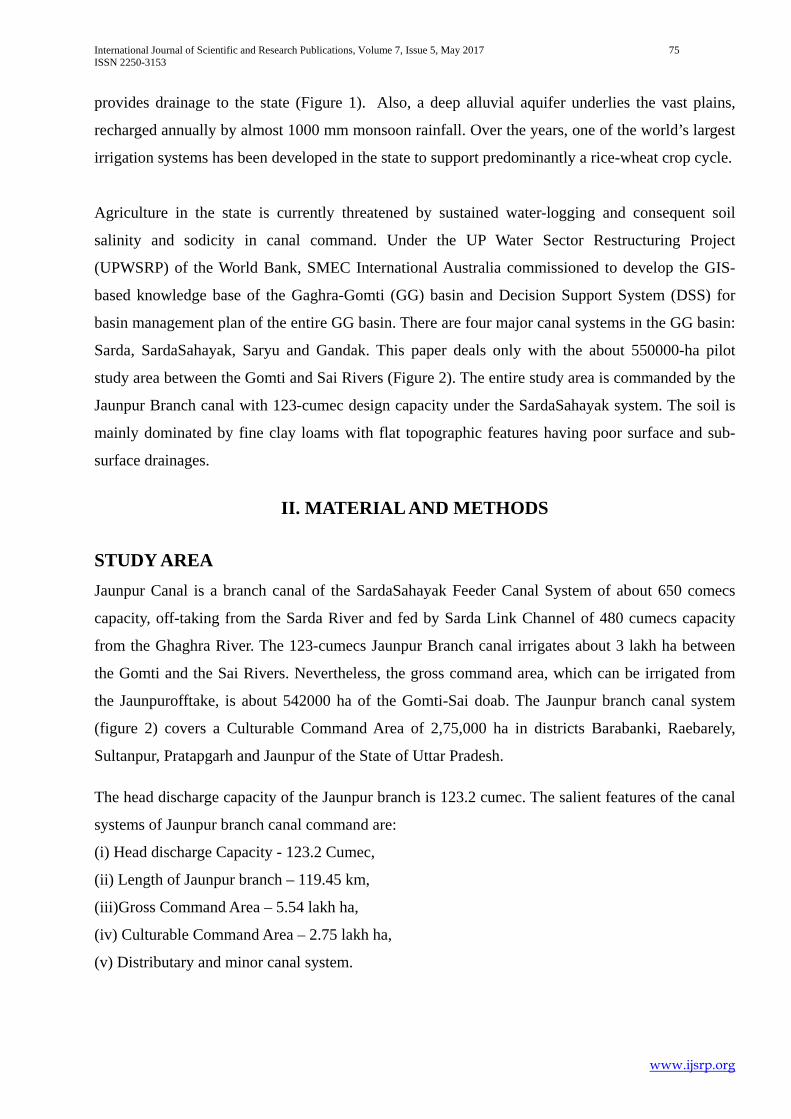
provides drainage to the state (Figure 1). Also, a deep alluvial aquifer underlies the vast plains,
recharged annually by almost 1000 mm monsoon rainfall. Over the years, one of the world’s largest
irrigation systems has been developed in the state to support predominantly a rice-wheat crop cycle.
Agriculture in the state is currently threatened by sustained water-logging and consequent soil
salinity and sodicity in canal command. Under the UP Water Sector Restructuring Project
(UPWSRP) of the World Bank, SMEC International Australia commissioned to develop the GIS-
based knowledge base of the Gaghra-Gomti (GG) basin and Decision Support System (DSS) for
basin management plan of the entire GG basin. There are four major canal systems in the GG basin:
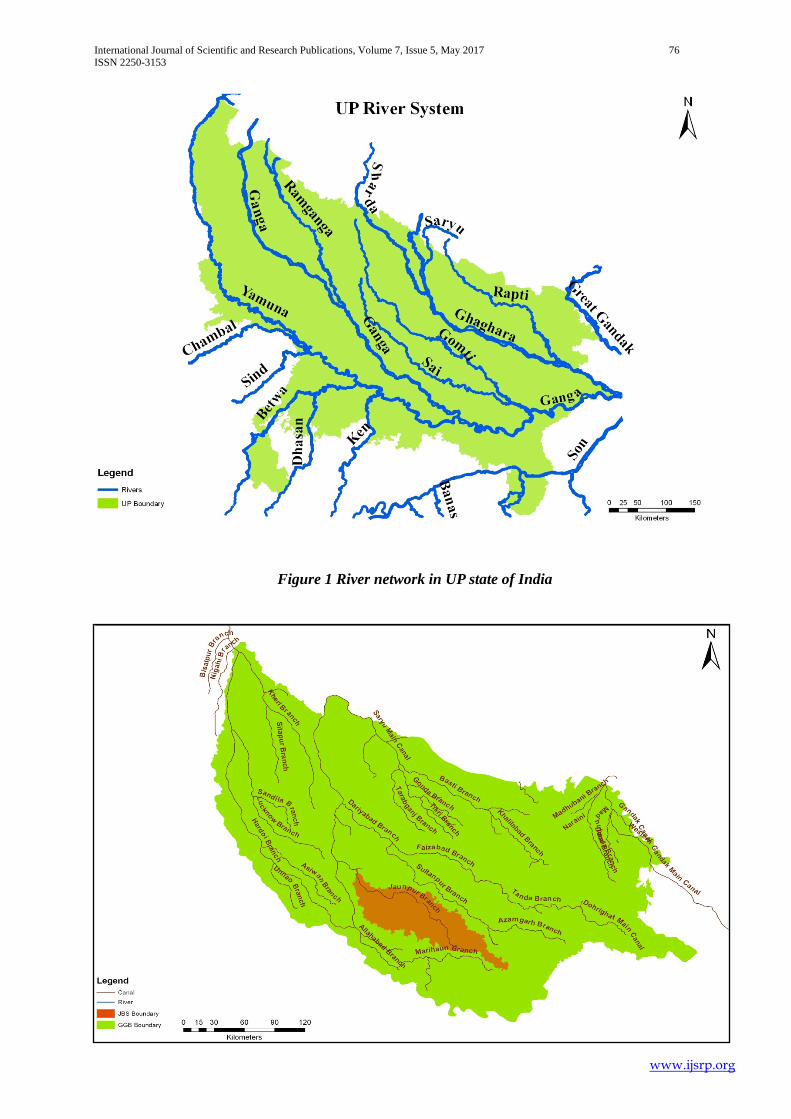
Sarda, SardaSahayak, Saryu and Gandak. This paper deals only with the about 550000-ha pilot
study area between the Gomti and Sai Rivers (Figure 2). The entire study area is commanded by the
Jaunpur Branch canal with 123-cumec design capacity under the SardaSahayak system. The soil is
mainly dominated by fine clay loams with flat topographic features having poor surface and sub-
surface drainages.
II. MATERIAL AND METHODS
STUDY AREA Jaunpur Canal is a branch canal of the SardaSahayak Feeder Canal System of about 650 comecs
capacity, off-taking from the Sarda River and fed by Sarda Link Channel of 480 cumecs capacity
from the Ghaghra River. The 123-cumecs Jaunpur Branch canal irrigates about 3 lakh ha between
the Gomti and the Sai Rivers. Nevertheless, the gross command area, which can be irrigated from
the Jaunpurofftake, is about 542000 ha of the Gomti-Sai doab. The Jaunpur branch canal system
(figure 2) covers a Culturable Command Area of 2,75,000 ha in districts Barabanki, Raebarely,
Sultanpur, Pratapgarh and Jaunpur of the State of Uttar Pradesh.
The head discharge capacity of the Jaunpur branch is 123.2 cumec. The salient features of the canal
systems of Jaunpur branch canal command are:
(i) Head discharge Capacity - 123.2 Cumec,
(ii) Length of Jaunpur branch – 119.45 km,
(iii)Gross Command Area – 5.54 lakh ha,
(iv) Culturable Command Area – 2.75 lakh ha,
(v) Distributary and minor canal system.
International Journal of Scientific and Research Publications, Volume 7, Issue 5, May 2017 76 ISSN 2250-3153
www.ijsrp.org
Figure 1 River network in UP state of India
International Journal of Scientific and Research Publications, Volume 7, Issue 5, May 2017 77 ISSN 2250-3153
www.ijsrp.org
Figure 2Jaunpur Branch Canals System pilot study area
III. METHODOLOGY
A comprehensive geo-database has been prepared to capture information on climate, agriculture,
surface and groundwater hydrology, irrigation and drainage network, water demands (irrigation ,
domestic, industrial, hydropower, environment), socio-economic and demographic details,
topography, water quality and so on.
IV. RESULTS AND DISCUSSION
Crop Productivity
NyayaPanchayat-wise productivity data of major crops show similar trends as the previous dataset,
with general low productivity over the JBS project area. In particular, the agricultural productivity
of water logged areas is very poor. An example is TalaNyayaPanchayat in Amethi Block, Sultanpur,
where the productivity of Rice and Wheat is only 17.37 Q/ha and 18.40 Q/ha, respectively, in 2013-
14. Over the areas of deeper ground water level where irrigation is taken from both canal water and
tubewell water, major crop productivity is higher. For instance, in NyayaPanchayat of Lubhawa
Block, Sultanpur, the Rice yield is recorded at 28.18 Q/ha and in NarendrapurPanchayat of Jamu
Block, Sultanpur, the Wheat yield is recorded at 30.38 Q/ha.
Generally, the average productivity of major crops in JBS sub-basin is:
Rice: 18.68 to 23.29 Q/ha
Wheat: 20.39 to 29.06 Q/ha
Barley: 11.24 to 18.58 Q/ha
Gram: 9.46 to 28.92 Q/ha
Arhar: 12.49 to 9.11 Q/ha
Mustard: 6.59 to 11.96 Q/ha
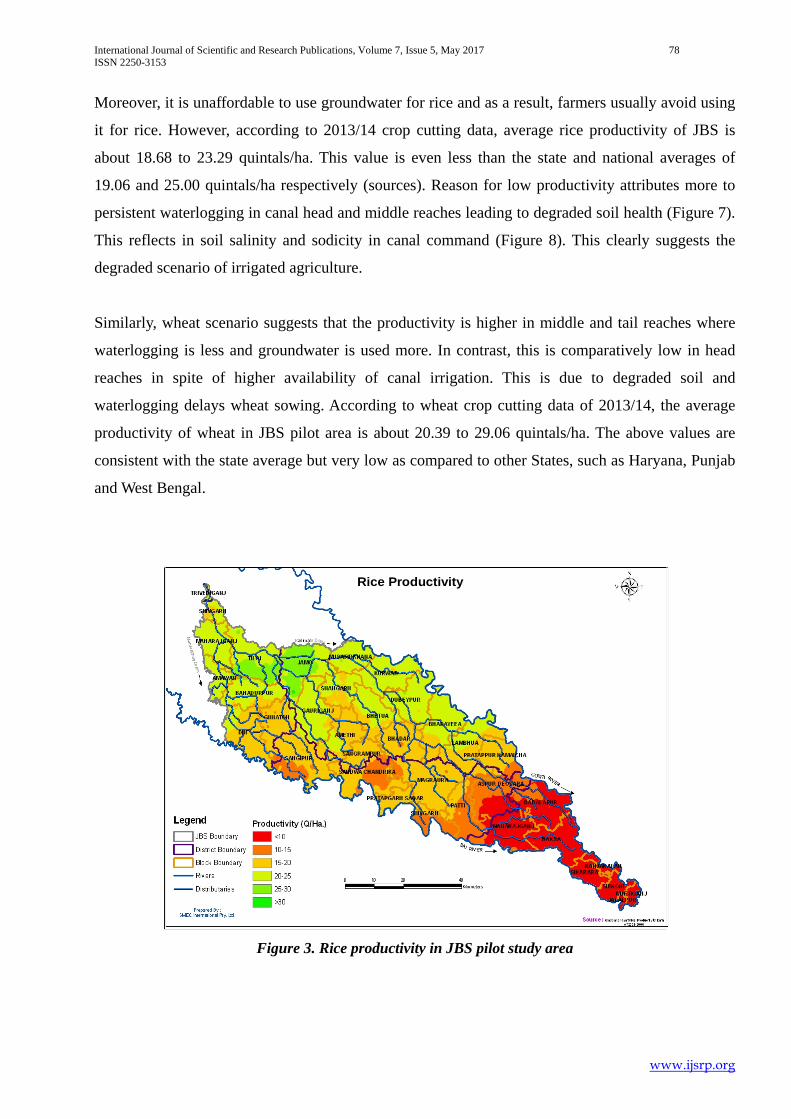
Productivity maps of rice and wheat crops have been prepared based on NyayaPanchayat level crop
cutting experiment data of JBS area obtained from the Agriculture Directorate of UP and shown in
figure 3 and figure 4 respectively. It is clear from these illustrations that rice being less sensitive to
waterlogging, it exhibits higher productivity in head and middle reaches of canal where canal
supply is adequate and reliable in the Kharif. Quite expectedly, it shows lower productivity in the
canal tails and out of command areas as canal irrigation is either not available or unreliable.
International Journal of Scientific and Research Publications, Volume 7, Issue 5, May 2017 78 ISSN 2250-3153
www.ijsrp.org
Moreover, it is unaffordable to use groundwater for rice and as a result, farmers usually avoid using
it for rice. However, according to 2013/14 crop cutting data, average rice productivity of JBS is
about 18.68 to 23.29 quintals/ha. This value is even less than the state and national averages of
19.06 and 25.00 quintals/ha respectively (sources). Reason for low productivity attributes more to
persistent waterlogging in canal head and middle reaches leading to degraded soil health (Figure 7).
This reflects in soil salinity and sodicity in canal command (Figure 8). This clearly suggests the
degraded scenario of irrigated agriculture.
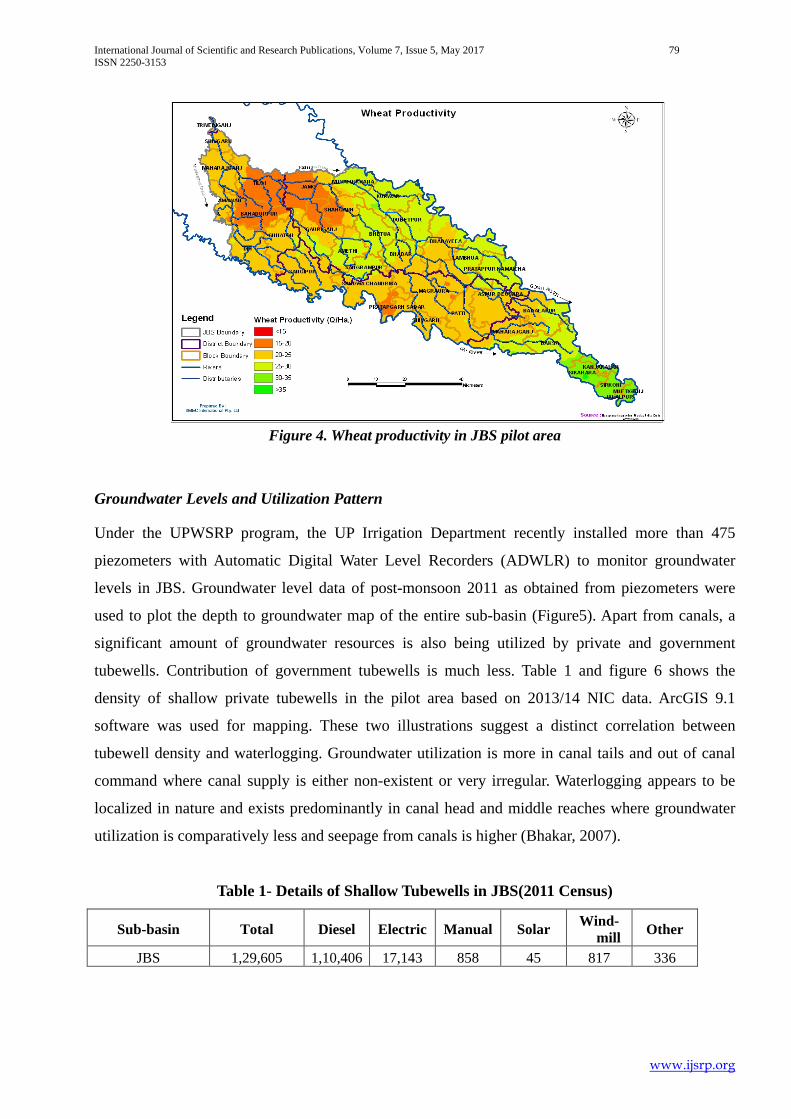
Similarly, wheat scenario suggests that the productivity is higher in middle and tail reaches where
waterlogging is less and groundwater is used more. In contrast, this is comparatively low in head
reaches in spite of higher availability of canal irrigation. This is due to degraded soil and
waterlogging delays wheat sowing. According to wheat crop cutting data of 2013/14, the average
productivity of wheat in JBS pilot area is about 20.39 to 29.06 quintals/ha. The above values are
consistent with the state average but very low as compared to other States, such as Haryana, Punjab
and West Bengal.
Figure 3. Rice productivity in JBS pilot study area
Rice ProductivityRice Productivity
International Journal of Scientific and Research Publications, Volume 7, Issue 5, May 2017 79 ISSN 2250-3153
www.ijsrp.org
Figure 4. Wheat productivity in JBS pilot area
Groundwater Levels and Utilization Pattern
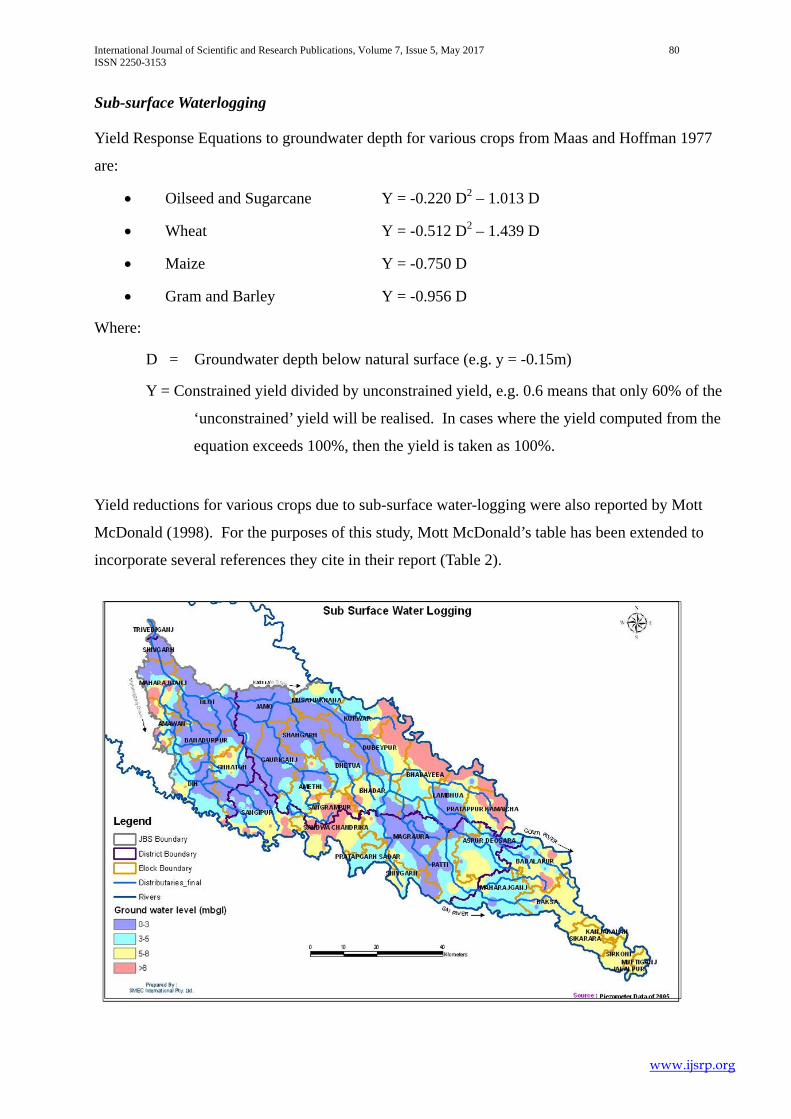
Under the UPWSRP program, the UP Irrigation Department recently installed more than 475
piezometers with Automatic Digital Water Level Recorders (ADWLR) to monitor groundwater
levels in JBS. Groundwater level data of post-monsoon 2011 as obtained from piezometers were
used to plot the depth to groundwater map of the entire sub-basin (Figure5). Apart from canals, a
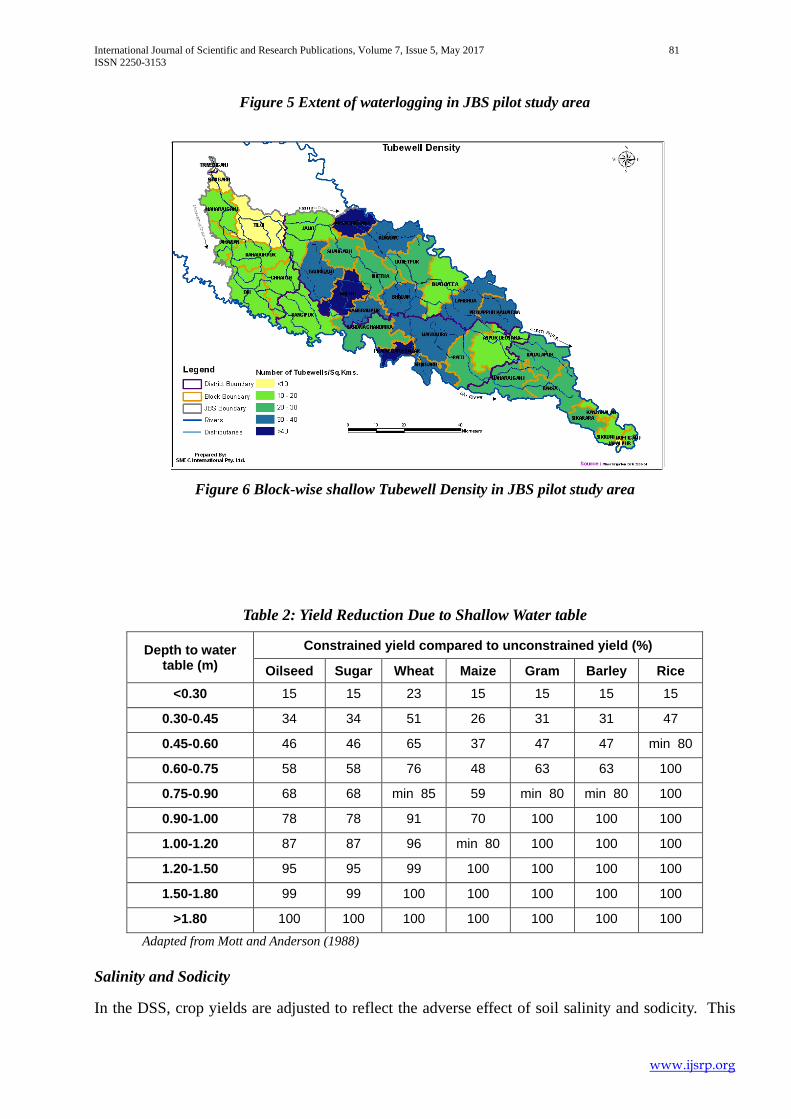
significant amount of groundwater resources is also being utilized by private and government
tubewells. Contribution of government tubewells is much less. Table 1 and figure 6 shows the
density of shallow private tubewells in the pilot area based on 2013/14 NIC data. ArcGIS 9.1
software was used for mapping. These two illustrations suggest a distinct correlation between
tubewell density and waterlogging. Groundwater utilization is more in canal tails and out of canal
command where canal supply is either non-existent or very irregular. Waterlogging appears to be
localized in nature and exists predominantly in canal head and middle reaches where groundwater
utilization is comparatively less and seepage from canals is higher (Bhakar, 2007).
Table 1- Details of Shallow Tubewells in JBS(2011 Census)
Sub-basin Total Diesel Electric Manual Solar Wind-mill Other
JBS 1,29,605 1,10,406 17,143 858 45 817 336
International Journal of Scientific and Research Publications, Volume 7, Issue 5, May 2017 80 ISSN 2250-3153
www.ijsrp.org
Sub-surface Waterlogging
Yield Response Equations to groundwater depth for various crops from Maas and Hoffman 1977
are:
• Oilseed and Sugarcane Y = -0.220 D2 – 1.013 D
• Wheat Y = -0.512 D2 – 1.439 D
• Maize Y = -0.750 D
• Gram and Barley Y = -0.956 D
Where:
D = Groundwater depth below natural surface (e.g. y = -0.15m)
Y = Constrained yield divided by unconstrained yield, e.g. 0.6 means that only 60% of the
‘unconstrained’ yield will be realised. In cases where the yield computed from the
equation exceeds 100%, then the yield is taken as 100%.
Yield reductions for various crops due to sub-surface water-logging were also reported by Mott
McDonald (1998). For the purposes of this study, Mott McDonald’s table has been extended to
incorporate several references they cite in their report (Table 2).
International Journal of Scientific and Research Publications, Volume 7, Issue 5, May 2017 81 ISSN 2250-3153
www.ijsrp.org
Figure 5 Extent of waterlogging in JBS pilot study area
Figure 6 Block-wise shallow Tubewell Density in JBS pilot study area
Table 2: Yield Reduction Due to Shallow Water table
Depth to water table (m)
Constrained yield compared to unconstrained yield (%)
Oilseed Sugar Wheat Maize Gram Barley Rice <0.30 15 15 23 15 15 15 15
0.30-0.45 34 34 51 26 31 31 47
0.45-0.60 46 46 65 37 47 47 min 80
0.60-0.75 58 58 76 48 63 63 100
0.75-0.90 68 68 min 85 59 min 80 min 80 100
0.90-1.00 78 78 91 70 100 100 100
1.00-1.20 87 87 96 min 80 100 100 100
1.20-1.50 95 95 99 100 100 100 100
1.50-1.80 99 99 100 100 100 100 100
>1.80 100 100 100 100 100 100 100
Adapted from Mott and Anderson (1988)
Salinity and Sodicity
In the DSS, crop yields are adjusted to reflect the adverse effect of soil salinity and sodicity. This
International Journal of Scientific and Research Publications, Volume 7, Issue 5, May 2017 82 ISSN 2250-3153
www.ijsrp.org
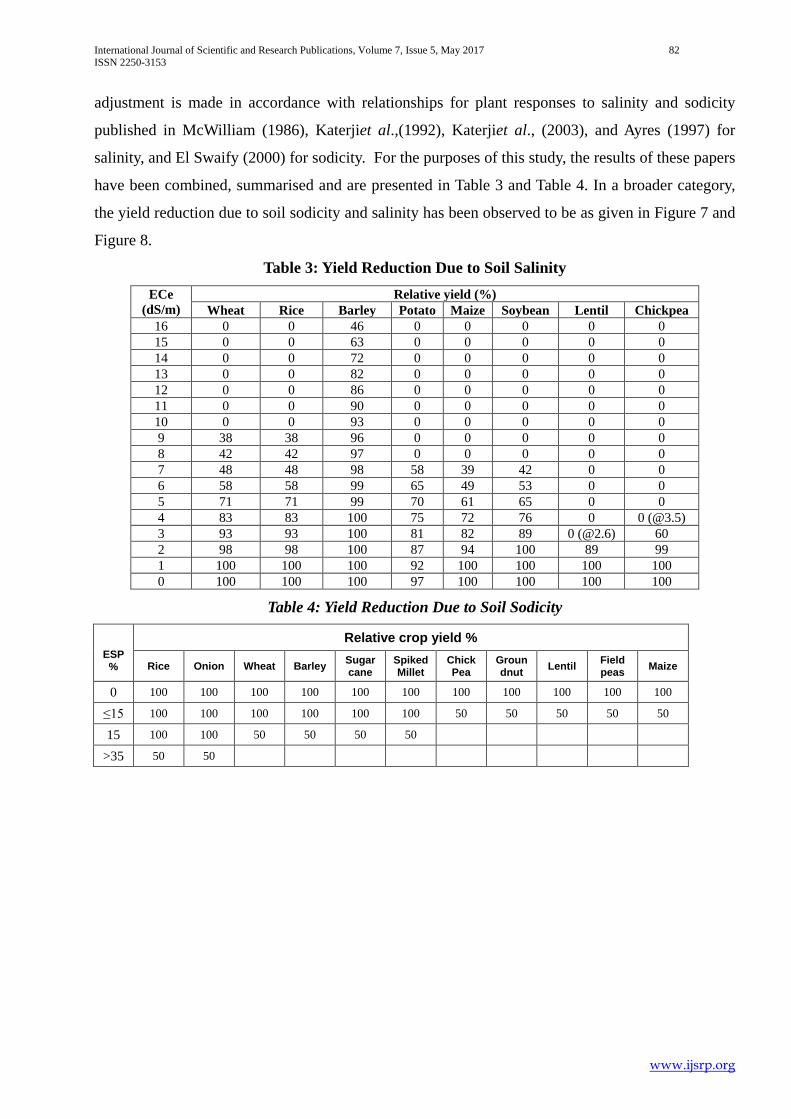
adjustment is made in accordance with relationships for plant responses to salinity and sodicity
published in McWilliam (1986), Katerjiet al.,(1992), Katerjiet al., (2003), and Ayres (1997) for
salinity, and El Swaify (2000) for sodicity. For the purposes of this study, the results of these papers
have been combined, summarised and are presented in Table 3 and Table 4. In a broader category,
the yield reduction due to soil sodicity and salinity has been observed to be as given in Figure 7 and
Figure 8.
Table 3: Yield Reduction Due to Soil Salinity ECe
(dS/m) Relative yield (%)
Wheat Rice Barley Potato Maize Soybean Lentil Chickpea 16 0 0 46 0 0 0 0 0 15 0 0 63 0 0 0 0 0 14 0 0 72 0 0 0 0 0 13 0 0 82 0 0 0 0 0 12 0 0 86 0 0 0 0 0 11 0 0 90 0 0 0 0 0 10 0 0 93 0 0 0 0 0 9 38 38 96 0 0 0 0 0 8 42 42 97 0 0 0 0 0 7 48 48 98 58 39 42 0 0 6 58 58 99 65 49 53 0 0 5 71 71 99 70 61 65 0 0 4 83 83 100 75 72 76 0 0 (@3.5) 3 93 93 100 81 82 89 0 (@2.6) 60 2 98 98 100 87 94 100 89 99 1 100 100 100 92 100 100 100 100 0 100 100 100 97 100 100 100 100
Table 4: Yield Reduction Due to Soil Sodicity
ESP %
Relative crop yield %
Rice Onion Wheat Barley Sugarcane
Spiked Millet
Chick Pea
Groundnut Lentil Field
peas Maize
0 100 100 100 100 100 100 100 100 100 100 100
≤15 100 100 100 100 100 100 50 50 50 50 50
15 100 100 50 50 50 50
>35 50 50
International Journal of Scientific and Research Publications, Volume 7, Issue 5, May 2017 83 ISSN 2250-3153
www.ijsrp.org
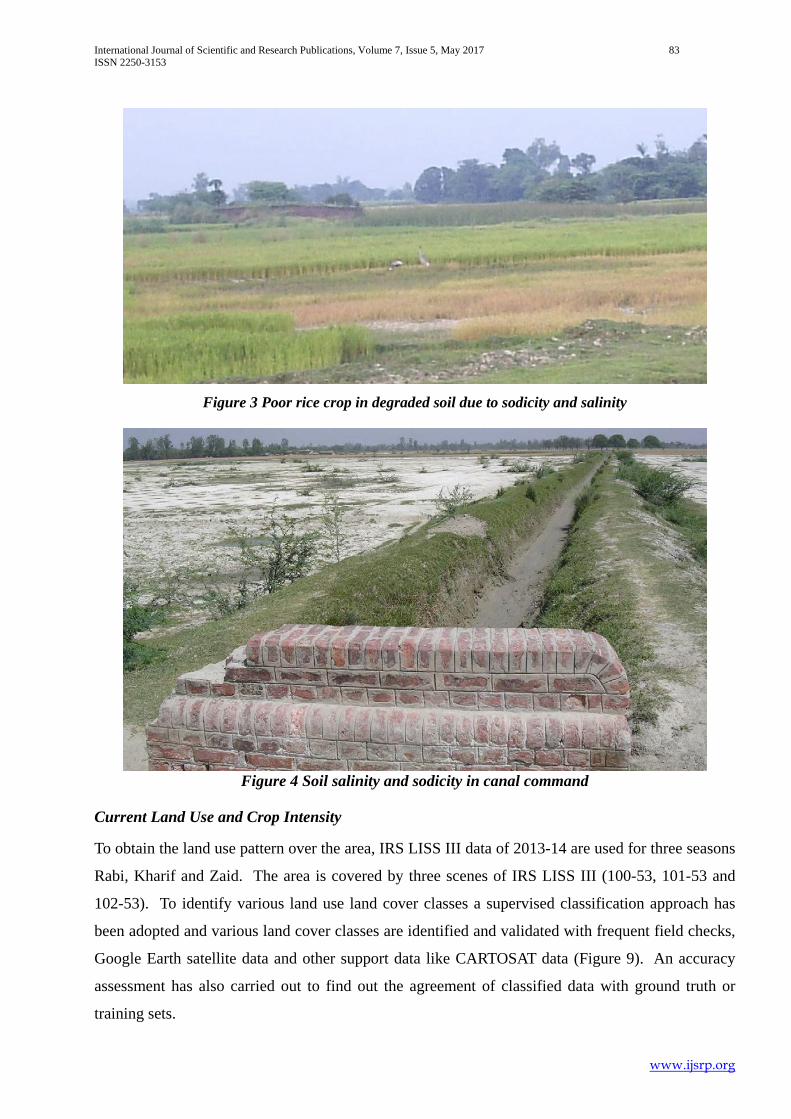
Figure 3 Poor rice crop in degraded soil due to sodicity and salinity
Figure 4 Soil salinity and sodicity in canal command
Current Land Use and Crop Intensity
To obtain the land use pattern over the area, IRS LISS III data of 2013-14 are used for three seasons
Rabi, Kharif and Zaid. The area is covered by three scenes of IRS LISS III (100-53, 101-53 and
102-53). To identify various land use land cover classes a supervised classification approach has
been adopted and various land cover classes are identified and validated with frequent field checks,
Google Earth satellite data and other support data like CARTOSAT data (Figure 9). An accuracy
assessment has also carried out to find out the agreement of classified data with ground truth or
training sets.
International Journal of Scientific and Research Publications, Volume 7, Issue 5, May 2017 84 ISSN 2250-3153
www.ijsrp.org
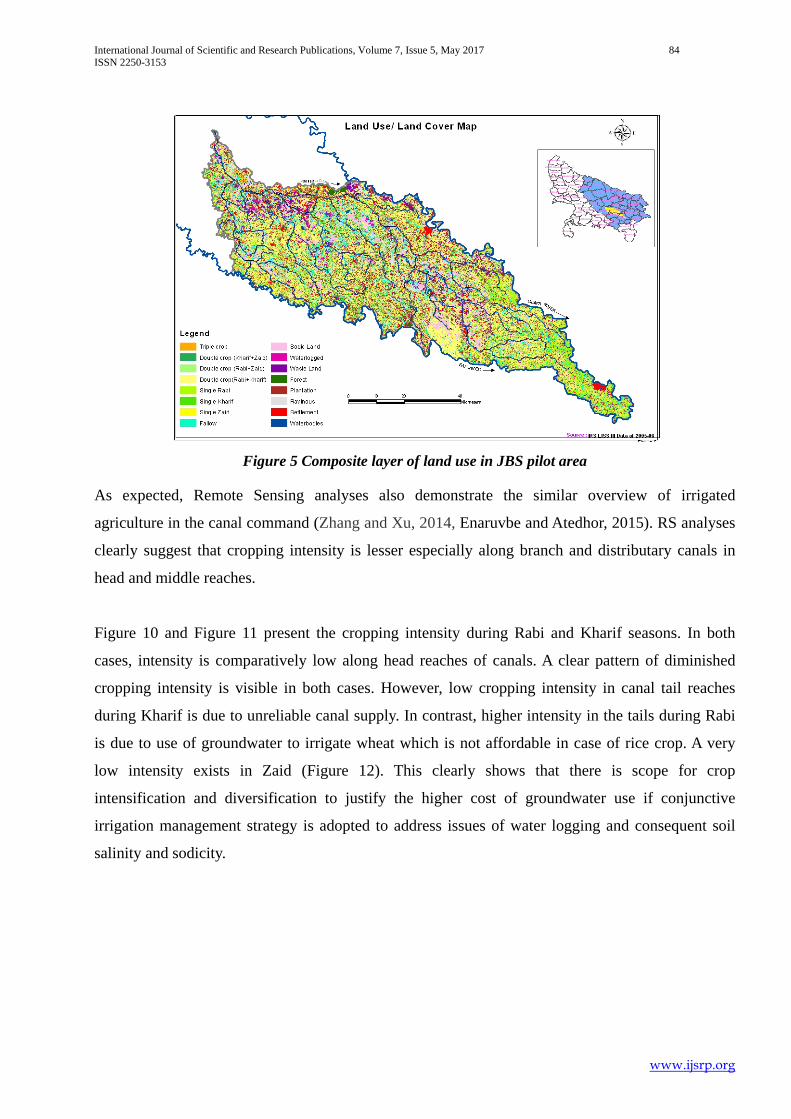
Figure 5 Composite layer of land use in JBS pilot area
As expected, Remote Sensing analyses also demonstrate the similar overview of irrigated
agriculture in the canal command (Zhang and Xu, 2014, Enaruvbe and Atedhor, 2015). RS analyses
clearly suggest that cropping intensity is lesser especially along branch and distributary canals in
head and middle reaches.
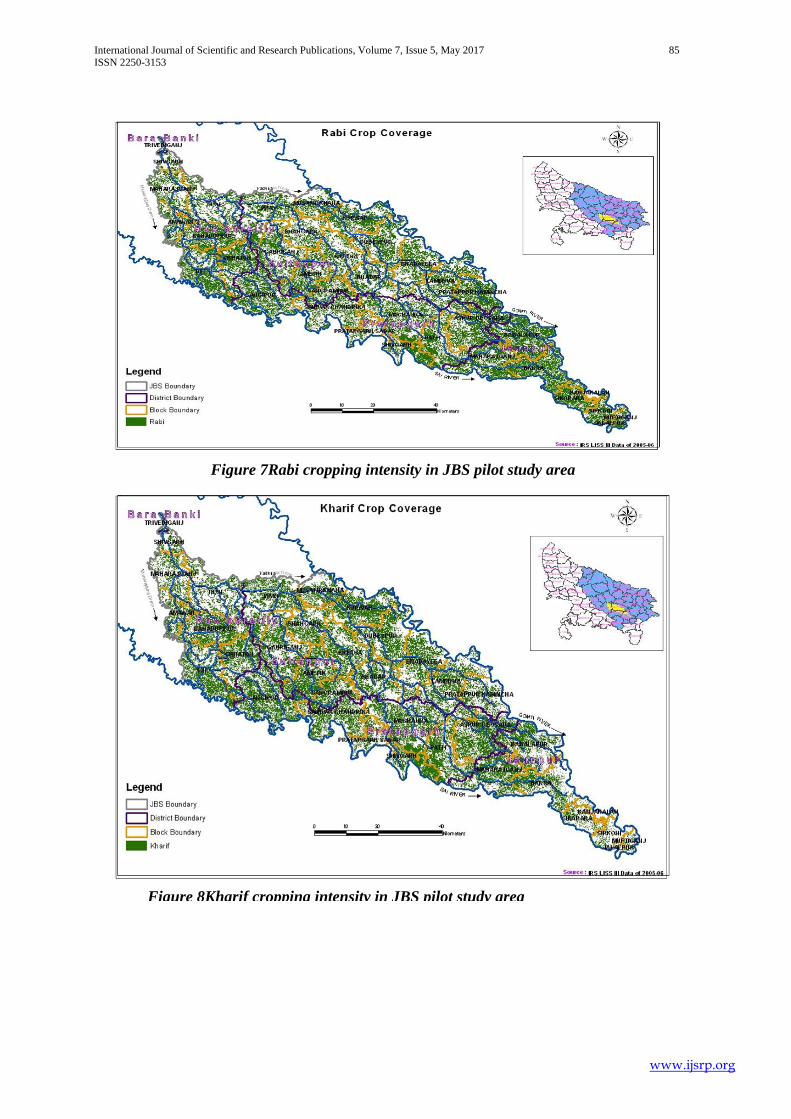
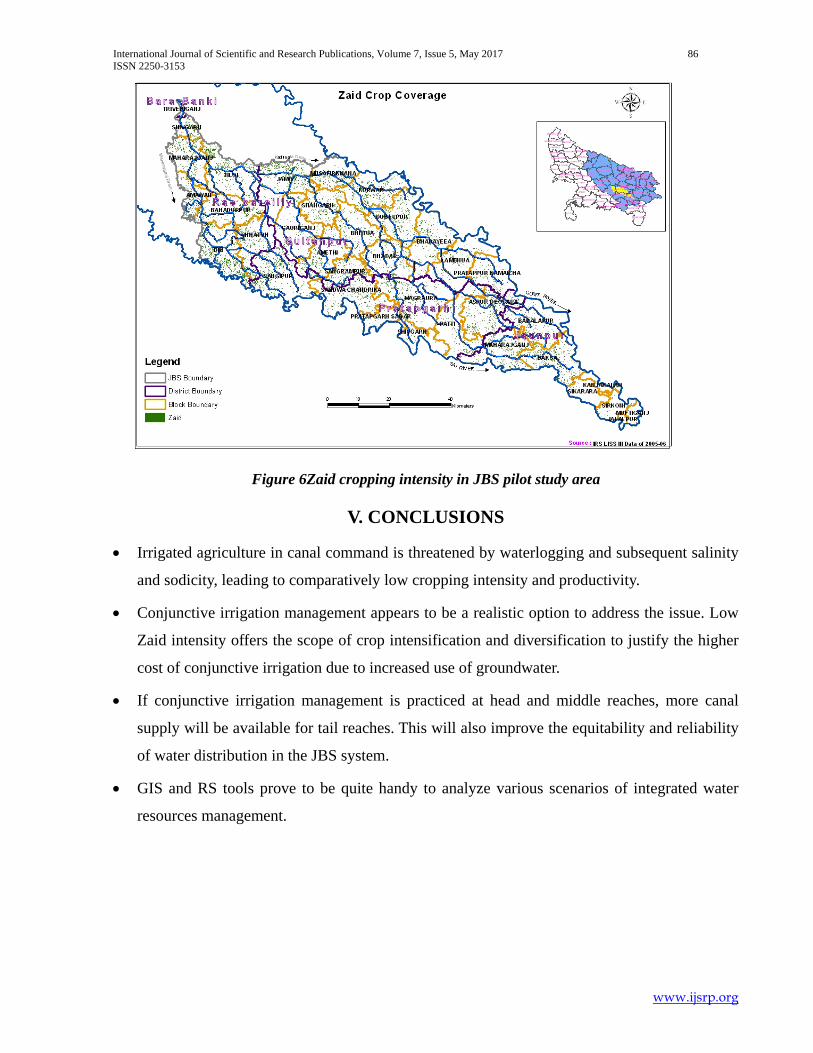
Figure 10 and Figure 11 present the cropping intensity during Rabi and Kharif seasons. In both
cases, intensity is comparatively low along head reaches of canals. A clear pattern of diminished
cropping intensity is visible in both cases. However, low cropping intensity in canal tail reaches
during Kharif is due to unreliable canal supply. In contrast, higher intensity in the tails during Rabi
is due to use of groundwater to irrigate wheat which is not affordable in case of rice crop. A very
low intensity exists in Zaid (Figure 12). This clearly shows that there is scope for crop
intensification and diversification to justify the higher cost of groundwater use if conjunctive
irrigation management strategy is adopted to address issues of water logging and consequent soil
salinity and sodicity.
International Journal of Scientific and Research Publications, Volume 7, Issue 5, May 2017 85 ISSN 2250-3153
www.ijsrp.org
Figure 7Rabi cropping intensity in JBS pilot study area
Figure 8Kharif cropping intensity in JBS pilot study area
International Journal of Scientific and Research Publications, Volume 7, Issue 5, May 2017 86 ISSN 2250-3153
www.ijsrp.org
Figure 6Zaid cropping intensity in JBS pilot study area
V. CONCLUSIONS
• Irrigated agriculture in canal command is threatened by waterlogging and subsequent salinity
and sodicity, leading to comparatively low cropping intensity and productivity.
• Conjunctive irrigation management appears to be a realistic option to address the issue. Low
Zaid intensity offers the scope of crop intensification and diversification to justify the higher
cost of conjunctive irrigation due to increased use of groundwater.
• If conjunctive irrigation management is practiced at head and middle reaches, more canal
supply will be available for tail reaches. This will also improve the equitability and reliability
of water distribution in the JBS system.
• GIS and RS tools prove to be quite handy to analyze various scenarios of integrated water
resources management.
International Journal of Scientific and Research Publications, Volume 7, Issue 5, May 2017 87 ISSN 2250-3153
www.ijsrp.org
REFERENCES
1. Agyepong, G. T, (1988): Remote Sensing and Land Use Planning in the Onchocerciasis and
Tsetse Free Zones of Northern Ghana. FAO Seminar on Land Use in Onchocerciasis and
Tsetse Free Zones of Ghana, Tamale.
2. Agyepong, G. T. and KufogbeS. K. (1997): Land Use and Land Cover Patterns.Environment.
Biodiversity and Agricultural Change in West Africa. Perspectives from Ghana. Gyasi E. A.
and Uitto, J. I. (ed). United Nations University. Pp 52-56
3. Ayres, P.Matthew, Thomas P. Clausen,Stephen F. MacLean Jr.,Ahnya M. Redman, Paul B.
Reichardt (1997): Diversity Of Structure And Antiherbivore Activity In Condensed Tannins,
Ecology, Volume 78, issues 6 September 1997, pp1696-1712 4. Benneh, G. (1997): 'Indigenous African Farming Systems. Their Significance for Sustainable
Environmental Use (Keynote Address). Environment, Biodiversity and Agricultural Change
in West Africa: Perspectives from Ghana. (Edited by Gysai, E. A. &Uitto, J. I.) United
Nations University Press, Tokyo.New York. Paris
5. Bhakar, Rajesh (2007): Analysis of Hydrological system and Land cover assessment of risks
to irrigated agriculture in Thar Desert: Charanwala System of Indira Gandhi Canal Project.
M.Sc Thesis, International institute for Geo-information science and Earth Observations,
Netherlands
6. Burrough, P. A. (1986): Principals of Geographic Information Systems for Land Resouces
Assessment. Monographs on Soil and Resources Survey NO. 12. Carendon Press. Oxford
Science Publications pp194
7. Davivongs, Vudipong, Makoto,Yokohari and Yuji, Hara (2012): Neglected Canals:
Deterioration of Indigenous Irrigation System by Urbanization in the West Peri-Urban Area of
Bangkok Metropolitan Region, Water 4, 12-27; doi:10.3390/w4010012
8. El-Swaify, S.A.(2000): Soil and Water Salinity, Plant Nutrient Management in Hawaii’s Soils,
Approaches for Tropical and Subtropical Agriculture. A. Silva and R. Uchida, eds. College of
Tropical Agriculture and Human Resources, University of Hawaii at Manoa
9. Enaruvbe, G. O. and Atedhor, G. O. (2015): Spatial Analysis Of Agricultural Landuse
Change In Asaba, Southern Nigeria, Ife Journal of Science vol. 17, no. 1, 65-74.
10. Katerji N, van Hoorn JW, Hamdy A, Bouzid N, El-SayedMahrous S, Mastrorilli M. (1992):
Effect of salinity on water stress, growth and yield of broadbeans. Agric Water Manage
21:107–117.
International Journal of Scientific and Research Publications, Volume 7, Issue 5, May 2017 88 ISSN 2250-3153
www.ijsrp.org
11. Katerji N, van Hoorn J.W, Hamdy A, Mastrorilli M. (2003): Salinity effect on crop
development and yield, analysis of salt tolerance according to several classification methods.
Agric Water Manage 62: 37–66
12. Mott, Hay and Anderson Consulting Engineers (1988): Shear rules for the assesment of
concrete bridge structures,Contractors Report Copy ID: 54046000280907, Library: SSR,
Location: SSR-SHELF, Mott Macdonald Consultants Limited
13. Zhang, Y., and Xu, B. (2014): Spatiotemporal analysis of land use/cover changes in Nanchang
area, China. International Journal of Digital Earth, 1-22; doi: 10.1080/17538947.2014.894145