Embed Size (px)
Citation preview

t
C&tf- lo/los-^/o*) UCRL-JC-104531 PREPRINT
OVERVIEW OF CHEMICAL MODELING OF NUCLEAR WASTE GLASS DISSOLUTION
William L. Bourcier
This paper was prepared for the Materials Research Society 1990 Fall Meeting
Boston, MA November 26 - December 1,1990
Manuscript date: November 1990 Publication date: February 1991
ThUbapreprintofapap«riiitciidcdforpublicaHoninaJo«iiiatorpfOcccdinfs.S]iice changes may be made before publication, this preprint is made available with (be understandine, thai it will not be cited or reproduced without the permission of me author.
MASTER DISTRIDUTION OF THIS DOCUMENT IS UNLIMITED
DISCLAIMER
This document was prepared as an account of work sponsored by an agency of the United States Government. Neither the United states Government nor the University of California nor any of their employees, makes any warranty, express or implied, or assumes any legal liability or responsibility for the accuracy, completeness, or usefu ness of any information, apparatus, product, or process disclosed, o represents that its use would not infringe privately owned rights. Reference herein to any specific commercial products, process, or service by trade name, trademark, manufacturer, or otherwise, does not necessarily constitute or imply its endorsement, recommendation, or favor.ng by the United States Government or the University of California. The views and opinions of authors expressed herein do not necessarily state or reflect those of the United States Government or the University of California, and shall not be used for advertising or product endorsement purposes.
Prepared by Yucca Mountain Site Characterization Project (YMP) participants as part of the Civilian Radioactive Waste Management program. The Yucca Mountain Site Characterization Project is managed by the Yucca Mountain Site Characterization Project Office of the U.S. Department of Energy, Las Vegas, Nevada.
OVERVIEW OF CHEMICAL MODELING OP NUCLEAR. WASTE GLASS DISSOLUTION UCRL-JC—10
WILLIAM L. BOURCIER DE91 009625 Lawrence Livermore National Laboratory, L-219, Livermore, CA 94550
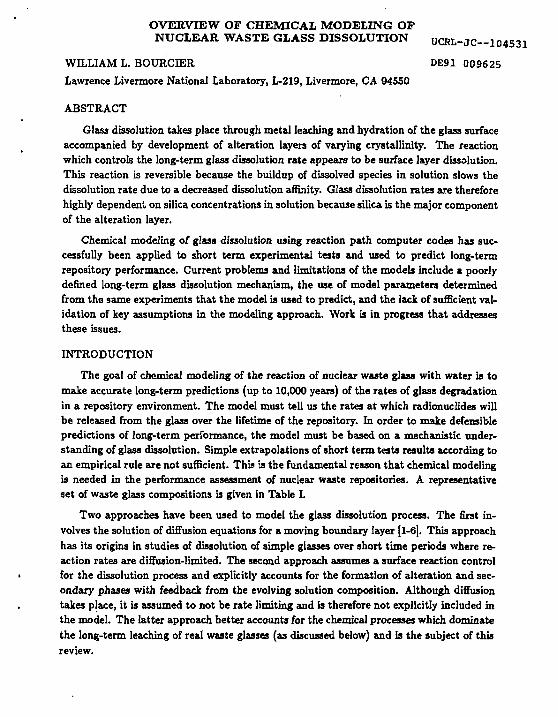
ABSTRACT
Glass dissolution takes place through metal leaching and hydration of the glass surface accompanied by development of alteration layers of varying crystallinity. The reaction which controls the long-term glass dissolution rate appears to be surface layer dissolution. This reaction is reversible because the buildup of dissolved species in solution slows the dissolution rate due to a decreased dissolution affinity. Glass dissolution rates are therefore highly dependent on silica concentrations in solution because silica is the major component of the alteration layer.
Chemical modeling of glass dissolution using reaction path computer codes has successfully been applied to short term experimental tests and used to predict long-term repository performance. Current problems and limitations of the models include a poorly defined long-term glass dissolution mechanism, the use of model parameters determined from the same experiments that the model is used to predict, and the lack of sufficient validation of key assumptions in the modeling approach. Work is in progress that addresses these issues.
INTRODUCTION
The goal of chemical modeling of the reaction of nuclear waste glass with water is to make accurate long-term predictions (up to 10,000 years) of the rates of glass degradation in a repository environment. The model must tell us the rates at which radionuclides will be released from the glass over the lifetime of the repository. In order to make defensible predictions of long-term performance, the model must be based on a mechanistic understanding of glass dbsolution. Simple extrapolations of short term tests results according to an empirical rule are not sufficient. This is the fundamental reason that chemical modeling is needed in the performance assessment of nuclear waste repositories. A representative set of waste glass compositions is given in Table I.
Two approaches have been used to model the glass dissolution process. The first involves the solution of diffusion equations for a moving boundary layer [1-6]. This approach has its origins in studies of dissolution of simple glasses over short time periods where reaction rates are diffusion-limited. The second approach assumes a surface reaction control for the dissolution process and explicitly accounts for the formation of alteration and secondary phases with feedback from the evolving solution composition. Although diffusion takes place, it is assumed to not be rate limiting and is therefore not explicitly included in the model. The latter approach better accounts for the chemical processes which dominate the long-term leaching of real waste glasses (as discussed below) and is the subject of this review.
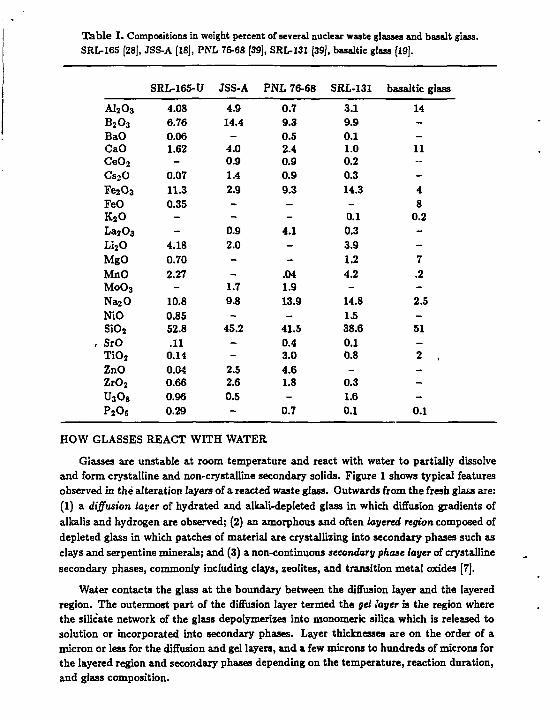
Table I. Compositions in weight percent of several nuclear waste glasses and basalt glass. SRL-165 [28], JSS-A [18], PNL 76-68 [39], SRL-131 [39], basaltic glass [19].
SRL-165-U JSS-A PNL 76-68 SRL-131 basaltic glass
A l 2 o 3 4.08 4.9 0.7 3.1 14 B 2 o 3
6.76 14.4 9.3 9.9 -BaO 0.06 - 0.5 0.1 -CaO 1.62 4.0 2.4 1.0 11 C e 0 2 - 0.9 0.9 0.2 --Cs s O 0.07 1.4 0.9 0.3 -Fe20 3 11.3 2.9 9.3 14.3 4 FeO 0.35 - - - 8 K 2 0 - - - 0.1 0.2 La203 - 0.9 4.1 0.3 -L i 2 0 4.18 2.0 - 3.9 -MgO 0.70 - - 1.2 7 MnO 2.27 - .04 4.2 .2 M0O3 - 1.7 1.9 - -N a 2 0 10.8 9.8 13.9 14.8 2.5 NiO 0.85 - - 1.5 -S i 0 2 52.8 45.2 41.5 38.6 51
, SrO .11 - 0.4 0.1 -T i 0 2 0.14 - 3.0 0.8 2 ZnO 0.C4 2.5 4.6 - -Z r 0 2 0.66 2.6 1.8 0.3 -U 3 0 8 0.96 0.5 - 1.6 -P 2 0 5 0.29 - 0.7 0.1 0.1
HOW GLASSES REACT WITH WATER
Glasses are unstable at room temperature and react with water to partially dissolve and form crystalline and non-crystalline secondary solids. Figure 1 shows typical features observed in the alteration layers of a reacted waste glass. Outwards from the fresh glass are: (1) a diffusion layer of hydrated and alkali-depleted glass in which diffusion gradients of alkalis and hydrogen are observed; (2) an amorphous and often layered region composed of depleted glass in which patches of material are crystallizing into secondary phases such as clays and serpentine minerals; and (3) a non-continuous secondary phase layer of crystalline secondary phases, commonly including clays, zeolites, and transition metal oxides [7].
Water contacts the glass at the boundary between the diffusion layer and the layered region. The outermost part of the diffusion layer termed the gel layer is the region where the silicate network of the glass depolymerizes into monomeric silica which is released to solution or incorporated into secondary phases. Layer thicknesses are on the order of a micron or less for the diffusion and gel layers, and a few microns to hundreds of microns for the layered region and secondary phases depending on the temperature, reaction duration, and glass composition.
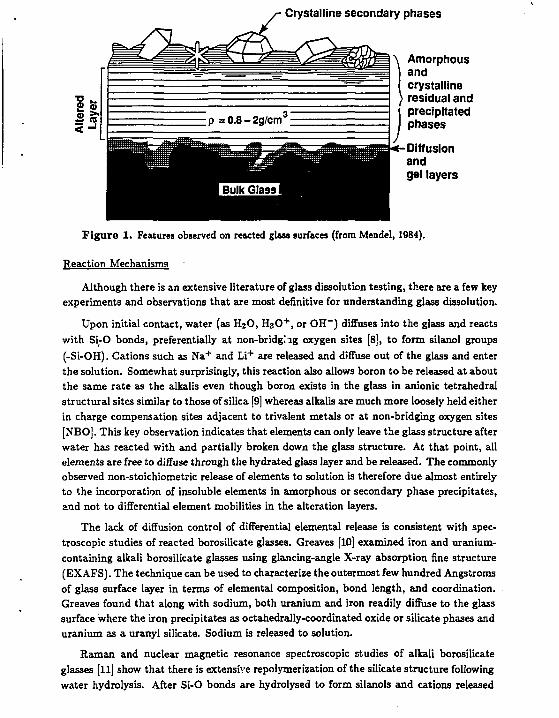
Figure 1. Features observed on reacted glass surfaces (from Mendel, 1984).
Reaction Mechanisms
Although there is an extensive literature of glass dissolution testing, there are a few key experiments and observations that are most definitive for understanding glass dissolution.
Upon initial contact, water (as H2O, HaO + , or OH - ) diffuses into the glass and reacts with Si-O bonds, preferentially at non-bridging oxygen sites [8], to form silanol groups (-Si-OH). Cations such as Na + and Li + are released and diffuse out of the glass and enter the solution. Somewhat surprisingly, this reaction also allows boron to be released at about the same rate as the alkalis even though boron exists in the glass in anionic tetrahedral structural sites similar to those of silica [9] whereas alkalis are much more loosely held either in charge compensation sites adjacent to trivalent metals or at non-bridging oxygen sites [NBO]. This key observation indicates that elements can only leave the glass structure after water has reacted with and partially broken down the glass structure. At that point, all elements are free to diffuse through the hydrated glass layer and be released. The commonly observed non-stoichiometric release of elements to solution is therefore due almost entirely to the incorporation of insoluble elements in amorphous or secondary phase precipitates, and not to differential element mobilities in the alteration layers.
The lack of diffusion control of differential elemental release is consistent with spectroscopic studies of reacted borosilicate glasses. Greaves [10] examined iron and uranium-containing alkali borosilicate glasses using glancing-angle X-ray absorption fine structure (EXAFS). The technique can be used to characterize the outermost few hundred Angstroms of glass surface layer in terms of elemental composition, bond length, and coordination. Greaves found that along with sodium, both uranium and iron readily diffuse to the glass surface where the iron precipitates as octahedrally-coordinated oxide or silicate phases and uranium as a uranyl silicate. Sodium is released to solution.
Raman and nuclear magnetic resonance spectroscopic studies of alkali borosilicate glasses [11] show that there is extensive repolymerization of the silicate structure following water hydrolysis. After Si-0 bonds are hydrolysed to form silanols and cations released
from the glass, the structure quickly reforms through condensation of the silasols. The evidence for this is that 1 7 0 doped into the leachant is found later to be present in Si- 1 70 groups in the gel layer. During leaching, the hydrated glass apparently opens up and kicks out unwanted metals and repolymerizes to form a more stable hydrous gel. This gel layer eventually reacts again with water at the water-gel boundary to dissolve completely into monomeric silicic acid. During this hydrolysis process, all cations not incorporated intc the condensed gel structure are free to diffuse out into solution.
Many of the metals released from the glass during gel layer formation do not go into solution. Analytical electron microscopic (AEM) investigations of the surface layers of reacted nuclear waste glasses [7,12] indicate that they quickly precipitate in surface layers composed of such phases as di- and tri-octahedral smectites, serpentines, and transition metal oxides and silicates. Commonly, the initial precipitates are amorphous hydrosilicates that with time segregate into distinct crystalline phases. This is consistent with analyses of leachants in glass dissolution tests where the relatively insoluble elements (i.e. Al, Fe, Mn, Ca) are released much less quickly and do not build up in solution as do the soluble elements (i.e. B, Na, Li).
The layer of amorphous and crystalline secondary phases does not appear to provide a diffusion barrier controlling reaction rate. AEM investigations [7,13,14] show that these layers appear to contain numerous channelways for transport of aqueous species, and the layers readily flake off of reacted glass samples indicating that they do not provide a coherent transport boundary over the glass surface.
Strong evidence for the lack of control of reaction rate by transport through the alteration layers comes from leaching experiments of PNL 76-68 glass at a variety of surface area to volume (SA/V) ratios [15,16]. In spite of the fact that the leached layers were much thicker in the low SA/V tests, the leach rates were identical when normalized by their SA/V ratio. Control of release rates by diffusion through the leached layer is not consistent with this observation.
Further evidence comes from experiments where the leached layer was physically removed from the glass sample and the sample then replaced into the same test vessel [17]. The release rates were relatively unchanged, again indicating the lack of control by transport though the altered layers.
Surface Reaction Control of Dissolution Rate
The surface dissolution reaction apparently controls the overall dissolution rate of nuclear waste glasses [18-22]. This hypothesis is consistent with most observations of nuclear waste glass dissolution tests under neutral to alkaline pH conditions. In particular, it explains the observation of an 'affinity effect' in dissolution rates where the dissolution rates decrease as the concentration of silica builds up in solution. It is the buildup of species in solution that serves to 'saturate' the solution with respect to the dissolving glass and decrease the dissolution rate. In flow-through tests where there is no build-up of species in solution [23], the limiting rate is constant and does not decrease with time. In tests where the leachant is doped with silica, the rate of dissolution decreases drastically [18,24].
Even the rate of release of boron to solution, an element not approaching saturation with respect to any boron phase, decreases in experiments where the leachant is enriched in silica [15]. This indicates that the rates of release of all elements of the glass, regardless of solubility characteristics, are decreased uniformly by the affinity effect.
Further evidence for surface reaction rate control is provided by studies of leaching rates of sodium silicate glasses in D 2 0 solutions [24]. The lower rates of reaction in D2O were best explained as being due to a rate limiting step in the hydrolysis of the silicate matrix, i.e. the surface reaction rate. If the activated complex for this hydrolysis reaction involved breaking an O-H (or O-D) bond, a decrease in rate identical to the amount observed is predicted from a statistics! mechanical calculation of the difference in bond vibration frequencies between O-H and O-D bonds.
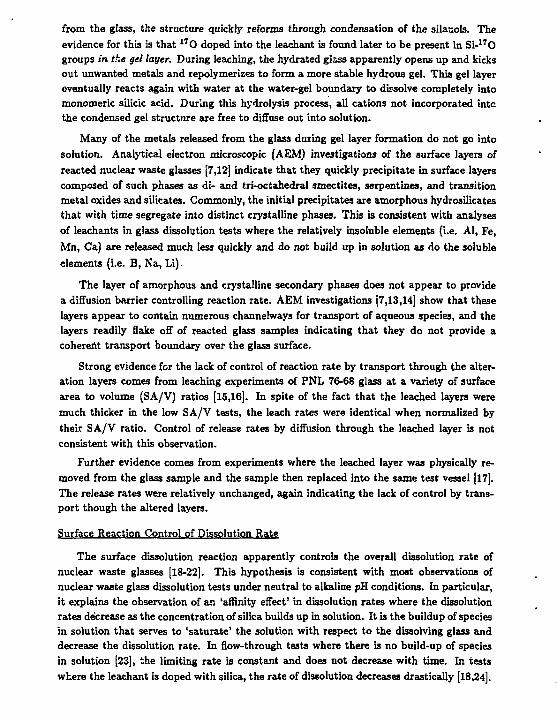
The isotope data of Pederson [24] also show no change in isotope effect during several hours of reaction (see Figure 2). If the rate limiting reaction had changed from diffusion control to surface reaction control during that period, there should be a corresponding shift in isotope effect. In spite of the fact that the release data for sodium followed a parabolic-looking path (see Figure 2), the reaction rate apparently was controlled at all times by the surface reaction rate as modified by the affinity effect due to increasing silica concentrations in solution.
Time (mln) Time (mln.) Figure 2. (a) Log plot of extent of reaction (measured as cumulative hydrogen consumption) for leaching of sodium silicate glass in water and D2O. The separation in the leaching curves remained constant through both stages of reaction, the curved and linear parts of the release curves shown in (b), indicating no change in rate-controlling mechanism throughout the reaction (from Pederson [24]).
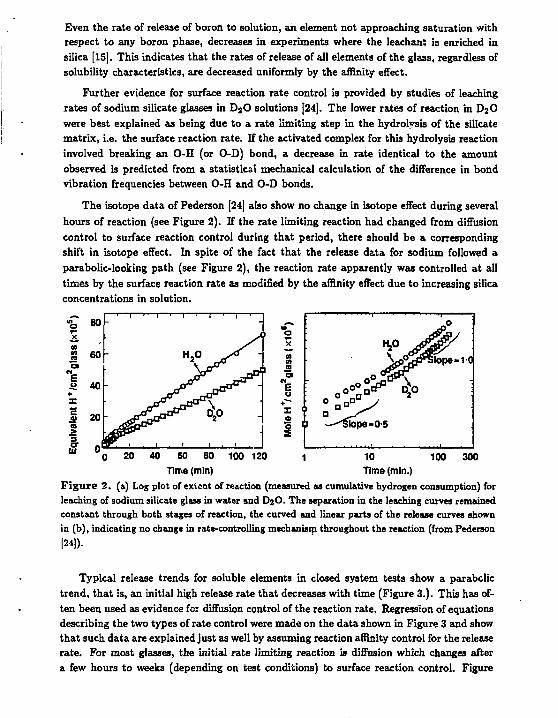
Typical release trends for soluble elements in closed system tests show a parabolic trend, that is, an initial high release rate that decreases with time (Figure 3.). This has often been used as evidence fc: diffusion control of the reaction rate. Regression of equations describing the two types of rate control were made on the data shown in Figure 3 and show that such data are explained just as well by assuming reaction affinity control for the release rate. For most glasses, the initial rate limiting reaction is diffusion which changes after a few hours to weeks (depending on test conditions) to surface reaction control. Figure
t . 1 1 I I , 1 , I , I I , I I I , , L_ i 1 !__• I 0 6 12 18 24 30
time (days) Figure 3. Cumulative release of silica from SRL-165 glass leached in 0.003 molal sodium bicarbonate (solid diamonds). Curves are regressed on data using equations for diffusion (rate = A + Bt 1/ 2 and surface affinity control (rate = Ak/(1-Q/K)), where A and B are fitting parameters.
3 clearly indicates that resolving this changeover will be difficult or impossible, and that calling on the leaching trends to distinguish between the two mechanisms is unwarranted.
Effect of Glass Composition
Rates of ionic and water diffusion through glass are very dependent on glass composition. In glasses very impermeable to water, the rate of reaction of some simple glasses is clearly controlled by diffusion of alkalis in ion exchange reactions. The diffusion constants for alkalis in the glass as measured by ionic conductivity are identical to values calculated from the leach experiments assuming diffusion-limited release [2]. Most waste glasses (which Doremus [2] would term 'anomalous') do not share this behavior. Instead, their measured diffusion rates are much faster due to diffusion taking place through a much more permeable layer.
Most studies directed at the effects of glass composition on glass durability to date have not clearly separated the effect of glass composition from that of other parameters. For example, the multitude of leach tests on waste glasses of a wide variety of compositions in MCC-1 and -3 experiments are not optimum for this purpose. The compositional effect cannot be separated from the effect of differing solution chemistry as the tests proceed.
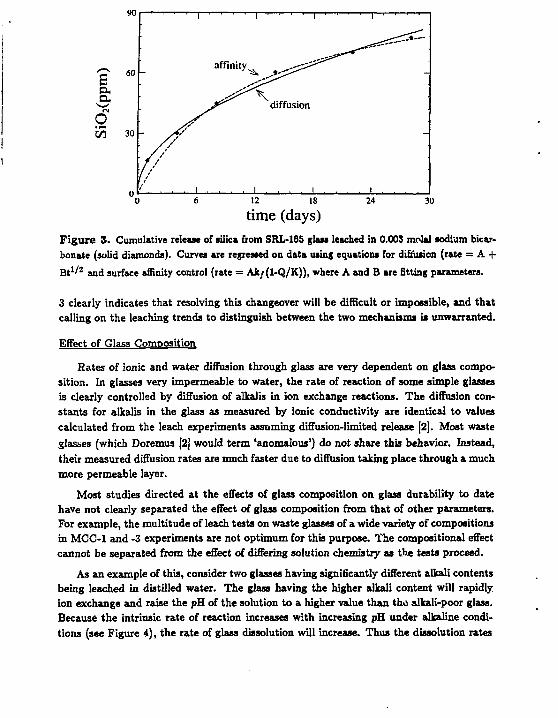
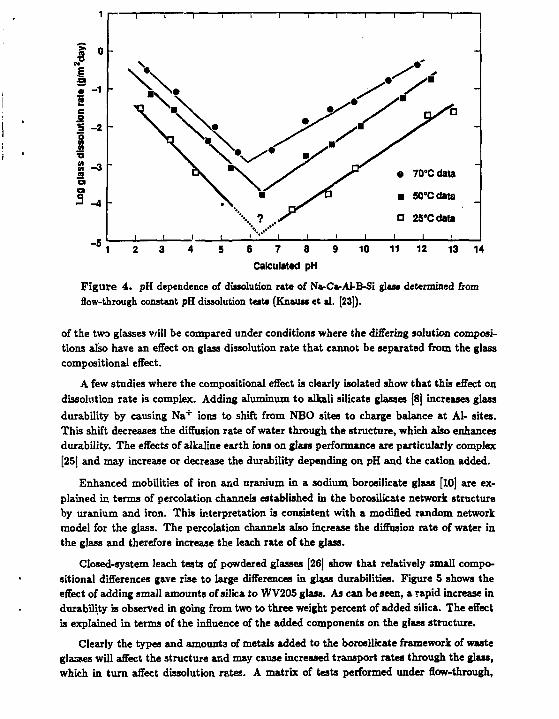
As an example of this, consider two glasses having significantly different alkali contents being leached in distilled water. The glass having the higher alkali content will rapidly, ion exchange and raise the pH of the solution to a higher value than tha alkali-poor glass. Because the intrinsic rate of reaction increases with increasing pH under alkaline conditions (see Figure 4), the rate of glass dissolution will increase. Thus the dissolution rates
T — — i 1 1 1 1 1 i 1 r
\ 1 ^X o 25'Cdata
i ' ' ' | V i i i i i • • " 1 2 3 4 5 6 7 8 9 10 11 12 13 14
Calculated pH
Figure 4. pH dependence of dissolution rate of NvCa-Al-B-Si glass determined from flow-through constant pH dissolution tests (Knauw et al. [23]).
of the two glasses v/ill be compared under conditions where the differing solution compositions also have an effect on glass dissolution rate that cannot be separated from the glass compositional effect.
A few studies where the compositional effect is clearly isolated show that this effect on dissolution rate is complex. Adding aluminum to alkali silicate glasses [8] increases glass durability by causing Na + ions to shift from NBO sites to charge balance at Al- sites. This shift decreases the diffusion rate of water through the structure, which also enhances durability. The effects of alkaline earth ions on glass performance are particularly complex [25] and may increase or decrease the durability depending on pH and the cation added.
Enhanced mobilities of iron and uranium in a sodium borosilicate glass [10] are explained in terms of percolation channeb established in the borosilicate network structure by uranium and iron. This interpretation is consistent with a modified random network model for the glass. The percolation channels also increase the diffusion rate of water in the glass and therefore increase the leach rate of the glass.
Closed-system leach tests of powdered glasses [26] show that relatively small compositional differences gave rise to large differences in glass durabilities. Figure 5 shows the effect of adding small amounts of silica to WV205 glass. As can be seen, a rapid increase in durability is observed in going from two to three weight percent of added silica. The effect is explained in terms of the influence of the added components on the glass structure.
Clearly the types and amounts of metals added to the borosilicate framework of waste glasses will affect the structure and may cause increased transport rates through the glass, which in turn affect dissolution rates. A matrix of tests performed under flow-through,
n •Q
C 2 S -2 S
s^
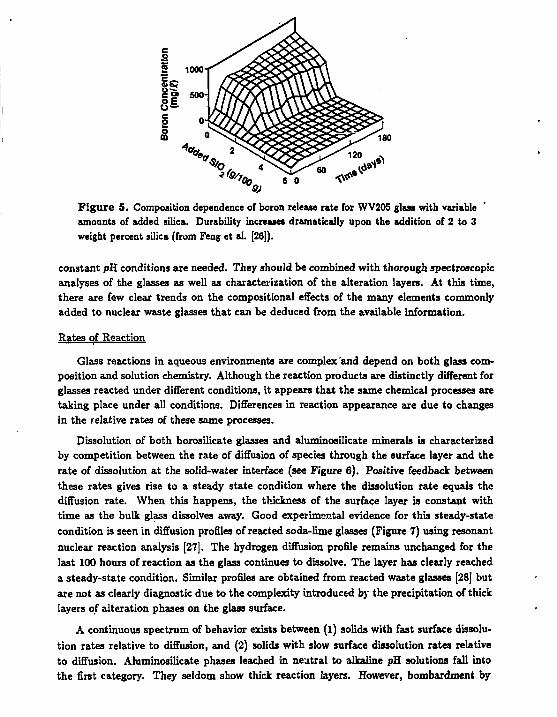
Figure 5. Composition dependence of boron release rate for WV205 glass with variable amounts of added silica. Durability increases dramatically upon the addition of 2 to 3 weight percent silica (from Feng et al. [26]).
constant pH conditions are needed. They should be combined with thorough spectroscopic analyses of the glasses as well as characterization of the alteration layers. At this time, there are few clear trends on the compositional effects of the many elements commonly added to nuclear waste glasses that can be deduced from the available information.
Rates of Reaction
Glass reactions in aqueous environments are complex 'and depend on both glass composition and solution chemistry. Although the reaction products are distinctly different for glasses reacted under different conditions, it appears that the same chemical processes are taking place under all conditions. Differences in reaction appearance are due to changes in the relative rates of these same processes.
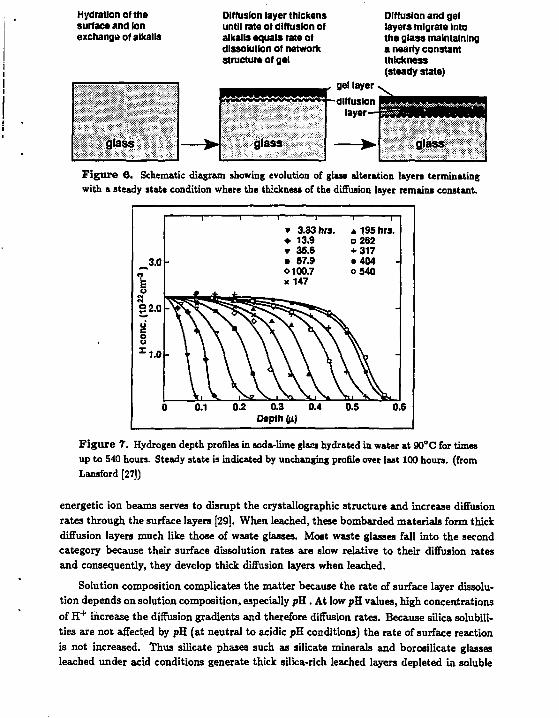
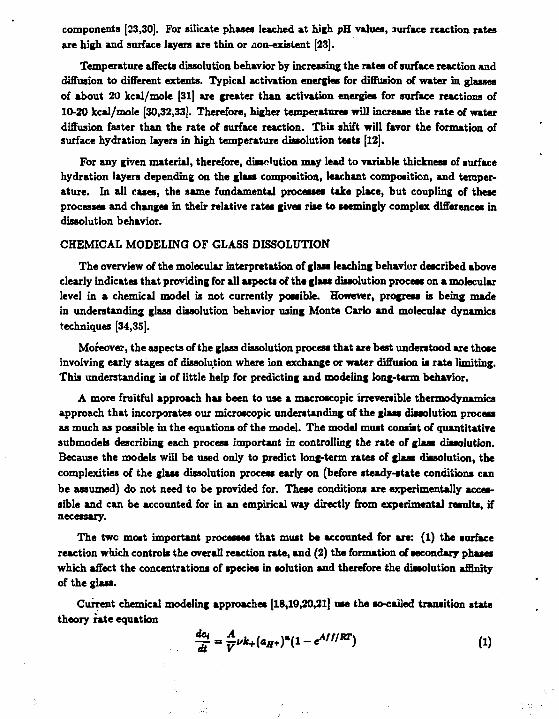
Dissolution of both borosilicate glasses and aluminosilicate minerals is characterized by competition between the rate of diffusion of species through the surface layer and the rate of dissolution at the solid-water interface (see Figure 6). Positive feedback between these rates gives rise to a steady state condition where the dissolution rate equals the diffusion rate. When this happens, the thickness of the surface layer is constant with time as the bulk glass dissolves away. Good experimental evidence for this steady-state condition is seen in diffusion profiles of reacted soda-lime glasses (Figure 7) using resonant nuclear reaction analysis [27]. The hydrogen diffusion profile remains unchanged for the last 100 hours of reaction as the glass continues to dissolve. The layer has clearly reached a steady-state condition. Similar profiles are obtained from reacted waste glasses [28] but are not as clearly diagnostic due to the complexity introduced by the precipitation of thick layers of alteration phases on the glass surface.
A continuous spectrum of behavior exists between (1) solids with fast surface dissolution rates relative to diffusion, and (2) solids with slow surface dissolution rates relative to diffusion. Aluminosilicate phases leached in neutral to alkaline pE solutions fall into the first category. They seldom show thick reaction layers. However, bombardment by
Hydration of the surface and Ion exchange ot alkalis
Diffusion layer thickens until rate of diffusion of alkalis equals rate of dissolution of network structure of gel
gel layer
diffusion layer'
Diffusion and gel layers migrate into the glass maintaining a nearly constant thickness (steady state)
^^^^hf^^^^^^r^^^^H
glass
Figure 6. Schematic diagram showing evolution of glass alteration layers terminating with a steady state condition where the thickness of the diffusion layer remains constant.
l i i i v 3.83 hra.
i i * l 9 5 h r s .
• 13.9 o262 v 35.6 + 317
3.0 • 67.9 • 404
I O100.7 o540 I x 147 V
V*
°2.0 o \ \ \ >» ^ ? S \ * s \ i » x \ j ^ c o u
s 1 . 0
( Vi V X f V i V V i \ V, v ^ i
s 1 . 0
( ) 0.1 0.2 0.3 0.4 0.5 0.6 Depth (fi)
Figure 7. Hydrogen depth profiles in soda-lime glass hydrated in water at 90° C for times up to 540 hours. Steady state ia indicated by unchanging profile over last 100 hours, (from Lansford [27])
energetic ion beams serves to disrupt the crystallographic structure and increase diffusion rates through the surface layers [29]. When leached, these bombarded materials form thick diffusion layers much like those of waste glasses. Most waste glasses fall into the second category because their surface dissolution rates are slow relative to their diffusion rates and consequently, they develop thick diffusion layers when leached.
Solution composition complicates the matter because the rate of surface layer dissolution depends on solution composition, especially pH . At low pH values, high concentrations of H + increase the diffusion gradients and therefore diffusion rates. Because silica solubilities are not affected by pH (at neutral to acidic pB. conditions) the rate of surface reaction is not increased. Thus silicate phases such as silicate minerals and borosilicate glasses leached under acid conditions generate thick silica-rich leached layers depleted in soluble
components [23,30]. For silicate phases leached at high pB. values, surface reaction rates are high and surface layers are thin or non-existent [23].
Temperature affects dissolution behavior by increasing the rates of surface reaction and diffusion to different extents. Typical activation energies for diffusion of water in glasses of about 20 kcal/mole [31] are greater than activation energies for surface reactions of 10-20 kcal/mole [30,32,33]. Therefore, higher temperatures will increase the rate of water diffusion faster than the rate of surface reaction. This shift will favor the formation of surface hydration layers in high temperature dissolution tests [12].
For any given material, therefore, dissolution may lead to variable thickness of surface hydration layers depending on the glass composition, leachant composition, and temperature. In all cases, the same fundamental processes take place, but coupling of these processes and changes in their relative rates gives rise to seemingly complex differences in dissolution behavior.
CHEMICAL MODELING OF GLASS DISSOLUTION
The overview of the molecular interpretation of glass leaching behavior described above clearly indicates that providing for all aspects of the glass dissolution process on a molecular level in a chemical model is not currently possible. However, progress is being made in understanding glass dissolution behavior using Monte Carlo and molecular dynamics techniques [34,35].
Moreover, the aspects of the glass dissolution process that are best understood are those involving early stages of dissolution where ion exchange or water diffusion is rate limiting. This understanding is of little help for predicting and modeling long-term behavior.
A more fruitful approach has been to use a macroscopic irreversible thermodynamics approach that incorporates our microscopic understanding of the glass dissolution process as much as possible in the equations of the model. The model must consist of quantitative submodels describing each process important in controlling the rate of glass dissolution. Because the models will be used only to predict long-term rates of glass dissolution, the complexities of the glass dissolution process early on (before steady-state conditions can be assumed) do not need to be provided for. These conditions are experimentally accessible and can be accounted for in an empirical way directly from experimental results, if necessary.
The two moat important processes that must be accounted for are: (1) the surface reaction which controls the overall reaction rate, and (2) the formation of secondary phases which affect the concentrations of species in solution and therefore the dissolution affinity of the glass.
Current chemical modeling approaches [18,19,20,21] use the so-cailed transition state theory rate equation
| = ^ t + M « ( i - / ' ^ ) (i)
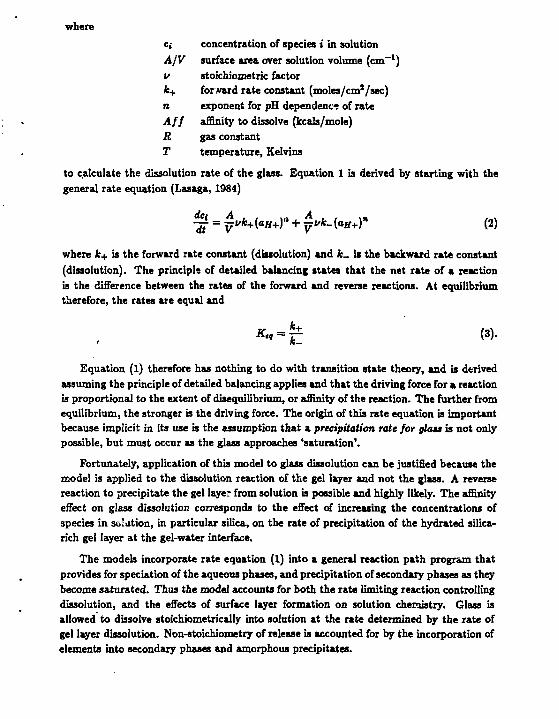
where Ci concentration of species i in solution A/V surface area over solution volume (cm - 1) V stoichiometric factor K forward rate constant (moles/cm2 /sec) n exponent for pH dependent? of rate Aff affinity to dissolve (kcals/mole) R gas constant T temperature, Kelvins
to calculate the dissolution rate of the glass. Equation 1 is derived by starting with the general rate equation (Lasaga, 1984)
§ = ̂ M«*+)" + 7"^(«H+)" (2)
where Jfc+ is the forward rate constant (dissolution) and fc_ is the backward rate constant (dissolution). The principle of detailed balancing states that the net rate of a reaction is the difference between the rates of the forward and reverse reactions. At equilibrium therefore, the rates are equal and
K"> = lt (3)-Equation (l) therefore has nothing to do with transition state theory, and is derived
assuming the principle of detailed balancing applies and that the driving force for a reaction is proportional to the extent of disequilibrium, or affinity of the reaction. The further from equilibrium, the stronger is the driving force. The origin of this rate equation is important because implicit in its use is the assumption that a precipitation rate for glatt is not only possible, but must occur as the glass approaches 'saturation'.
Fortunately, application of this model to glass dissolution can be justified because the model is applied to the dissolution reaction of the gel layer and not the glass. A reverse reaction to precipitate the gel layer from solution is possible and highly likely. The affinity effect on glass dissolution corresponds to the effect of increasing the concentrations of species in solution, in particular silica, on the rate of precipitation of the hydrated silica-rich gel layer at the gel-water interface.
The models incorporate rate equation (1) into a general reaction path program that provides for speciation of the aqueous phases, and precipitation of secondary phases as they become saturated. Thus the model accounts for both the rate limiting reaction controlling dissolution, and the effects of surface layer formation on solution chemistry. Glass is allowed to dissolve stoichiometrically into solution at the rate determined by the rate of gel layer dissolution. Non-stoichiometry of release is accounted for by the incorporation of elements into secondary phases and amorphous precipitates.
Limitations of Current Models
Current models use parameters that are regressed from the data that are to be modeled. That is, the same experiments are used both to regress model parameters (such as rate constants and silica saturation values) and to validate the final model. A defensible model must use parameters derived from experiments different from experiments used to test the model. If similar experiments are used both to derive model parameters and test the model, it follows only that the model is consistent with the data, not that the data prove the correctness of the model. The more varied and different the set of experiments the model can correctly simulate, the more confidence one can have in the model. Current modeling work can only predict a narrow range of experimental results that are similar to the experiments used to generate model parameters. This does not constitute validation of the model.
The ultimate chemical process responsible for controlling the long-term dissolution rate has not been identified. The Grambow model [IS] includes the concept of 'residual affinity' which is used to explain the continued dissolution even after 'silica saturation'. This mechanism has no physical basis and therefore cannot be quantified in the model, except as a fitting parameter to short-term test results. The gel layer model [20] avoids this problem with the hidden assumption that the affinity effect caused by the depletion of elements in solution due to secondary phase formation will always be much greater than any effect due to the glass being an inherently thermodynamically unstable solid. In other words, the gel layer will never become saturated so there is no need to try to describe how fast glass will dissolve under conditions where it approaches saturation. Neither of these approaches is acceptable. The former approach has been successfully used to model a variety of short-term test results. However, the correctness of the long-term rate cannot be tested. The latter approach can be tested experimentally, but if it fails, it provides no further options.
Current models of aluminosilicate dissolution have shown that interpretations of solid dissolution rates are simplified by incorporating surface chemistry in the analysis. However, few of our current glass dissolution models include surface chemistry [36]. In addition, after thick assemblages of reaction products accumulate it is likely that the local chemical environment at the glass surface will be different from the bulk solution [37]. It will be controlled by surface complexation reactions in the restricted channelways near the glass surface. Consequently, the rates of reaction will be influenced by the conditions of these localized environments which in turn are controlled by the surface chemistry. The types of secondary phases that form will also be affected by this chemistry. Surface chemistiy needs to be accounted for in our models
Effects of Secondary Phases
It is not currently possible to predict which secondary phases will form in glass dissolution tests, or the rates at which they nucleate and grow. Although the thern Jynamically most stable phases can be predicted by running the reaction path programs, they rarely predict the phases actually observed in the tests. Current modeling is usually performed using a restricted set of phases known to form in real systems [IS].
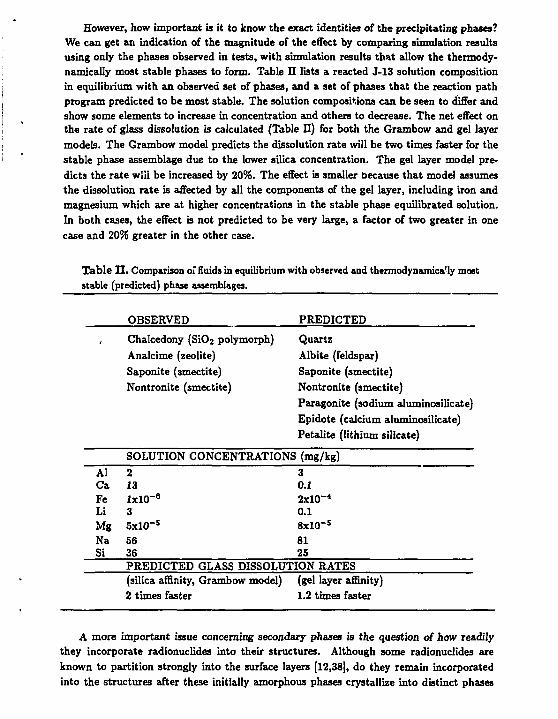
However, how important is it to know the exact identities of the precipitating phases? We can get an indication of the magnitude of the effect by comparing simulation results using only the phases observed in tests, with simulation results that allow the thermody-namically most stable phases to form. Table II lists a reacted J-13 solution composition in equilibrium with an observed set of phases, and a set of phases that the reaction path program predicted to be most stable. The solution compositions can be seen to differ and show some elements to increase in concentration and others to decrease. The net effect on the rate of glass dissolution is calculated (Table II) for both the Grambow and gel layer models. The Grambow model predicts the dissolution rate will be two times faster for the stable phase assemblage due to the lower silica concentration. The gel layer model predicts the rate will be increased by 20%. The effect is smaller because that model assumes the dissolution rate is affected by all the components of the gel layer, including iron and magnesium which are at higher concentrations in the stable phase equilibrated solution. In both cases, the effect is not predicted to be very large, a factor of two greater in one case and 20% greater in the other case.
Table II. Comparison ot fluids in equilibrium with observed and thermodynamica'ly moat stable (predicted) phase assemblages.
OBSERVED PREDICTED , Chalcedony (SiOj polymorph) Quartz
Analcime (zeolite) Albite (feldspar) Saponite (smectite) Saponite (smectite) Nontronite (smectite) Nontronite (smectite)
Paragonite (sodium aluminosilicate) Epidote (calcium aluminosilicate) Petalite (lithium silicate)
SOLUTION CONCENTRATIONS (mg/kg) Al 2 3 Ca 13 0.1 Fe lx lO - 6 2xl0~ 4
Li 3 0.1 Mg 5 x l 0 - 5 8xl0- 5
Na 56 81 Si 36 25
PREDICTED GLASS DISSOLUTION RATES (silica affinity, Grambow model) (gel layer affinity) 2 times faster 1.2 times faster
A more important issue concerning secondary phases is the question of how readily they incorporate radionuclides into their structures. Although some radionuclides are known to partition strongly into the surface layers [12,38], do they remain incorporated into the structures after these initially amorphous phases crystallize into distinct phases

with aging? More work on the solubilities of radionuclides in host mineral phases is needed to address this question.
Long-term Effects
When current kinetic parameters measured in the laboratory are extrapolated to natural systems, they predict rates of reactions up to several orders of magnitude faster than those observed in nature [39]. Several reasons for this discrepancy have been proposed: (1) the minerals do not remain in contact with water or are cut off from water flow, therefore affecting estimates of true reaction times; (2) the mineral surfaces are poisoned by adsorbed species (for example, phosphate adsorbed on calcite surfaces drastically reduces its dissolution rate); and (3) surface layers form on the mineral surfaces and armor the minerals from further reaction.
The reason for this discrepancy is not known. It is clearly important to understand it in order to know whether a similar slowdown of dissolution Tate is to be expected when comparing glass dissolution rates in the laboratory with those in nature. Studies of natural analogues for glass (such as basaltic glass, [39]) may help in this regard.
SUMMARY AND CONCLUSIONS
Hydrolysis of Si-0 bonds by water initiates glass dissolution and causes the formation of a hydrous reacted layer. Elements released during hydrolysis diffuse outwards into solution while the hydrous altered layer re-polymerizes. The overall rate of reaction appears to be controlled by the rate of dissolution of the re-polymerized hydrous surface layer. Secondary phases consisting of elements present in the leachate and elements released from the glass precipitate from solution or segregate from amorphous material on the glass surface. These alteration layers do not appear to provide a transport barrier.
Current models for glass dissolution combine a rate equation derived from irreversible thermodynamics with reaction path computer codes that account for solution speciation and precipitation of solids. Although these models account for the major features observed in short-term dissolution tests of waste glasses, there remain uncertainties when extrapolating these models to long time periods. The most critical of these uncertainties is that of the nature of the chemical process which determines the long-term dissolution rate of the glass.
ACKNOWLEDGEMENTS
This work was performed under activity D-20-37 of the Yucca Mountain Project Glass Wasteform Task (YMP WBS element 1.2.2.3.1.2, not quality affecting), sponsored by the DOE Office of Civilian Radioactive Waste Management at the Lawrence Livermore National Laboratory under contract W-7405-ENG-48.
REFERENCES 1. R. H. Doremus, J. Non-cryst. Solids. IS, 137 (1975).
2. R. H. Doremus, J. Non-cryst. Solids. 55., 143 (1983).
3. Richard M. Wallace and George G. Wicks, Mat. Res. Soc. Symp. Proc. 1£ 23 (1983).
4. K. B. Harvey, C. D. Litke, and C. A. Boase, Physics and Chem. of Glasses. 27, 15 (1986).
5. T. Banba, T. Murakami, and H. Kimura, Mat. Res. Soc. Symp. Proc. 44,113 (1985).
6. P. L. Chambre, C. H. Kang, W. W.-L. Lee, and T. H. Pigford, Mat. Res. Soc. Symp. Proc. 112, 85 (1988).
7. T. A. Abrajano, J. K. Bates, A. B. Woodland, J. P. Bradley, and W. L. Bourcier, Clays and Clay Minerals, in press, (1991).
8. B. M. J. Smets, and T. P. A. Lommen, Physics and Chem. of Glasses. 23, 83 (1982).
9. B. C. Bunker, D. R. Tallant, R. J. Kirkpatrick, and G. L. Turner, Physics and Chem. of Glasses. 31, (1990).
10. G. N. Greaves, J. Noncryst. Solids. 122, 108 (1990).
11. B. C. Bunker, D. R. Tallant, T. J. Headley, G. L. Turner, and R. J. Kirkpatrick, Physics and Chem. of Glasses. 29, 106 (1988).
12. J.-C. Petit, G. Delia Mea, J.-C. Dran, M.-C. Magonthier, P. A. Mando, and A. Paccagnella, Geochim. et Cosmochim. Acta. 54, 1941 (1990).
13. W. Lutze, in Radioactive Waste Forms For the Future, edited by W. Lutze and R. C. Ewing (North Holland, New York, 1988), p. 1.
14. T. Murakami, R. C. Ewing, and B. C. Bunker, Mat. Res. Soc. Symp. Proc. U2> 737 (1988).
15. L. R. Pederson, C. Q. Buckwalter, G. L. McVay, and B. L. Riddle, Mat. Res. Soc. Symp. Proc. 15,, 4 (1983).
16. L. A. Chick, and L. R. Pederson, Mat. Res. Soc. Symp. Proc. 2S, 635 (1984).
17. B. Grambow, Glastechn. Ber. 56K, Bd. 1, p. 566, (1983).
18. B. Grambow, Nuclear Waste Glass Dissolution: Mechanism. Model, and Application. JSS Project Report 87-02,102 p. (1987).
19. J. L. Crovisier, J. Honnorez, and J. P. Eberhart, Geochim. et Cosmochim. Acta. 51, 2977 (1987).
20. W. L. Bourcier, D. W. Peiffer, K. G. Knauss, K. D. McKeegan and D. K. Smith, Mat. Res. Soc. Symp. Proc. US, 209 (1990).
21. T. Advocat, J. L. Crovisier, B. Fritz, and E. Vernaz, Mat. Res. Soc. Symp. Proc. 176: 241 (1990).
22. E. Mouche, and E. Vernaz. Mat. Res. Soc. Symp. Proc. U2, 703 (1988).
23. K. Knauss, W. L. Bourcier, K. D. McKeegan, C. I. Merzbacher, S. N. Nguyen, F. J. Ryerson, D. K. Smith, H. C. Weed, and L. Newton, Mat. Res. Soc. Symp. Proc. 176. 371 (1990).
24. L. R. Pederson, Physics and Chem. of Glasses. 28. 17 (1987).
25. J. O. Isard and W. Muller, Physics and Chem. of Glasses. 21, 55 (1986).
26. X. Feng, I. L. Pegg, A. Barkatt, P. B. Macedo, S. J. Cucinell and S. Lai, Nuclear Technology. 72., 239 (1990).
27. W. A. Lanford, K. Davis, P. Lamarche, T. Laursen, and R. Groleau, J. Noncryst. Solids. 22, 249 (1979).
28. T. A. Abrajano, and J. K. Bates, Mat. Res. Soc. Symp. Proc. 84, 533 (1987).
29. J.-C. Petit, J.-C. Dran, A. Paccagnella, and G. Delia Mea, Earth and Planetary Science Letters. §2, 292 (1989).
30. K. G. Knauss and T. J. Wolery, Geochim. et Cosmochim. Acta. 52, 2481 (1986).
31. B. M. J. Smets, M. G. W. Tholen, and T. P. A. Lommen, J. Noncryst. Solids. 65, 319 (1984).
32. B. J. Wood, and J. V. Walther, Science. 222, 413 (1983).
33. W. M. Murphy, and H. C. Helgeson, Am. J. Science. 212, 17 (1989).
34. S. H. Garofalini, J. Noncryst. Solids. 120, 1 (1990).
35. J.-C. Dran, Y. Langevin, E. Doorhyee, and J.-C. Petit, Mat. Res. Soc. Symp. Proc. 84, 559 (1987).
36. Cheng-Tsin Lee, Ph.D. thesis, University of Florida, 1986.
37. W. H. Casey , and B. Bunker, Leaching of mineral and glass surfaces during dissolution, in Mineral-Water Interface Gecchenastry, odited by M Hoche'la and A. White (Mineralogical Society of America, 1990) pp. 397-424.
38. C. Q. Buckwalter, and L. R. Pederson, J. Am. Cer. Soc. 61, 431 (1982).
39. M. A. Velbel, Influence of surface area, surface characteristics, and solution composition on feldspar weathering rates, in Amer. Chem. Soc. Sympo. 323. p 615. (1986).
40. R. C. Ewing, Mat. Res. Soc. Symp. Proc. 84, 703 (1987).
41. B. Grambow, and D. M. Strachan, A comparison of the performance of nuclear waste glasses by modeling. Pacific Northwest Laboratories Report PNL-6698. 59 p. (1988).
Appendix A
This report does not use any information from the Reference Information Base nor contains any candidate information for the Reference Information Base or the Site and Engineering Properties Data Base (SEPDB).