Embed Size (px)
Citation preview
Overview of Characterization Methods for Submicron Particulate Matter (PM)
John Kinsey, Richard ShoresU. S. Environmental Protection AgencyOffice of Research and Development
National Risk Management Research LaboratoryAir Pollution Prevention and Control Division
October 30, 2002
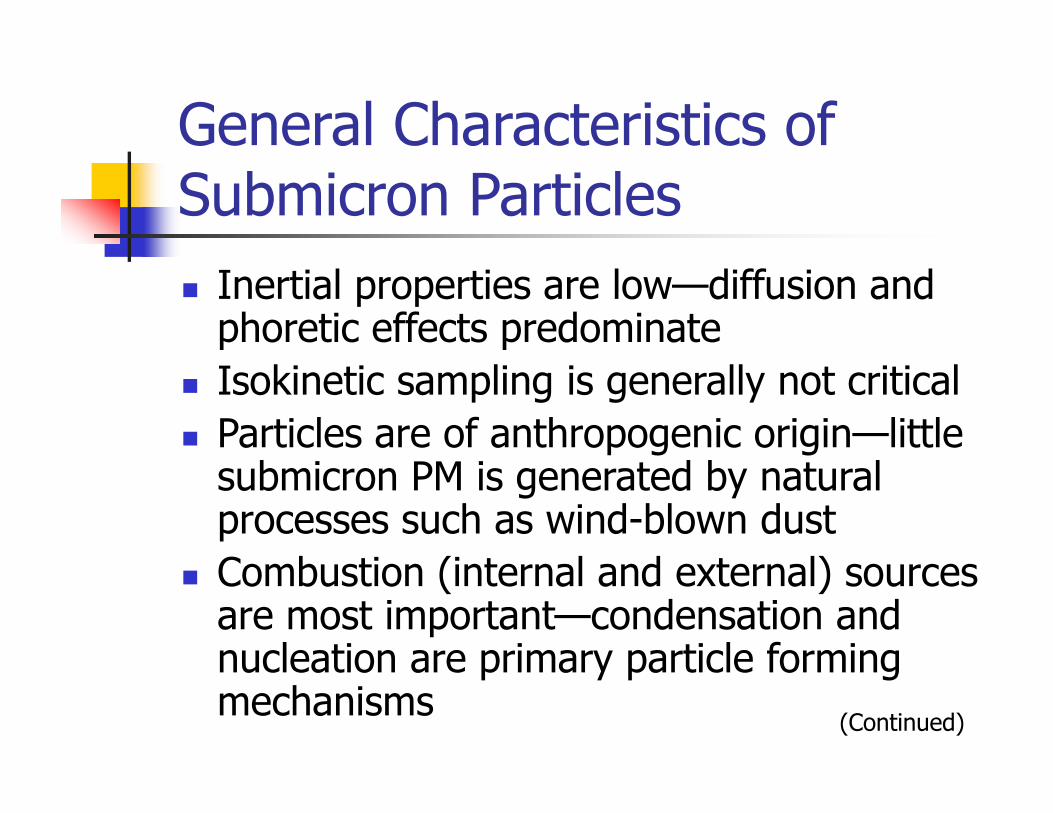
General Characteristics of Submicron Particles Inertial properties are low—diffusion and
phoretic effects predominate Isokinetic sampling is generally not critical Particles are of anthropogenic origin—little
submicron PM is generated by natural processes such as wind-blown dust
Combustion (internal and external) sources are most important—condensation and nucleation are primary particle forming mechanisms
(Continued)
Characteristics (continued) Particle size distribution tends to be both
lognormal and bimodal (nuclei and accumulation modes)
Characterization of submicron PM is far more difficult than for supermicron PM requiring sophisticated methods and equipment
Particle number concentration could be more important than mass concentration in health effects studies
On-Line Mass Measurement Techniques
Tapered-element oscillating microbalance (TEOM)
Quartz-crystal microbalance (QCM) Beta-attenuation mass monitors Mass transfer of volatiles—on/off
collected sample is important in PM mass measurements
On-Line Techniques for Number Concentration
Aerosol photometers Condensation nuclei counters (CNCs) In-situ single-particle optical counters
and ensemble analysis techniques Extractive instruments generally
limited to low particle concentrations—usually requires diluted sample stream
Techniques for Particle Size Distribution Measurement Electrical, quartz-crystal, and manual
low-pressure cascade impactors (~ 30 nm to 10 m aerodynamic diameter)
Laser velocimeters (> 0.5 m aerodynamic diameter)
Scanning mobility particle sizer (differential mobility analyzer + CNC; 2 to ~ 500 nm electrical mobility diameter)
(Continued)
Particle Size Distribution (continued) Serial- and parallel-flow diffusion
batteries (with and without CNCs) Single-particle optical counters Data reduction and interpretation for
most particle sizing instruments require considerable expertise especially when comparing data from different instruments
Manual Sample Collection/Analysis Techniques Filter sampling (e.g., prefired quartz
filters for elemental/organic carbon) Electrostatic and thermal precipitators Scanning electron microscopy (with and
without X-ray analysis for elemental composition)
Electron microscopy can provide physical verification of other measurement techniques within certain limitations

On-Line Chemical Characterization Methods Photoelectric ionization sensors for
polycyclic aromatic hydrocarbons Optical attenuation instruments for
“black” and “blue” carbon Automated thermal/CO2 analyzers for
elemental/organic carbon On-line analyzers can provide near real-
time results but must be validated against manual method for each source
Chemical Characterization of Collected Samples Elemental/organic carbon by NIOSH Method
5040 Elemental composition by X-ray diffraction or
X-ray fluorescence Water-soluble ions (e.g., SO3
-) by ion chromatography
Organic speciation by gas chromatography/mass spectroscopy
Sample analyses are generally expensive and time consuming
Calibration Issues Most analyzers for submicron PM are
essentially “black boxes” requiring substantial operator experience
Calibration standards for nanoparticles are limited at best
Dynamic instrument calibration is both expensive and difficult to implement
Conversions between various particle conventions (e.g., aerodynamic diameter to electrical mobility diameter) require numerous assumptions and associated potential errors
Sources Recently Tested by APPCD
Heavy-duty diesel engines Residential wood stoves and
fireplaces Biomass burning Wood- and wood-waste-fired
boilers

Contact Information
John Kinsey, Richard ShoresU. S. Environmental Protection Agency (MD E343-02)National Risk Management Research LaboratoryAir Pollution Prevention and Control Division Research Triangle Park, NC 27711(919) 541-4121, (919) [email protected], [email protected]
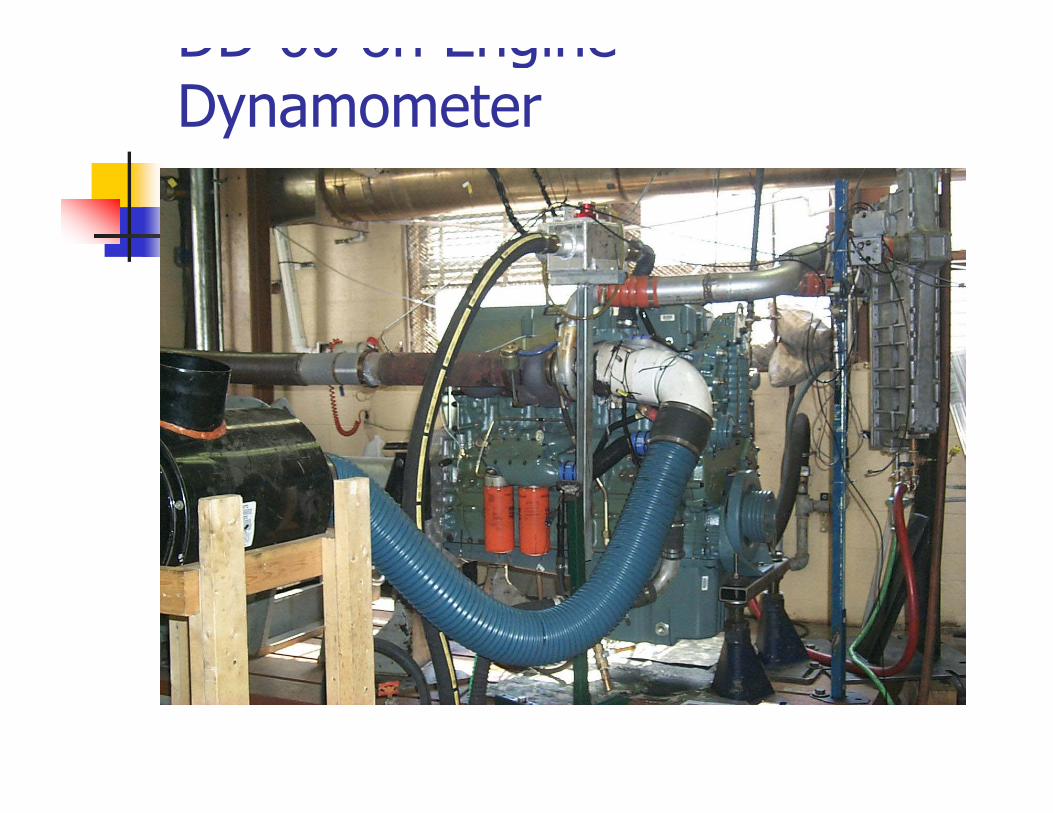
DD 60 on Engine Dynamometer
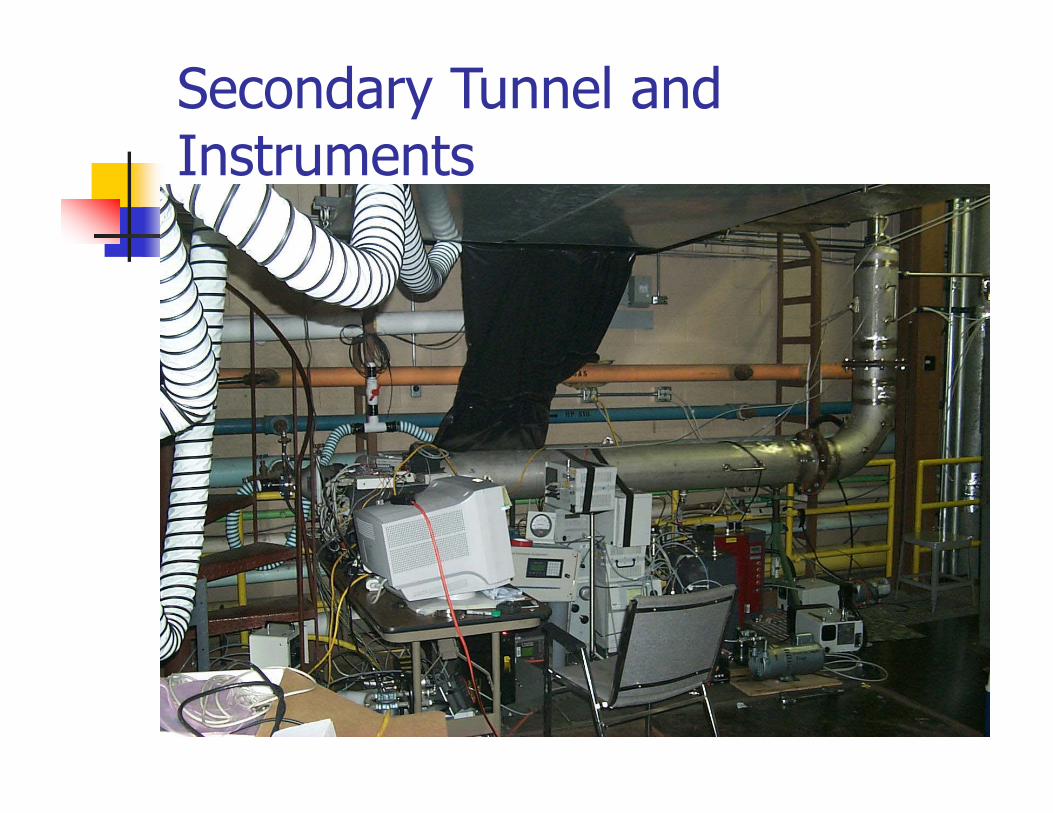
Secondary Tunnel and Instruments
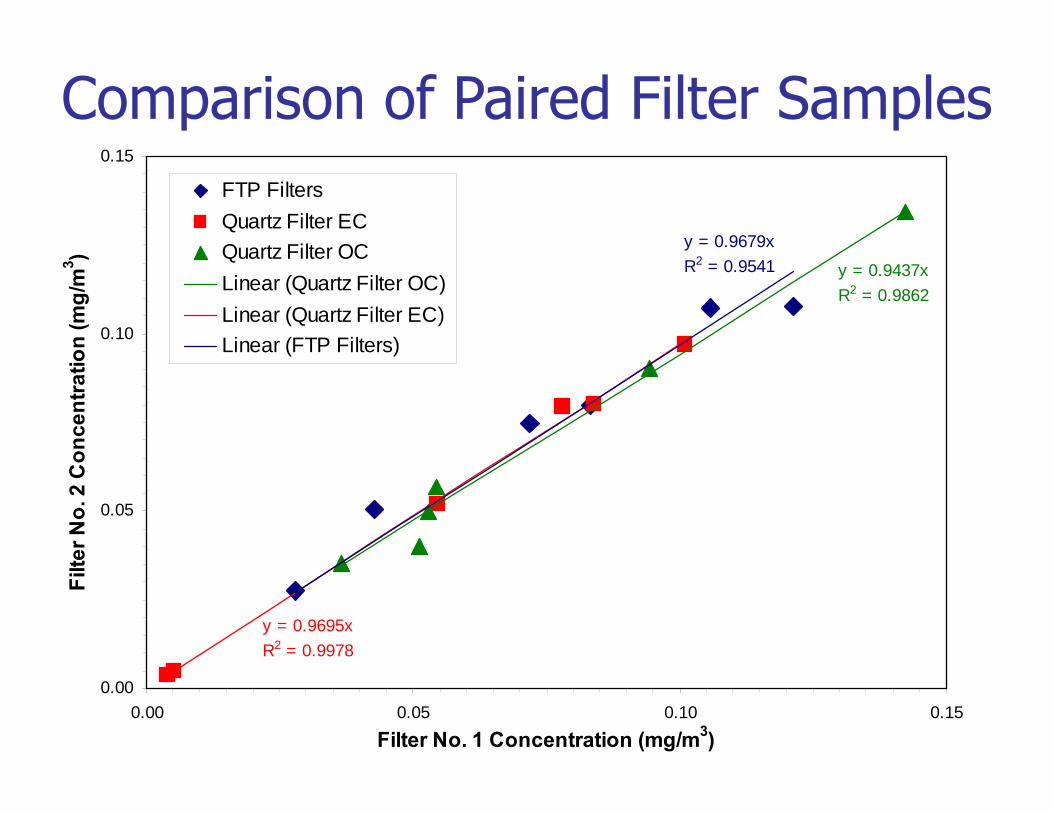
Comparison of Paired Filter Samples
y = 0.9437xR2 = 0.9862
y = 0.9695xR2 = 0.9978
y = 0.9679xR2 = 0.9541
0.00
0.05
0.10
0.15
0.00 0.05 0.10 0.15
Filter No. 1 Concentration (mg/m3)
Filte
r No.
2 C
once
ntra
tion
(mg/
m3 )
FTP FiltersQuartz Filter ECQuartz Filter OCLinear (Quartz Filter OC)Linear (Quartz Filter EC)Linear (FTP Filters)
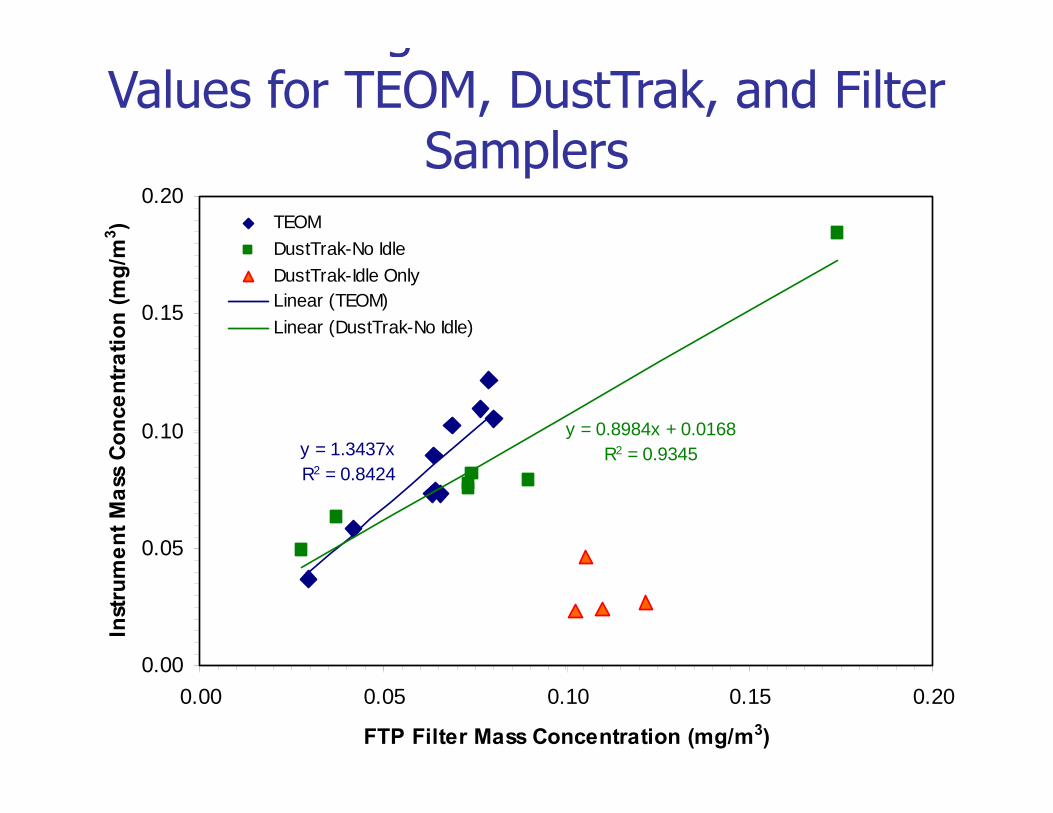
gValues for TEOM, DustTrak, and Filter
Samplers
y = 1.3437xR2 = 0.8424
y = 0.8984x + 0.0168R2 = 0.9345
0.00
0.05
0.10
0.15
0.20
0.00 0.05 0.10 0.15 0.20
FTP Filter Mass Concentration (mg/m3)
Inst
rum
ent M
ass
Conc
entra
tion
(mg/
m3 ) TEOM
DustTrak-No IdleDustTrak-Idle OnlyLinear (TEOM)Linear (DustTrak-No Idle)
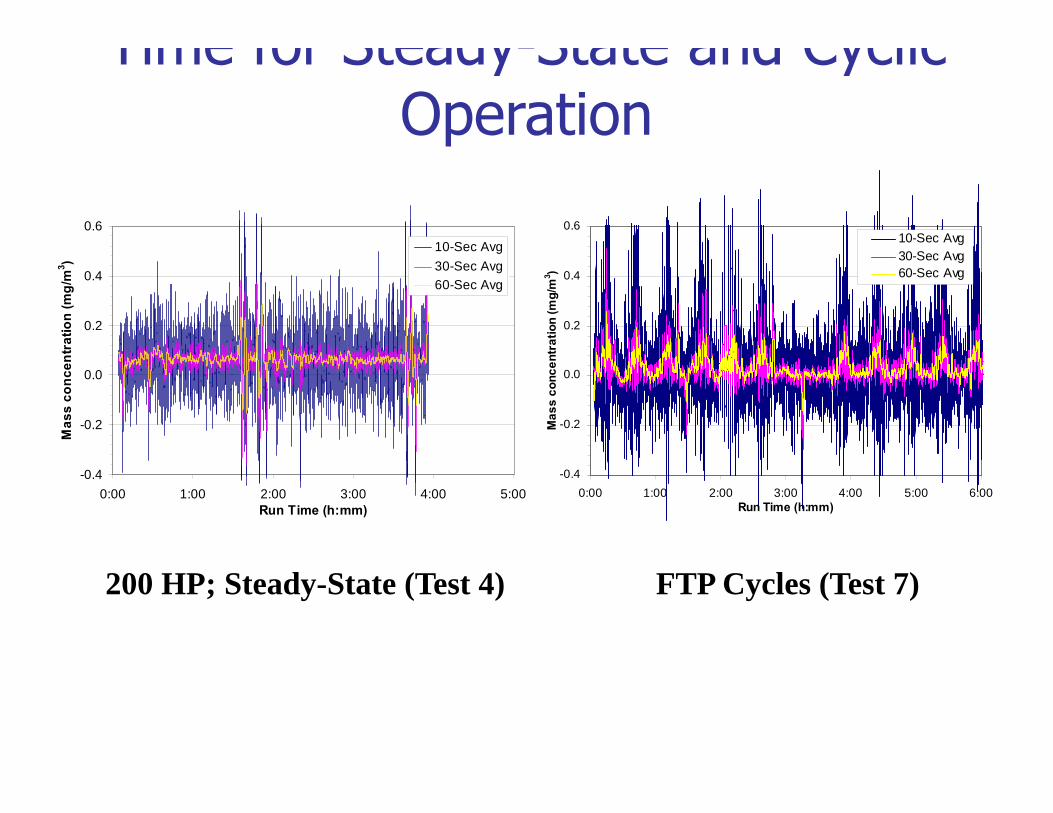
Time for Steady-State and Cyclic Operation
-0.4
-0.2
0.0
0.2
0.4
0.6
0:00 1:00 2:00 3:00 4:00 5:00Run Time (h:mm)
Mas
s co
ncen
trat
ion
(mg/
m3 )
10-Sec Avg30-Sec Avg60-Sec Avg
-0.4
-0.2
0.0
0.2
0.4
0.6
0:00 1:00 2:00 3:00 4:00 5:00 6:00Run Time (h:mm)
Mas
s co
ncen
trat
ion
(mg/
m3 )
10-Sec Avg30-Sec Avg60-Sec Avg
FTP Cycles (Test 7)200 HP; Steady-State (Test 4)
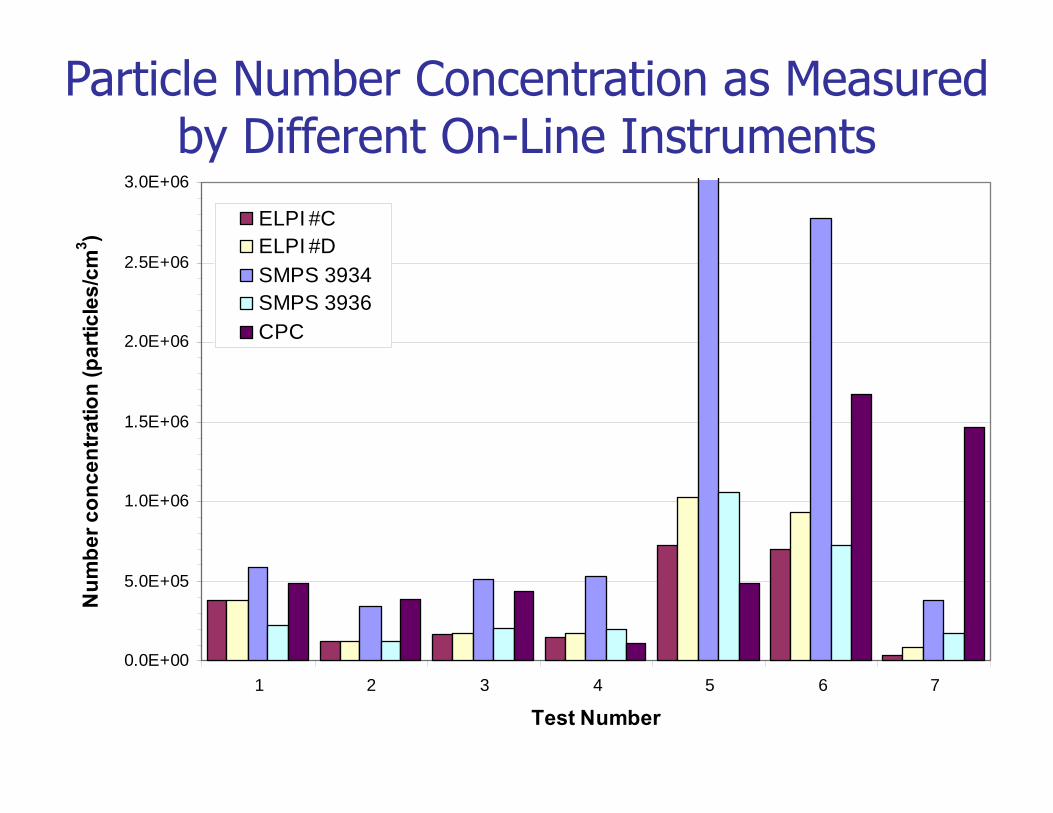
Particle Number Concentration as Measured by Different On-Line Instruments
0.0E+00
5.0E+05
1.0E+06
1.5E+06
2.0E+06
2.5E+06
3.0E+06
1 2 3 4 5 6 7
Test Number
Num
ber c
once
ntra
tion
(par
ticle
s/cm
3 )
ELPI #CELPI #DSMPS 3934SMPS 3936CPC
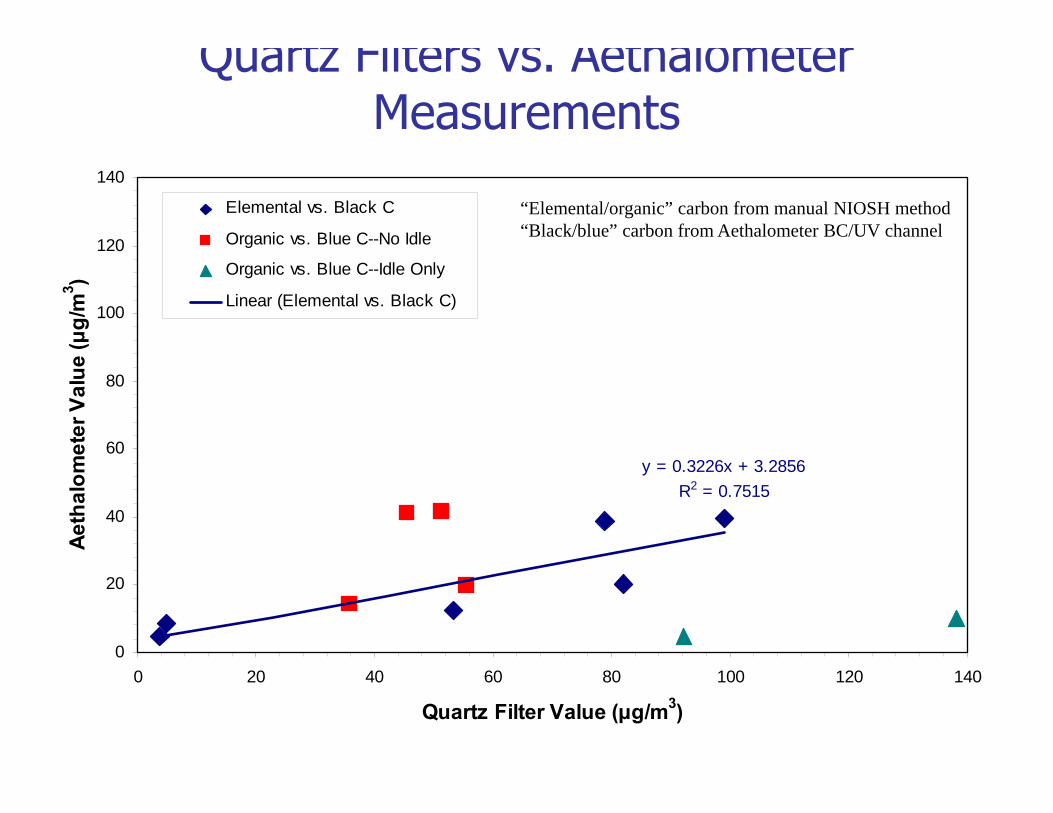
Quartz Filters vs. Aethalometer Measurements
y = 0.3226x + 3.2856R2 = 0.7515
0
20
40
60
80
100
120
140
0 20 40 60 80 100 120 140
Quartz Filter Value (μg/m3)
Aeth
alom
eter
Val
ue (μ
g/m
3 )
Elemental vs. Black C
Organic vs. Blue C--No Idle
Organic vs. Blue C--Idle Only
Linear (Elemental vs. Black C)
“Elemental/organic” carbon from manual NIOSH method“Black/blue” carbon from Aethalometer BC/UV channel
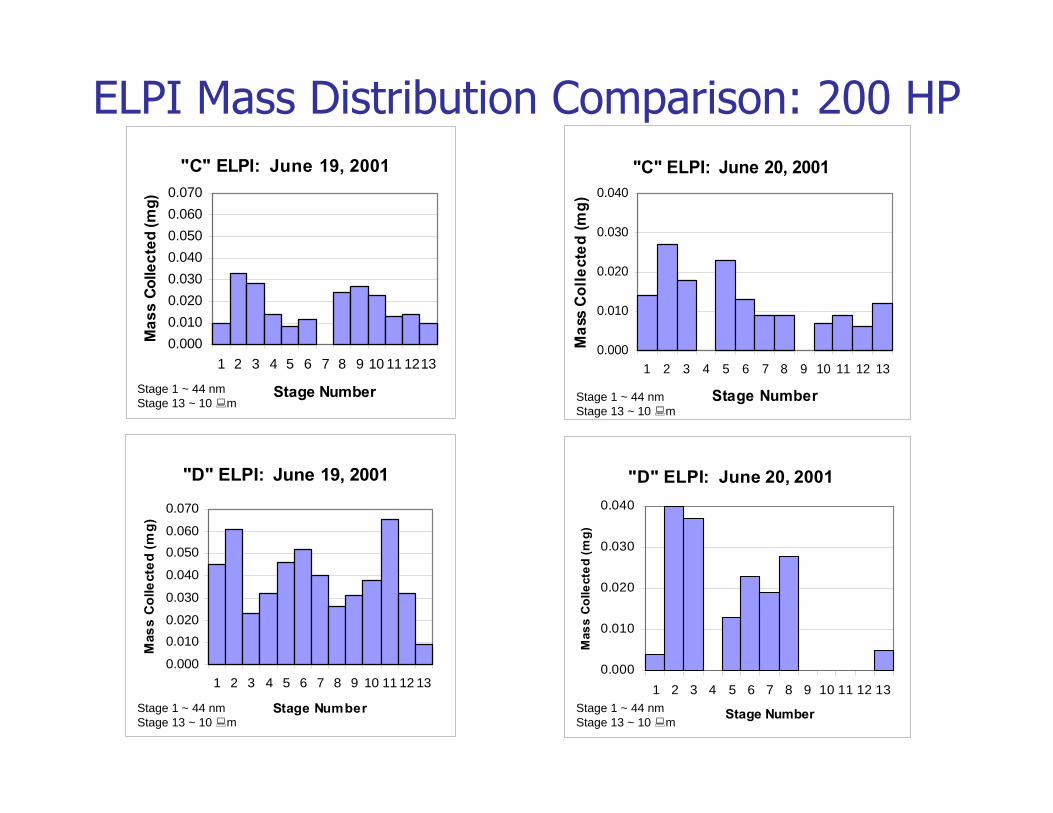
ELPI Mass Distribution Comparison: 200 HP"C" ELPI: June 19, 2001
0.0000.0100.0200.0300.0400.0500.0600.070
1 2 3 4 5 6 7 8 9 10 11 1213
Stage Number
Mas
s Co
llect
ed (m
g)
"D" ELPI: June 19, 2001
0.000
0.0100.020
0.030
0.040
0.0500.060
0.070
1 2 3 4 5 6 7 8 9 10 11 12 13
Stage Number
Mas
s C
olle
cted
(mg)
Stage 1 ~ 30 nmStage 13 ~ 10 m
Stage 1 ~ 30 nmStage 13 ~ 10 m
Stage 1 ~ 44 nmStage 13 ~ 10 m
Stage 1 ~ 44 nmStage 13 ~ 10 m
"C" ELPI: June 20, 2001
0.000
0.010
0.020
0.030
0.040
1 2 3 4 5 6 7 8 9 10 11 12 13
Stage Number
Mas
s Co
llect
ed (m
g)
"D" ELPI: June 20, 2001
0.000
0.010
0.020
0.030
0.040
1 2 3 4 5 6 7 8 9 10 11 12 13
Stage Number
Mas
s C
olle
cted
(mg)
Stage 1 ~ 44 nmStage 13 ~ 10 m
Stage 1 ~ 44 nmStage 13 ~ 10 m
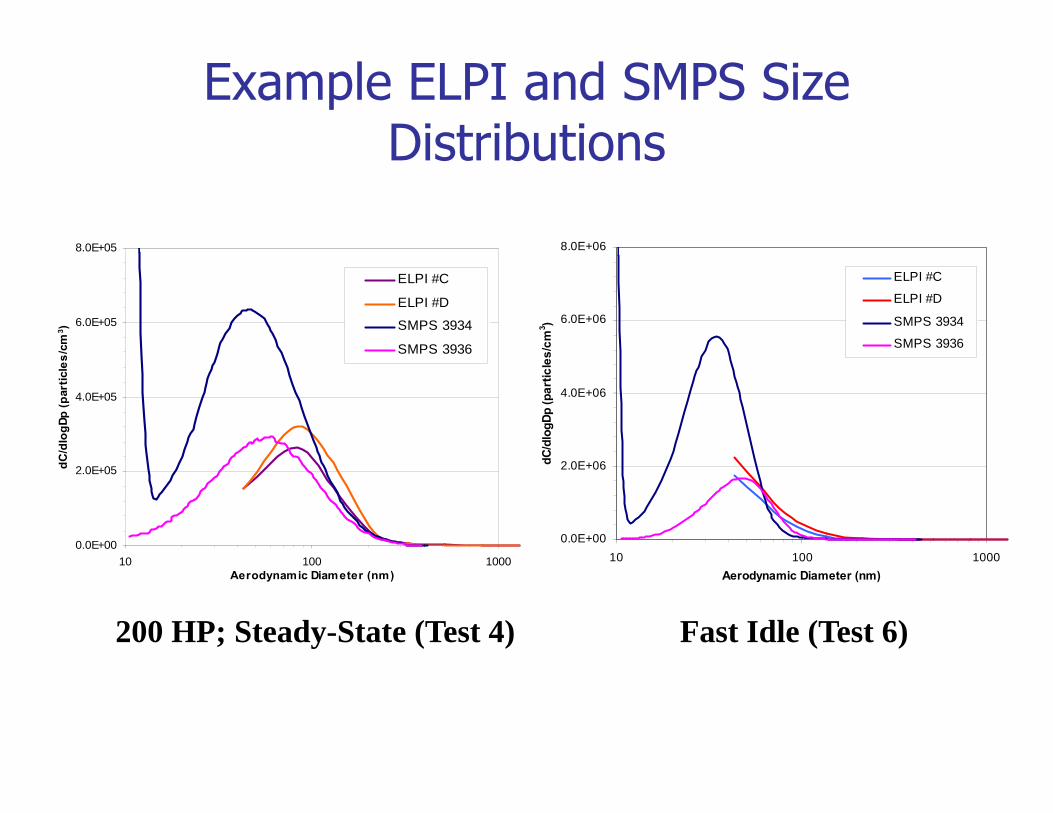
Example ELPI and SMPS Size Distributions
0.0E+00
2.0E+05
4.0E+05
6.0E+05
8.0E+05
10 100 1000Aerodynamic Diameter (nm)
dC/d
logD
p (p
artic
les/
cm3 )
ELPI #C
ELPI #D
SMPS 3934
SMPS 3936
200 HP; Steady-State (Test 4)
0.0E+00
2.0E+06
4.0E+06
6.0E+06
8.0E+06
10 100 1000Aerodynamic Diameter (nm)
dC/d
logD
p (p
artic
les/
cm3 )
ELPI #C
ELPI #D
SMPS 3934
SMPS 3936
Fast Idle (Test 6)
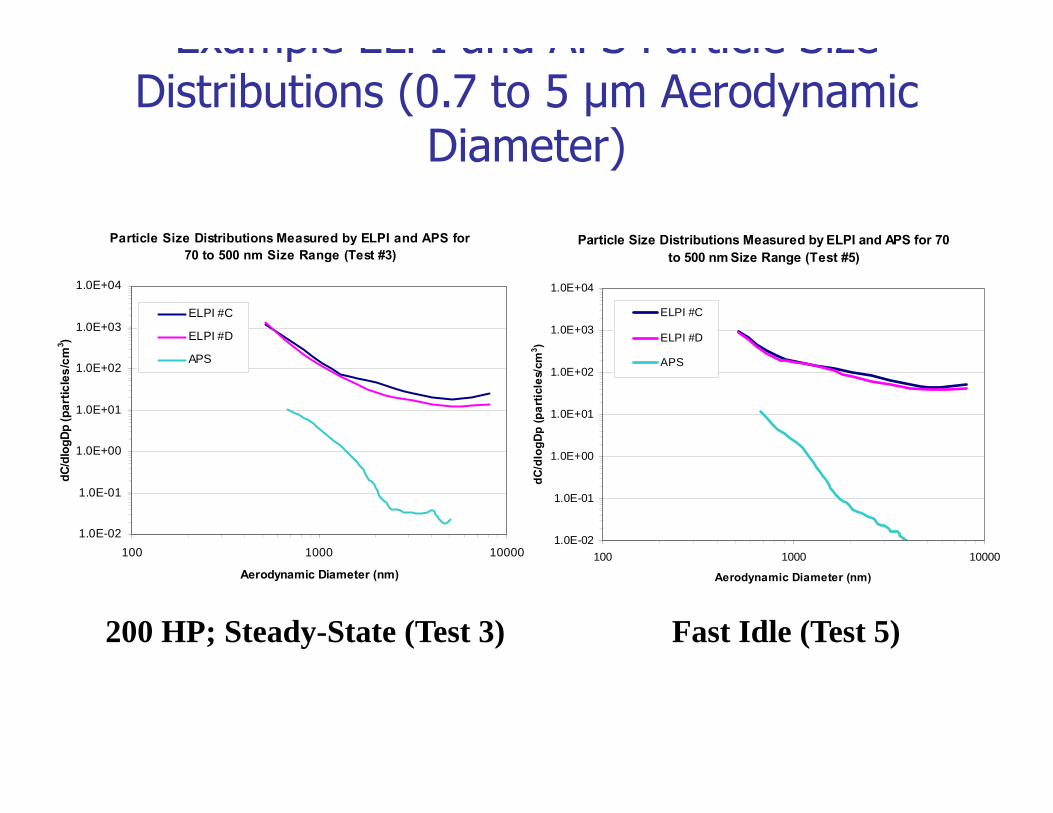
Example ELPI and APS Particle Size Distributions (0.7 to 5 μm Aerodynamic
Diameter)
Particle Size Distributions Measured by ELPI and APS for 70 to 500 nm Size Range (Test #3)
1.0E-02
1.0E-01
1.0E+00
1.0E+01
1.0E+02
1.0E+03
1.0E+04
100 1000 10000
Aerodynamic Diameter (nm)
dC/d
logD
p (p
artic
les/
cm3 )
ELPI #C
ELPI #D
APS
200 HP; Steady-State (Test 3)
Particle Size Distributions Measured by ELPI and APS for 70 to 500 nm Size Range (Test #5)
1.0E-02
1.0E-01
1.0E+00
1.0E+01
1.0E+02
1.0E+03
1.0E+04
100 1000 10000
Aerodynamic Diameter (nm)
dC/d
logD
p (p
artic
les/
cm3 )
ELPI #C
ELPI #D
APS
Fast Idle (Test 5)
Current Findings (1) Good precision was achieved during the analysis of
filter catches for split samples. Comparison of manual vs. automated methods
showed mixed results--some instruments (e.g., TEOM) correlated reasonably well, whereas others (e.g., DustTrak) were highly dependent on engine operating conditions.
Certain types of paired analyzers (e.g., SMPS) exhibited different response characteristics and/or produced substantially different results.
The 1105a TEOM provided a highly variable data output with many negative values—data are generally not useful for averaging times less than one minute.
Current Findings (2) Chemical analysis of the ELPI samples were not
conducted due to: • low sample weights;• inconsistencies in the gravimetric results between the two
instruments; and• Problems with lost samples due to poor collection substrate
preparation.
Both PAH analyzers were found to be malfunctioning after being returned to the manufacturer for post-test calibration.
Easy, inexpensive, and field-capable calibration methods/equipment are needed for all analyzer types to assure high quality data collection.
Second round of testing scheduled for November 2002 at WVU