Embed Size (px)
Citation preview

AUDIT & ASSURANCE JULY 2016
Overview of Audit Quality Indicators Initiatives
Update to December 2015 edition
INFORMATION PAPER

HIGHLIGHTS
This paper is an overview setting out audit quality indicators (AQIs) which have been developed by nine different organisations worldwide, including regulators, oversight bodies, professional bodies, and audit firms. It also provides insight into key differences between these AQIs; namely, if they are rules or principles-based, qualitative or quantitative, and whether reporting on these AQIs is made public or kept private.
With this publication, the Federation of European Accountants (the Federation) adds a European perspective to the global discussion on audit quality. AQIs can increase comparability and transparency between audits and audit firms. As audits are dealt with on a global level, an international initiative on AQIs is the best way forward. The different international stakeholders need to collaborate in order to agree on a globally accepted set of audit quality indicators.

Table of Contents
INTRODUCTION ............................................................................................................................................... 2
EXECUTIVE SUMMARY .................................................................................................................................... 3
AUDIT QUALITY ............................................................................................................................................... 4
AUDIT QUALITY INDICATORS .......................................................................................................................... 5
GRAPHICAL OVERVIEW OF AUDIT QUALITY INDICATORS ................................................................................ 6
OVERVIEW OF AUDIT QUALITY INDICATORS INITIATIVES ............................................................................... 7
1. Nederlandse Beroepsorganisatie van Accountants (NBA), Netherlands ................................................ 7
2. Federal Audit Oversight Authority (FAOA), Switzerland ........................................................................ 9
3. Financial Reporting Council (FRC) and the largest six audit firms, UK ...................................................10
4. Public Company Accounting Oversight Board (PCAOB), USA ................................................................11
5. United States Center for Audit Quality (US CAQ) .................................................................................13
6. Canadian Public Accountability Board (CPAB) ......................................................................................16
7. Chartered Accountants of Australia and New Zealand (CAANZ) ...........................................................17
8. Accounting and Corporate Regulatory Authority (ACRA), Singapore ....................................................18
9. International Organisation of Securities Commissions (IOSCO) ............................................................19
Appendix – PCAOB calculations of audit quality indicators ............................................................................21
2
INTRODUCTION
Independent audit has been part of the financial reporting supply chain for a considerable time. This has resulted in more consideration being given to the quality of an audit and what audit quality means, how it could be defined and how it could be measured. Indeed, recently, more and more emphasis has been placed on measuring audit quality by regulators, oversight bodies, professional bodies and audit firms. Even though there is currently no common approach to measuring audit quality, a number of initiatives or proposals have recently been issued by nine bodies world-wide which set out Audit Quality Indicators (AQIs) that might be used to measure audit quality.
AQIs are meant to provide a basis for comparison across different audits and audit firms. Another important potential benefit of AQIs is enhanced by the transparency of information available for discussion with those charged with governance and audit committees, for instance when selecting an audit firm. In these ways, AQIs could help audit firms to demonstrate their commitment to audit quality and foster competition. For AQIs to serve these purposes, the information acquired from AQIs needs to be comparable and to be interpreted in the correct context.
Audit quality is key to a number of the strategic priorities of the Federation; therefore, it is keen to contribute from a European perspective to the discussion around global AQIs.
Research has been conducted by the Federation to compile an overview of AQIs initiatives and proposals globally, and to provide an insight into differences in their application. However, audit quality remains an elusive construct both to define and to measure. The objective evaluation of audit quality is further complicated by the need to understand the perspective from which audit quality is assessed; an understanding of the context is essential in interpreting AQIs. Therefore, a global initiative on AQIs might be the best way to move forward as many accounting firms are global and, in addition, the overview shows there are significant differences in the individual national initiatives. To do this, the ‘ideal’ approach might be for the different stakeholders to engage and collaborate in order to develop, and finally agree on, a globally accepted set of AQIs.

3
EXECUTIVE SUMMARY
The information in this overview has been collected through research conducted by the Federation.
The findings can be summarized as follows:
• AQIs initiatives differ quite significantly throughout different countries world-wide. Some issuing bodies have suggested a more flexible, principles-based approach while others have published a mandatory, rules-based list of AQIs. Furthermore, some initiatives provide a set of up to 28 AQIs, while others suggest less than ten AQIs on which to report.
• Often, information on firm level AQIs is suggested to be made public meaning that all the key stakeholders are able to assess them. However, in other cases the information is considered to be sensitive as it is based on indicators at the specific audit engagement level, and is therefore meant to be private for audit committee use only. Not all the initiatives differentiate between the engagement and firm level.
• The issuers of the AQIs initiatives also suggest different approaches when it comes to the formulation of the indicators. While some are clearly of a quantitative nature and others are qualitative, there is also a mix of both types of information.
• The most popular audit quality indicator is the quantum of hours of training undertaken per person as it is included in eight of the initiatives. AQIs such as internal engagement quality reviews and external inspections are found in six initiatives, while the number of audit staff per audit partner, and years of experience are found in five. However, this does not mean that these indicators are ‘better’ than those appearing less frequently.
• The Nederlandse Beroepsorganisatie van Accountants (NBA) has published a practice note Disclosure of Audit Quality Factors as a follow up to its first proposed set of AQIs. The Center for Audit Quality (CAQ) has finished a global series of roundtables with audit committee members and other stakeholders on a potential set of AQIs and continues to monitor developments on the subject. The CAQ issued a report on insights gained from these discussions.
• At the time of writing, the Public Company Accounting Oversight Board (PCAOB) is still in the process of analysing the results gathered during the consultation period on its concept release and the Board has yet to take a formal decision on the next steps. In addition, the Canadian Public Accountability Board (CPAB) is reaching out to audit committees to participate in a pilot project to gather Canadian audit committee member feedback on AQIs.

4
AUDIT QUALITY
The International Auditing and Assurance Standards Board (IAASB) published a Framework For Audit Quality1 in February 2014. The Framework describes factors contributing to audit quality at engagement, audit firm and national levels, for financial statement audits. The objectives are to raise awareness of the key elements of audit quality, encourage key stakeholders explore ways to improve audit quality and facilitate a greater dialogue between them on the topic.
The IAASB’s Framework promotes the key elements of audit quality which are distinguished as follows:
a) Inputs covering such factors as values, ethics, and attitudes which are influenced by the culture of a firm; also it covers knowledge, skills, and experience of auditors as well as allocated time to complete the audit. These apply at both the engagement and firm levels as well as at national level;
b) Process covering audit processes and quality control procedures and their effect on audit quality;
c) Outputs including reports and information that are formally prepared for the purposes of audit;
d) Key interactions within the Financial Reporting Supply Chain covering formal and informal communication between stakeholders and the context which may influence those interactions; and
e) Contextual Factors including a number of environmental factors that might affect audit quality.
The term ’audit quality’ has a number of different definitions across the world; however none of them have achieved the status of a globally recognised definition. It is a complex subject and therefore it might be challenging to assess quality of the audit.
The IAASB provides a following graph to illustrate interactions of the elements of audit quality2:
1 IAASB A Framework for Audit Quality 2 IAASB A Framework For Audit Quality

5
AUDIT QUALITY INDICATORS
Audit quality indicators might be a tool to aid the assessment of audit quality. However, there are significant differences between the AQIs across the various initiatives, for instance because of differences in regulatory approach, business models that firms operate in, and other factors influencing audit quality.
For comparative purposes, the AQIs presented in the table below are expressed in generalized terms. Some of the AQIs shown in the table below are expressed either in qualitative or quantitative terms, or in both. Throughout this publication, AQIs are interchangeably referred to as ‘audit quality drivers’, ‘audit quality indicators’, ’audit quality factors’, or ‘audit quality measures’. Due to the wide diversity of AQIs and the differences in terms of their formulation, only indicators which appear at least three times throughout the identified initiatives are shown in the overview presented below.
Overview of audit quality indicators throughout different initiatives
Indicator Issuing body
NBA FAOA FRC UK3 PCAOB US
CAQ CPAB CAANZ ACRA IOSCO Total
1. Training hours per audit personnel x x x x* x x* x x* 8
2. ‘Internal engagement quality views’ x x4 x x x x 6
3. External inspections x x x x x x 6
4. Number of audit staff per audit partner x x x x* x 5
5. Years of experience x x x x x 5
6. Partner workload x5 x x x x 5
7. Industry expertise of audit personnel x x x x x 5
8. Staff workload x x x x 4
9. Investment in development of new audit methodology and tools
x x x x 4
10. Staff turnover x x x x 4
11. Independence x x x x 4
12. Technical resources support x x x x 4
13. Staff satisfaction survey x6 x x 3
14. External investigations x x x 3
15. Tone at the top x x x 3
3 The Big six audit firms took the initiative on audit quality indicators further and suggested their own set of metrics to report on. * Expressed in qualitative rather than quantitative terms 4 Expressed in quantitative rather than qualitative terms 5 Expressed by a number of different rates and ratios 6 Surveys related to coaching and audit quality

6
GRAPHICAL OVERVIEW OF AUDIT QUALITY INDICATORS
These pie charts give an overview of AQIs characteristics. The graphical analysis of the information is based on the Federation’s understanding of sometimes limited information provided in the nine initiatives identified.
Figure 1: Types of audit quality indicators
Figure 1 represents the type of information used to calculate AQIs. In most initiatives, the information to describe AQIs is predominantly quantitative while it is emphasized that a narrative/context would help understand the real situation; in a few initiatives AQIs are expressed in qualitative terms.
Figure 2: Reporting on audit quality indicators
Figure 2 gives an overview of whether reporting on AQIs is public or private. In some cases, information provided can serve different groups of users, therefore, can be public and private.
Figure 3: Principles-based versus rules-based AQIs
Figure 3 illustrates whether AQIs are rules or principles-based. Some of the initiatives embed a more flexible or principles-based approach, while others suggest predominantly a rules-based approach.
56%33%
11%
Type of AQIs
Quantitative
Qualitative
Both
56%22%
22%
Reporting on AQIs
Public reporting
Private reporting
Both
44%
56%
Principles vs Rules-based
Principles-based
Rules-based

7
OVERVIEW OF AUDIT QUALITY INDICATORS INITIATIVES
1. Nederlandse Beroepsorganisatie van Accountants (NBA), Netherlands
The Nederlandse Beroepsorganisatie van Accountants (NBA) first published a paper on audit quality In the public interest7 in 2014. A list of 37 audit quality indicators was introduced for accountancy organisations auditing Public Interest Entities (PIEs) to report on in their transparency or annual reports. The NBA then issued a draft practice statement to consult on the proposed set of AQIs in the spring of 2015.
As a follow up, the NBA published a practice note Disclosure of Audit Quality Factors8 in March 2016. It sets out the reporting on organisation-specific and general audit quality factors.
An audit firm should report on a number of quality factors to be able to measure and evaluate its performance against its audit quality objectives. In addition to disclosing organisation-specific audit quality factors in an audit quality report, the NBA suggests that audit firms also explain the following points in a report to aid stakeholders in better understanding the firm’s quality control system:
• an explanation of how the quality factor contributes to the quality ambition
• an explanation of how the quality factor is measured
• the objective of the quality factor
• the realization in relation to the objective and the developments over time
It is also important to include such an explanation while reporting on general audit quality factors (see the table below). The NBA suggests that an audit firm should provide information on investments in audit quality (input), how quality is guaranteed while conducting an audit (process), and the results (output). In doing so, an audit firm will give a better overview over its audit quality systems and its understanding of audit quality in general. An audit firm shall provide such information in the Transparency Report.
Investments in audit quality (input) relates to investments in people, time dedicated to audit engagements, technology and methodology. An audit firm is also expected to provide insights into its quality control system by reporting on the quality factors of the process. This means that a firm would disclose the most important measures and how it monitors execution of these matters. It is also important for an audit firm to provide insights into the output of these measures.
An audit firm should report on quality factors on a “comply or explain” basis. If an audit firm has no information on a certain factor, then it should provide an explanation on how a firm monitors audit quality objectives or, otherwise, state that it does not collect any information related to that aspect.
The note is applicable to all audit firms with a PIE licence. It is expected that they will report on the factors listed in the practice note for the accounting year starting on or after December 15, 2015.
7 In the Public Interest 2014 8 NBA Practice Note Disclosure of Audit Quality Factors
INPUT
1. The leverage on the audit engagements by expressing the number of partner/director hours as a percentage of the total number of hours
2. The number of hours per FTE (full-time equivalent) spent on audit engagements, respectively on other engagements in total and by function

8
3. The investments in technology and methodology for the benefit of the audit conducted by the audit firm, whether independently or through its contribution to the development as part of a network. The investments must be identified as a percentage of the audit revenue on an annual basis
4. The average number of hours spent on training and education per employee (internal and external training)
5. The turnover of employees, with insight into the relevant characteristics the organization uses to monitor employee turnover, such as turnover per function level, years of experience or by differentiating between key talents and other employees
6. Results of employee satisfaction surveys on aspects related to coaching and audit quality
PROCESS
7. The number of FTEs or hours spent on supporting the audit (Technical support positions, Compliance and Independence). This can be expressed as a percentage of the total number of FTEs or audit hours
8. The number of consultations in the field of accounting and auditing as a percentage of the number of audit engagements
9. The number of Engagement quality control reviews (EQCRs) and other quality reviews prior to the issuance of the auditor’s report as a percentage of the statutory audits, with the mandatory and voluntary EQCRs disclosed separately
10. The number of hours spent on EQCRs and other quality reviews prior to the issuance of the auditor’s report as a percentage of the total number of hours spent on audit engagements where i a quality review was performed, with the mandatory and voluntary EQCRs disclosed separately
11. The percentage of hours spent by IT specialists and other specialists on audit engagements (the specialists covered by Standard 620 disclosed separately), for PIE and non-PIE organizations
OUTPUT
12. The number of internal and external quality reviews conducted after the issuance of the auditor’ report, as a percentage of the total number of issued auditor’s reports, and the outcome of these quality reviews
13. The number of internally reported violations of independence rules, as a percentage of the total number of employees
14. The number of fundamental errors corrected, whereby the financial statements in which the errors were made were audited by the organization, as a percentage of the number of issued auditor’s reports

9
2. Federal Audit Oversight Authority (FAOA), Switzerland
The Federal Audit Oversight Authority (FAOA) in Switzerland has been collecting information related to audit quality measures for the last seven years, their source being the five largest audit firms in the country9. Over the years, the FAOA has been gathering audit quality indicators relating to the individual elements of ISQC 110. For calculation purposes, FAOA utilized unaudited data. Those indicators are used for risk assessment when planning inspections of the Swiss Market Index (SMI) entities and other public companies11.
In 2014, the FAOA added new measures such as the average number of auditor-in-charge hours per public company audit, the number of foreign Shared Service Centre (SSC) hours as a percentage of overall hours, and the number of consultations per public company audit. The FAOA provides an overview of the last four years of its audit quality indicators in its Activity report 201512.
The FAOA uses quantitative information – ratios – as a way to present AQIs. It provides not only a comparison of AQIs of the five largest state-regulated audit firms in the form of a range of ratios starting in the year 2012, but also a trend analysis.
1. Average annual revenue per audit partner
2. Ratio of other audit fees to audit fees
• SMI companies
• Public companies ex-SMI
3. Number of staff per partner
4. Staff turnover in %
5. Average number of Engagement Quality Control Reviewer (EQCR) hours
• SMI companies
• Public companies ex-SMI
6. Average number of auditor-in-charge hours
• SMI companies
• Public companies ex-SMI
7. Number of foreign SSC hours as a % of overall hours at public companies
8. Number of consultations per public company audit
9 BDO, Deloitte, EY, KPMG and PwC 10 FAOA Activity Report 2013, p.24 11 FAOA Activity Report 2014, p.20 12 FAOA Activity Report 2015, p.18-20

10
3. Financial Reporting Council (FRC) and the largest six audit firms, UK
The UK Financial Reporting Council (FRC) developed their Audit Quality Framework13 in 2008 in which they referred to five key drivers of audit quality, while their Statutory Audit (Transparency) Instrument14 of 2008 provided a list of what should be included in an audit firm’s transparency report.
The Policy and Reputation Group (PRG)15 built on the work of the UK FRC by identifying factors contributing to audit quality which could be measured and disclosed. The AQIs identified were: external investigations, results of internal and external audit quality monitoring, investments made in the audit practice and staff, investor liaison and staff surveys. Those key quality drivers were developed through a dialogue with a range of stakeholders including regulators, corporates, investors, and professional bodies, and were designed to cover the different areas of a quality framework identified in International Standard on Quality Control 1 (ISQC 1)16.
On a voluntary basis, each of the six largest UK audit firms agreed to give information on these metrics in their transparency reports. The approach is a flexible, not prescriptive one, as it recognised that each firm operates differently and hence it is appropriate to provide some flexibility whilst still covering the different areas of quality identified in ISQC1. As a result, each firm provided qualitative followed by some quantitative information under each category of the AQIs within their Transparency Reports.
ISQC1 ELEMENT COVERAGE AUDIT QUALITY INDICATORS
1. Leadership Staff survey questionnaire Metrics on external investigations
2. Ethics and culture Metrics on external investigations Staff survey questionnaire
3. Human Resources Staff survey questionnaire Metrics on investment in the audit practice Metrics on investment in partner and staff training
4. Engagement Performance Staff survey questionnaire Metrics on external investigations Metrics on internal and external quality reviews Metrics on investor liaison Metrics on investment in the audit practice Metrics on investment in partner and staff training
5. Monitoring Metrics on internal and external quality reviews Metrics on investor liaison Metrics on external investigations
13 FRC Audit Quality Framework 2008 14 FRC Statutory Audit (Transparency) Instrument 2008 15 A forum for the six largest professional services firms in the UK to debate topical issues that impact on the reputation of the firms collectively and by extension of the profession. The six firms are BDO, Deloitte, EY, Grant Thornton, KPMG, and PwC. The PRG has designed an audit quality indicators initiative based on the internal control systems, business and operating models, and client base of the Big Six audit firms. The FRC referred to the initiative of the PRG in their Transparency Reporting by Auditors of Public Interest Entities. Review of Mandatory Reports, March 2015. 16 International Standard on Quality Control 1 (ISQC 1)

11
4. Public Company Accounting Oversight Board (PCAOB), USA
The Public Company Accounting Oversight Board (PCAOB) has recently issued a concept release on Audit Quality Indicators17, a further addition to their earlier audit quality initiatives. The PCAOB’s project focuses on audits of public companies. However, the scope of the AQI project might change as this is questioned in the concept release. According to the PCAOB, the objective of the AQI project is not to impose new requirements or modify existing ones. Potential benefits of AQIs might be stimulation of competition amongst audit firms and increase of the overall audit quality. The PCAOB sees the following groups as potential users of AQIs: audit committees, audit firms, investors, and regulators. It is emphasized that investors could benefit from such information only if it is made public.
The PCAOB suggests a phased approach which would allow a step by step adoption of AQIs. It would not be obligatory to report on all 28 AQIs. Audit firms could report only on those indicators which would be relevant to them. The implementation process can be adjusted to the needs and capacity of audit firms and users.
The PCAOB has provided a list of 28 potential AQIs in its concept release. The AQIs are intended to be quantitative, and whenever possible be supported by a qualitative context. The illustrative calculations for each of the indicators are proposed to be provided at both the engagement and firm levels (see Appendix). The intention is that AQIs should be used as a balanced portfolio of audit quality.
At the time of writing, the PCAOB is in the process of analysing the results. According to one of the Board members, the PCAOB most likely will not impose any requirements or standards on AQIs, however, the Board has to yet make an official decision on the further steps18.
17 PCAOB concept release on Audit Quality Indicators 18 The PCAOB update
AUD
IT P
ROFE
SSIO
NAL
S
Availability 1. Staffing Leverage
2. Partner Workload
3. Manager and Staff Workload
4. Technical Accounting and Auditing Resources
5. Persons with Specialized Skill and Knowledge
Competence 6. Experience of Audit Personnel
7. Industry Expertise of Audit Personnel
8. Turnover of Audit Personnel
9. Amount of Audit Work Centralized at Service Centers
10. Training Hours per Audit Professional
Focus 11. Audit Hours and Risk Areas
12. Allocation of Audit Hours to Phases of the Audit

12
AUD
IT P
ROCE
SS
Tone at the Top and Leadership 13. Results of Independent Survey of Firm Personnel
Incentives 14. Quality Ratings and Compensation
15. Audit Fees, Effort, and Client Risk
Independence 16. Compliance with Independence Requirements
Infrastructure 17. Investment in Infrastructure Supporting Quality Auditing
Monitoring and Remediation 18. Audit Firms' Internal Quality Review Results
19. PCAOB Inspection Results
20. Technical Competency Testing
AUD
IT R
ESU
LTS
Financial Statements 21. Frequency and Impact of Financial Statement Restatements for Errors
22. Fraud and other Financial Reporting Misconduct
23. Inferring Audit Quality from Measures of Financial Reporting Quality
Internal Control 24. Timely Reporting of Internal Control Weaknesses
Going Concern 25. Timely Reporting of Going Concern Issues
Communications between Auditors and Audit Committee
26. Results of Independent Surveys of Audit Committee Members
Enforcement and Litigation 27. Trends in PCAOB and SEC Enforcement Proceedings
28. Trends in Private Litigation

13
5. United States Center for Audit Quality (US CAQ)
The United States Center for Audit Quality (US CAQ) has developed an approach to communicating AQIs to audit committees after outreach with investors, audit committees, and other stakeholders.19 The US CAQ approach focuses mainly on the communication of engagement-specific AQIs, including firm-wide indicators to provide more content where appropriate. The US CAQ sees audit committees as main users of AQIs, specifically engagement-level measures.
The potential AQIs are meant to supplement transparency reports (if a firm issues one) and other required information already communicated to audit committees. According to the US CAQ, there should be some flexibility when applying AQIs and it should be adapted to the individual needs of each audit committee.
Additionally, audit quality measures should not be presented as a bold number; they should be accompanied by a two-way dialogue between the auditor and the audit committee to give a full understanding as to what a certain number might represent.
The CAQ has pilot tested its potential set of AQIs to gather further practical feedback from engagement teams and audit committees. In January 2016, the CAQ published a report20 summarising the information gathered during pilot testing and the audit committee roundtables organised in different continents.
According to the CAQ, participants in the pilot testing and at the roundtables were overall supportive of the concept of AQIs, however feedback on individual indicators varied. Through the discussions, several main themes emerged, among others:
• desire for more qualitative information
• flexible approach allowing audit committees to tailor its portfolio of AQIs depending on their information needs
• the process of identifying and evaluating AQIs should be driven by audit committees
• engagement-level AQIs should not be disclosed publicly as it might result in unintended consequences
The CAQ continues to monitor developments on the topic as well as engaging with stakeholders.
19 The US CAQ Approach to Audit Quality Indicators 20 The US CAQ Audit Quality Indicators - The journey and path ahead
1. FIRM LEADERSHIP AND TONE AT THE TOP
Overview of how the audit firm’s leadership, through its tone at the top, emphasizes audit quality and holds itself accountable for the audit firm’s system of quality control
2. ENGAGEMENT TEAM KNOWLEDGE, EXPERIENCE, AND WORKLOAD
A. Knowledge and Experience of Key Engagement Team Members (e.g., engagement partner(s), manager(s), and EQR(s))
Years on the engagement
Years of industry experience, relevant to the audit engagement (for instance, for a financial services audit engagement, years of financial services experience for each key engagement team member)
Years with the audit firm
Years at present level
B. Audit Firm Training Requirements
Discussion of the audit firm’s training requirements
Communication of the engagement team’s non-compliance with the audit firm’s training requirements or other standards (if any), and related remediation actions

14
2. ENGAGEMENT TEAM KNOWLEDGE, EXPERIENCE, AND WORKLOAD (continued)
C. Trends in Engagement Hours and Related Timing
Audit hours by various levels, including partner(s), manager(s) and staff (e.g., percent-age of planned hours for current year and actual audit hours for prior year)
Changes in audit hours between years (i.e., comparing current year planned hours to prior year actual hours)
The timing of audit hours, particularly the allocation between planning and execution/ completion
D. Allocation of Resources by Significant Risk Areas
Planned and actual allocation of resources associated with significant risk areas
E. Specialists and National Office Personnel Involvement by Significant Risk Areas
The number of hours or percentage of audit hours expected to be incurred by specialists or national office personnel, including a comparison to the prior year audit
Explanations regarding the nature of the issues expected to be encountered and the types of specialist engaged in comparison to the prior year audit
F. Key Engagement Team Members’ Workloads
Average number of hours (planned for the current year audit and actual hours for prior year audit) for each key member, possibly indicating the split between client and non-client activities, if desired
Providing workload information in relation to a standard workload by level (determined by the audit firm) or the total number of hours available in a year based on a 40-hour work week (2,080)
Workload levels in excess of a standard workload by level (40-hour work week or comparable level determined by the audit firm) and anticipated excess during the current year compared to workload in prior year, focusing either on full-year totals or on excess during the critical period of completion of audit procedures and sign-off
3. MONITORING A. Internal Quality Review Findings Broadly discuss the matters identified during the firm-wide internal quality review program
If the engagement has been subject to an internal inspection, discuss review findings that required additional audit procedures and their impact on the planned current year audit
B. PCAOB Inspection Findings If the engagement has been subject to a PCAOB inspection, discuss inspection findings (if any) and the impact these findings would have on the current year audit
Trends in firm-wide PCAOB inspection results, including: - Number of engagements inspected - Number of inspections with Part I comments - Percentage of inspections with Part I comments - Common issues/Themes in Part I comments
Views on the audit firm’s efforts to understand potential causes of deficiencies and any remediation plans being undertaken, including changes to the audit firm’s system of quality control

15
4. AUDITOR REPORTING
A. Reissuance Restatements and Withdrawn Auditor’s Reports
Focus on firm-level trends of -Reissuance restatements of financial statements -Withdrawal of previously issued ICFR reports
Common themes/issues in restatements and withdrawn ICFR reports

16
6. Canadian Public Accountability Board (CPAB)
The Canadian Public Accountability Board (CPAB) supports the idea of developing a set of potential AQIs as it could give some insight into audit quality issues. The CPAB issued a publication on AQIs: Audit Quality Indicators: in Search of the Right Measures21 in 2014. It did not include any detailed information such as an issuing body or whether reporting on AQIs would apply only to audit firms of public interest entities or to all audit firms. It also remains unclear whether reporting on AQIs would be a mandatory practice.
In the publication, the CPAB briefly explained the potential benefits of AQIs. Reporting on AQIs could serve audit committees in their annual and periodic reviews. It might also provide a basis for audit firms to show their commitment and performance in relation to audit quality. The CPAB suggested sharing both firm and engagement level AQIs as they could provide users with a robust overview of factors affecting audit quality. The CPAB believes that sharing firm level AQIs publicly is beneficial, however confidential information must be protected and, as such, some information related to the engagement level AQIs should only be discussed with audit committees.
Additionally, AQIs was one of the main subject matters at the Audit Quality Symposium held in November 2014 in Canada. In the post-symposium summary, it was mentioned that the CPAB together with the Chartered Professional Accountants (CPA) and the Institute of Corporate Directors (ICD) will work on providing stakeholders with possible ways that audit committees could use AQIs practically once the US PCAOB research has been published.22 The CPAB encourages audit firms to strive for greater transparency in communication of inspection results and about AQIs. It also believes that developing a set of AQIs could improve the balance between quality versus price when choosing an auditor.
In March 2016, the CPAB published another report Transparency into the Audit – Audit Quality Indicators and Transparency Reporting23. The CPAB gives an overview of the current state of play. It also mentions a Canadian pilot project to gather feedback on the usefulness and practical implications of using AQIs. The CPAB is reaching out to audit committee members to participate in this project during 2016. The results will be publicly available in 2017.
The CPAB outlined potential AQIs in the publication Audit Quality Indicators: In Search of the Right Measures. Information acquired from those AQIs is quantitative. This list is shown below.
Potential set of audit quality indicators24:
FIRM LEVEL AQIs ENGAGEMENT LEVEL AQIs
1. Partner workload 2. Partner to staff leverage 3. Training hours per professional (average) 4. Technical resources per professional
5. Years of experience of partners and key audit team members
6. Years of industry experience of partners and staff 7. Specialist hours (e.g. valuations, IT, tax) on the
engagement 8. Key engagement team workloads including hours of
overtime during peak periods
21 Audit Quality Indicators: In Search of the Right Measures 22 Audit Quality Symposium: Changing Expectations February 2015, p i-ii; and 7 23 Transparency into the Audit - Audit Quality Indicators and Transparency Reporting 24 Audit Quality Indicators: In Search of the Right Measures

17
7. Chartered Accountants of Australia and New Zealand (CAANZ)
Since 2013, audit firms in Australia and New Zealand auditing ten or more listed companies, certain financial institutions and insurance companies have been obliged to publish transparency reports. The Chartered Accountants of Australia and New Zealand (CAANZ) assessed the transparency reports of 2014 and presented their findings in their report on Clearer Transparency25.
The CAANZ, while conducting its annual reviews, was looking for evidence on five elements linked to audit quality. Those measures are listed in the IAASB Audit Quality Framework. However, it is mentioned that none of the audit firms were specifically reporting on those elements. Some of the largest audit firms took a more flexible approach and developed their own audit quality measures. AQIs found in transparency reports of audit firms are to some extent comparable to the audit quality elements listed in the IAASB Audit Quality Framework.
INPUTS 1. Assignment of audit partners and staff members with deep understanding of the client’s risks and industry
2. Skills and personal qualities of partners and staff
3. Training techniques to ensure partners and staff acquire the desired knowledge and skills
PROCESSES 4. Audit methodology and technology platforms
OUTPUTS 5. Audit report 6. Regular reporting to management and those charged with governance
INTERACTIONS 7. Professional scepticism between auditors and management
CONTEXT 8. Corporate governance processes
9. Legal and regulatory environment
25 Clearer Transparency: Assessing the second year of Audit Firm Transparency Reports in Australia June 2015, p. 6-7

18
8. Accounting and Corporate Regulatory Authority (ACRA), Singapore
The Accounting and Corporate Regulatory Authority (ACRA) of Singapore published their Audit Quality Indicators (AQIs) Disclosure Framework in October 201526. There are eight quality indicators presented in the Framework which are intended for voluntary use by audit committees of all listed entities in Singapore as from January 2016. AQIs have been developed in collaboration with audit firms and audit committee chairs in Singapore.
The indicators are mainly quantitative with an option to add qualitative information where relevant. It is suggested to privately share information on AQIs with audit committees in two instances: after the financial year’s audit and when it is being considered to change the auditor. Certain AQIs are communicated at engagement level, others at firm level and some at both levels. Engagement level AQIs are more relevant to audit committees; however, firm level indicators might be very helpful in terms of providing an overview on an audit firm’s quality assurance measures.
ACRA has also provided Guidance to Audit Committees27 and Guidance to Audit Firms on ACRA’s AQI Disclosure Framework28 as a supplement to its AQIs Framework. The Guidance to Audit Committees can be referred to for more details on how the AQIs should be interpreted and the Guidance to Audit Firms has been designed to aid audit firms to prepare AQI data in a consistent way. A Sample Presentation Format on AQIs which includes some examples of possible indicators under each category is provided in ACRA’s AQIs Disclosure Framework as well as on ACRA’s website29.
ENGAGEMENT LEVEL 1. Audit Hours Time spent by Senior Audit Team Members
2. Experience Years of Audit Experience and Industry Specialisation
FIRM LEVEL 3. Training Average training hours and industry specific training
4. Inspection Results of External and Internal Inspections
5. Independence Compliance with Independence Requirements
BOTH 6. Quality Control Headcount in Quality Control Functions
7. Staff Oversight Staff per Partner / Manager Ratio
8. Attrition Rate Degree of Personnel Losses
26 Defining the Audit Quality Conversation 27 Guidance to Audit Committees on ACRA's Audit Quality Indicators Disclosure Framework 28 Guidance to Audit Firms on ACRA's Audit Quality Indicators Disclosure Framework 29 Available at https://www.acra.gov.sg/Publications/Guides/Audit_Quality_Indicators_Disclosure_Framework/

19
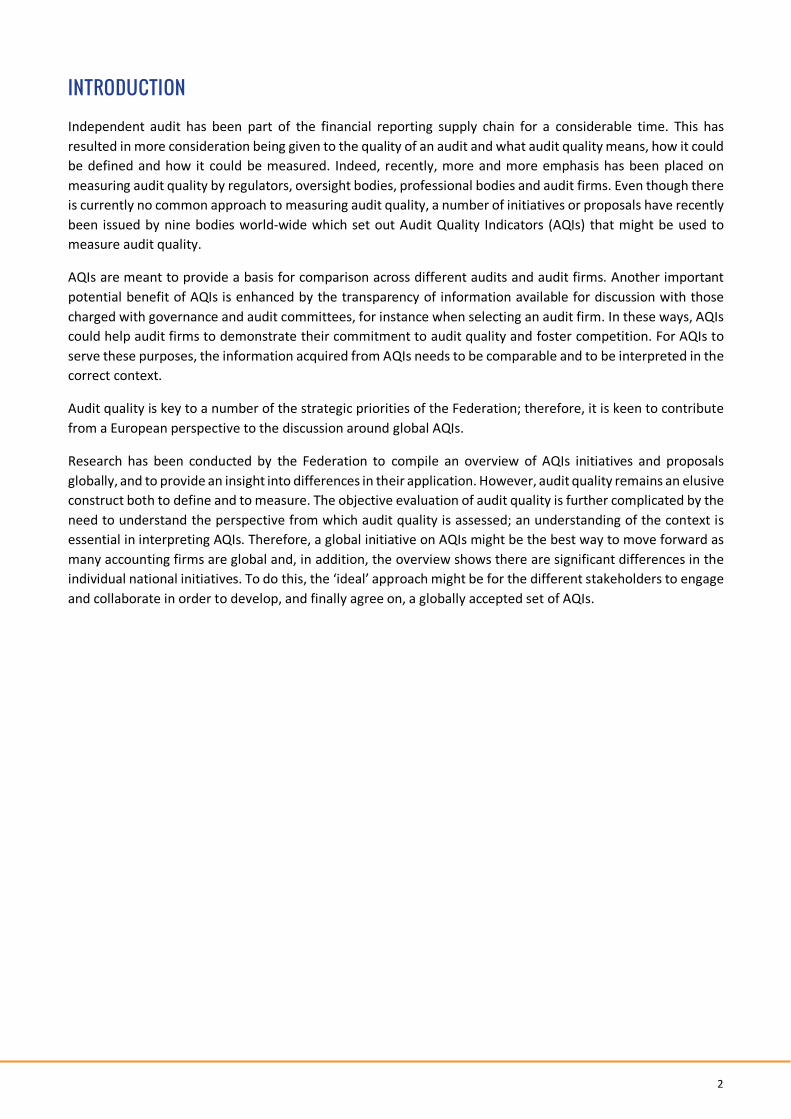
9. International Organisation of Securities Commissions (IOSCO)
The International Organisation of Securities Commissions (IOSCO) in its Consultation Report Transparency of Firms that Audit Public Companies30 in 2009 presented possible examples of AQIs which were split into two categories: input and output. Input AQIs covered experience, competency, and technical resources; workload, and leverage. Output AQIs included such AQIs as: revenue information; independence matters; disciplinary proceedings and legal matters; restatement and inspection results, as well as client acceptance and dismissal.
In November 2015, IOSCO published its Final Report Transparency of Firms that Audit Public Companies31 consisting of a statement and a guide for transparency reporting. The report mainly focuses on the role of audit firms and is intended to serve as a guide that could promote good practice in terms of high audit quality and firms’ transparency reports. IOSCO suggests the type of information to include in a transparency report. It also covers AQIs and lists a few examples; however, it does not provide an exhaustive list of indicators. IOSCO suggests that audit firms make their transparency reports available at least on an annual basis. Transparency reports are considered to bring most benefits to investors and audit committees.
IOSCO believes that under the category of “measures to foster audit quality” there should be a description of how a firm establishes, evaluates, and monitors compliance with auditing standards; professional scepticism and tone at the top. In addition, it is suggested to include a discussion on the way partners and staff are assigned to engagement teams based on workload, technical competences, years of audit experience including industry expertise. It further elaborates on risk management, on partners’ accountability for audit quality and on partners’ performance evaluation in light of audit quality − and remuneration based on that performance.
According to IOSCO, the proportion of revenues (non-audit services to audit clients and non-audit clients) and years of experience of partners and staff could be examples of “input measures” which should include statistical metrics and are meant to provide information on personnel and available resources to perform a quality audit. It is suggested that firms should also provide information on “output” measures and the results of applying those measures accompanied by a narrative on the methodologies used to develop them. Inspection results of audit oversight bodies should also be included in transparency reports of audit firms.
30 IOSCO Consultation Report Transparency of Firms that Audit Public Companies, September 2009 31 IOSCO Report Transparency of Firms that Audit Public Companies, November 2015
INFORMATION ABOUT THE AUDIT FIRM’S MEASURES TO FOSTER AUDIT QUALITY
Description of how the firm establishes, evaluates and monitors compliance with auditing standards
Description of the initiatives designed to encourage a culture of professional scepticism and tone at the top that promotes audit quality
Discussion on how the form manages the assignment of partners and staff to engagement teams based on:
• Workload
• Technical competence of staff and partners
• Years of experience of staff and partners
• Industry expertise
Description of the firm’s risk management process to identify, measure, and mitigate material risks
Discussion of how firm holds partners accountable for audit quality, including how performance was assessed and the extent to which this affects remuneration
20
* Disclosure of this information depends on confidentiality legislation and other regulatory frameworks or requirements
INFORMATION ABOUT AUDIT FIRM’S INTERNAL INDICATORS OF AUDIT QUALITY*
Qualitative statement on areas for improvement from the results of firm’s internal monitoring of its implementation of regulatory and other requirements in areas such as:
• Professional continuing education
• Auditor independence
• Quality control systems
• Acceptance and continuance of clients and engagements,
and corresponding remedial actions
Input measures (incl. statistical metrics) on personnel and availability of resources to support the level of audit services, for example:
• Proportion of revenues from non-audit services to audit and to non-audit clients
• Years of experience of partners and staff
Output measures and results of application of those measures accompanied by a narrative on the methodologies used to develop the measures of audit quality
INFORMATION ABOUT AUDIT FIRM’S INDICATORS OF AUDIT QUALITY AS GENERATED BY THE WORK OF EXTERNAL BODIES*
Inspection results of audit oversight bodies. The firm should disclose:
• The scope and the results from audit quality oversight inspections, including main or general deficiencies and other findings without identifying confidential information about individual audits
• The name of the audit oversight body reporting on observed deficiencies
• The corresponding remedial actions by the audit firm
A statement on a firm’s compliance results with respect to regulatory frameworks and other requirements from external bodies including peer reviews, professional continuing education, quality control, and auditor independence

Appendix – PCAOB calculations of audit quality indicators 21
Appendix – PCAOB calculations of audit quality indicators
The illustrative calculations:
1. Staffing leverage Indicator measures the time of experienced senior personnel relative to the volume of audit work they oversee.
Engagement Level Firm Level
a. Ratio of audit partners' chargeable hours for the engagement to chargeable hours of all other engagement personnel b. Ratio of audit partners' chargeable hours for the engagement to chargeable hours of audit managers' on the engagement c. Ratio of audit managers' chargeable hours for the engagement to chargeable hours of all staff below manager on the engagement
a. Ratio of firm audit partners' chargeable hours to chargeable hours of all other engagement personnel b. Ratio of firm audit partners' chargeable hours to firm audit managers' chargeable hours c. Ratio of firm audit managers' chargeable hours to chargeable hours of all staff below manager
2. Partner Workload The "partner workload" indicator generates data about the level of work for which the audit engagement partner is responsible and the number of claims on his or her attention.
Engagement Level Firm Level
a. Chargeable hours managed by audit engagement partner for all public and private clients for the current year (planned) and prior year (actual) b. Number of public clients, and number of private clients, whose audits are managed by the audit engagement partner and audits for which that partner is a quality control reviewer, noting those with calendar year-ends, for the current year (planned) and prior year (actual) c. Audit engagement partner's utilization percentage for the current year (planned) and prior year (actual)
a. Average chargeable hours managed by public company audit engagement partners for all public and private clients for the current year (planned) and prior year (actual) b. Public company audit engagement partners' average utilization percentage for the current year (planned) and prior year (actual)
3. Manager and Staff Workload This indicator would provide information about the workload of audit managers and audit staff.
Engagement Level Firm Level
For managers and audit staff, respectively: a. Utilization percentage for the current year (planned) and prior year (actual) b. Average hours worked per week measured from day after clients' year-end date through audit opinion date, for all engagements, by personnel level
a. Manager and audit staff average utilization, respectively b. Manager and audit staff average chargeable hours at different periods within the year (e.g., during periods of peak audit workload)
4. Technical Accounting and Auditing Resources. This indicator measures the level of a firm's central personnel (or other resources engaged by the firm) available to provide engagement teams with advice on complex, unusual, or unfamiliar issues and the extent to which they are used in a particular engagement.
Engagement Level Firm Level
a. Technical resource chargeable hours as a percentage of total engagement hours
a. Size of a firm's "National Office" or other technical audit resources as a percentage of its total audit personnel, using a "full-time -equivalent" measurement to account for individuals who spend only part of their time on technical resource matters

Appendix – PCAOB calculations of audit quality indicators 22
5. Persons with Specialized Skill or Knowledge This indicator measures the use in an audit engagement of persons with "specialized skill and knowledge," other than accounting and auditing personnel counted as technical accounting and auditing resources under indicator 4. These individuals may be firm personnel or they may be retained by the firm.
Engagement Level Firm Level
a. Chargeable hours by persons with specialized skill or knowledge (except as counted as technical resources under indicator 4), in total and by functional specialty, as a percentage of an engagement's current year (planned) and prior year's (actual) total chargeable hours
a. Chargeable hours of persons with specialized skill or knowledge (except as counted as technical resources under indicator 4) in total and by functional specialty, as a percentage of a firm's actual chargeable hours
6. Experience of Audit Personnel This indicator measures the level of experience of members of a particular engagement team and the weighted average experience of firm personnel generally.
Engagement Level Firm Level
For partners, managers, staff auditors, specialists, and engagement quality reviewers: a. Number of years on the engagement b. Number of years in present assignment and personnel level c. Number of years: (i) with the firm and (ii) in the auditing profession
a. Average experience for total audit personnel b. Weighted average years of experience for partners, managers, staff auditors, and specialists respectively
7. Industry Expertise of Audit Personnel32 This indicator addresses the experience of senior members of the audit team, as well as specialists, in the industry in which the audited company operates.
Engagement Level Firm Level
a. Number of years of cumulative experience of partners, audit managers, specialists, and engagement quality reviewers, respectively, in the audited public company's industry
None
8. Turnover of Audit Personnel This indicator measures turnover, that is, transfers to other engagements or movement to other firms, at the engagement and, more generally, at the firm, level.
Engagement Level Firm Level
a. Percentage of prior year's partners, managers, audit staff, specialists, and engagement quality reviewers, respectively, that have left the firm or been reassigned to another audit engagement within the firm
a. Percentage of partners, managers, audit staff, and specialists, respectively, that have left the firm or left the firm's audit practice, in the preceding 12 months
9. Amount of Audit Work Centralized at Service Centers This indicator measures the degree to which audit work is centralized by the audit firm at service centers.
Engagement Level Firm Level
a. Percentage of total engagement audit work (by chargeable hours) whose performance is carried out on a centralized basis at service canters
a. Percentage of audit work (by chargeable hours) whose performance is carried out on a centralized basis at service canters
32 PCAOB concept release on audit quality indicators: “calculation is suggested only at the engagement level because the scale of an audit firm practice could make generation of meaningful data at the firm level difficult”.

Appendix – PCAOB calculations of audit quality indicators 23
10. Training Hours per Audit Professional This indicator focuses on the hours of relevant training—including industry-specific training—that members of the engagement team, and of the team's firm, have received.
Engagement Level Firm Level
a. Annual accounting and auditing training hours, and industry-specific training hours for partners, audit managers, staff auditors, specialists, and engagement quality reviewers, respectively b. Total independence and ethics training hours for personnel groups in "a"
a. Average annual accounting and auditing training hours, and industry-specific training hours, in total and for partners, managers, staff auditors, specialists, and engagement quality reviewers, respectively b. Average independence and ethics training hours for personnel groups in "a"
11. Audit Hours and Risk Areas This indicator measures the time spent by members of the audit team at all levels on risk areas identified by the firm during audit planning.
Engagement Level Firm Level
a. Total chargeable hours, and percentage of hours, by significant risk area for partners, managers, audit staff, technical accounting and auditing resource personnel, specialists, and the engagement quality reviewer, respectively, for the current year (planned) and the prior year (actual)
a. For audits by industry, computed separately, average chargeable hours overall and by significant risk area for partners, managers, audit staff, technical accounting and auditing resource personnel, specialists, and the engagement quality reviewers, respectively, for the prior year (actual)
12. Allocation of Audit Hours to Phases of the Audit This indicator measures the effort and staffing the audit devotes to audit planning, interim field work, and audit completion.
Engagement Level Firm Level
a. Current year's (planned) and prior year's (actual) total chargeable hours for each related audit phase (i.e., planning, quarterly reviews, interim field work, final field work up until report release date, and post-field work until audit documentation completion date) for partners, managers, the audit staff, technical resources staff, specialists, and the engagement quality reviewer, respectively
a. Percentage of hours of the firm devoted respectively to planning, quarterly reviews, interim field work, final field work up until report release date, and post-field work until audit documentation completion date for partners, managers, the audit staff, technical resources staff, specialists, and engagement quality reviewers
13. Results of Independent Survey of Firm Personnel This indicator measures an audit firm's "tone at the top" through use of a survey tool.
Engagement Level Firm Level
None a. Anonymous independent surveys of current and former firm personnel about "tone at the top," quality of supervision and training, and the extent to which the firm promotes an environment that favours speaking up about potential issues, and promotes and rewards professional scepticism

Appendix – PCAOB calculations of audit quality indicators 24
14. Quality Ratings and Compensation. This indicator measures the potential correlation between high quality ratings and compensation increases and the comparative relationship between low quality ratings and compensation increases or decreases.
Engagement Level Firm Level
None a. Percentage of partners and managers, respectively, with exceptional performance ratings on audit quality b. Percentage of partners and managers, respectively, with exceptional quality ratings who receive above-average increases in compensation c. Percentage of partners and managers, respectively with low quality ratings d. Average percentage compensation increase or decrease for partners and managers, respectively, with low quality ratings
15. Audit Fees, Effort, and Client Risk This indicator provides insight into the relationship between engagement or firm audit fees and hours, on the one hand, and levels of client risk, on the other.
Engagement Level Firm Level
a. Percentage change from prior year in each of: (i) audit fees and (ii) chargeable hours for partners and managers, respectively, together with whether client was identified by firm as high risk.
a. Percentage change from prior year in each of: (i) total audit revenues charged to public company clients and (ii) chargeable hours for partners and managers, respectively, together with percentage of firm's public company clients assessed as high risk.
16. Compliance with Independence Requirements This indicator measures several elements of a firm's independence training and monitoring program and the importance it assigns to that program.
Engagement Level Firm Level
a. Percentage of engagement personnel subject to firm's personal independence compliance reviews. b. Average of mandatory independence training hours per engagement team member
a. Percentage of firm personnel subject to firm's personal independence compliance reviews annually. b. Average of mandatory independence training hours per audit employee and other firm professional employees covered by Commission independence rules (whether or not involved in the firm's audit practice), respectively c. Percentage of issuer audit engagements subject to firm internal quality control reviews over independence compliance annually. d. Level of investment in centralized support for, and monitoring of compliance with, independence requirements per 100 public company audit clients (for firms with 500 such clients) e. Percentage of public company audit clients lost due to independence violations.
17. Investment in Infrastructure Supporting Quality Auditing This indicator measures the amounts audit firms invest, in people, process, and technology, to support the base on which quality auditing depends.
Engagement Level Firm Level
a. Investment in engagement team as a percentage of revenue generated on engagement
a. Investment in audit practice as a percentage of firm revenue

Appendix – PCAOB calculations of audit quality indicators 25
18. Audit Firms' Internal Quality Review Results This Indicator contains information about the internal quality reviews conducted by each audit firm.
Engagement Level Firm Level
a. Results of any internal quality inspections of audits of the engagement client, including number (if any) of audit deficiencies of a magnitude similar to a PCAOB Part I finding
a. Percentage of public company audits subjected to internal quality review inspections by audit firm b. Percentage of such inspections with one audit deficiency of a magnitude similar to a PCAOB Part I finding c. Percentage of such inspections with more than one such audit deficiency
19. PCAOB Inspection Results This indicator contains information about PCAOB inspection results relating to the engagement or the audit firm involved.
Engagement Level Firm Level
a. Results of any PCAOB inspections of audits of the engagement issuer as well as the number and nature of any Part I findings identified
a. Number and percentage of PCAOB- inspected audits that result in a "Part I finding" b. Number and percentage of PCAOB inspected audits that result in more than one "Part I finding" c. Number and percentage of PCAOB inspected audits that led to a restatement d. Number, nature, and dates of quality control defects dealt with in released Part II PCAOB inspection reports (and dates of such releases), if any, combined with information about firm's subsequent remediation efforts
20. Technical Competency Testing This indicator seeks to measure the level of technical competence of a firm's audit personnel, and the success of efforts to keep up that level of competence.
Engagement Level Firm Level
a. Content requires study a. Content requires study
21. Frequency and Impact of Financial Statement Restatements for Errors This indicator measures the restatements for error of financial statements whose audit the audit firm has performed.
Engagement Level Firm Level
a. Number and magnitude of audit practice's restatements for errors at engagement level, computed annually.
a. Number and percentage (of audited financial statements) of an audit practice's restatements for errors, computed annually, and magnitude of those restatements. b. The audit firm's top five annual restatements measured by the magnitude of those restatements.
22. Fraud and other Financial Reporting Misconduct This indicator is concerned with reporting of fraud and other financial misconduct, at both the engagement and audit firm levels.
Engagement Level Firm Level
a. Content requires study a. Content requires study
23. Inferring Audit Quality from Measures of Financial Reporting Quality This potential indicator focuses on whether (and which) measures of financial reporting quality used by investment analysts, academics, and regulators can also be used as measures of audit quality.
Engagement Level Firm Level
a. Content requires study a. Content requires study

Appendix – PCAOB calculations of audit quality indicators 26
24. Timely Reporting of Internal Control Weaknesses This measure captures the extent to which an audit firm identifies material weaknesses in an issuer's internal controls over financial reporting on a timely basis.
Engagement Level Firm Level
a. Same as firm level but concerning audit reports for the engagement client
a. Percentage of findings of material weakness in internal control over financial reporting with no corresponding: (i) restatements for errors or (ii) known errors b. Percentage of: (i) restatements for errors, or (ii) known errors, with no corresponding material weakness in internal controls over financial reporting identified in the prior year
25. Timely Reporting of Going Concern Issues This indicator focuses on the timeliness of the auditor's use of a going concern paragraph in its opinions.
Engagement Level Firm Level
a. Same as firm level "a," but concerning audit reports for the engagement client
a. The number and percentage of audit reports with no going concern reference in the year preceding an engagement client's financial distress, e.g., bankruptcy, troubled debt restructuring, troubled buyout, or bailout b. The five largest issuers by market capitalization from the above indicator
26. Results of Independent Surveys of Audit Committee Members This indicator measures the effectiveness of the communication between auditors and audit committees through use of a survey tool.
Engagement Level Firm Level
None a. Anonymous independent survey of audit committee members overseeing one or more of a firm's audit engagements, to evaluate level and quality of communication between auditors and clients
27. Trends in PCAOB and SEC Enforcement Proceedings This indicator measures Board or SEC proceedings in audit and audit-related matters against an audit firm.
Engagement Level Firm Level
a. Public, SEC or Board enforcement proceedings, measured over the preceding five years, against the firm or its partners, with respect to the engagement client
a. Public, SEC, or Board enforcement proceedings, measured over the preceding five years, against the firm or its partners, with respect to audit matters
28. Trends in Private Litigation This indicator focuses on private litigation involving the audit firm.
Engagement Level Firm Level
a. Frequency, nature, and results of private litigation relating to firm's audit work for the engagement client
a. Frequency, nature, and results of private litigation relating to firm's public company audit practice
DISCLAIMER: FEE disclaims any responsibility resulting from the use of, or reliance on, the information contained in this document.

WHO WE ARE
The Federation of European Accountants represents 50 professional institutes of accountants and auditors from 37 European countries, with a combined membership of over 875,000 professional accountants working in different capacities. As the voice of the European profession, the Federation recognises the public interest.
FEE is in the EU Transparency Register (No 4713568401-18).