Embed Size (px)
Citation preview


March 2013 www.seeaction.energy.gov 7
Chapter 2. Design of Standby Rates
2.1 Overview
A primary motivation for industrial and commercial customers to install CHP systems is to meet electricity and thermal energy needs at a lower cost. One potential impediment to the adoption of CHP
36 is standby rates, or
partial requirements service, which the utility charges to compensate for providing certain services and which can affect CHP customer cost savings.
37 Utility rates should optimally allocate the total cost of service for a utility to
recover costs from customer classes, reflecting each class’s use of the system. This principle of “cost causation” is implemented through rate designs that fairly allocate costs based on measureable customer characteristics.
Utility standby rates cover some or all of the following services:
Backup power during an unplanned generator outage
Maintenance power during scheduled generator service for routine maintenance and repair
Supplemental power for customers whose on-site generation under normal operation does not meet all of their energy needs, typically provided under the full requirements tariff for the customer’s rate class
Economic replacement power when it costs less than on-site generation
Delivery associated with these energy services.
In the rate design process, utility costs are allocated to various components of customer services, including charges for billing and metering, energy, distribution, and transmission. Costs for each of these components are based on an average user profile for each customer rate class, such as large nonresidential customers, rather than customized for individual users.
For large customers, costs of utility service are separated into customer, energy, and demand charges. Customer charges are designed to recover costs incurred to provide metering and billing services and service drop facilities. Energy charges recover the variable costs incurred to generate electricity (i.e., chiefly fuel cost).
38 Demand charges
are designed to recover the utility investment cost incurred to provide generating, transmission, and distribution capacity and may vary by season and time of day.
39 Generation costs may also vary by season and time of day.
Commonly, demand charges in standby rates are “ratcheted,” meaning the utility continues to apply some percentage (often as high as 100%) of the customer’s highest peak demand in a single billing month up to a year after its occurrence.
The use of ratchets can be controversial—some view them as increasing the equity of fixed cost allocation, while others view them as barriers to economic applications by CHP customers. Although demand ratchets may be appropriate for recovering the cost of delivery facilities closest to the customer-generator, they arguably do not reflect cost causation for shared distribution and transmission facilities, which are farther removed from the customer. Distribution and transmission facilities are designed to serve a pool of customers with diverse loads, not a single customer’s needs, and coincident outages drive their costs. In addition, unplanned CHP system outages occur randomly; CHP systems will not all fail at the same time or during the utility system’s peak. Further, the customer’s use of standby service may not coincide with the peak demand of the utility facility providing the service.
40 Use of standby service by CHP customers with low forced outage
41 rates typically is significantly less likely
to coincide with the utility’s peak demand than peak use by a full requirements customer. Arguably, billings based
36 U.S. EPA. Standby Rates for Customer-Sited Resources—Issues, Considerations, and the Elements of Model Tariffs. December 2009. www.epa.gov/chp/documents/standby_rates.pdf. 37 In restructured states, the utility may provide only delivery services and provider-of-last-resort energy service.
38 Some fixed costs may be recovered through variable energy charges. 39 In restructured markets, generation-related costs are not recovered in regulated revenue requirements, but in market-based supply prices. 40 See Regulatory Assistance Project. “Distribution System Cost Methodologies for Distributed Generation.” 2001. www.raponline.org/docs/RAP_Shirley_DistributionCostMethodologiesforDistributedGeneration_2001_09.pdf. 41 Forced outages are unplanned or unscheduled outages of the CHP system due to equipment failure.
8 www.seeaction.energy.gov March 2013
on ratcheted demands fail to recognize the diversity in load among CHP customers and the cost savings associated with that diversity, particularly as regards shared T&D facilities. Requiring CHP customers to pay ratcheted demands may result in CHP customers overpaying for utility-supplied electricity relative to full requirements customers.
2.2 Improving Standby Rates
Standby rates were originally designed to reflect an environment in which a utility operated within a fairly closed system with a few inter-ties with other utilities for backup emergency purposes. Today, many utilities rely on and participate in regional markets where electricity and capacity are pooled and can be purchased with relative ease. The ability to more easily transact energy and capacity allows a utility to take account of the probability of various CHP loads needing standby service at the same time, which will lower ratcheted demand charges.
Working with utilities and other stakeholders, some state utility regulators have improved the nexus between standby tariffs and cost causation, provided customer-generators with options to avoid charges when they do not impose costs, and established a reasonable balance between variable charges versus contract demand or reservation charges.
For standby or “partial requirements” customers, the following service components are the most common:42
Backup Service. Backup or standby service supports a customer’s load that would otherwise be served by DG, during unscheduled outages of the on-site generation.
Scheduled Maintenance Service. Scheduled maintenance service is taken when the customer’s DG is due to be out of service for routine maintenance and repairs.
Supplemental Service. Supplemental service provides additional electricity supply for customers whose on-site generation does not meet all of their needs. In many cases, it is provided under the otherwise applicable full requirements tariff.
Economic Replacement Power. Some utilities offer economic replacement power—electricity at times when the cost of producing and delivering it is below that of the on-site source.
Together, the following features encourage customer-generators to use electric service most efficiently and minimize costs they impose on the electric system:
43
Reflect load diversity of CHP customers in charges for shared delivery facilities. Charges for transmission facilities and shared distribution facilities such as substations and primary feeders should reflect that they are designed to serve customers with diverse loads. Load diversity can be recognized by designing demand charges on a coincident peak demand basis as well as the customer’s own peak demand and by allocating demand costs primarily or exclusively to usage during on-peak hours. Differentiating on-peak demand from off-peak demand provides standby customers with an incentive to shift their use of the utility’s assets to off-peak hours, when the marginal cost of providing service is typically much lower.
Allow the customer to provide the utility with a load reduction plan. The plan should demonstrate its ability to reduce load within a required timeframe and at a specified amount to mitigate all, or a portion of, backup demand charges for local facilities. This allows the standby customer to use demand response to meet all, or a portion of, its standby needs. The utility would approve the load reduction plan, evaluating whether it provides sufficiently timely load shedding to avoid reserve costs incurred by the utility. The utility would approve the load reduction plan after evaluating and determining that it provides sufficiently timely load shedding to avoid reserve costs incurred by the utility.
42 The four bulleted service components are not necessarily subject to a demand charge. It depends on the utility’s rate structure. www.epa.gov/chp/documents/standby_rates.pdf. 43 For more on alignment of standby rates with rate design principles, see Standby Rates for Customer-Sited Resources: Issues, Considerations and the Elements of Model Tariffs, prepared by Regulatory Assistance Project and ICF International for the U.S. Environmental Protection Agency. December 2009. www.epa.gov/chp/documents/standby_rates.pdf.
March 2013 www.seeaction.energy.gov 9
In states with retail competition, offer a self-supply option for reserves. This can be in the context of the load reduction plan discussed above, through utility-controlled interruptible load, or some other means that can both save costs for the customer and avoid costs for the utility. The self-supply plan can be structured to reflect actual performance of the customer over time.
Offer daily, or at least monthly, as-used demand charges for backup power and shared transmission and distribution facilities. Moving away from annual ratcheted charges gives the CHP customer a chance to recover from an unscheduled outage without eroding savings for an entire year. Daily charges encourage customers to get their generators back online as quickly as possible. Daily charges for backup power should be market-based to provide appropriate price signals to CHP customers.
In states with retail competition, allow customer-generators the option to buy all of their backup power at market prices.
44 The customer can avoid any utility reservation charge for generation service because
the utility is relieved of the obligation to acquire capacity to supply energy during unscheduled outages of the customer’s CHP unit.
Schedule maintenance service at nonpeak times. In general, because this service can be scheduled for nonpeak times, it is considered to create few additional or marginal costs to the utility’s system, and tariffs are typically structured to exempt the customer from capacity-related costs (e.g., reservation charges or ratchets, for either generation or delivery).
Provide an opportunity to purchase economic replacement power. During times of the year when energy prices are low, the utility can provide on-site generators energy at market-based prices at a cost that is less than it costs to operate their CHP systems, and at no harm to other ratepayers. Such arrangements must be compatible with the structure of retail access programs, which the CHP customer may otherwise be relying on, and should allocate any incremental utility costs of purchasing such power (including general and administrative fees) to the CHP customer.
These features can create a standby rate regime consistent with standard ratemaking principles, avoiding cost shifting from CHP customers to other customers, while providing appropriate incentives to operate CHP facilities in a manner most efficient for the utility system as a whole, by aligning the economics for the CHP facility with the cost to serve that customer.
2.3 Successful Implementation Approaches
Pacific Power—Oregon Partial Requirements Service
Pacific Power provides standby services in Oregon under four primary tariffs and riders.45
Taken together, this set of tariffs provides many of the customer-generator benefits discussed above, while allowing recovery of actual costs incurred by the utility and protecting other customers.
The utility assesses charges for shared distribution facilities such as substations and transmission facilities based on the customer’s actual 15-minute net demand recorded for the month during on-peak hours, using the same rate and billing determinants as the full requirements tariff. There is no annual ratchet.
Cost recovery for local distribution facilities—those designed solely to serve the customer as well as those closest to end-users, such as transformers and low voltage lines—is based on the average of the two highest non-zero monthly on-peak demands for the past 12 months, same as for full requirements customers. The starting point and minimum level for the charge is the “baseline”—the customer’s peak demand on the utility system assuming normal operation of the customer’s generator. However, the
44 This guide does not explore the merits or problems with the development of standby rates; it identifies how standby rate policies can be successfully implemented to facilitate CHP. 45 These four tariffs include Schedule 48: Large General Service Partial Requirements 1,000 kW and Over Delivery Service, Schedule 76R: Large General Service Partial Requirements Service Economic Replacement Power Rider Delivery Service, Schedule 247: Partial Requirements Supply Service, and Schedule 276R: Large General Service Partial Requirements Service Economic Replacement Power Rider Supply Service. “Oregon Regulatory Information.” Pacific Power. www.pacificpower.net/about/rr/ori.html.
10 www.seeaction.energy.gov March 2013
baseline can be adjusted with a load curtailment plan for generator outages, installation of energy efficiency measures, and to accommodate planned, long-term changes in loads or generator operations.
The customer’s baseline also sets charges for reserves the utility holds to maintain capability to serve loads during outages of the on-site generator. The tariff provides self-supply options for reserves, including through an approved load reduction plan for supplemental reserve requirements.
Scheduled maintenance service must be scheduled 30 days in advance, in take-or-pay blocks at a forward market-based price. Pacific Power also offers partial requirements customers the option to buy replacement energy (usage above baseline) at market prices when beneficial for the customer. For a CHP customer, the determination of favorable conditions includes the total benefits derived from the CHP system (electricity plus heat) compared with advantageously priced replacement power and boiler fuel.
Energy service for unscheduled outages is based on real-time market prices. Importantly, demand and transmission charges for scheduled maintenance, economic replacement power and unscheduled outage service are based on daily demands and do not affect charges for distribution and transmission services under the base standby tariff.
Consolidated Edison Partial Requirements Service
Consolidated Edison offers replacement or supplemental service for approved projects for self-generation customers whose generation capacity is greater than 15% of their potential load. Pricing for this service is based on a contract demand representing the highest demand the facility is likely to meet for the customer under any circumstances. The charge for the contract demand reflects both the customer’s contribution to local facilities used on a regular basis for baseload demand, as well as customer-specific infrastructure necessary to meet the maximum potential demand with or without the customer’s generation in service. The rate for the entire contract demand is generally lower than the otherwise applicable rate. If the customer selects a contract demand level, the utility applies penalties if the maximum demand exceeds the contract demand by more than 10% or 20%.
46 If the
contract demand level is utility-determined there is no penalty for exceeding that level. In both cases, when the original contract demand is exceeded, contract demand is re-set to the new highest demand.
In addition, the company assesses a demand charge based on the actual demand recorded each day. The rate varies by season and time of day—peak versus off-peak.
47, 48 This variable charge recovers shared system
(upstream) costs. It is calculated on a daily basis.
Georgia Power49
Georgia Power provides backup service under a tariff rider. The rider allows a customer to contract for firm or interruptible standby capacity, or both, to replace capacity from a customer’s generation when it is not in service. Customers may designate the level of service they wish to purchase from the utility. For firm backup power, the customer must provide notification within 24 hours of taking such service. Interruptible backup power requires advance permission from the company, except in the case of an unplanned outage where a 30-minute notice is required after beginning service.
Maintenance power, supplied for outages, must be scheduled 14 days in advance. Maintenance power is available as firm service during the off-peak months and as interruptible service during peak months. Customers purchase supplemental power (power required during normal operation of the generator and normal demands by the facility) at normally applicable rates.
46 www.coned.com/documents/elecPSC10/GR1-23.pdf, leaf 164; No penalties are assessed if the utility determines the contract demand. 47 www.coned.com/documents/elecPSC10/SCs.pdf, leaf 453. 48 The charge is zero for off-peak hours. 49 www.georgiapower.com/pricing/files/rates-and-schedules/12.30_BU-8.pdf.
March 2013 www.seeaction.energy.gov 11
The utility computes the level of standby power as the difference between the “maximum metered demand measured during the time standby service is being taken, less the maximum metered demand during the time in the billing period when standby service is not being taken.” This demand determination can be made on a peak versus off-peak basis.
All billing determinants are based on monthly values, with no ratchets. However, demand charges are subject to a standby demand adjustment factor, which adjusts the billed standby demand once a customer uses backup service for more than 876 hours during the most recent 12-month period. This provides an incentive for a customer to use standby service as efficiently as possible.
How the Criteria Are Addressed
Policy Intent. The policy intent is to charge CHP customers only for costs they impose on the system consistent with ratemaking principles, encourage customer-generators to use electric service most efficiently to minimize costs they impose on the electric system, and ensure that costs for backing up CHP customers are not passed on to non-CHP customers. The customer and the utility can work together to schedule planned outages at times that are best for the utility system.
Market Signals. CHP users and potential CHP adopters are motivated by expected cost savings available from their systems. By shifting risk to CHP users and appropriately charging for services actually rendered, both utilities and customers can benefit through appropriate market signals.
Ratepayer Indifference. By more accurately balancing the charges for service actually rendered with appropriate market signals and incentives for operational efficiencies, all customers should benefit from appropriately structured standby tariffs.
2.4 Conclusions
Standby charges should be designed to most closely preserve the nexus between charges and cost of service. Standby rates were originally designed to reflect an environment in which a utility operated within a fairly closed system with a few interties with other utilities for backup emergency purposes. Today, many utilities rely on and participate in regional markets where electricity and capacity are pooled and can be purchased with relative ease. The ability to more easily transact energy and capacity allows a utility to take into account the probability of various CHP loads needing standby service at the same time. Together, the features listed below encourage customer-generators to use electric service most efficiently and minimize costs they impose on the electric system.
KEY IMPLEMENTATION APPROACHES: DESIGN OF STANDBY RATES
Offer daily or monthly as-used demand charges for backup power and shared transmission and distribution facilities.
Reflect load diversity of CHP customers in charges for shared delivery facilities.
Provide an opportunity to purchase economic replacement power.
Allow customer-generators the option to buy all of their backup power at market prices.
Allow the customer to provide the utility with a load reduction plan.
Offer a self-supply option for reserves.

STANDBY RATES FOR CUSTOMER-SITED RESOURCES
ISSUES, CONSIDERATIONS, AND THE ELEMENTS OF MODEL TARIFFS
U.S. Environmental Protection Agency Office of Atmospheric Programs
Climate Protection Partnerships Division 1200 Pennsylvania Ave., NW
Washington, DC 20460
December 2009
Final Report
Developed by the Combined Heat and Power Partnership

STANDBY RATES FOR CUSTOMER-SITED RESOURCES
ISSUES, CONSIDERATIONS, AND THE ELEMENTS OF
MODEL TARIFFS Prepared for:
U.S. Environmental Protection Agency Office of Atmospheric Programs Climate Protection Partnerships Division 1200 Pennsylvania Ave., NW Washington, DC 20460
Prepared by:
Regulatory Assistance Project 50 State St., Suite 3 Montpelier, VT 05602
ICF International 1655 N. Fort Myer Drive, Suite 600 Arlington, VA 22209
December 2009

Contents
List of Figures ............................................................................................................................... ii
List of Tables................................................................................................................................. ii
List of Acronyms and Abbreviations.............................................................................................. ii
Acknowledgements....................................................................................................................... ii
1: Executive Summary .............................................................................................. 1
2: Introduction ........................................................................................................... 2
3: Electric Rate Structures and Economics of Distributed Generation ................ 3
3.1 Elements of Electricity Rates.......................................................................................... 3
3.2 Standby Service ............................................................................................................. 4
3.3 The Economics of Distributed Generation...................................................................... 5
4: Tariff Designs, Supplemental Service, and Economics of Distributed Generation Systems.............................................................................................. 7
4.1 Analytical Approach........................................................................................................ 7
4.2 Example 1—Portland General Electric........................................................................... 9
4.3 Example 2—Orange & Rockland ................................................................................. 12
4.4 Example 3—NSTAR..................................................................................................... 14
5: Conclusions......................................................................................................... 17
6: Notes .................................................................................................................... 18
Appendix A: Additional Analyses of Specific Standby Tariffs ............................. A-1
A.1 Hawaiian Electric Company—Unbundled Rates and Daily Demand Charges........... A-1
A.2 Consolidated Edison—Daily As-Used Demand Charges........................................... A-2
Appendix B: Principles of Rate Design .................................................................. B-1
B.1 Basic Principles of Rate Design ................................................................................. B-1
B.2 Pricing the Components of Electric Service ............................................................... B-4
B.3 Notes.......................................................................................................................... B-7
Appendix C: References.......................................................................................... C-1
i

ii
List of Figures
Figure 1. Prototype Demand Profile ............................................................................................. 8
List of Tables
Table 1. Prototype CHP Facility.................................................................................................... 7
Table 2. Portland General Electric Tariff Provisions ..................................................................... 9
Table 3. Portland General Electric Cost Comparison ................................................................. 10
Table 4. Orange & Rockland Tariff Summary ............................................................................. 13
Table 5. Orange & Rockland Cost Comparison.......................................................................... 14
Table 6. NSTAR Tariff Summary ................................................................................................ 15
Table 7. NSTAR Cost Summary ................................................................................................. 16
Table 8. Hawaiian Electric Company Tariff Summary .............................................................. A-1
Table 9. Consolidated Edison Tariff Summary ......................................................................... A-3
List of Acronyms and Abbreviations
CHP combined heat and power DG distributed generation FERC Federal Energy Regulatory Commission kW kilowatt kWh kilowatt-hour MW megawatt
Acknowledgements
This document was prepared by Rick Weston of the Regulatory Assistance Project and Joel Bluestein, Bruce Hedman, and Rod Hite of ICF International. The authors would like to thank Calvin Timmerman, Christopher Young, Eric Wong, and Joseph Orlando for taking the time to review and comment on the initial draft of this paper. Their feedback was incisive and very helpful. Their thoughts and recommendations have been incorporated where appropriate; a few, however, were beyond the scope and resources of the project. Eastern Research Group, Inc. provided copyediting and production services.

1: Executive Summary
With increased interest in efficient, clean, customer-sited resources comes increased interest in the regulatory policies that affect their deployment. The economic viability of clean, distributed generation (DG) and, in particular, combined heat and power (CHP) facilities, heavily depends on the regulatory policies that determine how they are treated by the electricity network. This paper focuses on one of those policies: the structure of prices for standby service. The report identifies approaches that, given the costs and benefits of DG, provide appropriate savings to the clean, DG system owner and appropriate cost recovery to the utility.
The review of selected rate tariffs suggests that the better rate designs share common and central characteristics: they are designed to give customers a strong incentive to use electric service most efficiently, to minimize the costs they impose on the system, and to avoid charges when service is not taken. This means that they reward customers for maintaining and operating their onsite generation. Specifically, these tariffs are marked by some or all of the following features:
Contract demand or reservation charges are small in relation to the variable charges for peak demand and energy.
Peak demand charges are not ratcheted or, at worst, have 30-day ratchets (that is, there are no more than monthly as-used demand charges).
Energy-based charges to collect capacity costs would seem to offer the greatest promise in this regard, but utilities and their regulators do not appear to be prepared to entirely abandon some form of peak demand charge. As such, daily as-used demand charges are the next best solution, but how a particular rate is structured along these lines will depend on the levels of the various rate elements.
The rate structure yields a significant retail rate savings per kilowatt-hour (kWh) produced on site instead of purchased from the grid. This depends not only on the standby tariff itself, but also on the level and structure of the otherwise applicable full requirements tariff (e.g., the tariff that would apply in the absence of DG).
These findings are consistent with the understanding that the economics of onsite generation are based on reduced electricity purchases, and these reduced purchases must benefit the customer to make DG viable. Importantly, they also serve to remind regulators of the need to pay close attention to ensure that the design of partial requirement rate structures captures the economic and environmental benefits of reduced energy consumption. These examples also suggest that such rates can apply to DG while also fairly compensating utilities for the services they provide to onsite generators.
1
2: Introduction
Interest in clean, customer-sited,1 non-emergency generation, in particular CHP systems,2 continues to grow as appreciation likewise grows for the value that these resources can provide. The many benefits accrue both to the owners of the onsite resources—through cost savings from avoided purchases of grid-supplied power, improved reliability, reduced thermal (e.g., boiler) energy consumption, and lower overall energy costs—and to the electric system as a whole—through reduced demands for power, avoided investments in generation and delivery capacity, improved operational efficiencies, increased system reliability, and lower total system energy consumption, costs, and emissions.
With these benefits in mind, policy-makers, utility representatives, and system operators have begun to address the challenges of integrating these systems into the electric transmission and distribution networks. Much work has been done at the state and federal levels to develop and standardize technical and regulatory rules for interconnection of the onsite generator to the electric grid. Today, if interconnection remains a barrier to onsite generation, it is likely the result of a state’s failure to adopt appropriate rules, and not the consequence of unresolved technological or operational challenges.
Customers primarily install onsite generation in an attempt to reduce their overall energy costs. Onsite generation typically reduces the amount of electricity purchased while increasing onsite capital and fuel costs. The decision to generate one’s own power balances additional capital, fuel, and maintenance expenses with a decrease in the amount and therefore the cost of purchased power. CHP further enhances the customer economics because of additional savings from combining thermal and electric generation into one process. In general, CHP is most efficient, and cost effective, when it is sized to match the thermal loads of the facility and operates an extended number of hours on an annual basis. Electric rate structures, particularly standby and backup rates, can have a significant impact on CHP economics by affecting the amount of actual savings resulting from reduced electricity purchases from the grid. As such, tariffs can affect prime mover selection, system sizing, and operating strategy. Not all tariffs result in the most efficient system design or operating strategy.
Although an increasing number of states have begun to address the question of whether the lack of appropriate statewide rules on retail tariffs might also present a barrier to onsite generation, there is little evidence of a standard approach. States are innovating, and there are now several approaches to the design of rate structures for DG that warrant closer analysis.
This paper identifies the elements of rate structures that will appropriately charge customers with DG for the services they take, without creating economic barriers to DG. The degree to which customers’ charges are adjusted under a certain tariff by generating their own electricity from DG will determine whether or not this is the case. These rates should also fairly compensate the utility for the costs of serving customers with DG in order to protect other customers from being charged unfairly high rates. This avoidance of cross-subsidization cannot, in the absence of company-specific cost data, be directly judged. The analyses in this paper presume that rates that are in effect or proposed by utilities are meeting cost-recovery (or revenue-burden) goals.
2

3: Electric Rate Structures and Economics of Distributed Generation
This section provides a brief primer on the basics of electric service and rate design to provide a context for the later discussions of standby rates. While this discussion applies to rate design generally, this paper focuses on rate structures for customers that are most likely to be suited to onsite generation—that is, high-volume commercial and industrial users for whom DG capacity would be at least 200 kilowatts (kW), but more likely 500 kW and greater.3 Appendix B provides a more detailed discussion of these topics.
3.1 Elements of Electricity Rates
Electricity rates have three main components: customer charges, demand charges, and energy charges. There could, of course, be other charges as well, such as taxes or special assessments, but for the purposes of this paper, these can be ignored.4
The customer charge is a fixed, recurring charge (monthly or daily), typically intended to cover the constant costs of metering, billing, and service drop facilities, which must be recovered by the utility even if no electric service is taken. In this sense, it can be seen as a flat fee that provides access to the grid.
Energy charges are the charges for consumption of the electricity commodity applied on a per-kWh basis. Customers purchase energy at the tariffed rates or from third-party suppliers at negotiated rates; they may be differentiated by time-of-use, by season, by consumption block, or by some other means.5 In addition, there may be adders or surcharges to cover related costs and risks of operation. In some cases, there may be multiple commodity charges associated with different categories of usage charges. For example, higher energy charges might apply during on-peak time periods as opposed to off-peak time periods, or the energy charge might decrease as more energy is purchased, in a declining block structure. For residential and small commercial rates, energy charges may be the only category of rates. However, larger facility rates (e.g., commercial and industrial) typically include both energy and demand charges.
Demand charges are based on the peak electricity demand (kW) during a given period, typically 1 month. Demand charges are used to recover the capital costs of the capacity necessary to meet customers’ peak loads. Capacity is measured in kW or megawatts (MW), and it represents the ability of a facility (or the grid in the aggregate) to deliver the service desired at any instant. Because the electric service is to be provided on demand, the system must be designed to meet a variety of peak loads: that of the system as a whole, those of customers served by individual parts of the network, and those of individual customers. The costs of capacity can be included in per-kWh energy charges, as they often are for lower volume residential and small commercial consumers. For larger volume users, standard practice is to separate the charges for capacity and energy.
Demand charges are a means of allocating and recovering the costs of the capacity, measured and priced in dollars per kW per time period, to serve those peaks. They are deemed to give the
3

larger utility users stronger incentives to manage their peak demand most efficiently, thus minimizing the investment in physical infrastructure that the utility must make on the customers’ behalf. This incentive is further promoted by the common use of ratchets, which apply a peak demand value to the bill for anywhere from several months to a year after its occurrence.6 Ratchets turn a fee that would otherwise vary with changes in demand into something more like a fixed charge that locks a customer into a minimum monthly payment for the duration of the ratchet. Although there is a certain logic behind ratchets—i.e., they link customer charges to the longer term nature of the capacity obligations of the utility—they nevertheless can be a financial barrier for customers looking for more efficient means of meeting their energy needs (even as they have the effect of lowering the cost of off-peak power).7
Most large customer electric rates include both an energy and a demand component. The relative level of each is determined by the characteristics of the local grid, supply mix, and other local market factors. The significance of the two components for a customer depends heavily on the customer’s load factor. The load factor is the total energy consumption divided by the peak demand multiplied by the number of hours in the month. If the customer always consumed the same amount of electricity every hour of the month, then the demand would never change and the load factor would be 100 percent. This is an advantageous situation for the utility because its facilities are always being fully utilized. In this case, there would be little need to apply a demand charge, because demand and energy charges are fully linked.
If the demand is highly variable, then the load factor can be much less than 100 percent. In this case, there can be brief periods when supply facilities are heavily used, and long periods when consumption is much lower. In this situation, a utility would want to apply a demand charge to recover the costs of supplying the peak capacity that is not recovered by the lower level of consumption during nonpeak times. Because this load profile is in some respect related to the underlying operations of the customer, it might be appropriate for the customer to provide payment in this structure or alternatively to be driven by this structure to modify their operation to improve their load factor.
3.2 Standby Service
Customers who receive all of their electricity from the utility or via the grid are known as “full requirements” customers. Their electricity is provided under rates that are primarily some mix of the components discussed above. Customers with onsite generation typically require a different set of services, which includes continuing electricity service for the portion of usage that is not provided by the onsite generator, as well as service for periods of scheduled or unscheduled outages. “Partial requirements” is the more precise name for standby or backup service: the set of retail electric products that customers with onsite, non-emergency generation typically desire. This service could be a tariff that replaces the standard full requirements tariff or an additional tariff that applies on top of the standard tariff for certain special types of service. Many of the utilities that provide these services distinguish in their tariffs among three types of partial requirements service: supplemental, backup, and maintenance. Some differentiate only between standby and supplemental. In this report, we recognize the following as the most common components of service for partial requirements customers:
4
Supplemental Service. Supplemental service provides additional electricity supply for customers whose onsite generation does not meet all of their needs. In many cases it is provided under the otherwise applicable full requirements tariff.
Backup Service. Backup or standby service supports a customer’s load that would otherwise be served by DG, during unscheduled outages of the onsite generation.8
Scheduled Maintenance Service. Scheduled maintenance service is taken when the customer’s DG is due to be out of service for routine maintenance and repairs. In general, because this service can be scheduled for nonpeak times, it is considered to create few additional or marginal costs to the utility’s system, and tariffs are typically structured to exempt the customer from capacity-related costs (e.g., reservation charges or ratchets, for either generation or delivery).
Economic Replacement Power. Some utilities offer economic replacement power—electricity at times when the cost of producing and delivering it is below that of the onsite source.
Electric industry restructuring and the unbundling of the electric system’s components (generation, distribution, transmission, etc.) has, in some states, added complexity to rate design (i.e., the Federal Energy Regulatory Commission’s [FERC’s] no action policy on states if deregulated). Whereas the electricity prices of vertically integrated utilities that have not been unbundled often include generation, transmission, and distribution charges, the separation of these functions in restructured states has also led to a separation of the charges for them. This can cause some confusion when comparing different rate elements and, in particular, their ratchets and exemptions. In general, in a restructured state the question of partial requirements service is limited to the remaining monopoly services that are only provided by the local incumbent utility—distribution and, in certain cases, transmission—but there might also be default service offerings for energy charges.
3.3 The Economics of Distributed Generation
As noted above, the basic economic underpinning of a DG system is a tradeoff between reduced electricity purchases and the increased capital and operating costs for the DG system. The facility operator invests in capital equipment and must pay operating and fuel costs. These costs must be offset by reduced electricity purchases for the system to be economical. For a CHP system, there are also increased efficiency and operating cost savings because of the combined generation of thermal and electric energy. At this level, there is a simple economic tradeoff between savings from reduced electricity consumption and the cost of additional fuel for onsite generation and levelized cost of increased capital investment.
The complication with respect to electricity rates comes when reduced consumption does not result in reduced electricity bills. This can result depending on the structure of the tariff—electric rate demand versus energy charges. Because DG reduces the purchase of energy (kWh), a rate that includes only a commodity charge would provide the most direct recognition of the benefit of the DG system. An 80 percent reduction in energy purchased would result in an 80 percent reduction in electricity cost.
5

Although the reduced consumption theoretically translates into a commensurate reduction in demand, in reality, every system has some number of planned or unplanned outages during the year, during which facility demand can reach the non-DG level. Thus, if the rate has only a demand charge and no energy charge, an outage would cause the facility to reach its peak demand during the month for a brief period, causing the DG system to achieve no savings at all in that month. If the rate has an annual ratchet, the one outage would cause the system to forgo any savings for the entire year.
Under these circumstances, the profile and timing of outages can be a major determinant of DG cost and system economics. Unplanned outages might be extremely rare and might not coincide with other system outages. Planned outages can be scheduled for off-peak hours when they place minimum stress on grid facilities. Thus, determining the appropriate rate structure of DG facilities requires a different analysis than that applied to conventional facilities. The rates applied to DG facilities can be many different combinations of standard, supplemental service, standby, emergency, and economic replacement rates. One cannot identify a unique structure that fits all customer and market characteristics; however, the goal of this paper is to identify basic structures that provide appropriate savings to DG facilities and appropriate cost recovery to utilities, recognizing the costs and benefits of DG.
6
4: Tariff Designs, Supplemental Service, and Economics of Distributed Generation Systems
Evaluating the economic effect of rate design on DG systems requires a detailed assessment of the time-dependent effect of both components of the rate structure. This section employs such a detailed assessment to evaluate the effect of partial requirements charges on a prototype DG (CHP) facility and to identify beneficial rate structures. This section discusses three tariffs, and Appendix A describes two additional examples.
4.1 Analytical Approach
The subsections that follow identify and analyze several approaches to standby rates using actual tariffs. This analysis compares annual bills of a DG customer with specified usage and production characteristics against the bills that the customer would otherwise pay as a full requirements customer. In each example, it is assumed that customers are billed monthly. Because the purpose of these analyses is to determine only the annual electric bill savings that a DG system would yield under the various tariffs given specified load and operating characteristics, the economics of the DG system were not being evaluated, so no attempt to characterize its costs and its thermal energy benefits was made.
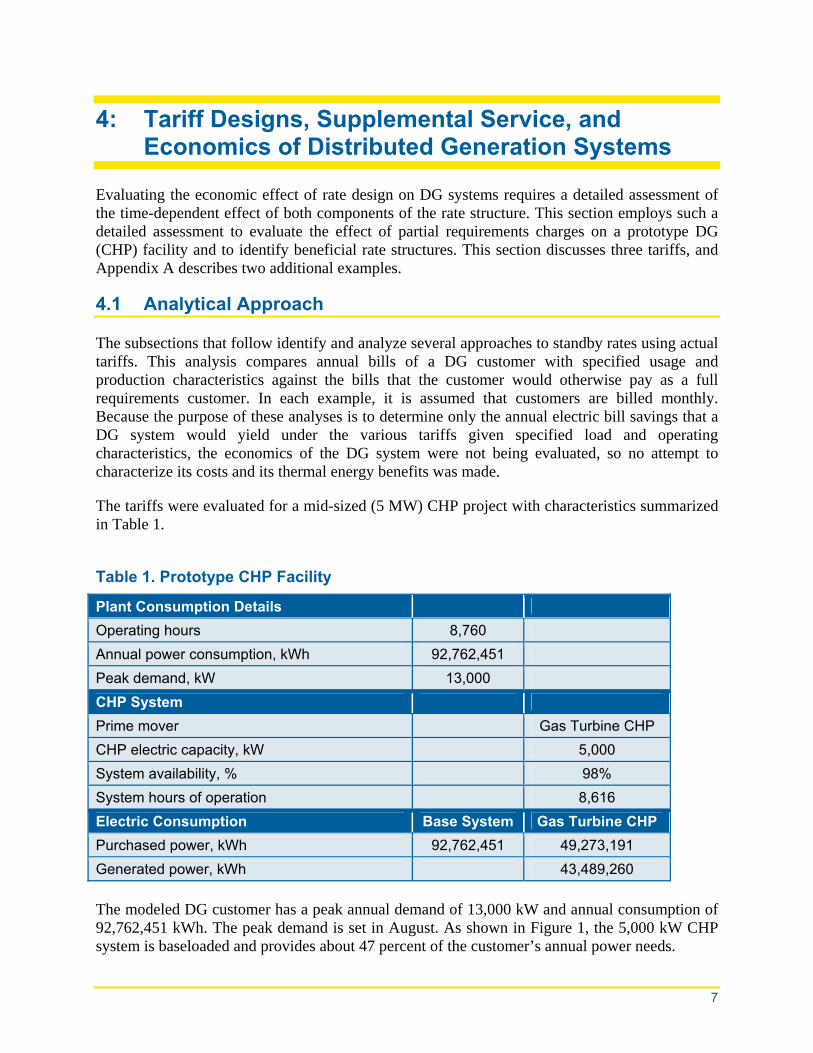
The tariffs were evaluated for a mid-sized (5 MW) CHP project with characteristics summarized in Table 1.
Table 1. Prototype CHP Facility
Plant Consumption Details Operating hours 8,760 Annual power consumption, kWh 92,762,451 Peak demand, kW 13,000 CHP System Prime mover Gas Turbine CHP CHP electric capacity, kW 5,000 System availability, % 98% System hours of operation 8,616 Electric Consumption Base System Gas Turbine CHP Purchased power, kWh 92,762,451 49,273,191 Generated power, kWh 43,489,260 The modeled DG customer has a peak annual demand of 13,000 kW and annual consumption of 92,762,451 kWh. The peak demand is set in August. As shown in Figure 1, the 5,000 kW CHP system is baseloaded and provides about 47 percent of the customer’s annual power needs.
7

In order to evaluate the impact of outages on savings under different tariff structures, the CHP system was assumed to experience unplanned outages during 2 months out of the year. As shown in Figure 1, the CHP system reduces the customer’s monthly peak billing demand by 5,000 kW, except during July and November when the outages occurred. In these months, the peak billing demand is equal to the total demand of the facility.
Figure 1. Prototype Demand Profile
0
2,000
4,000
6,000
8,000
10,000
12,000
14,000
Jan
Feb Mar AprMay Ju
n Jul
AugSep Oct
NovDec
Dem
and
(kW
)
Peak Monthly PlantDemandPeak Monthly BillingDemand
The rate impacts for the system for each tariff were calculated for each month of the year for the DG and non-DG cases. A spreadsheet tool was developed to calculate these monthly values and summarize them for the year. The tool calculated several annual average cost figures based on the total energy consumption. The first is the average cost per kWh for grid-supplied electricity under the full requirements tariff. This was calculated as the annual bill divided by the annual electricity consumption or purchases. The second is the average cost per kWh for grid-supplied electricity under the partial requirements tariff. This is the annual utility bill divided by the annual electricity purchases. Next, the tool calculated the value, per kWh, of the avoided grid-supplied electricity. This was calculated as the bill savings divided by the avoided consumption (or generation).
Last, the tool compared the value of the avoided purchases with the value of the full requirements electricity on a per-kWh basis. This avoided cost percentage is an important concept for evaluating the treatment of onsite generation by partial requirement tariff structures. One of the key economic values of onsite generation9 is the displacement of purchased electricity and the avoidance of those costs. Ideally, the reduction in electricity price should be commensurate with the reduction in purchased electricity. If the onsite system reduces consumption by 80 percent, the cost of electricity purchases would also be reduced by 80 percent. The economics are severely impacted if partial requirements rates are structured so that only a small portion of the electricity price can be avoided. The higher the ratio of avoided costs
8
to the full retail average price, the higher the user’s savings. As an evaluation measure, partial requirement rate tariffs that result in avoided costs that are above 90 percent of the full service retail rate percentage generally provide adequate savings to support onsite generation.
4.2 Example 1—Portland General Electric
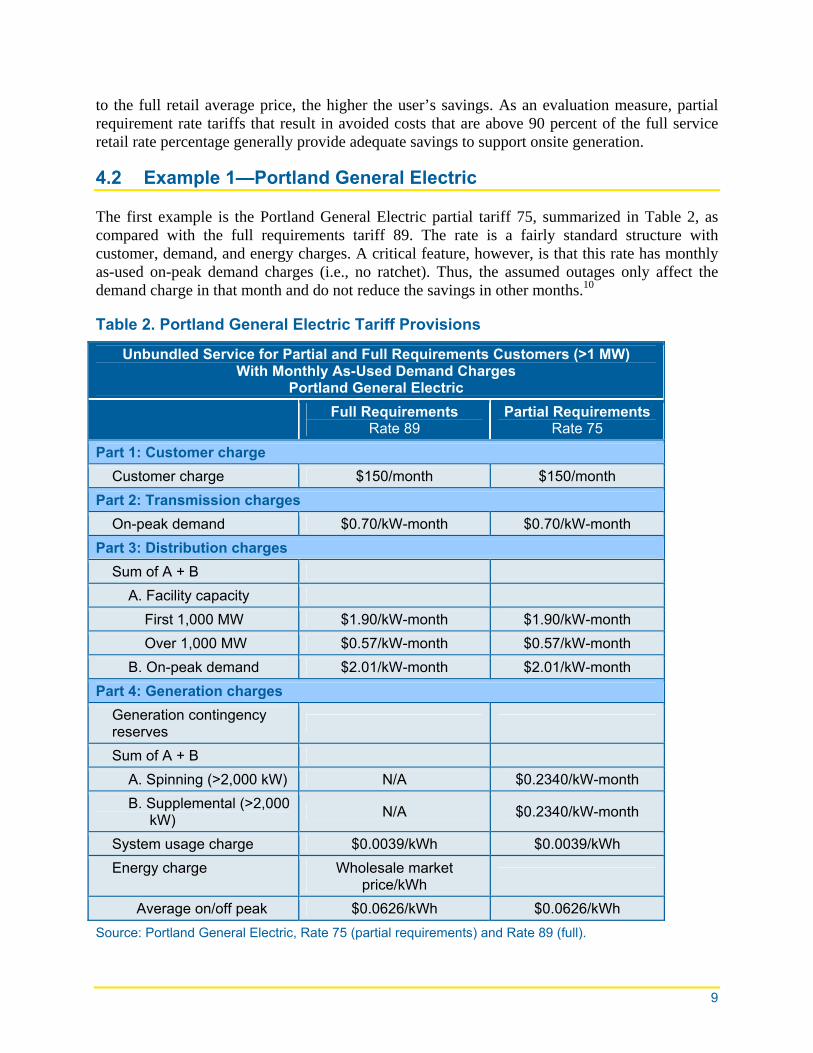
The first example is the Portland General Electric partial tariff 75, summarized in Table 2, as compared with the full requirements tariff 89. The rate is a fairly standard structure with customer, demand, and energy charges. A critical feature, however, is that this rate has monthly as-used on-peak demand charges (i.e., no ratchet). Thus, the assumed outages only affect the demand charge in that month and do not reduce the savings in other months.10
Table 2. Portland General Electric Tariff Provisions
Unbundled Service for Partial and Full Requirements Customers (>1 MW) With Monthly As-Used Demand Charges
Portland General Electric Full Requirements
Rate 89 Partial Requirements
Rate 75 Part 1: Customer charge Customer charge $150/month $150/month Part 2: Transmission charges On-peak demand $0.70/kW-month $0.70/kW-month Part 3: Distribution charges Sum of A + B A. Facility capacity First 1,000 MW $1.90/kW-month $1.90/kW-month Over 1,000 MW $0.57/kW-month $0.57/kW-month B. On-peak demand $2.01/kW-month $2.01/kW-month Part 4: Generation charges Generation contingency reserves
Sum of A + B A. Spinning (>2,000 kW) N/A $0.2340/kW-month B. Supplemental (>2,000
kW) N/A $0.2340/kW-month
System usage charge $0.0039/kWh $0.0039/kWh Energy charge Wholesale market
price/kWh
Average on/off peak $0.0626/kWh $0.0626/kWh Source: Portland General Electric, Rate 75 (partial requirements) and Rate 89 (full).
9

The partial requirements tariff is in most respects the same as the full requirements tariff. The primary difference is a contingency reserve and a spinning reserve charge applied to the onsite generator capacity. These contract demand charges are fixed, but their rates are low enough that they do not significantly change the electricity cost for the CHP system. Table 3 shows the breakdown of costs for the fuel requirements and partial requirements cases. There are three key elements:
The first thing to notice is that the energy charges constitute more than 90 percent of the total cost in both cases. Because DG affects energy consumption, this is an initial indicator that these rates will be favorable for DG economics.
Second, as mentioned above, this rate does not have a demand ratchet, so the outages do not have an exaggerated effect on the cost.
Finally, the standby demand charges, though fixed, are only a $28,000 adder compared with the $3-million savings provided by the CHP systems.
Overall, the cost savings are more than 97 percent of the electricity savings, indicating that the tariff does a good job of recognizing the value of DG.11
Table 3. Portland General Electric Cost Comparison
Comparative Annual Bills Full Requirements
Partial Requirements
Purchased electricity, kWh 92,762,451 49,273,191Facilities charges $1,800 $1,800Distribution on-peak demand charges $255,056 $153,601Facility capacity demand charges $105,404 $88,289Transmission on-peak demand charges $88,826 $53,493Standby demand charges $0 $28,347Energy charges $6,170,439 $3,277,589Total electric charges $6,621,524 $3,603,120 Average rate for purchased power $0.0714 $0.0731Average avoided rate N/A $0.0694 Average avoided rate as a percentage of average retail service rate 97.2%
Source: EPA analysis using Portland General Electric tariff.
10

This rate structure illustrates a number of rate design features that could be appropriate for large users, whether full or partial requirements:
Transmission, distribution, and generation charges are separated and, within these categories, the rates are further unbundled as justified by their cost characteristics.
The customer charge, transmission rate, and distribution rates are the same for full and partial requirements customers.12 This might also be true of the generation rates, but it could depend on the existence of competitive alternatives.
The charges might differ, depending on the voltage level at which service is taken (i.e., secondary, primary, sub-transmission).
The customer charge is typically a fixed, periodic (daily or monthly) charge. It should cover at most the costs of metering, billing, and customer service that do not vary with usage. It goes without saying that charges should not be duplicative—for example, a partial requirements customer should not pay a customer charge for standby service and a second one for supplemental service.
The transmission charge is applied to kW of monthly on-peak demand (no ratchet).
There are two categories of distribution charges, one for dedicated facilities and a second for shared facilities.
The facilities (or contract demand) charge is a per-kW fee applied to the customer’s maximum noncoincident peak demand (or contractually agreed-on maximum) of required capacity for dedicated facilities, subject to an 11-month ratchet or similar mechanism.
The charge for shared facilities is also a per-kW fee, but applied to the customer’s maximum monthly demand during the on-peak periods (e.g., 8 a.m. to 11 p.m.).
The generation charges cover the costs of generation capacity necessary to serve unplanned outages of the DG. These per-kW charges can be calculated in one of two ways, in recognition of the DG’s diversity benefits (they should, theoretically at least, yield the same result):
1. As a function of the probability of the occurrence of an unplanned outage coinciding with a system peak or other times of capacity constraint (e.g., when other units are suffering unplanned outages). The ratchet will depend in part on the nature of wholesale capacity and energy markets and the obligations of participants. At most, a ratchet should reflect the timing and duration of capacity purchase requirements, but should also be reflective of the other uses to which that capacity can also be put (i.e., the diversity of the loads it will serve).
2. As a share of the contingency reserves required to serve load in the event of an unplanned outage.13 Energy charges are rendered in dollars per kWh and can be differentiated by time (on-peak, off-peak, season, hourly) to reflect the variable costs of production or a market-based approach.
11

4.3 Example 2—Orange & Rockland
Orange & Rockland is an investor-owned utility in New York State. Table 4 summarizes Orange & Rockland’s standby service tariff SC-25, as compared with its full requirements tariff SC-9. A unique feature of this standby service tariff is that all service—both that needed to serve the customer when its onsite generation is offline (i.e., standby) and that needed to serve the customer’s demand in excess of the capacity of its onsite generation (i.e., supplemental)—is taken under the partial requirements tariff. This means that the contract demand charge applies to the customer’s total maximum demand, not merely that portion necessary to backing up its generator. In this respect it differs from other tariffs with daily as-used demand charges (for instance, see Appendix A, which describes the Hawaiian Electric standby tariff). Note, however, that a customer has the option to segregate a portion of its load so it might indeed be billed under the applicable full requirements tariff.
As suggested earlier, a monthly demand charge is, in effect, a daily demand charge with a 30-day ratchet. An alternative to a monthly demand charge for shared facilities is a daily as-used, on-peak demand charge. It reduces the costs of partial requirements service for those customers whose need for backup is infrequent, providing incentive for increased onsite generation. In its other aspects, this type of rate design looks very much like the previous design.
12
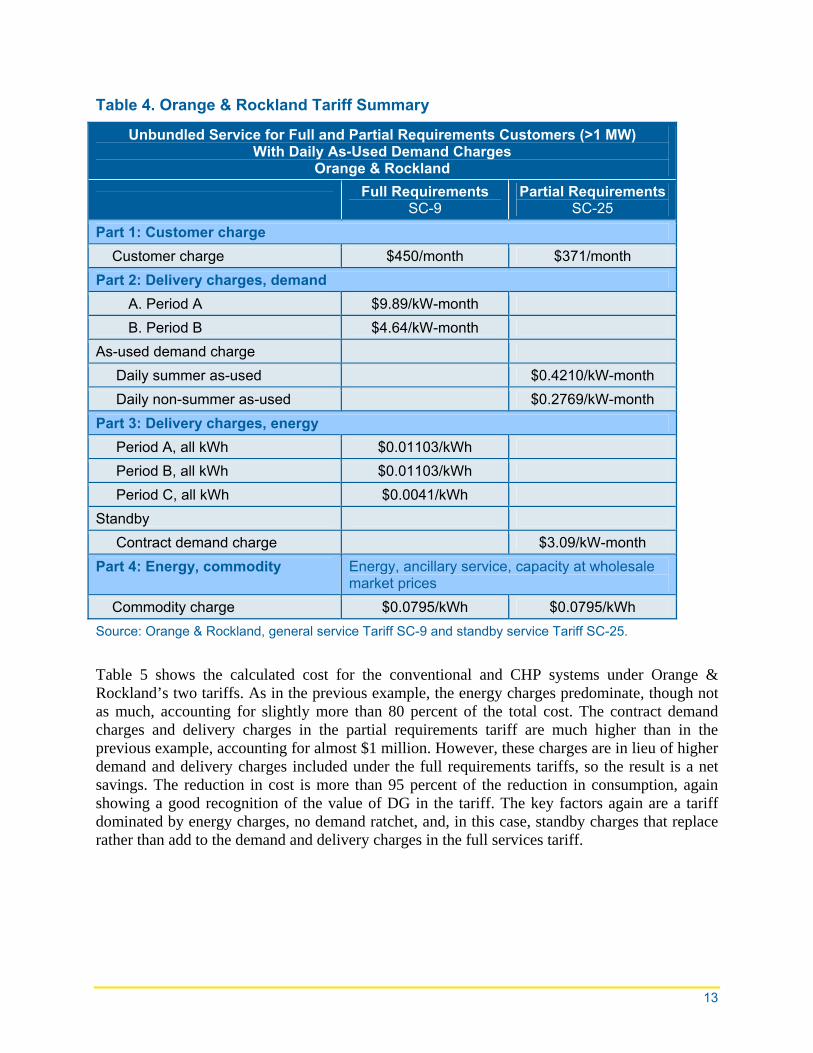
Table 4. Orange & Rockland Tariff Summary
Unbundled Service for Full and Partial Requirements Customers (>1 MW) With Daily As-Used Demand Charges
Orange & Rockland
Full Requirements SC-9
Partial Requirements SC-25
Part 1: Customer charge Customer charge $450/month $371/month Part 2: Delivery charges, demand A. Period A $9.89/kW-month B. Period B $4.64/kW-month As-used demand charge Daily summer as-used $0.4210/kW-month Daily non-summer as-used $0.2769/kW-month Part 3: Delivery charges, energy Period A, all kWh $0.01103/kWh Period B, all kWh $0.01103/kWh Period C, all kWh $0.0041/kWh Standby Contract demand charge $3.09/kW-month Part 4: Energy, commodity Energy, ancillary service, capacity at wholesale
market prices Commodity charge $0.0795/kWh $0.0795/kWh Source: Orange & Rockland, general service Tariff SC-9 and standby service Tariff SC-25.
Table 5 shows the calculated cost for the conventional and CHP systems under Orange & Rockland’s two tariffs. As in the previous example, the energy charges predominate, though not as much, accounting for slightly more than 80 percent of the total cost. The contract demand charges and delivery charges in the partial requirements tariff are much higher than in the previous example, accounting for almost $1 million. However, these charges are in lieu of higher demand and delivery charges included under the full requirements tariffs, so the result is a net savings. The reduction in cost is more than 95 percent of the reduction in consumption, again showing a good recognition of the value of DG in the tariff. The key factors again are a tariff dominated by energy charges, no demand ratchet, and, in this case, standby charges that replace rather than add to the demand and delivery charges in the full services tariff.
13
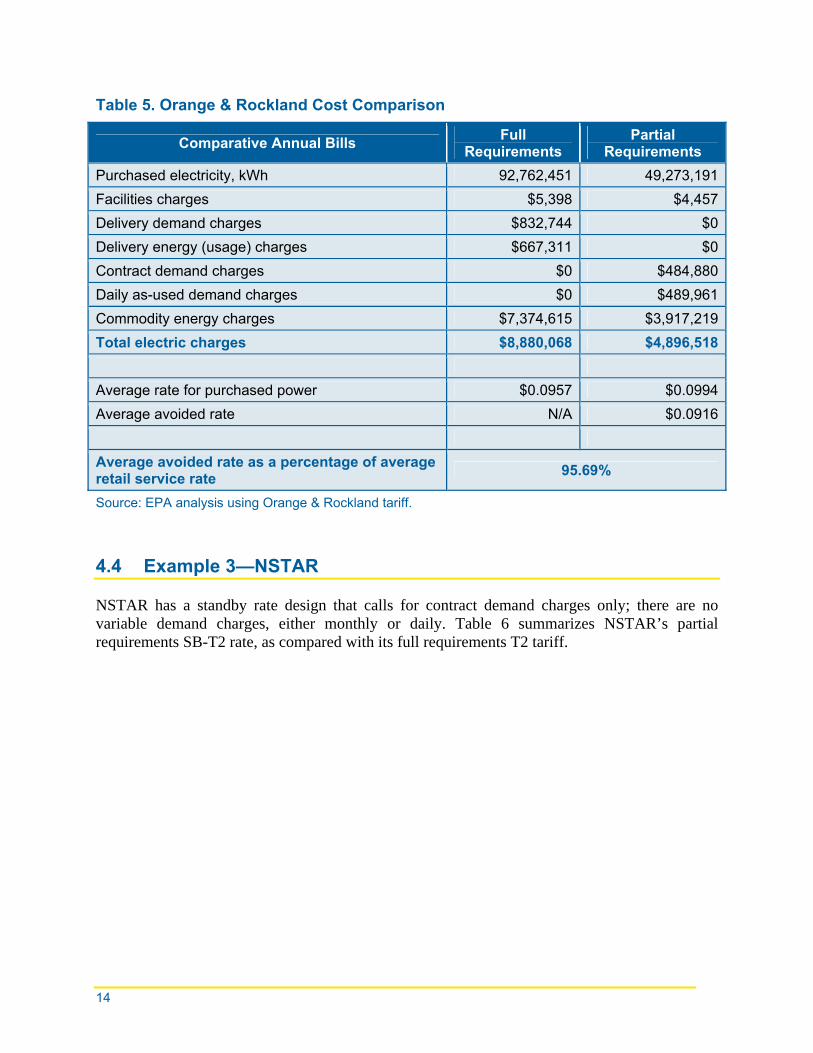
Table 5. Orange & Rockland Cost Comparison
Comparative Annual Bills Full Requirements
Partial Requirements
Purchased electricity, kWh 92,762,451 49,273,191Facilities charges $5,398 $4,457Delivery demand charges $832,744 $0Delivery energy (usage) charges $667,311 $0Contract demand charges $0 $484,880Daily as-used demand charges $0 $489,961Commodity energy charges $7,374,615 $3,917,219Total electric charges $8,880,068 $4,896,518 Average rate for purchased power $0.0957 $0.0994Average avoided rate N/A $0.0916 Average avoided rate as a percentage of average retail service rate 95.69%
Source: EPA analysis using Orange & Rockland tariff.
4.4 Example 3—NSTAR
NSTAR has a standby rate design that calls for contract demand charges only; there are no variable demand charges, either monthly or daily. Table 6 summarizes NSTAR’s partial requirements SB-T2 rate, as compared with its full requirements T2 tariff.
14
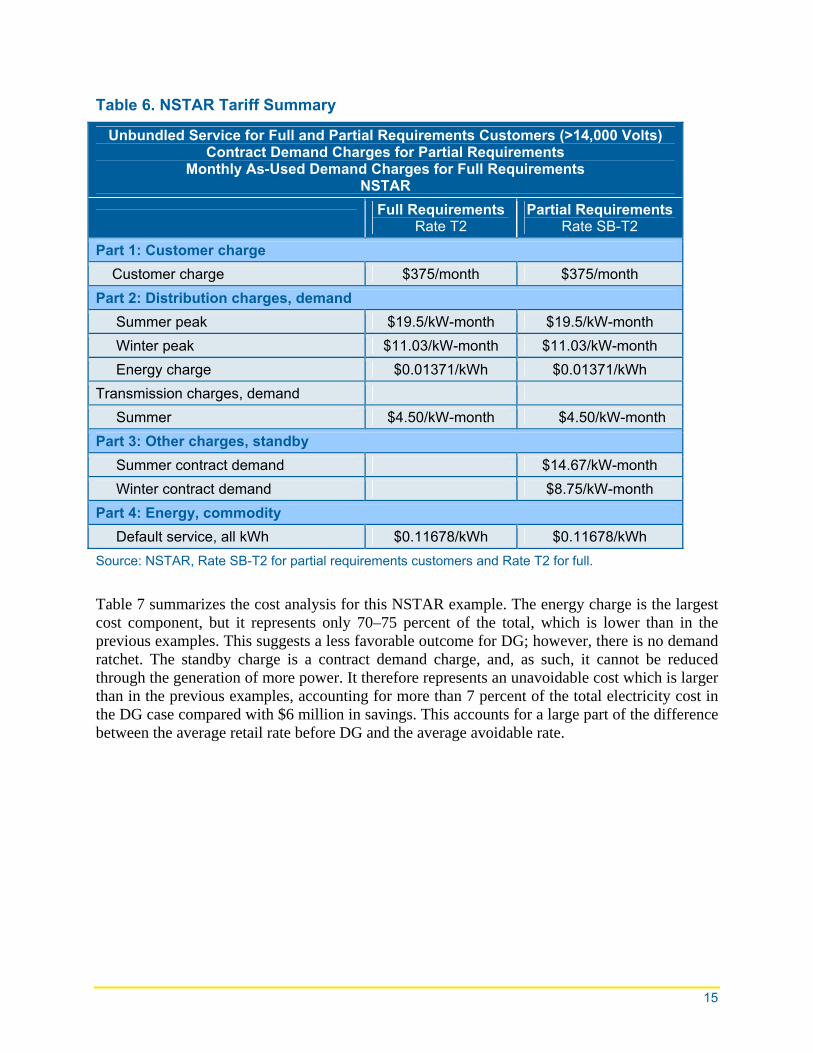
Table 6. NSTAR Tariff Summary
Unbundled Service for Full and Partial Requirements Customers (>14,000 Volts) Contract Demand Charges for Partial Requirements
Monthly As-Used Demand Charges for Full Requirements NSTAR
Full Requirements Rate T2
Partial Requirements Rate SB-T2
Part 1: Customer charge Customer charge $375/month $375/month Part 2: Distribution charges, demand Summer peak $19.5/kW-month $19.5/kW-month Winter peak $11.03/kW-month $11.03/kW-month Energy charge $0.01371/kWh $0.01371/kWh Transmission charges, demand Summer $4.50/kW-month $4.50/kW-month Part 3: Other charges, standby Summer contract demand $14.67/kW-month Winter contract demand $8.75/kW-month Part 4: Energy, commodity Default service, all kWh $0.11678/kWh $0.11678/kWh Source: NSTAR, Rate SB-T2 for partial requirements customers and Rate T2 for full.
Table 7 summarizes the cost analysis for this NSTAR example. The energy charge is the largest cost component, but it represents only 70–75 percent of the total, which is lower than in the previous examples. This suggests a less favorable outcome for DG; however, there is no demand ratchet. The standby charge is a contract demand charge, and, as such, it cannot be reduced through the generation of more power. It therefore represents an unavoidable cost which is larger than in the previous examples, accounting for more than 7 percent of the total electricity cost in the DG case compared with $6 million in savings. This accounts for a large part of the difference between the average retail rate before DG and the average avoidable rate.
15
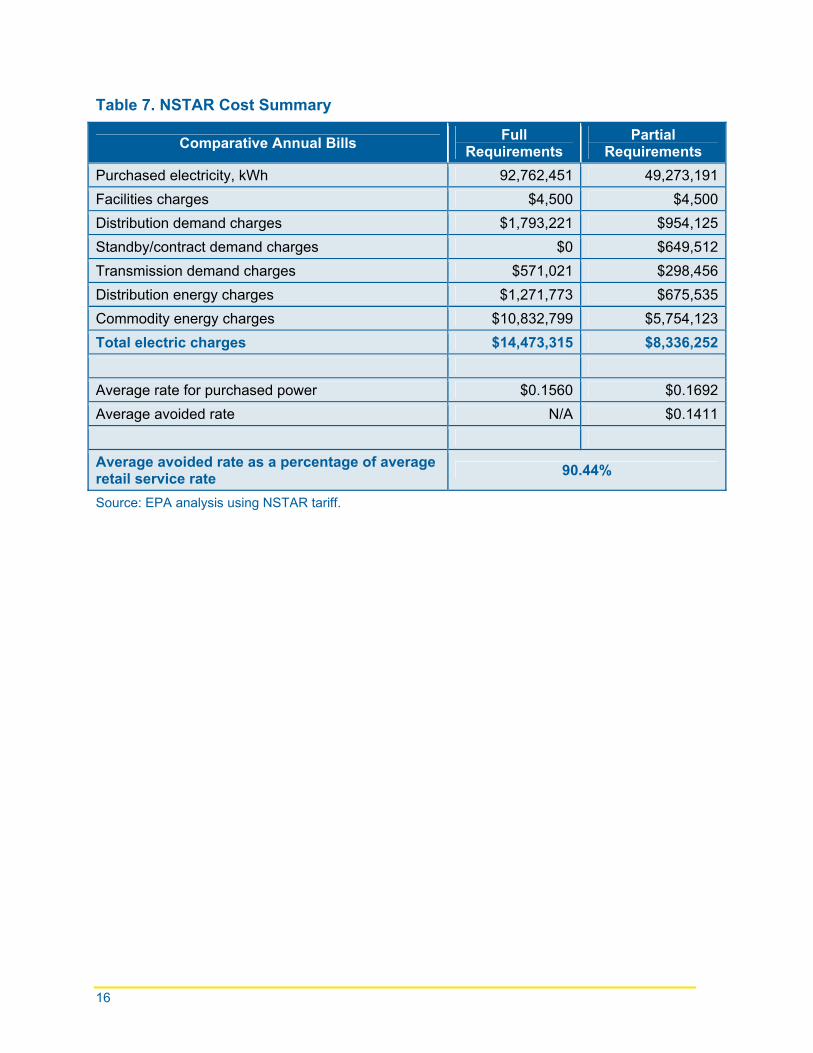
Table 7. NSTAR Cost Summary
Comparative Annual Bills Full Requirements
Partial Requirements
Purchased electricity, kWh 92,762,451 49,273,191Facilities charges $4,500 $4,500Distribution demand charges $1,793,221 $954,125Standby/contract demand charges $0 $649,512Transmission demand charges $571,021 $298,456Distribution energy charges $1,271,773 $675,535Commodity energy charges $10,832,799 $5,754,123Total electric charges $14,473,315 $8,336,252 Average rate for purchased power $0.1560 $0.1692Average avoided rate N/A $0.1411 Average avoided rate as a percentage of average retail service rate 90.44%
Source: EPA analysis using NSTAR tariff.
16
5: Conclusions
A host of factors will affect increased investment in efficient, clean DG. These factors include the costs of the onsite DG systems and the costs (e.g., the rates) for partial requirements electricity service. Rate designs that have a reasonable balance between energy and demand or reservation charges will naturally be more amenable to the broad policy goal of encouraging clean, efficient DG. Rate designs that reward reliable operation can encourage the development of a diversified, more reliable electric grid. The review of tariffs and operation on peak in this report suggests that the more favorable rate designs share common and central characteristics: they are designed to give customers a strong incentive to use electric service most efficiently, to minimize the costs they impose on the system, and to avoid charges when service is not taken. Put another way, they reward customers for maintaining and operating their onsite generation. Specifically, they are marked by some or all of the following features:
Contract demand or reservation charges are small in relation to the variable charges for peak demand and energy.
Peak demand charges are not ratcheted or, at worst, have 30-day ratchets (that is, there are no more than monthly as-used demand charges).
Energy-based charges to collect capacity costs would seem to offer the greatest promise in this regard, but utilities and their regulators do not appear to be prepared to entirely abandon some form of peak demand charge. As such, daily as-used demand charges are the next best solution, but how a particular rate is structured along these lines will depend (as the first bullet mentions) on the levels of the various rate elements.
The rate structure yields a high value of retail rate savings per kWh produced on site instead of purchased from the grid. This depends not only on the standby tariff itself, but also on the level and structure of the otherwise applicable full requirements tariff.
These findings are consistent with the understanding that the economics of onsite generation are based on reduced electricity purchases, and these reduced purchases must benefit the customer to make DG viable. Importantly, they also serve to remind regulators of the need to pay close attention to ensuring that the design of partial requirement rate structures captures the economic and environmental benefits of reduced energy consumption. These examples also suggest that such rates can apply to DG while also fairly compensating utilities for the services they provide to onsite generators.
17
18
6: Notes
1 There are a variety of terms and associated acronyms for customer-sited generation, some of which are synonyms and some of which refer to subsets of others: for example, DG, onsite generation, and CHP systems. For simplicity’s sake, we use the catch-all term “DG” here because our analyses are concerned only with utility rates and not with the costs and benefits of different kinds of onsite facilities. The generic system that we model in the analyses is a high-capacity factor CHP system slightly more than 5 MW in size.
2 EPA’s Combined Heat and Power Partnership defines CHP as follows: “CHP, also known as cogeneration, is an efficient, clean, and reliable approach to generating power and thermal energy from a single fuel source.”
3 Energy and Environmental Analysis, an ICF International Company, maintains a Combined Heat and Power Installation Database that contains data on CHP units in each state. The database can be accessed at <http://www.eea-inc.com/chpdata/States/MT.html>.
4 Of course, how these other charges are calculated (e.g., as a function of demand or energy or according to some other measure) will be relevant to whether they pose barriers to DG and can be avoided.
5 Some tariffs define their consumption blocks in terms of kWh per kW of demand, thus relating usage directly to levels of demand.
6 A typical ratchet calls for billing the customer, in each of the 11 months following their peak demand, for a share of that peak demand or the peak in that month, whichever is greater. If a higher peak occurs, that new demand forms the basis of a new ratchet, which then extends for the following 11 months, unless it too is surpassed. To the extent that generation and delivery charges are unbundled, the computation and application of the charges and ratchets can differ. In the case of generation, the demand charge should be a function of the customer’s contribution to system (i.e., coincident) peak, whereas for delivery it will be a function of the customer’s noncoincident peak and its contribution to the need for dedicated and shared facilities.
7 The tension with ratchets lies in precisely this circumstance. Onsite generation systems, particularly CHP systems with higher capacity factors, save energy, but depending on the nature of their outages, they might have less of an impact on the need for grid-supplied capacity (both generation and delivery). Whether this is the case depends on the probabilities and timing of outages and the overall load shapes of the relevant customer classes and the system as a whole. A relatively diverse system should have less of a need for longer-duration charges. Some standby tariffs allow for the conversion of the historical ratchet into the level of contract or reservation demand, which further exacerbates the challenges for the customer in making the case for DG work.
8 At least one utility—Detroit Edison—calls the service that it provides to customers with onsite generators “backup,” even if the customer sheds load to compensate for the unplanned outage (see the discussion in Section III.C. on physical assurance). Similarly, all service taken by an Orange & Rockland DG customer is supplied under the partial requirements tariff; “standby” is not differentiated from “supplemental” service.
9 There are additional economic values provided by onsite generation, including increased reliability and, in the case of CHP applications, reduced fuel use for onsite thermal needs.
10 This example assumes that this customer is on a calendar month billing cycle. Other simplifying assumptions having to do with the market price for the energy commodity were also made.
11 This is the consequence of a simplifying assumption in which the generation energy charges that partial requirements customers pay are the same as those paid by the full requirements customer. This is not the case in practice. Whereas the partial requirements customer pays for its generation contingency reserves separately from the energy it uses, the full requirements customer pays an energy rate that already includes the cost of the contingency reserves. By using the same energy commodity charge for both customers, we have slightly
19
overstated the cost of partial requirements service, though not significantly enough to affect the central conclusions.
12 This assumes that the distribution- and transmission-level diversity benefits (or losses) provided by DG customers do not significantly differ from those of full requirements customers. If they do, regulators might want to set rates that better reflect those impacts.
13 Mathematically, the differences between the two methods are as follows. In the first instance, the amount of load to be served in the case of an outage is discounted by the probability of that outage occurring on peak. Then applied to that discounted demand is a price per kW for the generation needed to cover it. In the second case, it is the cost of the system’s generation reserves that is discounted (that is, it is shared among all customer classes according to their contributions to system peak) and is then applied to the total kW that a customer is expected to incur during an unplanned outage.


Appendix A: Additional Analyses of Specific Standby Tariffs
A.1 Hawaiian Electric Company—Unbundled Rates and Daily Demand Charges
This is an additional example of a standby rate that makes use of daily as-used demand charges. Hawaiian Electric Company, serving an island, is faced with particularly high costs. Its rates are provided in Table 8.
Table 8. Hawaiian Electric Company Tariff Summary
Unbundled Service for Full and Partial Requirements Customers (>1 MW) With Daily As-Used Demand Charges
Hawaiian Electric Company
Full Requirements Rate PS
Partial Requirements Rate SS
Part 1: Customer charge Customer charge $230/month $230/month
Part 2: Delivery charges, demand Sum of A + B A. Reservation demand charge* $7.26/kW-month B. As-used demand charge $0.66/kW-day First 500 kW of billing demand $10.00/kW-month Next 1,000 kW of billing demand $9.50/kW-month Over 1,500 kW of billing demand $8.50/kW-month
Part 3: Delivery charges, energy All kWh $0.124/kWh First 200 kWh/month per kW of
billing demand** $0.072087
Next 200 kWh/month per kW of billing demand
$0.064104
Over 400 kWh/month per kW of billing demand
$0.061010
Part 4: Energy, commodity $0.15/kWh $0.15/kWh Source: Hawaiian Electric Company, full requirements Rate PS and partial requirements Rate SS.
*Note that, unlike the Orange & Rockland contract demand charge, Hawaiian Electric Company’s reservation demand charge applies only to the amount of demand associated with backup service (e.g.,
A-1
the nameplate capacity of the onsite generation or a contractually agreed-on demand). Any demand in excess of that amount is paid for under the otherwise applicable full requirements tariff.
**Energy charges in kWh/month per kW of billing demand denote a declining block structure where the number of kWh under each block rate is a function of the monthly kW billing demand.
The standby rate customer, as in the other examples discussed in this report, will avoid the purchase of 47 percent of its grid-supplied energy, and the customer will reduce its utility bill by 42 percent. The average cost of a grid-supplied kWh under the partial requirements tariff is approximately 5 percent greater than under full requirements. The value of the average avoided kWh is 94.3 percent of the average retail rate.
Of interest is the fairly high per-kWh charge ($0.124/kWh) for delivering energy to the partial requirements customer when the DG is offline. A similar charge is not imposed on full requirements customers, but they pay delivery demand charges that range from 17 percent to 37 percent higher than partial requirements customers. An energy-based delivery charge is, as a general matter, a preferred approach to standby rate design, in that it gives the customer a strong and direct incentive to ensure that their DG is properly maintained and operating. In this example, the delivery charge constitutes a relatively small portion of the total annual bill (approximately $90,000) because the onsite generation operates at a fairly high capacity factor. But, for a less well-performing DG system, this charge could be much larger. This tariff, in effect, shifts part of the revenue burden for partial requirements customers from an unavoidable delivery demand charge to a “pay as you go” energy charge. This, in combination with the daily as-used demand charge, enables the 42 percent reduction in the customer’s annual bill and results in the fairly high value of avoided retail purchases. Obviously, even a rate structure that makes use of avoidable charges might still impose relatively high bills on the customer with DG, if the recurring charges (customer and reservation or contract demand charges) are themselves set at disproportionately high levels. What matters are the relative shares of the total bill to which the various rate elements contribute.
A.2 Consolidated Edison—Daily As-Used Demand Charges
This analysis shows the full and partial requirements tariffs of an additional New York utility, Consolidated Edison. Table 9 compares this utility’s full and partial requirements tariffs.
A-2

A-3
Table 9. Consolidated Edison Tariff Summary
Unbundled Service for Full and Partial Requirements Customers (>1.5 MW) With Daily As-Used Demand Charges
Consolidated Edison
Full Requirements Tariff SC-9, Rate II
Partial Requirements Tariff SC-14RA
Part 1: Customer charge Customer charge $0 $908
Part 2: Delivery charges, demand June–September: sum of A + B + C A. M–F, 8 a.m.–6 p.m. $5.86/kW-month B. M–F, 8 a.m.–10 p.m. $11.09/kW-month C. All days, all hours $10.94/kW-month $5.41/kW-month All other months: sum of B + C B. M–F, 8 a.m.–10 p.m. $8.14/kW-month C. All days, all hours $3.54/kW-month
Part 3: Delivery charges, as-used demand 8 a.m.–6 p.m., Jun–Sept $0.3423/kW-day 8 a.m.–10 p.m., Jun–Sept $0.6910/kW-day 8 a.m.–10 p.m., other months $0.5200/kW-day
Part 4: Delivery charges, energy M–F, 8 a.m.–10 p.m. $0.0058/kWh All other hours/days $0.0058/kWh
Part 5: System benefits charges, energy All hours/days $0.0018/kWh $0.0018/kWh Part 6: Energy, commodity Energy, ancillary service, capacity at wholesale
market prices Source: Consolidated Edison, partial requirements tariff SC-14RA and full requirements tariff SC-9, Rate II.
The partial requirements customer, in keeping with the other examples, will avoid the purchase of 47 percent of its grid-supplied energy, and will reduce its utility bill by 43.7 percent. The average cost of a grid-supplied kWh under the partial requirements tariff is 6 percent greater than that under full requirements. The value of the average avoided kWh is 93.2 percent of the average retail rate.


Appendix B: Principles of Rate Design
B.1 Basic Principles of Rate Design
There are two broad, fundamental justifications for governmental oversight of the utility sector. The first is the widely held belief that this sector’s outputs are essential to the well-being of society—its households and businesses. The second is that its technological and economic features are such that a single firm often can serve the overall demand for its output at a lower total cost than can any combination of more than one firm. Competition cannot thrive under these conditions and, eventually, all firms but one exit the market. This is called “natural monopoly,” and, like monopoly power in general, it gives the surviving firm the power to restrict output and set prices at levels higher than are economically justified. Economic regulation is seen then as the necessary and explicit public or governmental intervention into a market to achieve a public policy or social objective that the market fails to accomplish on its own.
In light of the economic and public welfare characteristics of utilities, certain purposes for price regulation emerge. They can be generalized in the two goals of economic efficiency and fairness (or equity), which can then be further broken down as follows:
Economic efficiency. Because electric utilities generally do not operate in competitive markets that would impose cost discipline on them, regulation must fulfill that function. To achieve this objective, regulation sets rates that reflect, to the greatest extent possible, the long-run marginal costs of production.1
Fair prices for consumers and investors. Price regulation is intended to guard against the reaping of unjustifiably high profits (called economic “rents”), while still enabling the utility to generate enough revenue to cover necessary expenses and investment and to provide a reasonable return on that investment. Prices should also be fair to competitive providers or, more accurately, the competitive process. They should also minimize any distortional effects on the economy—changes in how the economy and customers would act if there were perfect competition with no regulation and no monopoly.
Non-discriminatory access to service for all consumers.
Adequate quality and reliability. Because electricity is an essential service, reliability is critically important.
Other stated public policy objectives (e.g., environmental protection, universal service, low-income support, energy efficiency) (Bonbright, 1961, pp. 25–41; Pierce, 1999, p.11; Kahn, 1988, Vol. I, pp. 20–25, 69–70, and Vol. II, pp. 243–246).
For goods and services that competitive markets can provide, the markets by themselves will go a long way toward meeting these goals.2 Thus, it can be said that economic regulation is intended to achieve outcomes that competition, if it were possible in the market for electricity, would otherwise achieve (Kahn, 1988, Vol. I, p. 17; Bonbright, 1961, p. 372; Pierce, 1999, pp. 2, 47–48, 94–95). Also, prices in regulated industries naturally affect prices in competitive ones, and
B-1

B-2
vice versa, and therefore affect the overall efficiency of the economy—all the more reason to adopt utility rate designs that most closely resemble price structures in competitive markets and therefore do not create excessive distortionary effects on the economy.
The general goals of economic regulation inform the rate design process. More specifically, the
The particular problem faced by regulators in this exercise is that the legitimate historical
Revenue-Related Objectives:
Rates should yield the total revenue requirement.
Rates should provide predictable and stable revenues.
Rates themselves should be stable and predictable.
s to promote economically efficient consumption, where the well-
private and social costs and benefits of
ustomer classes.
and (dynamic efficiency).
certain, payable conveniently, understandable, acceptable to the
object is to set economically efficient and fair prices, while simultaneously giving the regulated firm a reasonable opportunity to recover its legitimate costs of providing service—including return of, and on, its investment.
(accounting or “embedded”) costs that a utility incurs are to be recovered in rates, but these costs may only bear a passing resemblance to the marginal costs—what a customer must pay to receive one more unit of energy—that form the basis of economically efficient prices. The need to cover historical costs, set economically efficient prices, and then meet other objectives of regulation requires careful judgment. James Bonbright (1961) dedicated five chapters and 120 pages to the subject, beginning with a catalogue of the several and sometimes competing objectives of rate design. It remains today the comprehensive compilation on which regulators rely. Paraphrased, Bonbright’s principles are (Bonbright, 1961, p. 291):
Cost-Related Objectives:
Rates should be set so abeing of both the utilities and consumers is maximized, given the restraints (static efficiency).
Rates should reflect the present and future providing service (i.e., all internalities and externalities).
Rates should be apportioned fairly among customers and c
Undue discrimination should be avoided.
Rates should promote innovation in supply and dem
Practical Considerations:
Rates should be simple, public, and easily administered.

Rates should be, to the extent possible, free from controversies about proper interpretation
The tension among these sometimes competing and always challenging goals gives regulators a good deal of discretion in designing pricing structures. But because prices should, for the most part, reflect the long-run marginal costs of production, regulators are rightly limited to consumption-based prices, because it is demand for units of the good, electricity in this case, that, in the long run, drives its costs—and in the long run all costs are variable. In this way, consumers must pay to use the good, but they avoid costs when they do not use the good, and the costs to society of the resources allocated to that good (externalities) are fully covered.
As a principle, it can be easily agreed on by all, but its practical application is difficult. Debate focuses not only on the level of rates, but also on the use of fixed, recurring, and ratcheted charges. Proponents of DG make two fundamental arguments: (1) customers with onsite generation should be no more obligated to pay unavoidable charges than full requirements customers (in fact less so, given their asserted lower probabilities of needing service at times of peak); and (2) their charges should be discounted in relation to those of full requirements customers, because they provide diversity benefits to the system as a whole. Fixed and ratcheted charges might, arguably, be designed to satisfy this principle—they cover the long-run costs of service and can be avoided by taking no service at all—but as a practical matter, they look very much like access fees, to be paid regardless of whether, and the level at which, service is taken. Unavoidable charges are inconsistent with the objectives of economic efficiency.3
This logic might suggest that the economist’s preferred price unit for electric service is the kWh charge (differentiated by time and, perhaps, geography).4 It certainly has its appeal. But there are other objectives of rate design, which, if unmet, might threaten the financial integrity of the utility and the overall reliability of the grid. The succession of rate structures, measured by customers’ ability to avoid paying charges, extends from the energy charges to the recurring customer charge, passing along the way from as-used demand charges to ratcheted ones. As pointed out earlier, the essential differences among them are their time denominations. The longer duration charges, though supposedly still avoidable, give the utility some greater measure of revenue predictability, and remind customers as well that their right to call on the system at any time depends in part on the availability of otherwise idle capacity. The justification for demand charges lies in this balancing act.
To the degree that the characteristics of demand for standby service and therefore its costs differ significantly from those of the rate class to which the DG customer would otherwise belong, its rate design should reflect these differences. Daily as-used demand charges are one example of this (although, arguably, there is no reason why they cannot be extended to full requirements customers as well). Price discounts or ratchet adjustments, to account for (or reward) high-capacity factors (reliability) of onsite generation, are another approach.5 A customer’s guarantee that demand for standby service will not exceed a specified level (accompanied by facilities or equipment to make good on the guarantee, known as “physical assurance”) is another tariff feature that allows for alternative rate treatment of CHP.6
The degree of diversity that customers with onsite generation bring to a system appears to be most often the thorniest issue that regulators deal with. This diversity benefit obviously depends
B-3
on the operating characteristics of the generation, which system operators and utilities argue is far less understood than proponents contend. One way to deal with this issue, at least in the early years of a new standby rate structure, is to make the tariff optional—that is, give customers the choice of taking service under the standby tariff or under the otherwise applicable full requirements tariff. Customers will choose the tariff that better serves their needs and reduces their costs more. While this may result in a lower aggregate level of revenues for the utility from these customers, it will reveal a good deal about the performance that customers expect from their machines and might indeed offer a better allocation of the risks between them.7
B.2 Pricing the Components of Electric Service
Rate designers differentiate the major components of the system according to the drivers of their costs—i.e., according to the functions of the system. Three broad categories of costs emerge from this approach—generation, transmission, and distribution—which can be separately priced as consumer understanding and administrative simplicity allow. Where the benefits of changes in usage caused by more complex rate designs are not enough to justify the added metering and billing costs to support such rates, the pricing elements are combined and aggregated into simpler energy-only or energy and demand charges.
We note here that the structure of the electric industry in a state might affect the nature of partial requirements service, like that of full requirements service. If multiple competitive suppliers provide generation services, distribution utilities will provide only delivery service and regulatory interest in standby will be, accordingly, restricted to that component of service. Restructuring accelerated the movement to unbundled pricing for the various components of service (i.e., separate prices for the differentiable elements of service—generation, transmission, and distribution), but nothing about vertically integrated industry structures prevents a similar unbundling of rates. Unbundling makes the nature of costs more transparent and, if done properly, greatly reduces or even eliminates the potential for the cross-subsidization of one service by another.
Generation consists of energy and capacity costs. Energy is the cost to actually produce kWh— that is, variable (or marginal) cost. Primarily this is the cost of fuel, but often there are variable operations and maintenance costs that are not incurred if the unit does not run. Capacity is the cost of the plant—or, more precisely, of the ability to generate power—for the period of the purchase (hour, day, month, year).8 As described above, capacity is typically expressed in per-kW terms, but it can also be expressed in energy terms (per kWh) given assumptions about a plant’s operating characteristics.
The amount of generation that a system needs is a function of its overall peak demand. Only that amount necessary to meet peak (and reserves—otherwise unused capacity to maintain reliability in case of unplanned outages) should be acquired; any more would be wasteful and any less would, without remedial action, jeopardize system reliability. This means that it is a customer’s or, more accurately, a customer class’s full or partial requirement, contribution to the system (or coincident) peak that determines its responsibility for the costs of the required generation capacity. Insofar as the load-serving entity (i.e., the utility or competitive service provider) knows generally when peaks will occur, time-differentiated pricing can be designed to reflect the expected costs of peak demand, and this will go a long way toward fairly allocating the costs of
B-4
capacity among users, capturing the benefits of demand response, and capturing load diversity from the different power generation sources.9
Each customer class imposes unique demands on the system, and the tariffs drawn up to reflect those different characteristics provide, in effect, different services suited to the needs of the classes. To the extent that the usage characteristics of partial requirements customers, and the costs associated with that usage, are demonstrably different from those of related full requirements customers, such customers can be seen as constituting a different class. Whether, from the perspective of DG customers, being treated as a separate class is good or bad (that is, less or more costly) depends on, among other things, the average load factor (the ratio of average electric load to peak load) of the group and its contribution to system peak. If the load factors of DG customers are for the most part better than those of other customers in the relevant full requirements service class, then the non-DG customers are benefiting from the inclusion of DG owners in the class.10 Or it might be the other way around. But either way, a detailed cost of service study—using reliable data on the operational characteristics of DG systems—will be needed to inform the regulators’ decision about how to treat these customers.
A standard practice in the design of standby tariffs is to impose more than one type of demand charge. The first is the reservation or contract demand charge, which ostensibly covers the costs of the capacity that the utility must have access to in order to cover a call for unscheduled service, even if that call is never made. Typically, the reservation charge is applied against monthly billing demand (contract, maximum potential, or ratcheted), and therefore looks very much like an unavoidable, fixed, recurring fee that gives a customer the right to take standby service.11 The contract demand is often based on the net capacity of the onsite generator or some negotiated or specified portion of that capacity. The next charge is a usage-related demand charge, which is applied against demand associated with standby service actually taken. This charge is often a monthly, or sometimes daily, price per kW used and, in the absence of a ratchet, is referred to as “as-used.” This charge is generally linked to the costs of shared facilities, which can vary insofar as the plant can be redeployed (used to serve other demands).12
A variation on the reservation charge is a fee for contingency reserves, the amount of operating reserves that must be available to meet load in the event that the customer unexpectedly takes energy from the grid—that is, when its onsite generation suffers an unscheduled outage. Under this approach the customer has the same obligations that other load serving entities have: namely, entitlement to sufficient operating reserves to cover the load in cases of an unplanned outage of any of the resources serving that load. Because the probabilities of two or more generating facilities (whether central station or customer-sited) suffering an unplanned outage simultaneously and, in particular, at the time of a system peak, are less than 100 percent, the amount of resources to be held in reserve is correspondingly less than the full potential load that they might be called on to serve. This is the effect of diversity, and it greatly reduces the amount of excess capacity that the system must have to maintain a given level of reliability.
A combination of factors drives investment in the distribution system. For facilities dedicated to the customer, a customer’s noncoincident peak demand (i.e., maximum demand, regardless of when it occurs) drives investment, and for facilities shared among distribution customers (e.g., substations, feeders, etc.), the driving force is coincident peak demand of the customers they serve. Though the costs are separable, they are typically combined within one demand charge (or
B-5
set of charges) for distribution service, priced on a per-kW-month basis. Simplicity is one reason for this. Another is the lack of a metering and data management capability that measures both customer coincident and noncoincident peaks on discrete sections of the distribution system—although advances in metering technology are changing this.
The distribution demand charge is multiplied by the customer’s billing demand, which is one of several quantities (or some variation on them): the customer’s monthly noncoincident peak demand, its maximum potential demand, or an agreed-on contract demand. For partial requirements customers, the negotiated contract demand might be accompanied by the customer’s promise not to exceed it (accompanied by special load-limiting facilities to make good the guarantee), a feature sometimes referred to as “physical assurance.”13 Not all utilities offer these options; each has its own approach.
If avoidability of charges is a key determinant of whether a rate structure is beneficial to DG, then the design of demand charges—specifically, their ratchets—becomes a focus of analysis. Ratchets are most painful to customers with relatively low load factors—i.e., low ratios of actual usage (in kWh in a period) to maximum potential usage (the product of peak demand and hours in the period). They require the customer to pay a fee related to a significant fraction of their peak demand in periods when their demand does not approach their peak. A customer with relatively high load factors is less affected by the ratchet the closer its periodic demands are to its peak, and so the fees it pays are not much different from those it would pay without the ratchet. Either way, of course, it is worth examining the justification for the ratchet to determine if it is related to the nature of the costs incurred and if the capacity whose costs it covers is indeed unable to be put to alternative uses. This is another way of looking at the question of diversity, the measure of the coincidence of customer demands. The more diverse a system (or part of a system) is, the less impact the peak demand of any one customer or set of customers has on the overall peak of the system. Conversely, the greater the degree of coincidence in customer demands, the less diverse the system’s load.
A number of utilities have eliminated multi-month ratchets for distribution service. Portland General Electric assesses distribution demand charges on the basis of the customer’s peak in the month; each month’s costs are determined separately and are unrelated to any previous month’s demand.14 Rochester Gas & Electric, Orange & Rockland, and other New York utilities use daily on-peak only (as-used) demand charges.
Transmission costs tend to be less problematic than generation and distribution costs if only because they are typically a small portion of the bill. Transmission investments are shared facilities and, depending on the size of the facilities in question, are characterized by greater diversity than much of the distribution system. Because transmission, like distribution, is driven by the relevant peak demand, it is priced on a per-kW (or per-MW) basis. In many restructured states, transmission charges are typically included in the prices of competitive generation suppliers, not the prices of the distribution company.
B-6

B-7
B.3 Notes
1 The economics literature in support of this statement is extensive. (See, for example, Kahn, 1998, Chapters 3 and 4, and Bonbright, 1961, p. 318.) This is not to say that it is not appropriate, in certain circumstances, to set prices at short-run marginal cost, for instance when variable costs (e.g., the price of fuel) exceed the long-run marginal cost. In that event, consumers undervalue the good and use more of it than is economically justified, and the utility loses money. Some regulatory economists argue that the converse is also true—that when capacity is surplus, it is economically inefficient to charge greater than variable operating cost. We would say, however, that this argument might have more appeal if all the costs of production, including the external costs (e.g., environmental damage costs), were included in the price.
2 This is not to say that competitive markets will, by themselves, satisfy all, or fully any, of the welfare-enhancing objectives that a society embraces. Transaction costs, externalities, lack of information, and the preexisting distribution of wealth and income—to name a few factors—all affect the operations of markets in ways that often call for some form of governmental intervention into the market for the benefit of the public overall. Content labeling; performance requirements; health standards; labor, anti-trust and anti-discrimination laws; and financial requirements are all examples of government actions taken to assure that other highly valued outcomes (such as equity) are achieved.
3 Moreover, they are virtually unknown in competitive markets. One does not pay a toll, for example, to enter a grocery store. The relatively few instances of such fees in nonregulated markets (e.g., cellular telephone service) can be seen as exercises of some degree of market power and, perhaps more importantly, as symptomatic of an industry in which capacity (bandwidth) is plentiful and inexpensive, and the marginal costs of usage (in both the short and long runs) are very low. This is not the case in the electric industry.
4 Indeed, early designs for competitive wholesale markets called only for energy pricing.
5 For example, Arizona Public Service Corporation sets a minimum number of hours per month at which standby service will be provided at base prices. Failure to stay at or below the minimum will result in penalty charges. In addition, the onsite generation must maintain a 75 percent capacity factor, based on a rolling 18-month average. The onsite generation is also subject to penalties for failure to do so. Tucson Electric Power’s standby tariff works in a similar fashion.
6 California is one state where this option is available.
7 New York and Hawaii have both taken this approach, although in New York the option was available only to customers who had onsite generation as of January 2003.
8 As a matter of economic theory, price should equal the marginal cost of the good, because that describes the value to society of the resources that production of the good requires. As a matter of law, the rates of regulated monopolies must be sufficient to cover actual expenditures that are deemed prudent and used and useful. These are referred to as historical or embedded costs. The problem is that utilities are natural monopolies and the economics of their industries, unlike those of competitive markets, do not drive their embedded costs per unit to equal their marginal costs; in the long run, their embedded costs will exceed their marginal costs. Worse yet, as monopolies, the profit-maximization imperative would cause them to set prices at levels that exceed their embedded costs. Regulation is intended to prevent that outcome and to ensure only the recovery of their embedded costs. Rate design aims, to the extent possible, to set rates that reflect marginal costs, adjusted as appropriate to generate revenues sufficient to cover embedded costs.
9 An individual customer’s contribution to coincident peak is not, given traditional metering technologies, easily measured, nor is it, for rate design generally, a practical necessity. Advances in metering infrastructure are enabling more dynamic rate structures, including real-time pricing, which reveal hourly (or even shorter duration) changes in wholesale market prices for power. Early experience with these new technologies and prices has demonstrated that customer demand response, especially where made possible by automated systems (e.g., the shutting down of one’s air conditioning when a specified price trigger is hit), can be predictable and
B-8
significant. Technologies of this sort and the dynamic rate designs they support can have the effect of allocating costs more directly to those who cause them and, conversely, can more directly reward those who are able to avoid them.
10 This, of course, is true of all rate structures as a general matter: the nature of average-cost ratemaking is that customers with load factors that are below average pay less than what might be described as their “full share” of the class’s total cost of service, and the customers with better-than-average load factors pay more than their share. And it is also true of pricing in competitive industries as well: the standard rate for delivery of a package by Federal Express doesn’t vary by distance. The customers who cost less to serve than the average cover some part of the costs of those who cost more than the average to serve.
11 What matters most under this scheme is the level of the per-kW reservation charge. If that level approximates the generation component of the otherwise applicable full requirements tariff and makes no provision for the probability that the service will be needed, it may result in total costs to the customer that will render most onsite generation projects uneconomic. Whether this will be the case depends on the relationship between (1) the capital and operating costs of the DG system and (2) the demand and energy costs of grid-supplied power.
12 In this discussion, we haven’t differentiated between the rates of vertically integrated utilities (those that are monopoly providers of generation, transmission, and distribution services) and delivery-only utilities. The general description of typical standby rate designs applies to both, but in the case of delivery-only service the charges would of course not include any generation costs.
13 California is one state where this option is available. In Rulemaking 99-10-025 (1999), the state’s public utilities commission defined physical assurance “as the application of devices and equipment that interrupt a DG customer’s normal load when DG does not operate.” The California Clean DG Coalition has since argued that a utility’s ability to refuse service should not be unconditional, but should instead be limited to specified circumstances such as times of local distribution system peaks.
14 This, in effect, is a demand charge with a maximum 31-day ratchet.

C-1
Appendix C: References
Bonbright, J.C. (1961). Principles of Public Utility Rates. Public Utilities Reports, Inc. New York: Columbia University Press.
Kahn, A.P. (1988). The Economics of Regulation, Vols. I and II. Cambridge, MA: MIT Press.
Pierce, R.J., Jr., and E. Gellhorn (1999). Regulated Industries, 4th ed. St. Paul, MN: West Group.