Embed Size (px)
Citation preview

1
Designing and Retrofitting
Neighborhoods to Improve Safety
Sponsored by the Sacramento Metropolitan Air Quality Management District
Presented by the Local Government Commission
Sacramento, CAAugust 21, 2007
Overview: Linking Air Qualityto Neighborhood Safety
Paul Zykofsky, AICPLocal Government Commission
Designing and RetrofittingNeighborhoods to Improve Safety
Sacramento, CAJuly 25, 2007
2
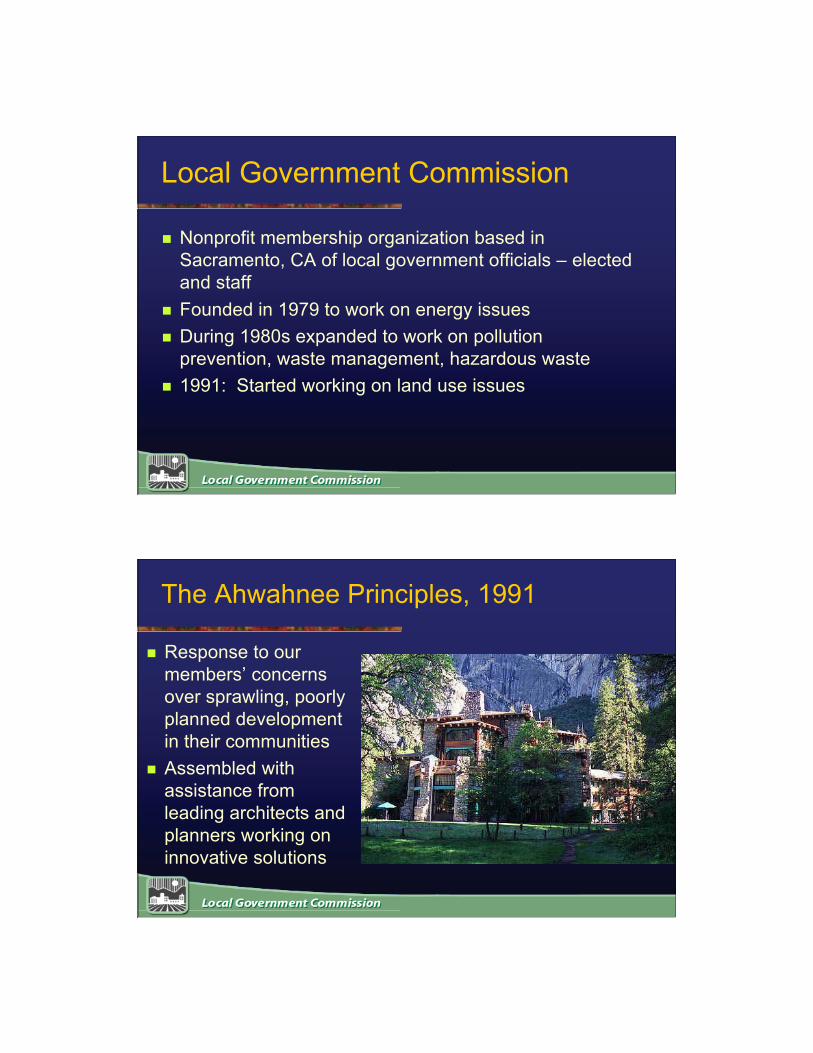
Local Government Commission
Nonprofit membership organization based inSacramento, CA of local government officials – electedand staff
Founded in 1979 to work on energy issues During 1980s expanded to work on pollution
prevention, waste management, hazardous waste 1991: Started working on land use issues
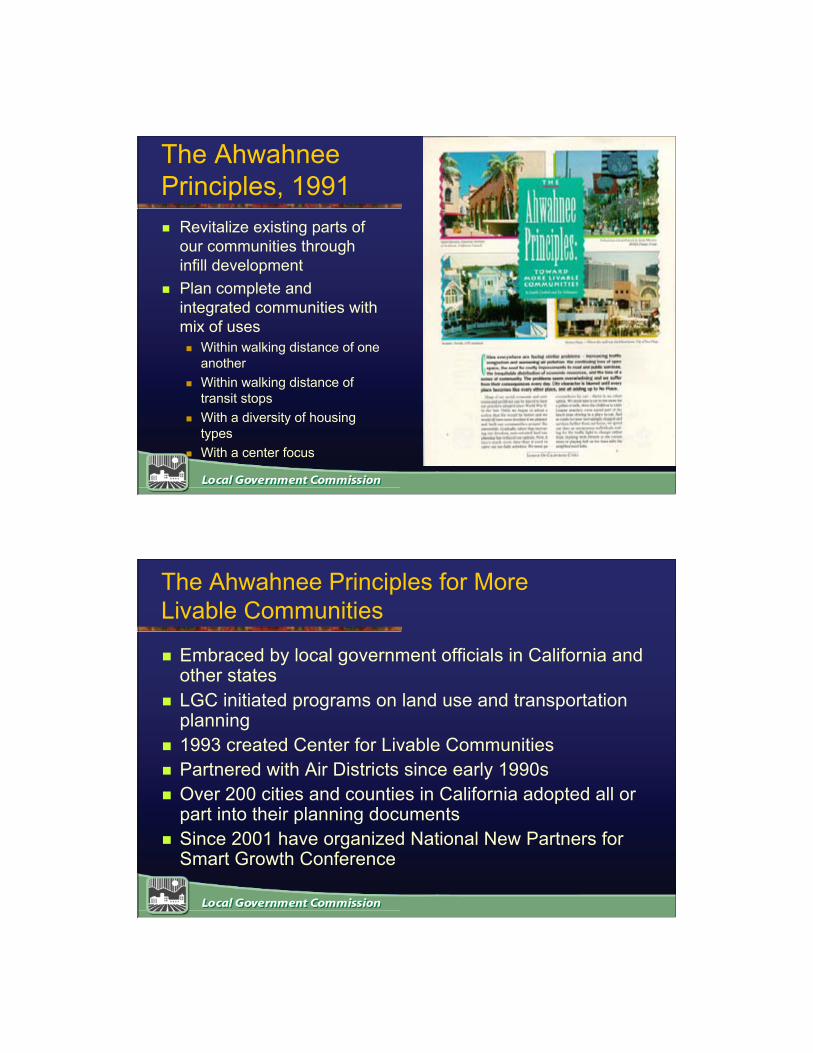
The Ahwahnee Principles, 1991
Response to ourmembers’ concernsover sprawling, poorlyplanned developmentin their communities
Assembled withassistance fromleading architects andplanners working oninnovative solutions
3
The AhwahneePrinciples, 1991 Revitalize existing parts of
our communities throughinfill development
Plan complete andintegrated communities withmix of uses Within walking distance of one
another Within walking distance of
transit stops With a diversity of housing
types With a center focus
The Ahwahnee Principles for MoreLivable Communities
Embraced by local government officials in California andother states
LGC initiated programs on land use and transportationplanning
1993 created Center for Livable Communities Partnered with Air Districts since early 1990s Over 200 cities and counties in California adopted all or
part into their planning documents Since 2001 have organized National New Partners for
Smart Growth Conference
4
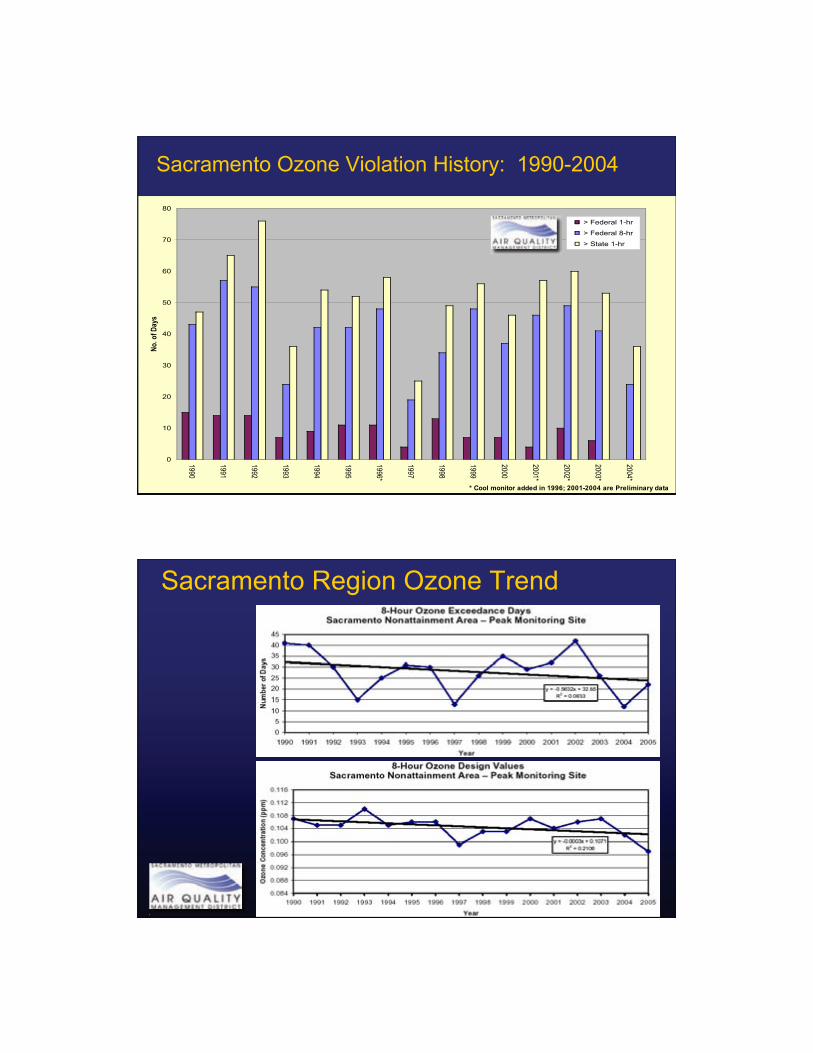
0
10
20
30
40
50
60
70
80
19
90
19
91
19
92
19
93
19
94
19
95
19
96
*
19
97
19
98
19
99
20
00
20
01
*
20
02
*
20
03
*
20
04
*
No
. of
Day
s
> Federal 1-hr
> Federal 8-hr
> State 1-hr
* Cool monitor added in 1996; 2001-2004 are Preliminary data
Sacramento Ozone Violation History: 1990-2004
Sacramento Region Ozone Trend
8-hour Standard8-hour Standard
5
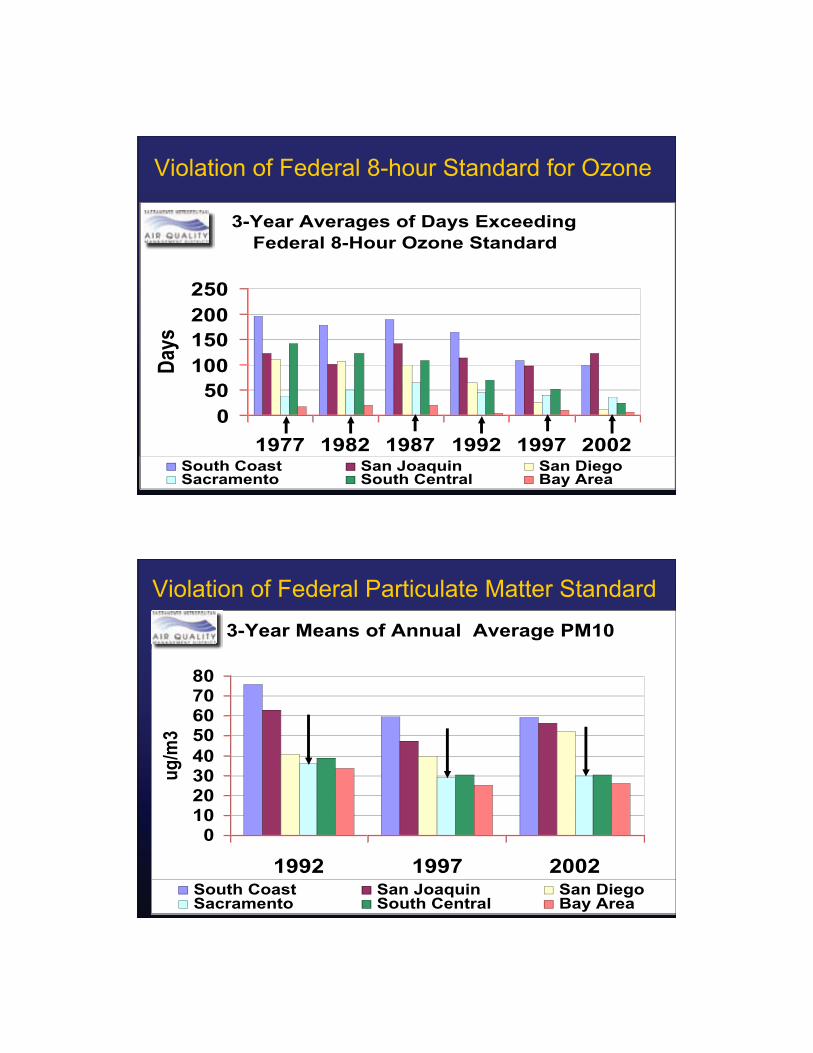
3-Year Averages of Days Exceeding
Federal 8-Hour Ozone Standard
0
50
100
150
200
250
1977 1982 1987 1992 1997 2002
Day
s
South Coast San Joaquin San DiegoSacramento South Central Bay Area
Violation of Federal 8-hour Standard for Ozone
Violation of Federal Particulate Matter Standard3-Year Means of Annual Average PM10
010203040
50607080
1992 1997 2002
ug
/m3
South Coast San Joaquin San DiegoSacramento South Central Bay Area

6
Sacramento Region: 2005 Ozone-precursoremissions inventory
Mobile sourcesaccount for 78%of ozoneprecursors ROG: 70%
41% On-road 29% Off-road
NOx: 89% 54% On-road 35% Off-road
Sacramento Region: 2002 VOC Emissions Inventory2002 VOC Planning InventorySacramento Nonattainment Region
168 Tons Per Day
Other
5%
Arch Coatings
5%
Consumer
Products
9%
Other
6%
Solvent/Coatings
5%
Other
6%Off-Road
Equipment
8%
Rec Boat
15%
Other
7%
Auto/Light-Med
Duty Trucks
34%
Other Mobile29%
On-RoadMobile41%
Area-Wide19%
Stationary 11%
7
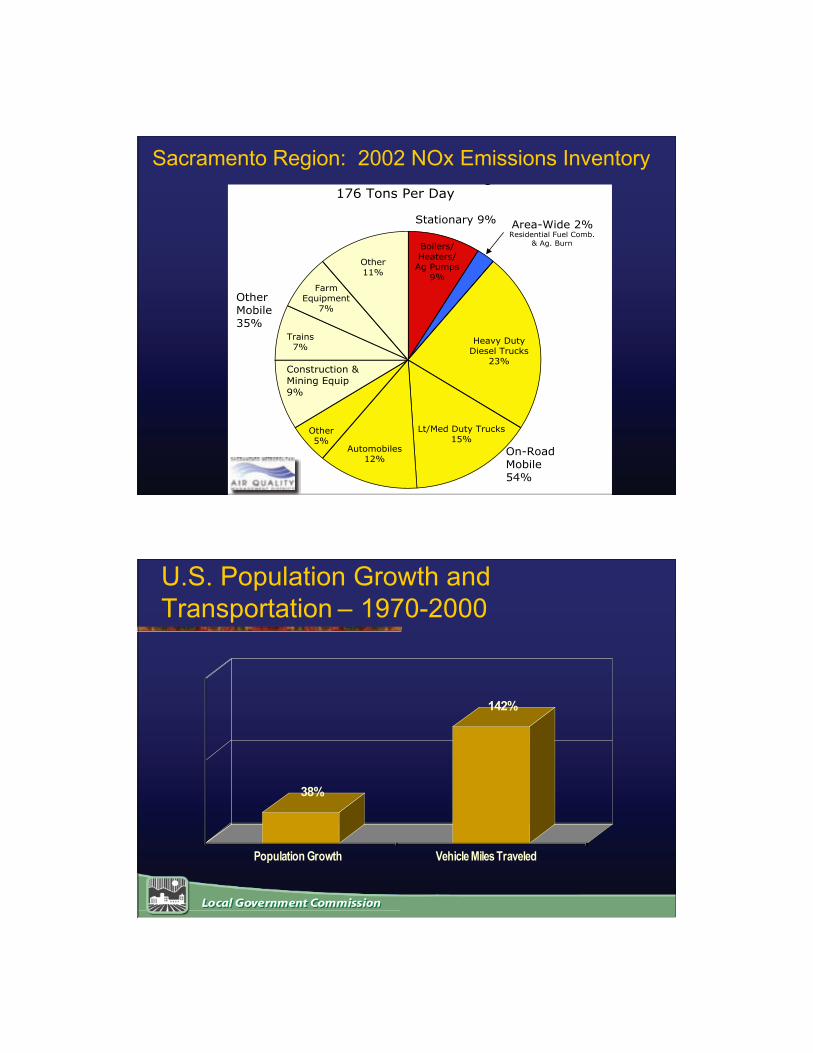
Sacramento Region: 2002 NOx Emissions Inventory2002 NOx Planning InventorySacramento Nonattainment Region
176 Tons Per Day
Residential Fuel Comb.
& Ag. BurnBoilers/Heaters/Ag Pumps
9%
FarmEquipment
7%
Trains7%
Other5%
Automobiles12%
Lt/Med Duty Trucks15%
Heavy DutyDiesel Trucks
23%
Other11%
Construction &
Mining Equip
9%
Other Mobile 35%
On-Road Mobile 54%
Area-Wide 2%Stationary 9%
U.S. Population Growth andTransportation – 1970-2000
38%
142%
Population Growth Vehicle Miles Traveled

8
California Population Growth andTransportation – 1970-2000
70%
162%
Population Growth Vehicle Miles Traveled

9
Projected VMT Growth – 1996-2030
116%122% 125%
89% 89% 86%81%
71%
127%
Sacramento
Placer
El Dorado
Sutter
YubaYolo
Contra Costa
Los Angeles
Riverside
Source: U.S. EPA, VMT Growth Factors, www.epa.gov/ttn/naaqs/ozone/areas/vmt/vmtcagf.htm

10
Projected Population Growth Rateof Selected States (1995-2025)
0% 10% 20% 30% 40% 50% 60%
California
New Mexico
Arizona
Nevada
Utah
Florida
Texas
Washington
Oregon
Colorado
Rest of U.S.
Source: U.S. Dept. of Commerce, Census Bureau
Population Growth in the Sacramento Region
Population in 6-countyregion expected to doubleby 2050
One million new jobs 840,000 new dwelling units
1.9 million
3.8 million
2000
2050

11
SacramentoRegion
Projected landconsumption by2050 under base-case scenario
Consume 661additional squaremiles over thenext 50 years
Would require,on average, thateach householdtravel 47.2 milesby motor vehicleevery day
Sacramento Blueprint Process — Base Case
Sacramento Area Council of Governments
SacramentoRegion
Projected landconsumption by2050 underpreferredBlueprint scenario
Would consumeless than halfamount of land,304 square miles
Would reducedaily vehiclemiles traveledper household to34.9 miles, a26% reduction
Sacramento Blueprint Process — Preferred
Sacramento Area Council of Governments

12
The Challenge
Retrofit and Design Neighborhoods to LowerTrips and Vehicle Miles Traveled (VMT) How Smart Growth can help
Changes to Land Use pattern — Reduction in trips and VMTas result of 4Ds:
Density = Compact Development Diversity = Land Use Mix Design = Site Design, Street Design Destination = Accessibility/Street Network Connectivity
Emphasis on creating walkable, bicycle- and transit-friendlyneighborhoods
Emphasis on placemaking — creating great communitygathering places, increase “sense of community”
Smart Growth concepts help achievesecurity/safety goals Walkable, mixed-use,
transit friendly neighbor-hoods have more eyes-on-the-street, naturalsurveillance, self-policing
Slower, safer streets resultin fewer motor vehiclecrashes
Well-connected streetnetworks (andlanes/alleys) providegreater access to all partsof a community
13
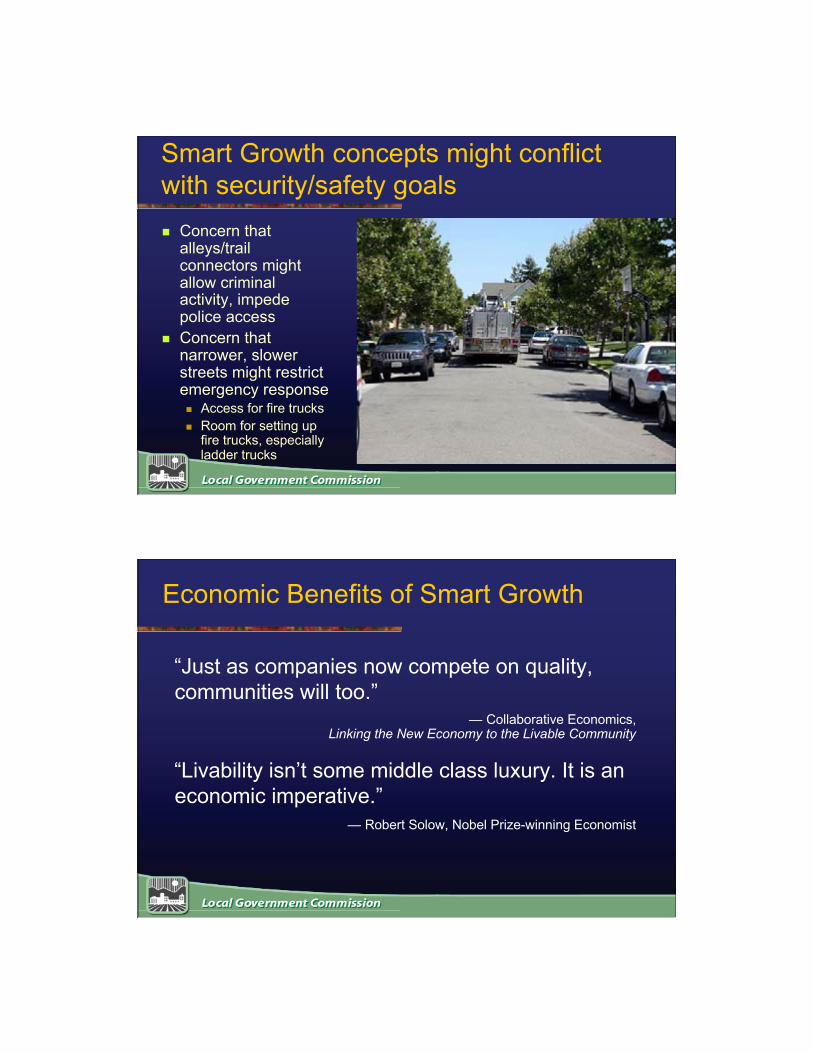
Smart Growth concepts might conflictwith security/safety goals Concern that
alleys/trailconnectors mightallow criminalactivity, impedepolice access
Concern thatnarrower, slowerstreets might restrictemergency response Access for fire trucks Room for setting up
fire trucks, especiallyladder trucks
“Just as companies now compete on quality,communities will too.”
— Collaborative Economics,Linking the New Economy to the Livable Community
“Livability isn’t some middle class luxury. It is aneconomic imperative.”
— Robert Solow, Nobel Prize-winning Economist
Economic Benefits of Smart Growth
14
Principles of Smart Growth/Livable Communities
Ten Principles of Smart GrowthPreserve Open Space, Farmland, Natural Beauty and Critical
Environmental AreasStrengthen and Direct Development Towards Existing CommunitiesTake Advantage of Compact Building DesignMix Land UsesCreate Range of Housing Opportunities and ChoicesProvide a Variety of Transportation ChoicesCreate Walkable NeighborhoodsFoster Distinctive, Attractive Communities with a Strong Sense of
PlaceEncourage Community and Stakeholder CollaborationMake Development Decisions Predictable, Fair and Cost Effective

15
2. Strengthen, and direct developmenttowards, existing communities
Use incentives toachieve clean-up and re-use of “brownfield” and“grayfield” sites
Preserve and repairhistoric buildings as partof redevelopment plans
Build on the resourcesand amenities of existingcommunities
Impacts of Infill vs. Greenfield Developmentin the San Diego Region
58%
10%
55%
58%
24%
51%
52%
0% 10% 20% 30% 40% 50% 60% 70% 80% 90% 100%
Household travel costs
Infrastructure costs
CO2 emissions
NOx emissions
Congestion
Auto travel time
VMT/capita
Infill GreenfieldSource: Study by Criterion Planners/Engineers forU.S. Environmental Protection Agency, 1998
16
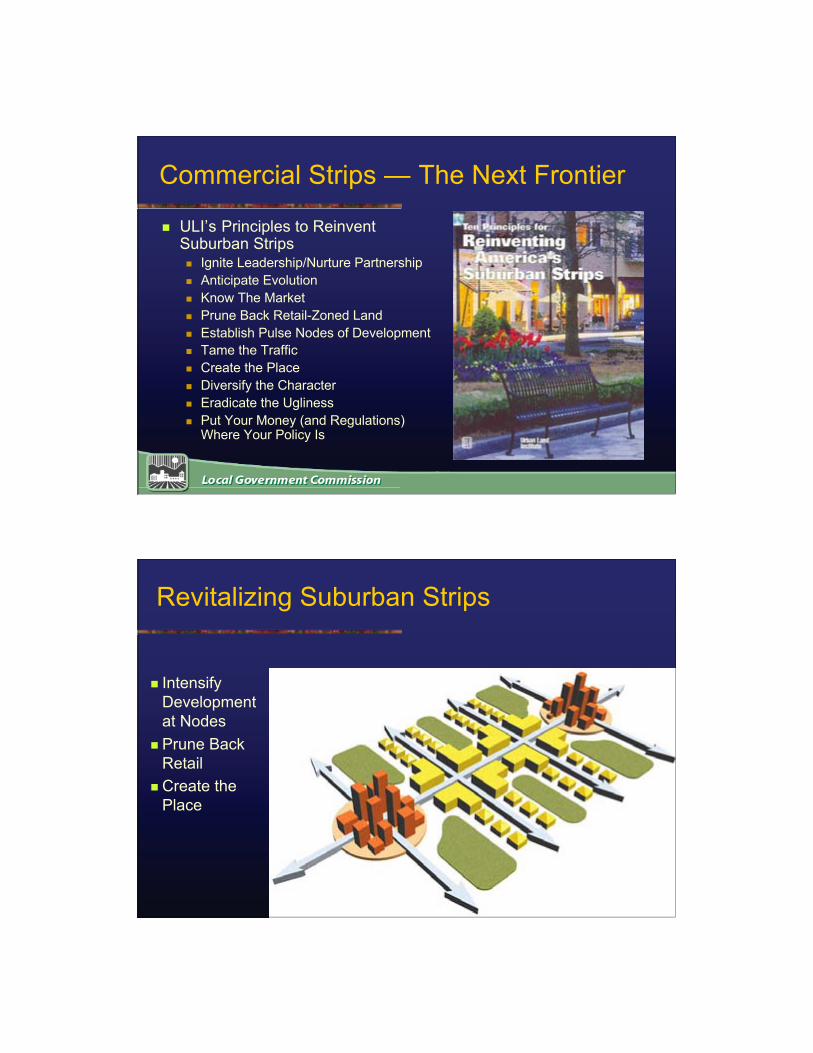
Commercial Strips — The Next Frontier
ULI’s Principles to ReinventSuburban Strips Ignite Leadership/Nurture Partnership Anticipate Evolution Know The Market Prune Back Retail-Zoned Land Establish Pulse Nodes of Development Tame the Traffic Create the Place Diversify the Character Eradicate the Ugliness Put Your Money (and Regulations)
Where Your Policy Is
Revitalizing Suburban Strips
IntensifyDevelopmentat Nodes
Prune BackRetail
Create thePlace

17
RevitalizingOldShoppingCenters Intensify
development Fill in parking lots Build structured
parking Complete street
wall Support pedestrian
activity
3. Mix land uses
Provide retailor personalservices nearhousing
Incorporateparks,schools, andother publicfacilities

18
Alternative Patterns of Development
Traditional Conventional
Housing over retail shops Sacramento, CA

19
Land Use Mix — Example
Housingoverrestaurant
Davis, CA
Land Use Mix — Example

20
4. Take advantage of compactbuilding design
Grow verticallyrather thanhorizontally topreserve greenspaces andreduce cost ofproviding publicfacilities andservices
Land Use Pattern Affects Travel —Density to Support Transit
For LightRail Service 18-25
units/acrein urbanarea
For BusService 7 units/
acre (every30 minutes)

21
Land Use Pattern Affects Travel —Density to Support Retail
For a 10,000 sq.ft.ConvenienceStore 7 units/acre
For a 25,000 sq.ft.Small Supermarket 18 units/acre
Lower Cost of Infrastructure
Compact vs. Low Density Development
*Duncan, James et al, The Search for Efficient Urban Growth Patterns. Florida Department of Community Affairs, 1989. **Burchell, Robert, Economic and Fiscal Impacts of Alternative Land Use Patterns, Rutgers University, 1996.
2% more**Other Costs
5% more**Cost for Schools
15% more**Cost for Utilities
25% more**Cost for Roads
45% more*Land Consumption
22
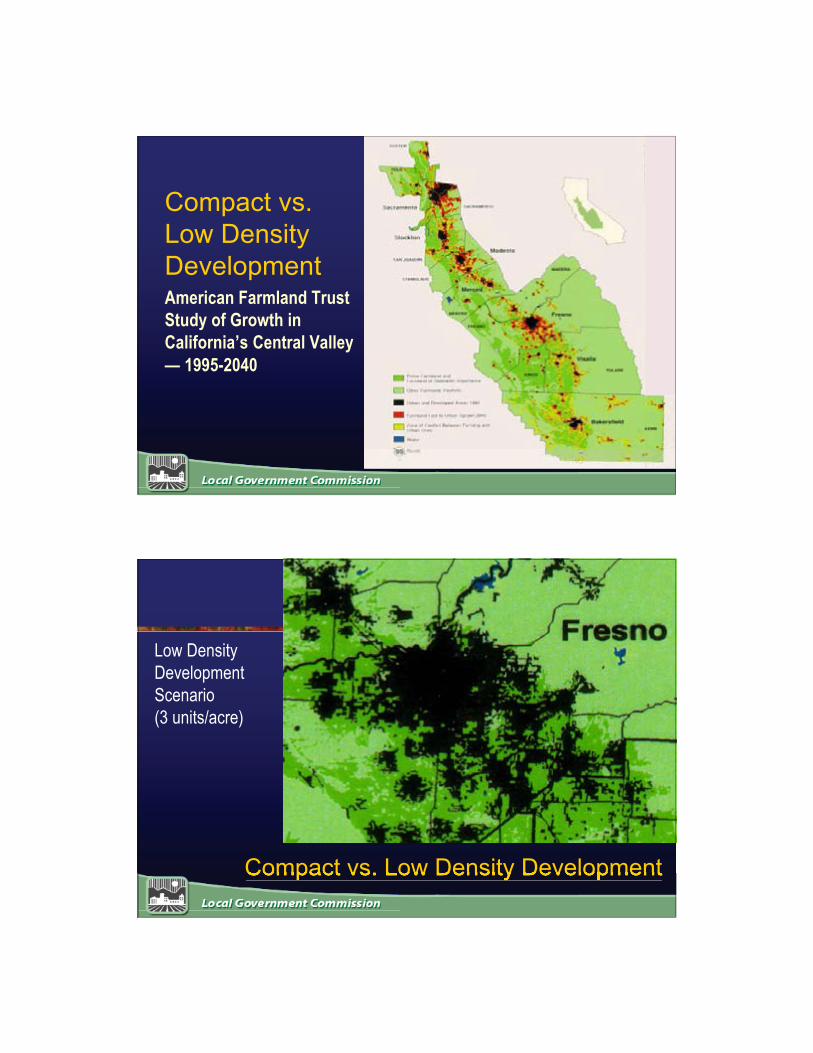
Compact vs.Low DensityDevelopmentAmerican Farmland TrustStudy of Growth inCalifornia’s Central Valley— 1995-2040
Compact vs. Low Density Development
Low DensityDevelopmentScenario(3 units/acre)
Compact vs. Low Density Development

23
Compact vs. Low Density Development
…vs. MoreCompactDevelopmentScenario (6units/acre)
Compact vs. Low Density Development
Compact vs. Low Density Development
$5,266
$2,448
$0
$2,000
$4,000
$6,000
Projected Loss of Agricultural Sales in 2040(Millions of 1993 dollars)
Low Density
Compact Growth
Cumulative loss (1995-2040): $72 billion
Source: American Farmland Trust, “Alternatives for Future Urban Growth in California’s CentralValley: The Bottom Line for Agriculture and Taxpayers.” October 1995.

24
Compact vs. Low Density Development
-$985
$217
-$1,000
-$500
$0
$500
City Revenues/Public Service Costs in 2040(Millions of 1993 dollars)
Low Density
Compact Growth
Cumulative loss (1995-2040): $29 billion
Source: American Farmland Trust, “Alternatives for Future Urban Growth in California’s CentralValley: The Bottom Line for Agriculture and Taxpayers.” October 1995.
Compact vs. Low Density Development
San DiegoCounty
Projected landconsumption by2020 underexisting policies
San Diego Association of GovernmentsSan Diego Association of GovernmentsSan Diego Association of Governments
25
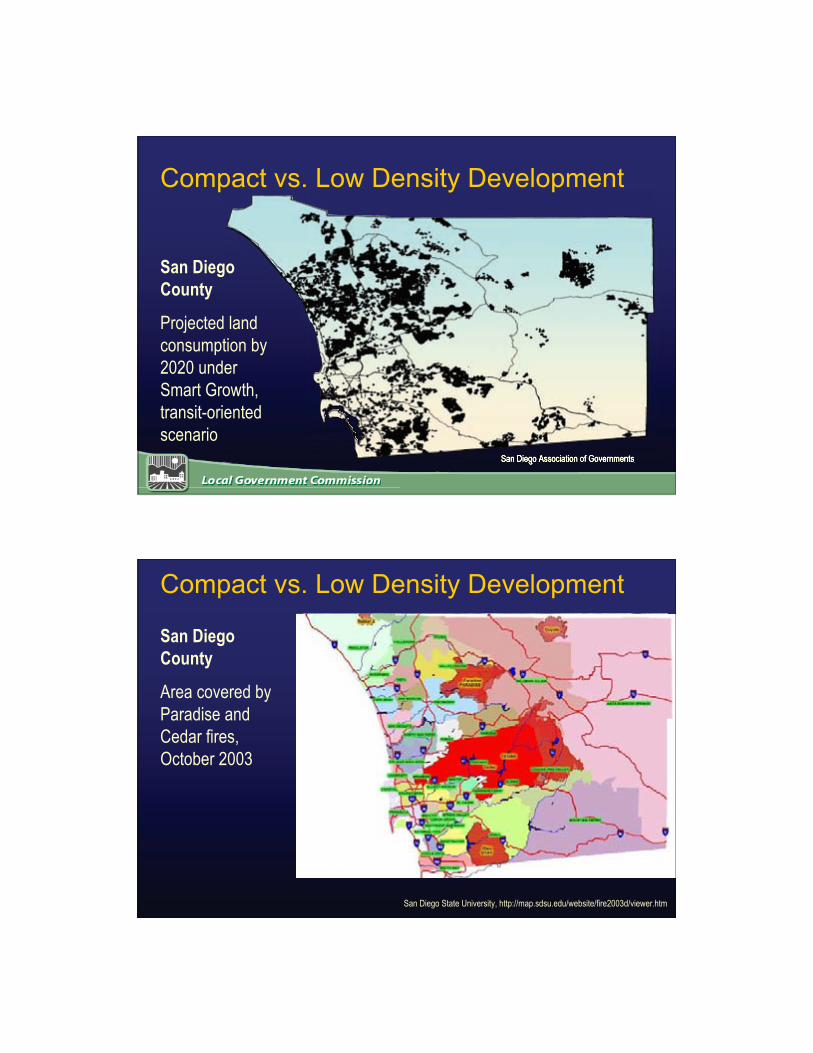
San DiegoCounty
Projected landconsumption by2020 underSmart Growth,transit-orientedscenario
Compact vs. Low Density Development
San Diego Association of GovernmentsSan Diego Association of GovernmentsSan Diego Association of Governments
San DiegoCounty
Area covered byParadise andCedar fires,October 2003
Compact vs. Low Density Development
San Diego State University, http://map.sdsu.edu/website/fire2003d/viewer.htm

26
California Population Change by AgeGroup — 1990-2040
0-19
20-34
35-49
50-64
65+
0% 50% 100% 150% 200% 250%
Source: California Dept. of Finance
Demographic Changes
In 1991there were31.8 millionpeople overthe age of 65in the U.S.
By 2030 thatnumber willincrease to66 million.
Increase in Elderly Population

27
Changing Housing Preferences
PercentCalling FactorVeryImportant ifBuying aHome Today
Source: Dowell MyersUSC School of Policy , Planning,
and Development
Percent Calling Factor Very Important if
Buying a Home Today
0
10
20
30
40
50
60
70
80
90
25-34 35-44 45-54 55+
Age Group
Crime Rate
School District
HighwayAccess
Location toShopping
PublicTransportation
NAHB, 1999
Percent Calling Factor Very Important if
Buying a Home Today
0
10
20
30
40
50
60
70
80
90
25-34 35-44 45-54 55+
Age Group
Crime Rate
School District
HighwayAccess
Location toShopping
PublicTransportation
NAHB, 1999
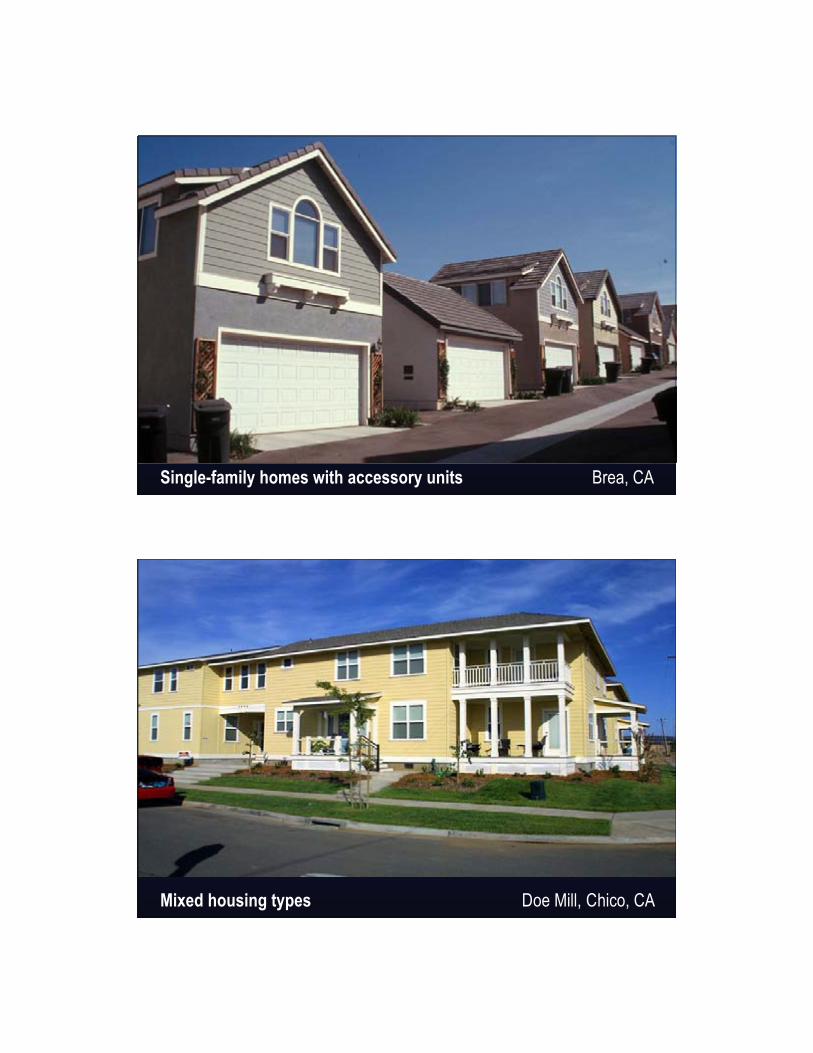
5. Provide housing opportunities and choices
Provide qualityhousing forpeople of allincome levels,householdsizes, andstages in thelife cycle.

28
Mixed Income Housing San Mateo, CA
Mixed Income Housing Redwood City, CA
29
Single-family homes with accessory units Brea, CA
Mixed housing types Doe Mill, Chico, CA
30
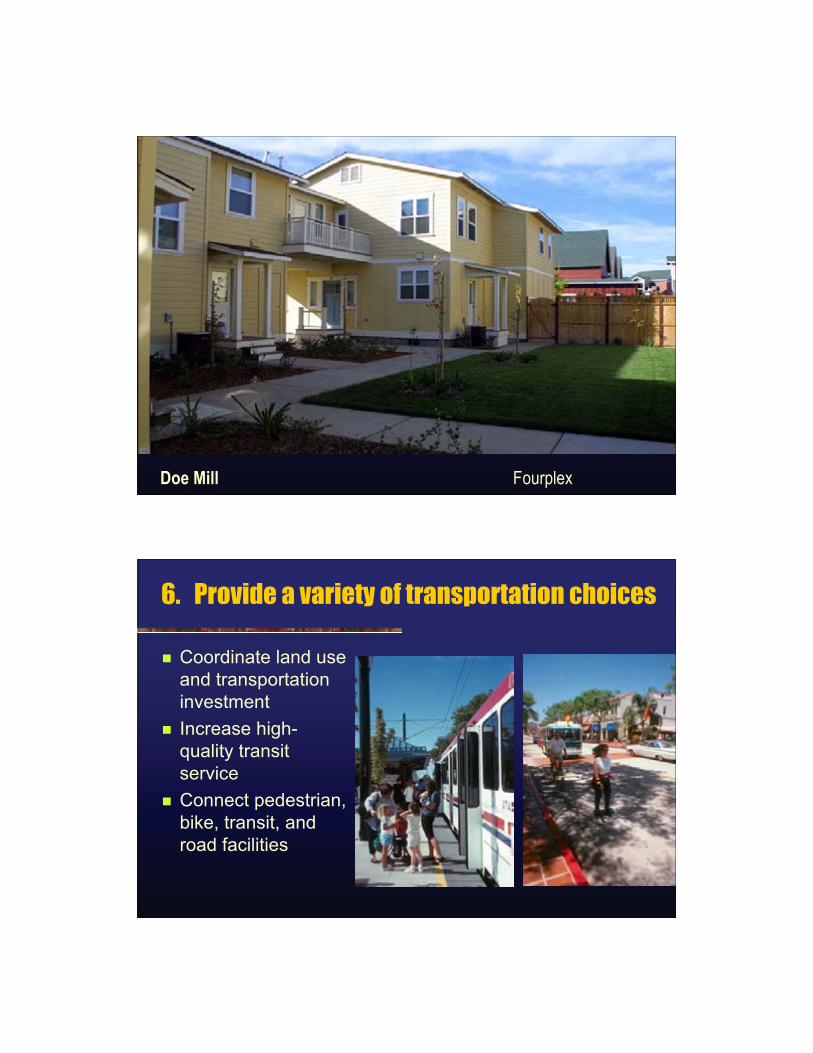
Doe Mill Fourplex
6. Provide a variety of transportation choices
Coordinate land useand transportationinvestment
Increase high-quality transitservice
Connect pedestrian,bike, transit, androad facilities

31
Transit-Oriented Development San Diego, CA
Portland Streetcar

32
Portland Bus Mall
Bicycling for transportation

33
Davis Bike Trail
7. Create walkable communities
Mix land uses,build compactly,and provide safeand invitingpedestriancorridors

34
Street Design
Influences trip choices Safe, quiet, slow,
shaded streetsencourage people towalk, ride bicycle or taketransit instead of drivinga car
Conventional Patternof Development

35
Trip Assignment:Conventional
Traditional Patternof Development
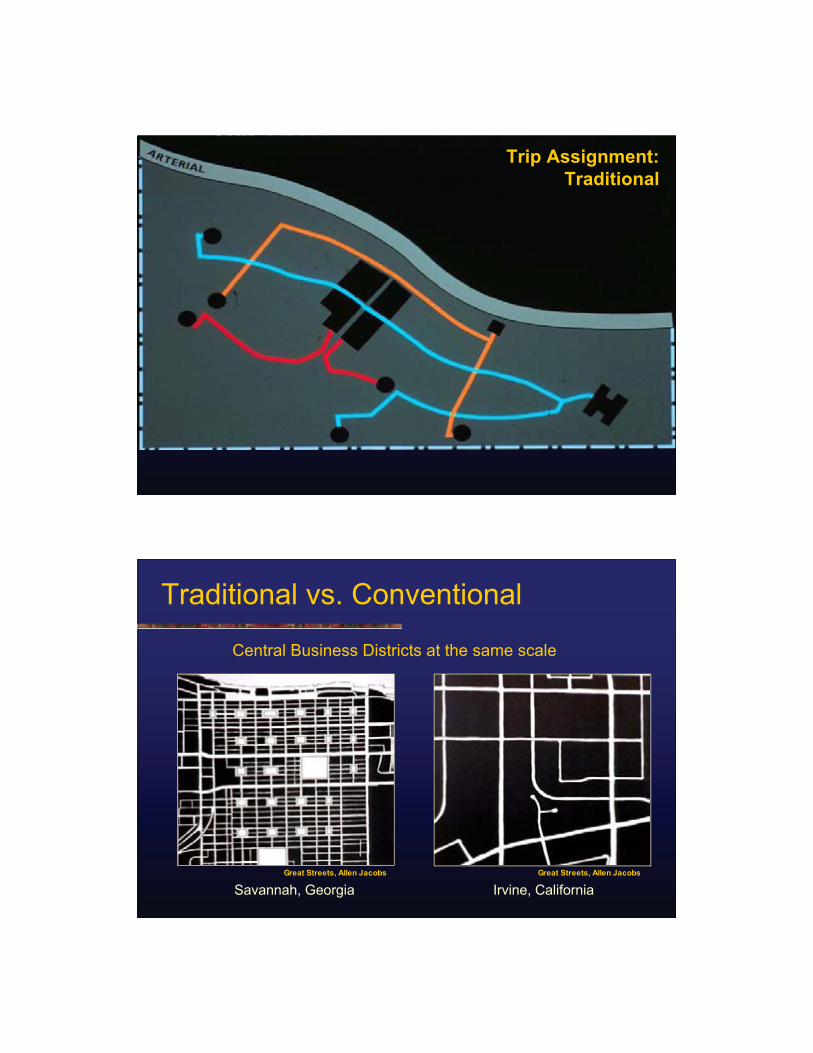
36
Trip Assignment:Traditional
Traditional vs. Conventional
Savannah, Georgia Irvine, California
Central Business Districts at the same scale
Great Streets, Allen Jacobs Great Streets, Allen Jacobs

37
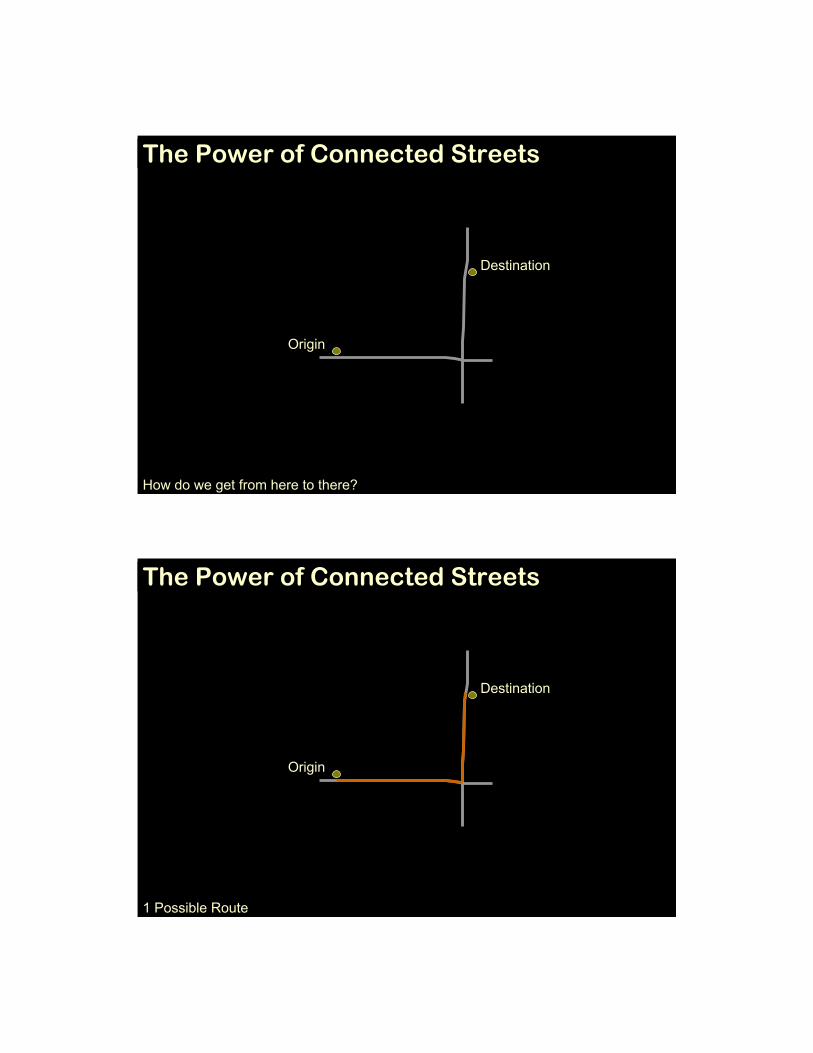
Origin
Destination
How do we get from here to there?
The Power of Connected Streets
Origin
Destination
How do we get from here to there?
The Power of Connected Streets
38
Origin
Destination
How do we get from here to there?
The Power of Connected Streets
Origin
Destination
1 Possible Route
The Power of Connected Streets
39
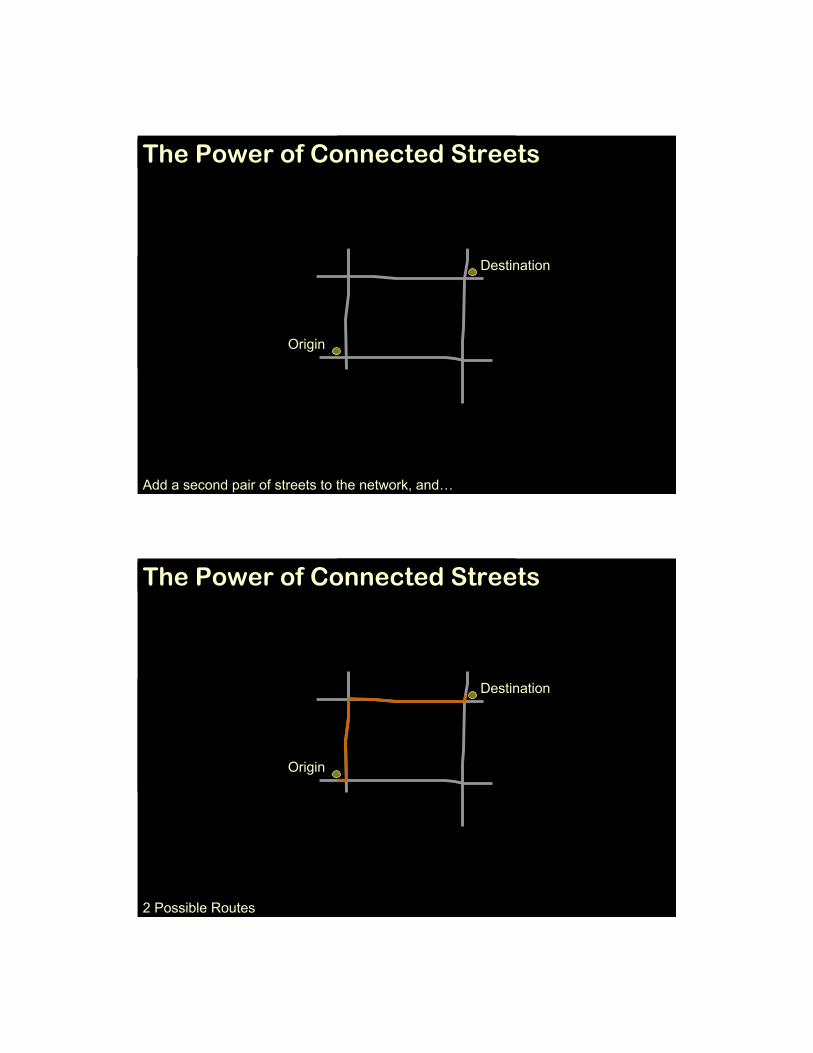
Origin
Destination
Add a second pair of streets to the network, and…
The Power of Connected Streets
Origin
Destination
2 Possible Routes
The Power of Connected Streets

40
Origin
Destination
Add another street in each direction…More Possible Routes: 6 in all, without doubling back
y= 2
x= 2
The Power of Connected Streets
The Casey Hawthorne Traffic Routes Equation (only accounts for one direction)
(x!)(y!) = # of possible routes(x+y)!
The Power of Connected Streets
41
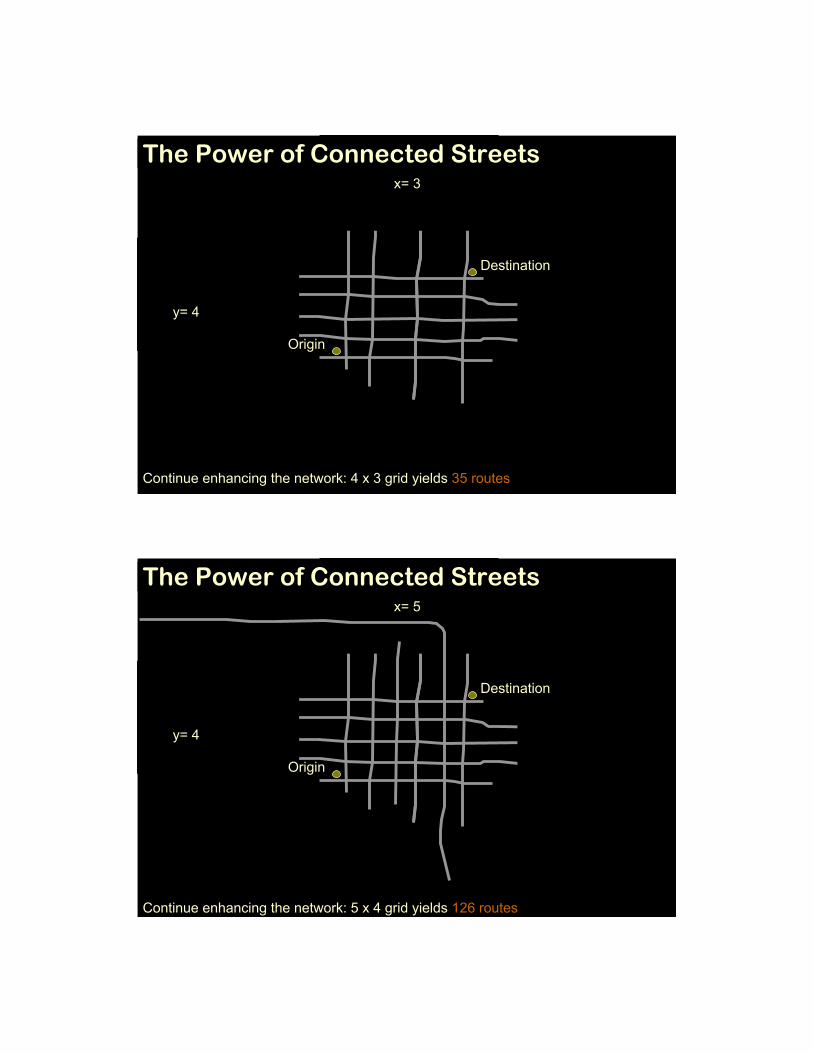
Origin
Destination
y= 4
x= 3
Continue enhancing the network: 4 x 3 grid yields 35 routes
The Power of Connected Streets
Origin
Destination
y= 4
x= 5
Continue enhancing the network: 5 x 4 grid yields 126 routes
The Power of Connected Streets

42
Make a town, not “pods.” 8 x 8 grid yields 12,870 routes
The Power of Connected Streets
Courtesy: Vince Graham
Principles ofSafe, WalkableStreets Streets
designed forpeople, notjust cars
Friendly tocars,pedestriansand cyclists
43
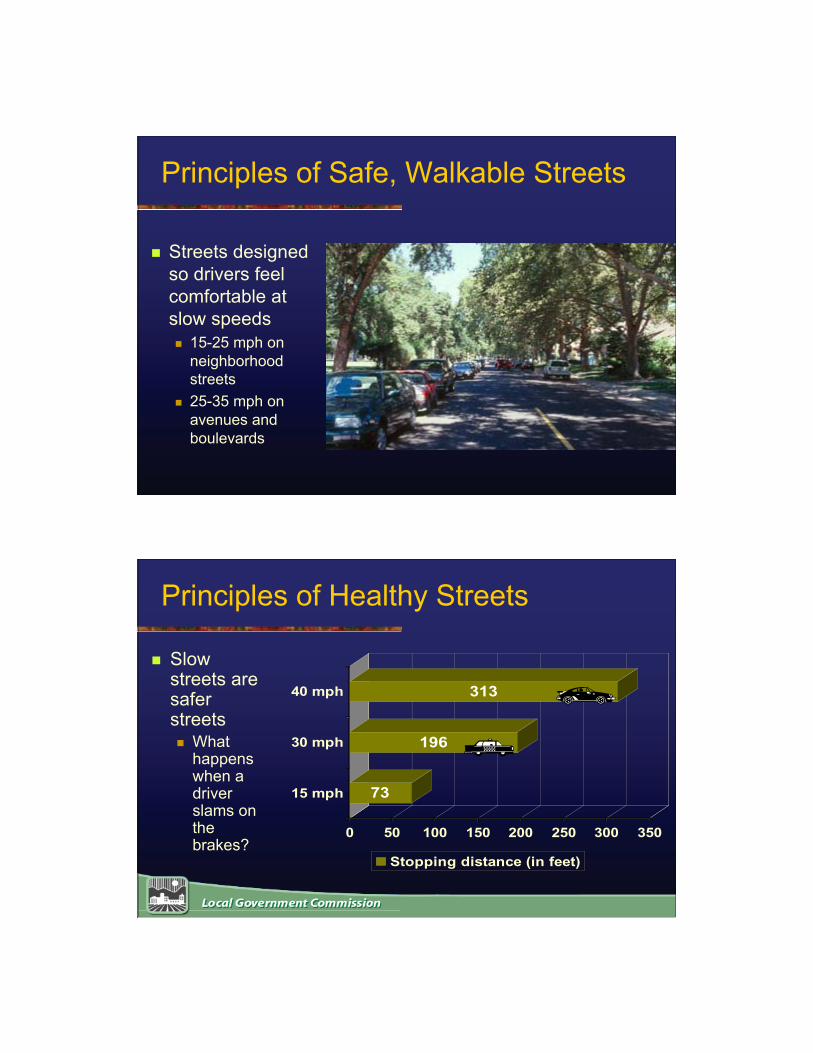
Principles of Safe, Walkable Streets
Streets designedso drivers feelcomfortable atslow speeds 15-25 mph on
neighborhoodstreets
25-35 mph onavenues andboulevards
Principles of Healthy Streets
Slowstreets aresaferstreets What
happenswhen adriverslams onthebrakes?
73
196
313
0 50 100 150 200 250 300 350
15 mph
30 mph
40 mph
Stopping distance (in feet)

44
Principles of Healthy Streets
Slowstreets aresafer streets What
happenswhen avehicle hitsa pedestrian
3.5%
37.0%
83.0%
0%
20%
40%
60%
80%
100%
15 mph 31 mph 44 mph
Probability of Fatal Injury
Principles of Safe, Walkable Streets
Narrower streets are slower and safer Longmont, CO study of 20,000 accidents
Found street width had the greatest relationship to injuryaccidents
Accidents/mile/year were higher on wider streets 40-foot wide street 2.23 a/m/y 36-foot wide street 1.21 a/m/y 24-foot wide street 0.32 a/m/y
Source: “Residential Street Typology and Injury AccidentFrequency,” Swift and Associates, Longmont, CO, 1997

45
Principles ofHealthy Streets Speeds on narrower
streets are slower Speeds on streets
with less widthbetween buildings areslower 1981 Study of San
Francisco Streets byDonald Appleyard
Source: D.T. Smith and D. Appleyard, Improving the Residential StreetEnvironment — Final Report, FHWA, Washington, DC, 1981
Safe Streets Need Good Sidewalks
Detachedfrom curb
At least 5feet wide
Plantingstrip helpsshadestreet andsidewalk

46
Safe Streets Need Good Sidewalks
The Burden of Physical Inactivity
The Problem 27% of adults are sedentary 61% of adults are overweight 1 in 4 adults is obese
The Outcome Obesity, Cardiovascular Disease,
Cancer, Diabetes Physical inactivity is a primary factor
in over 250,000 deaths annually.
Medical costs associated withphysical inactivity and itsconsequences may exceed $120billion annually.
Data Sources: 2000 BRFSS, 1999 NHANES, Powell 1994, Pratt et. al. 2000
47
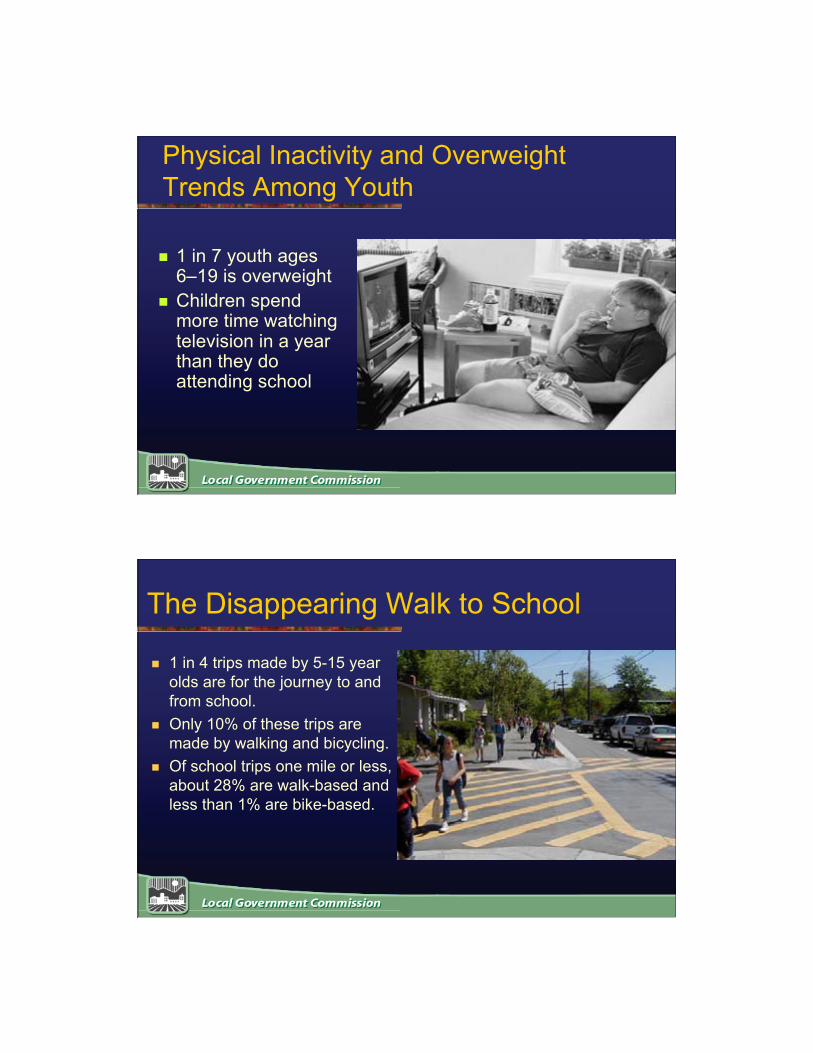
Physical Inactivity and OverweightTrends Among Youth
1 in 7 youth ages6–19 is overweight
Children spendmore time watchingtelevision in a yearthan they doattending school
The Disappearing Walk to School
1 in 4 trips made by 5-15 yearolds are for the journey to andfrom school.
Only 10% of these trips aremade by walking and bicycling.
Of school trips one mile or less,about 28% are walk-based andless than 1% are bike-based.

48
5.1
7.0
8.8
12.1
14.1
14.9
16.0
1960 1970 1980 1990 2001 2006 2014
Year
US Health Care Expenditures asPercent of GDP Projections
Heffler et al. U.S. Health Spending Projections for 2004-2014. Health Tracking, February 23, 2005
Traffic Safety
49
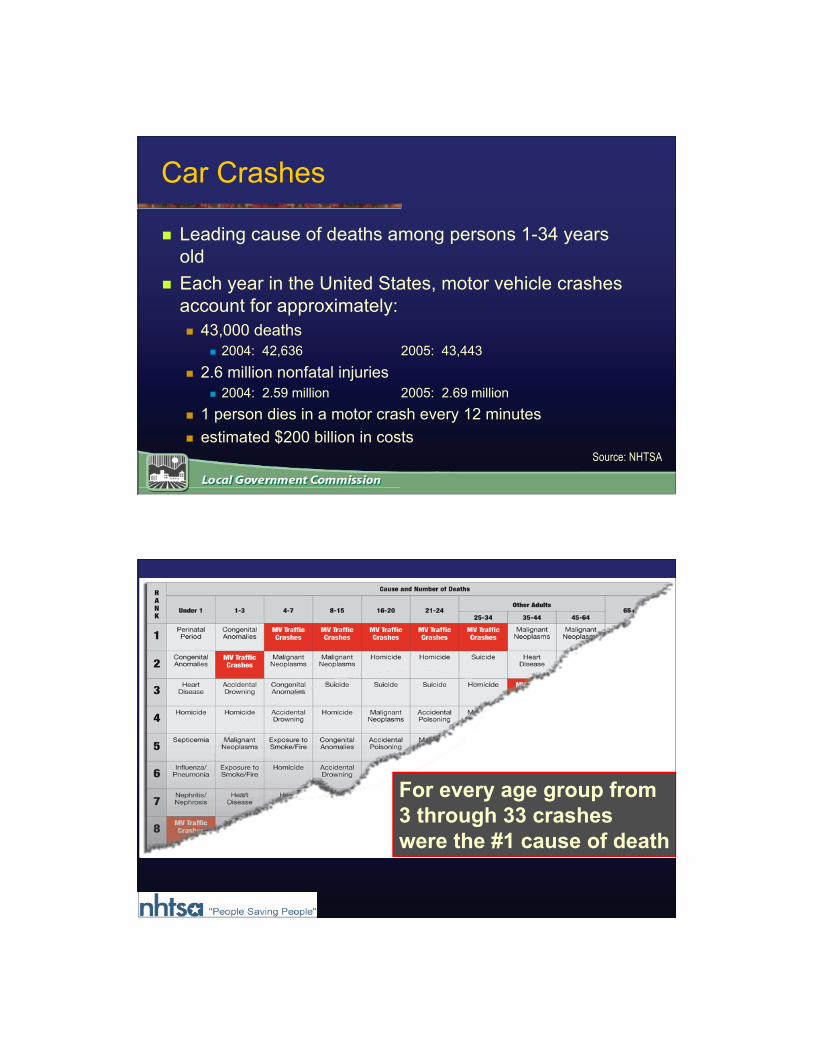
Car Crashes
Leading cause of deaths among persons 1-34 yearsold
Each year in the United States, motor vehicle crashesaccount for approximately: 43,000 deaths
2004: 42,636 2005: 43,443
2.6 million nonfatal injuries 2004: 2.59 million 2005: 2.69 million
1 person dies in a motor crash every 12 minutes estimated $200 billion in costs
Source: NHTSA
For every age group from3 through 33 crasheswere the #1 cause of death

50
Source: NHTSA “Traffic Safety Facts 2004”
Automobile fatality rates by city, 2004(excluding pedestrian fatalities; deaths/100,000/year)
9.80
10.52
11.33 13.12
1.78New York
2.96San Francisco
5.44Portland
7.95Houston
10.58Phoenix
10.33Dallas
12.88Atlanta
5.58Philadelphia
5.94Sacramento
14.1Orlando
Source: NHTSA “Traffic Safety Facts 2004”
Pedestrian fatality rates by city, 2004(deaths/100,000/year)
9.80
10.52
11.33 13.12
1.83New York
2.55San Francisco
1.69Portland
2.14Houston
2.89Phoenix
4.46Dallas
3.82Atlanta
2.65Philadelphia
2.20Sacramento
2.92Orlando

51
Pedestrian Danger Index
Fatality rate (per 100k people)% of people walking to work
Surface Transportation Policy Project (STPP),
“Mean Streets 2004” Report
Surface Transportation Policy Project (STPP), “Mean Streets 2004” Report
9.80
10.52
11.33 13.12
33.4New York
49.4San Francisco
43.0Portland
121.9Houston
117.2Phoenix
103.7Dallas
144.4Atlanta
48.3Philadelphia
95.9Sacramento
Pedestrian Danger Index, 2002-2003Fatality rate (per 100k people) as % of people walking to work
243.6Orlando
52
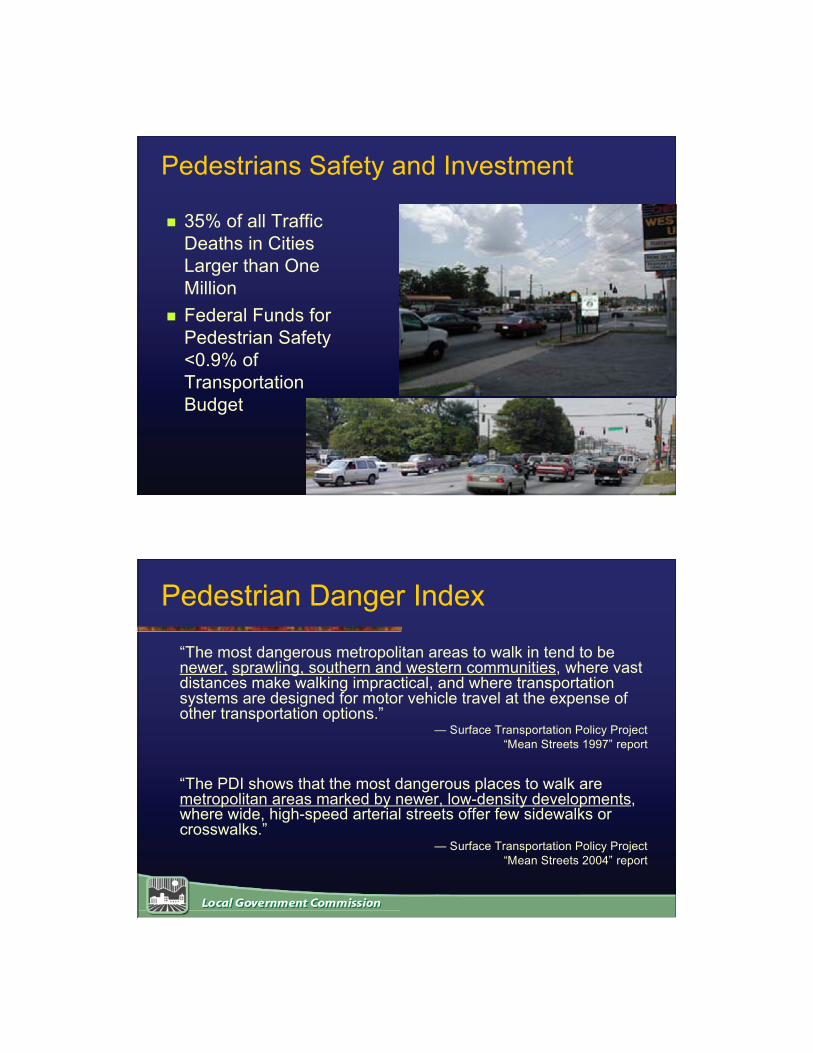
Pedestrians Safety and Investment
35% of all TrafficDeaths in CitiesLarger than OneMillion
Federal Funds forPedestrian Safety<0.9% ofTransportationBudget
Pedestrian Danger Index
“The most dangerous metropolitan areas to walk in tend to benewer, sprawling, southern and western communities, where vastdistances make walking impractical, and where transportationsystems are designed for motor vehicle travel at the expense ofother transportation options.”
— Surface Transportation Policy Project“Mean Streets 1997” report
“The PDI shows that the most dangerous places to walk aremetropolitan areas marked by newer, low-density developments,where wide, high-speed arterial streets offer few sidewalks orcrosswalks.”
— Surface Transportation Policy Project“Mean Streets 2004” report

53
Safety and Community Design
Pedestrian Fatalities
11%
6%
28%
22%
15%
18%
Interstate
Freeway/Expressway
Primary Artery
Minor Arteries
Collector Roads
Local roads
More than halfof thepedestrianfatalitiesoccurred onminor arterialsand local roads
Surface Transportation Policy Project (STPP), “Mean Streets 1997” Report

54

55

56
57
For more information
Web: www.lgc.orgPhone: 800-290-8202Phone: 916-448-1198e-mail: [email protected]
New Partners for Smart Growth Conference Washington, DC February 7-9, 2008
www.newpartners.org