Embed Size (px)
Citation preview

OVERVIEW
1The Sri Lankan economy, which experienced below potential growth in recent years, encountered renewed
challenges amidst the outbreak of COVID-19. Reflecting the combined effects of the spread of COVID-19 locally and the introduction of lockdown measures, the slowdown in global economic activity, and the adverse
weather conditions in the country, the economy contracted by 1.6 per cent in the first quarter of 2020, year-on-year, as per the provisional estimates of the Department of Census and Statistics (DCS). GDP estimates for the second quarter have not yet been released by the DCS citing difficulties in capturing the true nature of disruptions and new activities as well as novel ways of working that emerged this year with the onset of the pandemic. Nevertheless, high frequency data point towards a strong recovery in many areas of economic activity in more recent months prior to the resurgence of COVID-19 infections and resultant containment measures in October 2020. The recovery of activity was facilitated by the concerted efforts of the Government and the Central Bank. Relief measures and large scale policy stimuli were introduced to help businesses and individuals affected by the pandemic. The Central Bank initiated a series of monetary easing measures, including multiple reductions of the policy rates and the Statutory Reserve Ratio (SRR), thereby injecting ample liquidity into the market and lowering borrowing costs significantly, given the unprecedented circumstances caused by the pandemic. The adverse effects of the pandemic also prompted the introduction of concessional credit schemes to fulfil the needs of small and medium scale enterprises (SMEs), alongside debt moratoria for businesses and individuals affected by the pandemic. Responding to these measures, credit to the private sector showed a significant improvement in August and September 2020, reversing the slowdown observed in previous months. The Central Bank also provided required funds to the Government by purchasing Treasury bills at primary auctions. Increased credit flows to the public sector mainly contributed to the acceleration of broad money growth during the nine months ending September 2020. Meanwhile, the financial system withstood the adverse impact stemming from domestic and global economic slowdown, while supporting the revival of the economy. In the meantime, the external sector, which was severely affected at the initial stages of the pandemic, marked a notable rebound with an improvement in the trade balance, a revival of workers’ remittances, a stable exchange rate, and a reasonable level of official reserves. The external sector stability was supported by the restrictions placed on non-essential imports and selected outflows as well as low global petroleum prices. Proactive measures taken by the Government and the Central Bank and the unexpected rebound in workers’ remittances since June 2020 helped partly cushion the impact of the significant decline in earnings from tourism due to persistent global travel restrictions. The financial account of the balance of payments (BOP) experienced subdued performance as the pandemic affected cross border financial flows. However, gross official reserves remained at adequate levels, benefiting from inflows to the Government and the Central Bank, including the net purchases of foreign exchange from the domestic foreign exchange market. Amidst adverse speculation and Sovereign rating downgrades, the Government met all its debt service obligations, including the settlement of the International Sovereign Bond (ISB) that matured in early October 2020. Meanwhile, the performance of the fiscal sector was significantly affected by the decline of government revenue amidst the economic fallout, while the large amount of outstanding bills brought forward from the previous year weighed on the expenditure management efforts of the Government. The Government’s plans to reduce the budget deficit over the medium term remain critical in ensuring macroeconomic stability and the sustainability of public debt in the period ahead. Meanwhile, subdued demand conditions and well anchored inflation expectations helped maintain inflation broadly within the target range of 4-6 per cent thus far during 2020, although a transitory acceleration was observed due to the rise in food prices. Inflation is expected to be maintained in this range over the medium term with appropriate policy measures, within the flexible inflation targeting framework of the Central Bank. Meanwhile, economic growth is expected to rebound in 2021, and maintain the upward trajectory over the medium term, supported by pro-growth policies of the Government. Policies to boost domestic production are also expected to ease the pressure on the external sector of the economy on a sustained basis. Nevertheless, the success of containing COVID-19 locally and globally remains critical in determining the pace and the magnitude of domestic economic recovery and revival in the period ahead.

1
2
CENTRAL BANK OF SRI LANKA | RECENT ECONOMIC DEVELOPMENTS: HIGHLIGHTS OF 2020 AND PROSPECTS FOR 2021
Figure 1.1
Recovery of the Sri Lankan Economy
Available economic indicators show that by Q3 2020, many sectors of the Sri Lankan economy recovered from the slump in Q2...
However, the resurgence of COVID-19 infections in October 2020 could challenge this momentum...
1,000
500
0
Jan
Feb
Mar
Apr
May
Jun Jul
Aug
Sep
Oct
Nov
Dec
Jan
Feb
Mar
Apr
May
Jun Jul
Aug
Sep
Oct
Nov
Dec
2019 2020
2019 2020
Jan
Feb
Mar
Apr
May
Jun Jul
Aug
Sep
MT ‘0
00
120
100
80
60
40
1.8
1.2
0.6
0
Inde
x Poi
ntNo
. of v
ehicl
es (m
illion
)
Index of Industrial Production (IIP)
Several subsectors of the Agriculture Sector, such as paddy, recorded a healthy level of production...
The Industry Sector recovered to a great extent in Q3 2020, following the setback observed during the nationwide lockdown...
2019 2020
GWh
Electricity Generation
Inde
x Valu
e
Purchasing Managers’ Index (Manufacturing)
Expressway Traffic - 2020
Cement Availability
2019
2020
6
4
2
0
mill
ion
MT
Paddy Production
2019 2020
Jan
Feb
Mar
Apr
May
Jun Jul
Aug
Sep
Oct
Nov
Dec
Tea Production
Maha Yala Expected Yala for 2020
2019 2020
Jan
Feb
Mar
Apr
May
Jun Jul
Aug
Sep
Oct
Nov
Dec
1,500
1,200
900
40
30
20
10
mill
ion
Kg
80
60
40
20
0
Jan
Feb
Mar
Apr
May
Jun Jul
Aug
Sep
Oct
Nov
Dec

11
3
OVERVIEW
Most activities in the Services Sector reached pre-pandemic levels by Q3 2020, despite the immediate impact of the pandemic...
A broad based recovery was also observed in Other Macroeconomic Indicators during Q3 2020...
2019 2020
Total data usage Year-on-Year Growth (Right Axis)
2019 2020
2019
Note: 1 Petabyte (PB) = 1 million Gigabytes (GB)
2020
2019 2020
Jan
0
4
8
12
16
Feb
Mar
Apr
May
Jun Jul
Aug
Sep
Oct
Nov
Dec
Jan
1,200
800
400
0
Feb
Mar
Apr
May
Jun Jul
Aug
Sep
Oct
Nov
Dec
Jan
Feb
Mar
Apr
May
Jun Jul
Aug
Sep
Oct
Nov
Dec
Jan-1
9Fe
b-19
Mar-1
9Ap
r-19
May-1
9Ju
n-19
Jul-1
9Au
g-19
Jan-2
0Fe
b-20
Mar-2
0Ap
r-20
May-2
0Ju
n-20
Jul-2
0Au
g-20
Sep-1
9Oc
t-19
Nov-1
9De
c-19
120 100
80
60
40
20
0
80
40
0
2019 2020
750
650
550
450
350
US$ m
illion
US$ m
illion
Per c
ent
Peta
byte
s
Per c
ent
Inde
x Valu
e
Purchasing Managers’ Index (Services)
Workers’ Remittances
2019 2020
Jan
Feb
Mar
Apr
May
Jun Jul
Aug
Sep
Oct
Nov
Dec
TEUs
('000
)
Container Handling activities
Private Sector Credit Growth (Y-o-Y)
Jan
Feb
Mar Apr
May Jun Jul
Aug
Sep
Oct
Nov
Dec
400
300
200
100
milli
on lit
res
CPC Petroleum Sales to the Transport Sector
Export Earnings
Broadband Data Usage
Jan
Feb
Mar
Apr
May
Jun Jul
Aug
Sep
Oct
Nov
Dec
60
80
40
20
0
Share Market Performance
2019 2020
Index
Value
(ASP
I)
Jan
Feb
Mar
Apr
Jun Jul
Oct
Nov
Dec
May
Aug
Sep
7,000
6,000
5,000
4,000
Sources: Central Bank of Sri Lanka, Ceylon Electricity Board, Ceylon Petroleum Corporation, Colombo Stock Exchange, Department of Agriculture, Department of Census and Statistics, Road Development Authority, Sri Lanka Customs, Sri Lanka Ports Authority, Sri Lanka Tea Board and industry participants
700
600
500
400
1
4
CENTRAL BANK OF SRI LANKA | RECENT ECONOMIC DEVELOPMENTS: HIGHLIGHTS OF 2020 AND PROSPECTS FOR 2021
aged 20-29 years rose to 18.5 per cent in the first
half of 2020 from 14.8 per cent in the same period
of the preceding year. Further, unemployment
among females with an educational attainment
of GCE Advanced Level or above, increased
from 12.3 per cent in the first half of 2019 to
14.5 per cent in the first half of 2020. Meanwhile,
the LFPR declined to 50.6 per cent in the first half
of 2020 from 52.6 per cent in the corresponding
period of the preceding year. The male LFPR
reduced from 73.4 per cent in the first half of
2019 to 72.1 per cent in the same period of
2020, while the female LFPR declined to
32.0 per cent in the first half of 2020 from
34.7 per cent recorded in the same period of the
preceding year. Amongst the employed population,
the shares of employment in agriculture, industry
and services sectors in the first half of 2020 were
26.8 per cent, 27.0 per cent and 46.2 per cent,
respectively. In relation to quarterly estimates,
the unemployment rate, which was estimated at
5.7 per cent in the first quarter of 2020, declined
to 5.4 per cent in the second quarter, suggesting
that economic activity remained without much
deterioration in the second quarter.
y Subdued demand conditions and well
anchored inflation expectations helped
maintain inflation broadly within the
4-6 per cent range thus far in 2020, in
spite of the frequent escalation of food
inflation. Year-on-year headline inflation based
Sectoral Developments
Real Sector and Inflation
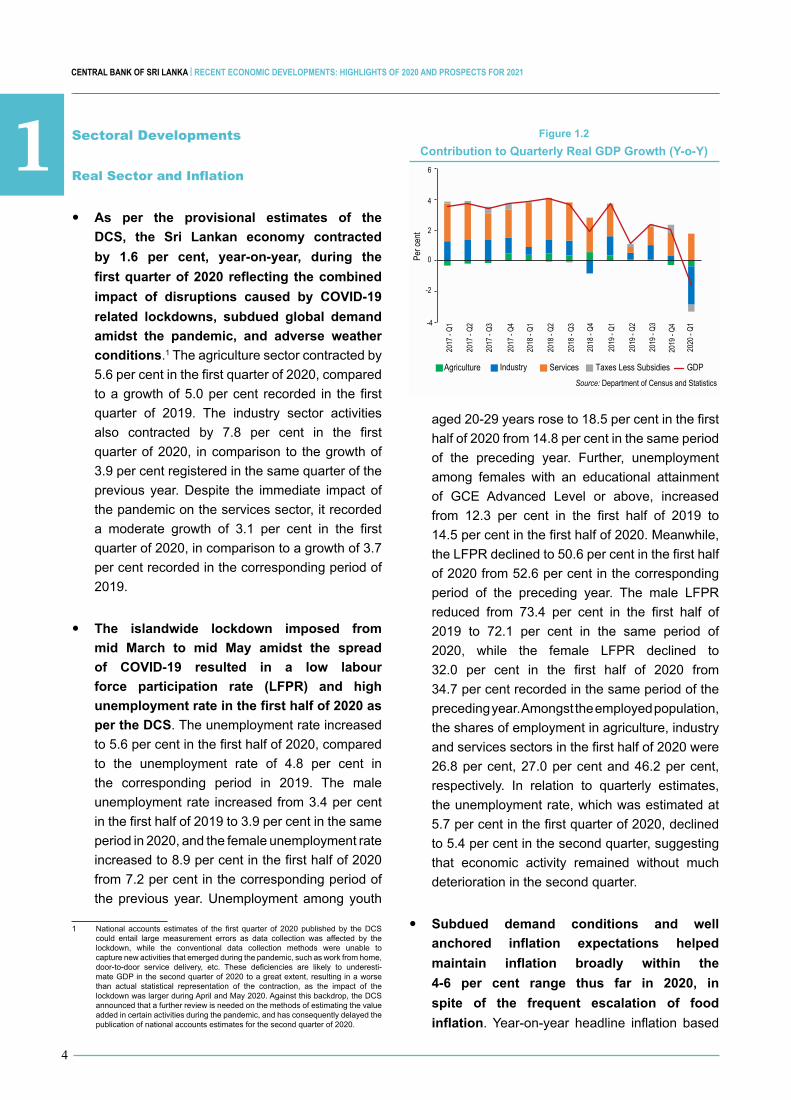
y As per the provisional estimates of the
DCS, the Sri Lankan economy contracted
by 1.6 per cent, year-on-year, during the
first quarter of 2020 reflecting the combined
impact of disruptions caused by COVID-19
related lockdowns, subdued global demand
amidst the pandemic, and adverse weather
conditions.1 The agriculture sector contracted by
5.6 per cent in the first quarter of 2020, compared
to a growth of 5.0 per cent recorded in the first
quarter of 2019. The industry sector activities
also contracted by 7.8 per cent in the first
quarter of 2020, in comparison to the growth of
3.9 per cent registered in the same quarter of the
previous year. Despite the immediate impact of
the pandemic on the services sector, it recorded
a moderate growth of 3.1 per cent in the first
quarter of 2020, in comparison to a growth of 3.7
per cent recorded in the corresponding period of
2019.
y The islandwide lockdown imposed from
mid March to mid May amidst the spread
of COVID-19 resulted in a low labour
force participation rate (LFPR) and high
unemployment rate in the first half of 2020 as
per the DCS. The unemployment rate increased
to 5.6 per cent in the first half of 2020, compared
to the unemployment rate of 4.8 per cent in
the corresponding period in 2019. The male
unemployment rate increased from 3.4 per cent
in the first half of 2019 to 3.9 per cent in the same
period in 2020, and the female unemployment rate
increased to 8.9 per cent in the first half of 2020
from 7.2 per cent in the corresponding period of
the previous year. Unemployment among youth
1 National accounts estimatesof the first quarter of 2020publishedby theDCScould entail large measurement errors as data collection was affected by the lockdown, while the conventional data collection methods were unable to capture new activities that emerged during the pandemic, such as work from home, door-to-door service delivery, etc. These deficiencies are likely to underesti-mate GDP in the second quarter of 2020 to a great extent, resulting in a worse than actual statistical representation of the contraction, as the impact of the lockdownwaslargerduringAprilandMay2020.Againstthisbackdrop,theDCSannounced that a further review is needed on the methods of estimating the value added in certain activities during the pandemic, and has consequently delayed the publication of national accounts estimates for the second quarter of 2020.
Figure 1.2
Contribution to Quarterly Real GDP Growth (Y-o-Y)
Agriculture
2017
- Q1
2017
- Q2
2017
- Q3
2017
- Q4
2018
- Q1
2018
- Q2
2018
- Q3
2018
- Q4
2019
- Q1
2019
- Q2
2019
- Q3
2019
- Q4
2020
- Q1
Industry Services GDPTaxes Less Subsidies
Per c
ent
Source: Department of Census and Statistics
6
4
2
0
-2
-4

11
5
OVERVIEW
on the Colombo Consumer Price Index
(CCPI, 2013=100), which accelerated to
6.2 per cent in February 2020 from 4.8 per cent
at end 2019 driven by food inflation, gradually
moderated to 4.0 per cent by September 2020
with the gradual easing of food inflation and
the favourable base effect. Headline inflation
based on the National Consumer Price Index
(NCPI, 2013=100) also showed a similar trend
although remaining relatively high due to the large
weight attached to the food category in the NCPI.
On a year-on-year basis, NCPI based headline
inflation peaked at 8.1 per cent in February 2020,
beforemoderatingto6.4percent inSeptember
2020. In the meantime, core inflation, which
reflects the underlying trend in inflation, remained
low thus far during the year, reflecting subdued
demand conditions. The moderate level of core
inflation also reflected the impact of a decrease
in prices of telecommunication and data services
due to the reduction of the telecommunication levy
in December 2019, while the reduction of VAT in
December 2019 also supported the deceleration
in core inflation. Accordingly, on a year-on-year
basis, CCPI based core inflation slowed to
2.9percentinSeptember2020from4.8percent
at end 2019, while NCPI based core inflation
easedto4.8percentbySeptember2020,from
5.2 per cent at end 2019.
External Sector
y Sri Lanka’s external sector, which experienced
heightened vulnerabilities at the onset of
the COVID-19 pandemic, recovered to a
great extent thereafter, supported by timely
policy measures of the Central Bank and the
Government. The deficit in the trade account
contracted notably, compared to the same
period of 2019, reflecting the impact of the large
reduction of merchandise imports that outpaced
the decline in merchandise exports during the
period from January to August 2020. The decline
in monthly export earnings observed during early
2020 reversed from May, enabling monthly export
earningstoreachUSdollars1billion,onaverage,
in the third quarter of the year. The surplus in the
services account declined considerably in the first
half of 2020, compared to the first half of 2019,
mainly reflecting the low earnings from tourism.
However, the computer services sector continued
to record a healthy growth with undisrupted
functioning of information technology and business
process outsourcing (IT/BPO) companies during
the lockdown period. Accordingly, the surplus in
theservicesaccount reducedtoUSdollars901
million in the first half of 2020, in comparison
to US dollars 1,545 million in the first half of
2019. The deficit in the primary income account
declined to US dollars 1,041million in the first
halfof2020,comparedtothedeficitofUSdollars
1,119 million in the corresponding period of 2019.
This was mainly due to the reduction of reinvested
earnings on foreign direct investment (FDI),
the marginal reduction of dividends repatriated
by Direct Investment Enterprises (DIEs), and
the reduction in interest expenditure on foreign
loans. In the secondary income account,
workers’ remittances declined by 8.9 per cent to
USdollars2,980million in the firsthalfof 2020
fromUSdollars 3,270million in the first half of
2019. However, workers’ remittances recovered at
a faster pace from June 2020 to record a growth of
2.4 per cent, year-on-year, for the nine months
ending September 2020. The substantial
reduction of earnings from tourism along with the
Headline (Y-o-Y) based on CCPICore (Y-o-Y) based CCPI
Headline (Y-o-Y) based on NCPICore (Y-o-Y) based NCPI
Jan-
18
Jan-
19
Jan-
20
Jul-1
8
Jul-1
9
Jul-2
0
Mar-1
8
Mar-1
9
Mar-2
0
Sep-
18
Sep-
19
Sep-
20
May-1
8
May-1
9
May-2
0
Nov-1
8
Nov-1
9
Figure 1.3
Movements of Headline and Core Inflation (Y-o-Y)
Source: Department of Census and Statistics
Per c
ent
0
2
4
6
8
10
Education,Health &
House RentFood
InflationEasing of Food Inflation
Food Deflation

1
6
CENTRAL BANK OF SRI LANKA | RECENT ECONOMIC DEVELOPMENTS: HIGHLIGHTS OF 2020 AND PROSPECTS FOR 2021
moderation of workers’ remittances amidst the
spread of COVID-19 widened the external current
account deficit considerably during the first half
of 2020 to US dollars 792 million, compared
to the deficit of US dollars 351 million in the
corresponding period of 2019.
y The deficit in the trade account contracted
in the eight months ending August 2020,
compared to the corresponding period
of 2019, as the expenditure on imports
contracted more than the decline in exports.
All main sectors of import expenditure and export
earnings recorded a decline during the period
from January to August 2020, compared to a
year earlier. Accordingly, expenditure on imports
declinedbyUSdollars2,628million(20.4percent)
toUSdollars10,257million,whileearningsfrom
exports declined by US dollars 1,585 million
(19.7 per cent) to US dollars 6,445 million,
compared to the corresponding period of 2019.
As a result, the trade deficit in the eight months
endingAugust2020improvedbyUSdollars1,043
milliontoUSdollars3,812millionoverthesame
period of 2019. The reduction in import expenditure
was driven by low expenditure on petroleum, and
textiles and textile articles, along with the impact
of restrictions imposed on non-essential imports
from March 2020. However, import expenditure
on food and beverages, and pharmaceuticals
increased during the period under consideration,
from a year earlier. Affected by subdued global
demand and disruption to supply chains, major
export items recorded a decline, including apparel
(by US dollars 950 million), tea (by US dollars
109million),andrubberproducts(byUSdollars
102 million) during the period from January to
August 2020, compared to the corresponding
period of the previous year. However, a notable
recovery was observed in monthly export
earnings since May 2020, supported by earnings
from apparel and rubber products. The expansion
of export earnings from personal protective
equipment (PPE), along with some improvement
in tea prices, also contributed to the revival of
export earnings. Provisional data suggest a
continuation of the recovery in export earnings in
September2020aswell.
y Inflows to the financial account remained
modest in the first half of 2020, reflecting
the dampened sentiments in global financial
markets and the slowdown in global economic
activity amidst the pandemic. A major inflow to
the Government recorded in the financial account
during the first half of 2020 was the foreign
currencytermfinancingfacilityofUSdollars500
million from the China Development Bank (CDB)
received in March 2020. Foreign investment
in the government securities market and the
Colombo Stock Exchange (CSE) recorded net
outflowsamountingtoUSdollars492millionand
US dollars 108 million, respectively, during the
period from January to June 2020. FDI, including
foreign loans, remained moderate, amounting
toUSdollars345millioninthefirsthalfof2020,
compared to US dollars 535 million in the first
half of 2019. However, net foreign loan inflows
in the financial account increased during the first
half of 2020, compared to a year earlier, with net
loan inflows to both the Government and deposit
taking corporations.
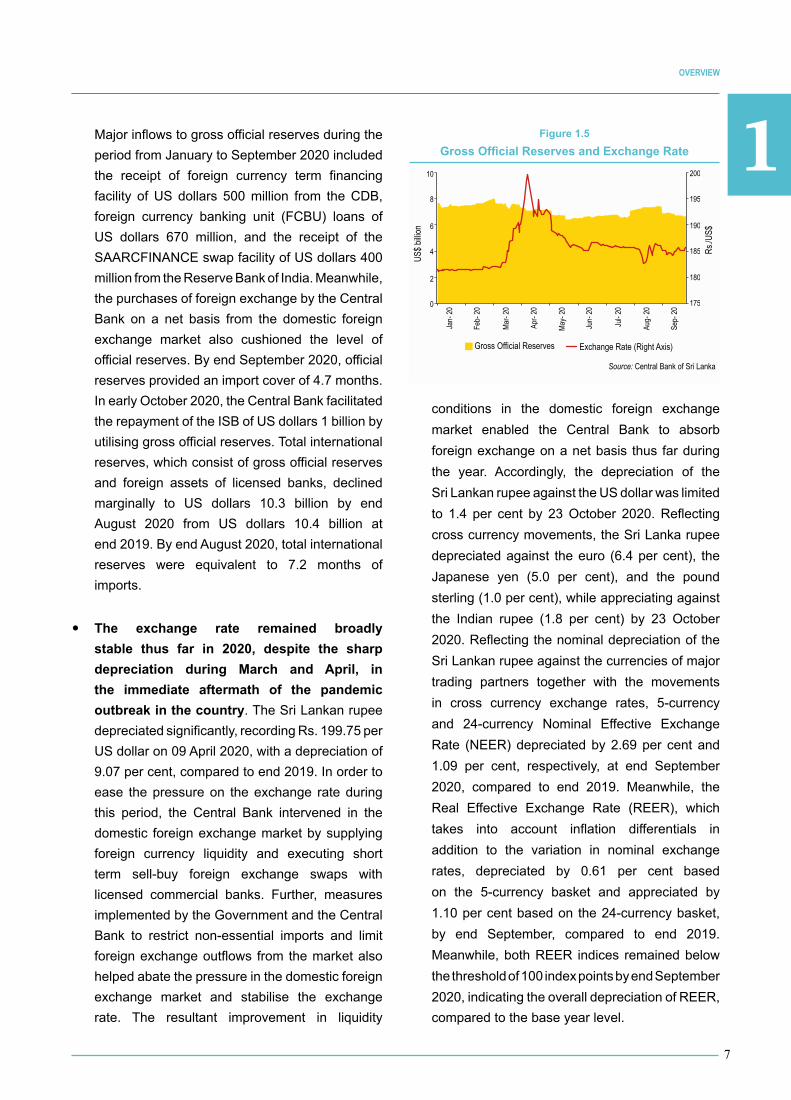
y Gross official reserves declined during 2020
up to September, but remained at adequate
levels.GrossofficialreservesstoodatUSdollars
6.7 billion by end September 2020, compared
to US dollars 7.6 billion recorded at end 2019.
Figure 1.4
Trade Balance and Current Account Balance
US$ b
illion
Source: Central Bank of Sri Lanka
-15
-10
-5
0
5
10
15
20
25
Exports
2016 2017 2018 2019 2019 Jan-Jun
2020 Jan-Jun
Imports Trade Balance Current Account Balance
11
7
OVERVIEW
Major inflows to gross official reserves during the
period from JanuarytoSeptember2020included
the receipt of foreign currency term financing
facility ofUS dollars 500million from theCDB,
foreign currency banking unit (FCBU) loans of
US dollars 670 million, and the receipt of the
SAARCFINANCEswapfacilityofUSdollars400
million from the Reserve Bank of India. Meanwhile,
the purchases of foreign exchange by the Central
Bank on a net basis from the domestic foreign
exchange market also cushioned the level of
officialreserves.ByendSeptember2020,official
reserves provided an import cover of 4.7 months.
In early October 2020, the Central Bank facilitated
therepaymentoftheISBofUSdollars1billionby
utilising gross official reserves. Total international
reserves, which consist of gross official reserves
and foreign assets of licensed banks, declined
marginally to US dollars 10.3 billion by end
August 2020 from US dollars 10.4 billion at
end 2019. By end August 2020, total international
reserves were equivalent to 7.2 months of
imports.
y The exchange rate remained broadly
stable thus far in 2020, despite the sharp
depreciation during March and April, in
the immediate aftermath of the pandemic
outbreak in the country.TheSriLankanrupee
depreciated significantly, recording Rs. 199.75 per
USdollaron09April2020,withadepreciationof
9.07 per cent, compared to end 2019. In order to
ease the pressure on the exchange rate during
this period, the Central Bank intervened in the
domestic foreign exchange market by supplying
foreign currency liquidity and executing short
term sell-buy foreign exchange swaps with
licensed commercial banks. Further, measures
implemented by the Government and the Central
Bank to restrict non-essential imports and limit
foreign exchange outflows from the market also
helped abate the pressure in the domestic foreign
exchange market and stabilise the exchange
rate. The resultant improvement in liquidity
conditions in the domestic foreign exchange
market enabled the Central Bank to absorb
foreign exchange on a net basis thus far during
the year. Accordingly, the depreciation of the
SriLankanrupeeagainsttheUSdollarwaslimited
to 1.4 per cent by 23 October 2020. Reflecting
crosscurrencymovements,theSriLankarupee
depreciated against the euro (6.4 per cent), the
Japanese yen (5.0 per cent), and the pound
sterling (1.0 per cent), while appreciating against
the Indian rupee (1.8 per cent) by 23 October
2020. Reflecting the nominal depreciation of the
SriLankanrupeeagainstthecurrenciesofmajor
trading partners together with the movements
in cross currency exchange rates, 5-currency
and 24-currency Nominal Effective Exchange
Rate (NEER) depreciated by 2.69 per cent and
1.09 per cent, respectively, at end September
2020, compared to end 2019. Meanwhile, the
Real Effective Exchange Rate (REER), which
takes into account inflation differentials in
addition to the variation in nominal exchange
rates, depreciated by 0.61 per cent based
on the 5-currency basket and appreciated by
1.10 per cent based on the 24-currency basket,
by end September, compared to end 2019.
Meanwhile, both REER indices remained below
thethresholdof100indexpointsbyendSeptember
2020, indicating the overall depreciation of REER,
compared to the base year level.
Figure 1.5
Gross Official Reserves and Exchange Rate
Source: Central Bank of Sri Lanka
Rs./U
S$
Jan-
20
Feb-
20
Mar-
20
Apr-
20
May-
20
Jun-
20
Jul- 2
0
Aug-
20
Sep-
20
Exchange Rate (Right Axis)Gross Official Reserves
0
2
4
6
8
10
175
180
185
190
195
200
US$ b
illion

1
8
CENTRAL BANK OF SRI LANKA | RECENT ECONOMIC DEVELOPMENTS: HIGHLIGHTS OF 2020 AND PROSPECTS FOR 2021
Fiscal Sector
y Fiscal policy measures in 2020 focused on
mitigating the impact of the COVID-19 outbreak,
amidst the delay in presenting the national
budget for 2020 caused by developments in
the political sphere. Fiscal operations during
January-April 2020 were planned under a
Vote-on-Account (VoA) approved in October
2019, in view of insufficient time for presenting an
annual budget following the presidential election
in November 2019. As the Parliament was
dissolved on 03 March 2020 prior to approving
an annual budget or a VoA, and the general
elections were delayed amidst the COVID-19
outbreak, expenditure on public services
was facilitated under the authorisation of His
Excellency the President from the Consolidated
Fund. Following the general elections in August
2020, the Parliament approved another VoA on
28 August 2020 for the last four months of the
year.2 Meanwhile, the Government initiated
several stimulus measures to support businesses
and individuals affected by the pandemic,
in addition to the already announced
measures following the Presidential elections
in November 2019 aimed at enhancing
disposable incomes and supporting the revival
of economic activity. Accordingly, major tax
revisions that were implemented since January
2020 included the reduction of personal and
standard corporate income tax rates, the
increase of the tax free threshold and tax
slabs of income tax, and the abolition of the
Pay-As-You-Earn (PAYE) tax, the Economic
ServiceCharge(ESC),andmostwithholdingtaxes
(WHT). Further, measures were taken to grant tax
exemptions on the importation of selected health
related equipment, while extending the payment
deadlines for WHT liable payments, stamp duty,
and VAT due for February and March 2020, until
2 TheAppropriationBill for the financial year 2020was gazetted on 06October2020. Accordingly, certain expenditure and advances made under Resolutions passed under Articles 150(2) and authorised under 150(3) of the Constitution are tobeincludedintheFirstSchedule,SecondScheduleandThirdSchedule,oftheAppropriation Act for 2020, while borrowings made in terms of Resolutions passed underArticles150(2)aretobeincludedunderSection2(1)(b)oftheAppropriationActfor2020.TheAppropriationBillforthefinancialyear2021wasalsogazettedon 06 October 2020.
30 April 2020. Meanwhile, exemptions were
granted on penalty payments for all taxes during
the lockdown period, and penalty provisions for
late payments commenced only in July 2020.
Furthermore, small and medium scale enterprises
(SMEs)weregrantedvarioustaxreliefmeasures
in the form of waivers of income tax arrears
on assessments issued up to the 2018/2019
assessment year, non issuance of additional
assessments for the year 2019/2020, provision
of a grace period to settle taxes in arrears, the
extension on seizure notices and provision of
extended timelines for tax payments and filing tax
returns. Meanwhile, the Government’s welfare
programmes continued to support the needy
segments of the society affected by COVID-19,
while taking measures to streamline the pension
payment process.
y The fiscal sector recorded subdued
performance during the seven months ending
July 2020, compared to the same period of
2019, reflecting the impact of the pandemic on
revenue and expenditure, and the settlement
of unpaid bills spilling over from the previous
year. During the seven months ending July 2020,
government revenue as a percentage of estimated
GDP moderated to 4.9 per cent from 6.9 per cent
of GDP in the corresponding period of 2019,
largely due to subdued economic activity following
the COVID-19 outbreak as well as reduced tax
rates. This decline in revenue mobilisation was
Revenue & Grants Expenditure & Net Lending
Figure 1.6
Government Revenue Vs. Expenditure (a)
Sources: Ministry of Finance Central Bank of Sri Lanka
(a) 2020 figures are based on the GDP projections of the Central Bank.
Perce
ntage
of G
DP
Jan-Jul(Prov)
(Prov) Jan-Jul(Prov)
0
5
10
15
20
25
2015 2016 2017 2018 2019 2019 2020
11
9
OVERVIEW
observed in major tax categories of income taxes,
excise duties, VAT, Nation Building Tax (NBT),
Ports and Airports Development Levy (PAL) and
CESS.However, non tax revenue increasedby
6.1 per cent to Rs. 92.8 billion during the period
under review, compared to the same period
of the previous year, mainly due to the transfer
of distributable profits of the Central Bank to
the Government amounting to Rs. 24.0 billion
based on the financial statements of 2019. On
the expenditure front, total expenditure and net
lending during the seven months ending July 2020
declined to 10.6 per cent of estimated GDP from
11.4 per cent of GDP in the corresponding
period of 2019, due to the sharp decline in
capital expenditure despite the rise in recurrent
expenditure. During the seven months ending
July 2020, recurrent expenditure as a percentage
of estimated GDP increased to 9.4 per cent from
8.9 per cent of GDP recorded in the same period
of 2019, mainly due to the increase in salaries
and wages, and subsidies and transfers. Capital
expenditure and net lending declined sharply, both
in nominal terms and as a percentage of estimated
GDP, during the period from January to July 2020,
reflecting the limited space available for capital
expenditure. Nevertheless, as the moderation
of government revenue outweighed the decline
in government expenditure, the overall budget
deficit increased to 5.6 per cent of estimated
GDP (Rs. 872.6 billion) during the seven months
ending July 2020, compared to 4.6 per cent of
GDP (Rs. 684.1 billion) in the corresponding
period of 2019. The settlement of outstanding
bills brought forward from 2019 added pressure
on fiscal operations and contributed to widen the
budget deficit during the period from January to
July 2020, compared to the year earlier. In the
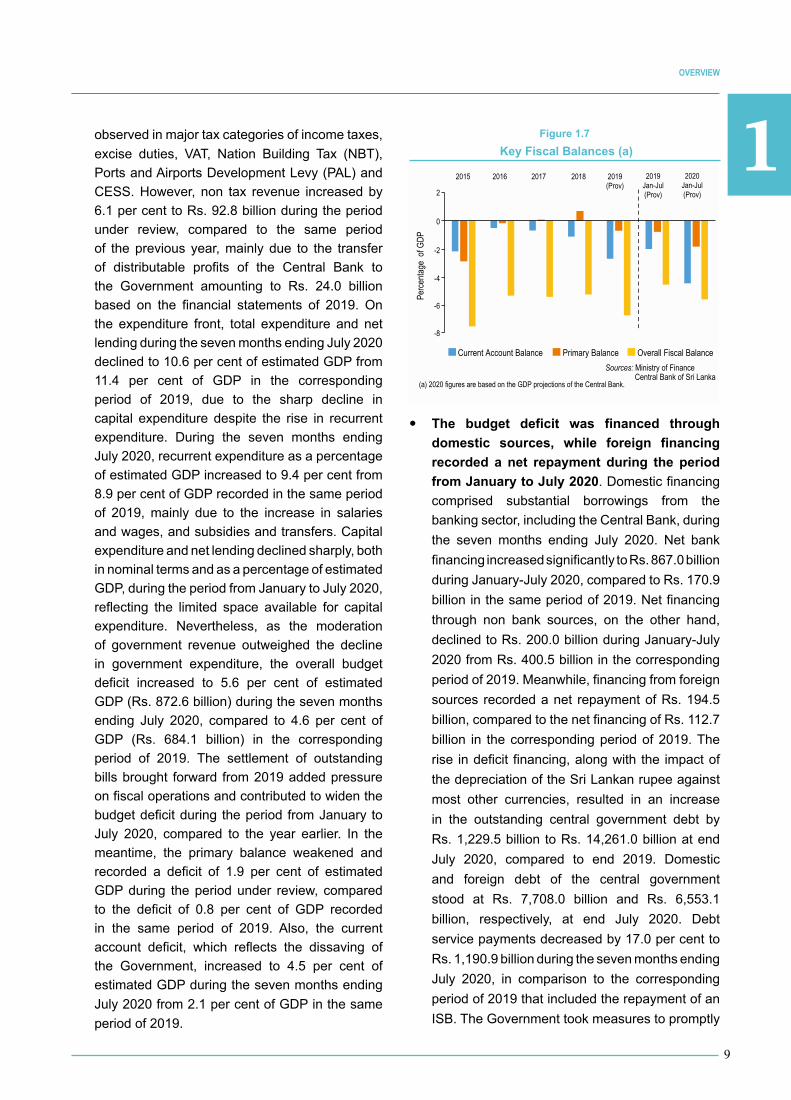
meantime, the primary balance weakened and
recorded a deficit of 1.9 per cent of estimated
GDP during the period under review, compared
to the deficit of 0.8 per cent of GDP recorded
in the same period of 2019. Also, the current
account deficit, which reflects the dissaving of
the Government, increased to 4.5 per cent of
estimated GDP during the seven months ending
July 2020 from 2.1 per cent of GDP in the same
period of 2019.
y The budget deficit was financed through
domestic sources, while foreign financing
recorded a net repayment during the period
from January to July 2020. Domestic financing
comprised substantial borrowings from the
banking sector, including the Central Bank, during
the seven months ending July 2020. Net bank
financing increased significantly to Rs. 867.0 billion
during January-July 2020, compared to Rs. 170.9
billion in the same period of 2019. Net financing
through non bank sources, on the other hand,
declined to Rs. 200.0 billion during January-July
2020 from Rs. 400.5 billion in the corresponding
period of 2019. Meanwhile, financing from foreign
sources recorded a net repayment of Rs. 194.5
billion, compared to the net financing of Rs. 112.7
billion in the corresponding period of 2019. The
rise in deficit financing, along with the impact of
thedepreciationoftheSriLankanrupeeagainst
most other currencies, resulted in an increase
in the outstanding central government debt by
Rs. 1,229.5 billion to Rs. 14,261.0 billion at end
July 2020, compared to end 2019. Domestic
and foreign debt of the central government
stood at Rs. 7,708.0 billion and Rs. 6,553.1
billion, respectively, at end July 2020. Debt
service payments decreased by 17.0 per cent to
Rs. 1,190.9 billion during the seven months ending
July 2020, in comparison to the corresponding
period of 2019 that included the repayment of an
ISB.TheGovernmenttookmeasurestopromptly
2018201720162015 2020Jan-Jul(Prov)
Current Account Balance Primary Balance Overall Fiscal Balance
Figure 1.7
Key Fiscal Balances (a)
Perce
ntage
of G
DP
Sources: Ministry of Finance Central Bank of Sri Lanka
2019(Prov)
2019Jan-Jul(Prov)
(a) 2020 figures are based on the GDP projections of the Central Bank.
2
0
-2
-4
-6
-8
1
10
CENTRAL BANK OF SRI LANKA | RECENT ECONOMIC DEVELOPMENTS: HIGHLIGHTS OF 2020 AND PROSPECTS FOR 2021
settleallmaturingobligations, including the ISB
that matured in October 2020, despite adverse
speculation and concerns raised by international
rating agencies,which downgradedSri Lanka’s
Sovereignratingin2020.
Monetary Sector
y With a view to minimising the economic
impact of the spread of COVID-19 and the
resultant containment measures, the Central
Bank eased monetary conditions substantially
and continued the accommodative monetary
policy stance thus far in 2020, supported
by muted inflationary pressures and well
anchored inflation expectations. The Central
Bank commenced an accommodative monetary
policy stance in 2019 aimed at reviving subdued
economic activity, given the modest level of
inflation. The outbreak of COVID-19 resulted in
a notable setback in economic activity, which
required substantial policy accommodation to
support businesses and households affected by
the pandemic and to ensure a speedy recovery.
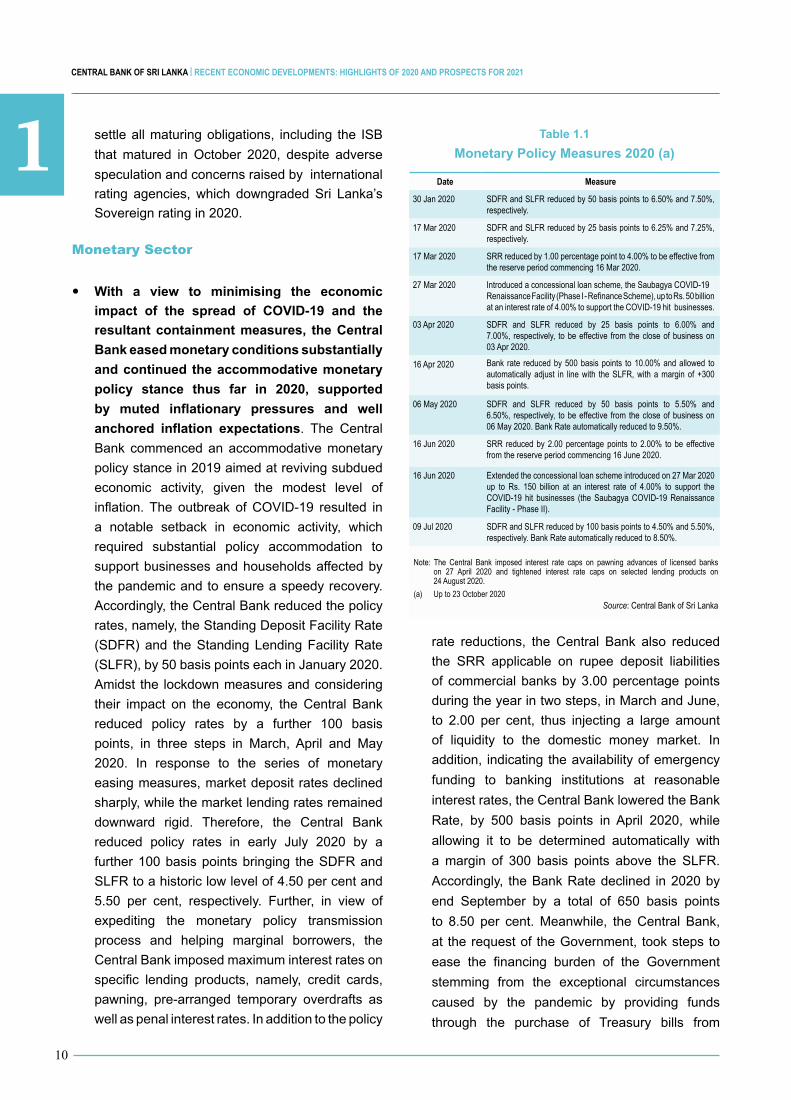
Accordingly, the Central Bank reduced the policy
rates,namely,theStandingDepositFacilityRate
(SDFR)and theStandingLendingFacilityRate
(SLFR),by50basispointseachinJanuary2020.
Amidst the lockdown measures and considering
their impact on the economy, the Central Bank
reduced policy rates by a further 100 basis
points, in three steps in March, April and May
2020. In response to the series of monetary
easing measures, market deposit rates declined
sharply, while the market lending rates remained
downward rigid. Therefore, the Central Bank
reduced policy rates in early July 2020 by a
further100basispointsbringing theSDFRand
SLFRtoahistoriclowlevelof4.50percentand
5.50 per cent, respectively. Further, in view of
expediting the monetary policy transmission
process and helping marginal borrowers, the
Central Bank imposed maximum interest rates on
specific lending products, namely, credit cards,
pawning, pre-arranged temporary overdrafts as
well as penal interest rates. In addition to the policy
rate reductions, the Central Bank also reduced
the SRR applicable on rupee deposit liabilities
of commercial banks by 3.00 percentage points
during the year in two steps, in March and June,
to 2.00 per cent, thus injecting a large amount
of liquidity to the domestic money market. In
addition, indicating the availability of emergency
funding to banking institutions at reasonable
interest rates, the Central Bank lowered the Bank
Rate, by 500 basis points in April 2020, while
allowing it to be determined automatically with
amargin of 300 basis points above the SLFR.
Accordingly, the Bank Rate declined in 2020 by
end September by a total of 650 basis points
to 8.50 per cent. Meanwhile, the Central Bank,
at the request of the Government, took steps to
ease the financing burden of the Government
stemming from the exceptional circumstances
caused by the pandemic by providing funds
through the purchase of Treasury bills from
Date Measure
30 Jan 2020 SDFR and SLFR reduced by 50 basis points to 6.50% and 7.50%, respectively.
17 Mar 2020 SDFR and SLFR reduced by 25 basis points to 6.25% and 7.25%, respectively.
17 Mar 2020 SRR reduced by 1.00 percentage point to 4.00% to be effective from the reserve period commencing 16 Mar 2020.
27 Mar 2020 Introduced a concessional loan scheme, the Saubagya COVID-19Renaissance Facility (Phase I - Refinance Scheme), up to Rs. 50 billion at an interest rate of 4.00% to support the COVID-19 hit businesses.
03 Apr 2020 SDFR and SLFR reduced by 25 basis points to 6.00% and 7.00%, respectively, to be effective from the close of business on 03 Apr 2020.
16 Apr 2020 Bank rate reduced by 500 basis points to 10.00% and allowed to automatically adjust in line with the SLFR, with a margin of +300 basis points.
06 May 2020 SDFR and SLFR reduced by 50 basis points to 5.50% and 6.50%, respectively, to be effective from the close of business on 06 May 2020. Bank Rate automatically reduced to 9.50%.
16 Jun 2020 SRR reduced by 2.00 percentage points to 2.00% to be effective from the reserve period commencing 16 June 2020.
16 Jun 2020 Extended the concessional loan scheme introduced on 27 Mar 2020 up to Rs. 150 billion at an interest rate of 4.00% to support the COVID-19 hit businesses (the Saubagya COVID-19 Renaissance Facility - Phase II).
09 Jul 2020 SDFR and SLFR reduced by 100 basis points to 4.50% and 5.50%, respectively. Bank Rate automatically reduced to 8.50%.
Table 1.1
Monetary Policy Measures 2020 (a)
Note: The Central Bank imposed interest rate caps on pawning advances of licensed banks on 27 April 2020 and tightened interest rate caps on selected lending products on 24 August 2020. (a) Up to 23 October 2020
Source: Central Bank of Sri Lanka
11
11
OVERVIEW
the primary market, thus far in 2020. Further,
following the provisions of the Monetary Law
Act (MLA), the Central Bank facilitated special
credit schemes to provide finance to the needy
sectors of the economy, particularly to SMEs,
at a concessional interest rate of 4.00 per cent
per annum. These monetary measures were
taken by the Central Bank while maintaining
inflation and anchoring inflation expectations
in the range of 4-6 per cent, under its flexible
inflation targeting framework.
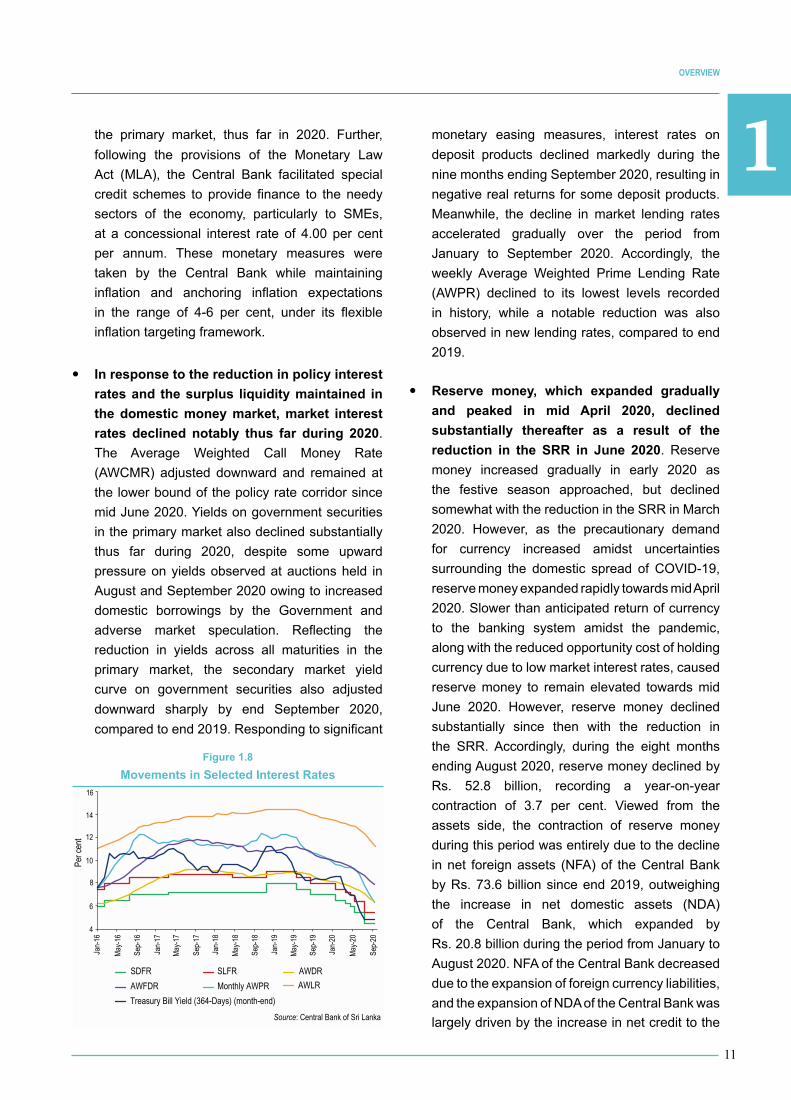
y In response to the reduction in policy interest
rates and the surplus liquidity maintained in
the domestic money market, market interest
rates declined notably thus far during 2020.
The Average Weighted Call Money Rate
(AWCMR) adjusted downward and remained at
the lower bound of the policy rate corridor since
mid June 2020. Yields on government securities
in the primary market also declined substantially
thus far during 2020, despite some upward
pressure on yields observed at auctions held in
AugustandSeptember2020owingtoincreased
domestic borrowings by the Government and
adverse market speculation. Reflecting the
reduction in yields across all maturities in the
primary market, the secondary market yield
curve on government securities also adjusted
downward sharply by end September 2020,
compared to end 2019. Responding to significant
monetary easing measures, interest rates on
deposit products declined markedly during the
nine months endingSeptember2020,resultingin
negative real returns for some deposit products.
Meanwhile, the decline in market lending rates
accelerated gradually over the period from
January to September 2020. Accordingly, the
weekly Average Weighted Prime Lending Rate
(AWPR) declined to its lowest levels recorded
in history, while a notable reduction was also
observed in new lending rates, compared to end
2019.
y Reserve money, which expanded gradually
and peaked in mid April 2020, declined
substantially thereafter as a result of the
reduction in the SRR in June 2020. Reserve
money increased gradually in early 2020 as
the festive season approached, but declined
somewhatwiththereductionintheSRRinMarch
2020. However, as the precautionary demand
for currency increased amidst uncertainties
surrounding the domestic spread of COVID-19,
reserve money expanded rapidly towards mid April
2020.Slowerthananticipatedreturnofcurrency
to the banking system amidst the pandemic,
along with the reduced opportunity cost of holding
currency due to low market interest rates, caused
reserve money to remain elevated towards mid
June 2020. However, reserve money declined
substantially since then with the reduction in
the SRR. Accordingly, during the eight months
ending August 2020, reserve money declined by
Rs. 52.8 billion, recording a year-on-year
contraction of 3.7 per cent. Viewed from the
assets side, the contraction of reserve money
during this period was entirely due to the decline
in net foreign assets (NFA) of the Central Bank
by Rs. 73.6 billion since end 2019, outweighing
the increase in net domestic assets (NDA)
of the Central Bank, which expanded by
Rs. 20.8 billion during the period from January to
August 2020. NFA of the Central Bank decreased
due to the expansion of foreign currency liabilities,
and the expansion of NDA of the Central Bank was
largely driven by the increase in net credit to the
4
6
8
10
12
14
16
Figure 1.8
Movements in Selected Interest Rates
Sep-
20
Per c
ent
SLFR AWDRAWFDRTreasury Bill Yield (364-Days) (month-end)
AWLRSDFR
Monthly AWPR
Sep-
16
May-1
8
Jan-
17
Sep-
18
May-1
7
Jan-
19
Jan-
20
Jan-
16
Sep-
17
May-1
9
May-2
0
May-1
6
Jan-
18
Sep-
19
Source: Central Bank of Sri Lanka
1
12
CENTRAL BANK OF SRI LANKA | RECENT ECONOMIC DEVELOPMENTS: HIGHLIGHTS OF 2020 AND PROSPECTS FOR 2021
government (NCG), while claims on commercial
banks also increased with the disbursement of
concessionalcreditviatheSaubagyaCOVID-19
Renaissance Facility implemented amidst the
pandemic.
y Growth of broad money (M2b
) continued to
accelerate during the eight months ending
August 2020 driven by the growth of NDA of
the banking system, mainly due to the notable
expansion of credit to the public sector.
Accordingly, the year-on-year growth of M2b
accelerated to 17.5 per cent by end August 2020,
compared to the growth of 7.0 per cent at end
2019. The increase in NDA of the banking system
by Rs. 1,164.5 billion contributed to the overall
monetary expansion during the period from
January to August 2020, while NFA of the banking
system contracted by Rs. 96.6 billion during the
period under review. The significant expansion of
NDA during the period under review was driven
by the increase in NCG as well as credit to the
State Owned Business Enterprises (SOBEs)
by the banking system. NCG by the banking
system increased substantially by Rs. 1,014.1
billion during the period from January to August
2020, compared to the increase of Rs. 235.3
billion during the same period of the previous
year. The increased reliance of the Government
on domestic financing amidst limited foreign
financial flows and the shortfall in government
revenue collection caused this unprecedented
rise in NCG during the period from January to
August 2020. Reflecting the deteriorated financial
positionsofmostSOBEs,whichwereaggravated
by the pandemic, credit extended to SOBEs
by the banking system increased by Rs. 205.0
billion during the period from January to August
2020, compared to the net repayment of Rs. 8.5
billion during the same period of the previous
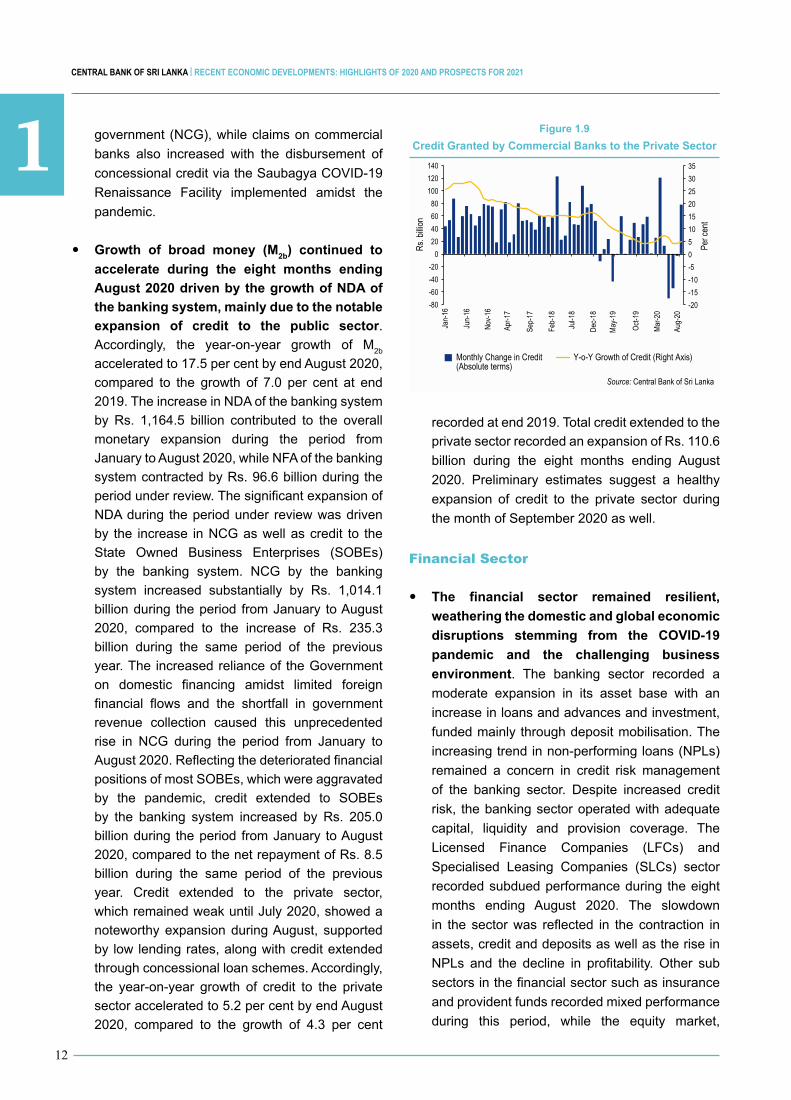
year. Credit extended to the private sector,
which remained weak until July 2020, showed a
noteworthy expansion during August, supported
by low lending rates, along with credit extended
through concessional loan schemes. Accordingly,
the year-on-year growth of credit to the private
sector accelerated to 5.2 per cent by end August
2020, compared to the growth of 4.3 per cent
recorded at end 2019. Total credit extended to the
private sector recorded an expansion of Rs. 110.6
billion during the eight months ending August
2020. Preliminary estimates suggest a healthy
expansion of credit to the private sector during
themonthofSeptember2020aswell.
Financial Sector
y The financial sector remained resilient,
weathering the domestic and global economic
disruptions stemming from the COVID-19
pandemic and the challenging business
environment. The banking sector recorded a
moderate expansion in its asset base with an
increase in loans and advances and investment,
funded mainly through deposit mobilisation. The
increasing trend in non-performing loans (NPLs)
remained a concern in credit risk management
of the banking sector. Despite increased credit
risk, the banking sector operated with adequate
capital, liquidity and provision coverage. The
Licensed Finance Companies (LFCs) and
Specialised Leasing Companies (SLCs) sector
recorded subdued performance during the eight
months ending August 2020. The slowdown
in the sector was reflected in the contraction in
assets, credit and deposits as well as the rise in
NPLs and the decline in profitability. Other sub
sectors in the financial sector such as insurance
and provident funds recorded mixed performance
during this period, while the equity market,
Nov-1
6
Dec-1
8
Apr-1
7
May-1
9
Sep-
17
Oct-1
9
Jan-
16
Feb-
18
Mar-2
0
Jun-
16
Jul-1
8
Aug-
20
Figure 1.9
Credit Granted by Commercial Banks to the Private Sector
Per c
ent
Rs. b
illion
Monthly Change in Credit (Absolute terms)
Y-o-Y Growth of Credit (Right Axis)
Source: Central Bank of Sri Lanka
-20-15-10-505101520253035
-80-60-40-20
020406080
100120140
11
13
OVERVIEW
which was adversely affected by the COVID-19
outbreak, showed signs of recovery since May
2020. Meanwhile, uninterrupted operations were
ensured in the payment and settlement systems
even during the COVID-19 related lockdown,
thereby facilitating the carrying out of transactions
in the economy.
International Economic Environment
y The global economy and financial markets
witnessed heightened uncertainties amidst
the COVID-19 pandemic, causing a sharp
contraction in global activity thus far in 2020.
The World Economic Outlook (WEO) of the
International Monetary Fund (IMF) released in
October 2020, projects the global economy to
contract by 4.4 per cent in 2020, compared to a
growth of 2.8 per cent in 2019. Global growth is
projected to rebound to 5.2 per cent in 2021 and
moderate thereafter.
y Unprecedented levels of spending by
governments and monetary easing by central
banks globally helped support the income
and employment in major economies and
dampen the contraction during 2020. Activity
picked up in May and June 2020 as economies
gradually reopened, while large scale policy
stimulus helped economies to revive the
affected businesses and individuals to a great
extent. IntheUnitedStates,GDPcontractedby
31.4 per cent in the second quarter of
2020, year-on-year, following a contraction of
5.0 per cent in the first quarter of 2020. The
United Kingdom recorded a contraction of
2.5 per cent in the first quarter of 2020 over the
same period of the previous year, followed by a
19.8 per cent contraction in the second quarter
of 2020. In the Euro area, the economy
contracted by 11.8 per cent in the second quarter
of 2020, year-on-year, following a contraction of
3.7 per cent in the first quarter of 2020.
On a positive note, China recovered from
the contraction in the first quarter of 2020,
year-on-year, as the impact of COVID-19 faded
away and the economy recorded a modest growth
of 3.2 per cent in the second quarter of 2020,
compared to the contraction of 6.8 per cent in the
first quarter of 2020. Meanwhile, the momentum
of the Chinese economy gathered pace in the
third quarter of 2020 registering a GDP growth of
4.9 per cent, from a year earlier. India’s economic
growth slipped from a growth of 3.1 per cent in
the first quarter of 2020, year-on-year, to a steep
contraction of 23.9 per cent in the second quarter
of 2020, reflecting the rapid spread of COVID-19
in India. Almost all emerging market economies
recorded sharp declines in economic activity
during the first half of the year, over the same
period of the previous year.
y Despite some signs of a rebound of the global
economy, the recovery is expected to be long,
uncertain and uneven among economies.
Accordingly, advanced economies are projected
to contract by 5.8 per cent in 2020, followed by a
growth of 3.9 per cent in 2021. Emerging market
and developing economies, including China, are
expected to contract by 3.3 per cent in 2020,
while a strong growth of 6.0 per cent is projected
for 2021. As the only major economy to record
a growth in 2020, prospects for China remained
strong with the economy projected to grow by
1.9 per cent in 2020, followed by a growth of
8.2 per cent in 2021. India’s economy is projected
to contract by 10.3 per cent in 2020, followed by a
growth of 8.8 per cent in 2021.
y Broad based policy support globally helped
the world economy to revive activity to
some extent thus far. Advanced economies
responded with discretionary revenue and
spending measures as well as various forms
of liquidity support, including equity injections,
asset purchases, loans and credit guarantees.
Emerging market and developing economies
also responded with sizable discretionary
budgetary measures amidst limited policy space
in certain economies. Meanwhile, new policy
initiatives in various parts of the world also
helped lift the sentiments among stakeholders.

1
14
CENTRAL BANK OF SRI LANKA | RECENT ECONOMIC DEVELOPMENTS: HIGHLIGHTS OF 2020 AND PROSPECTS FOR 2021
For instance, the European Union initiated a
pandemic recovery package fund, and most other
countries provided cash and in-kind transfers to
affected firms and households, wage subsidies,
expanded unemployment insurance coverage,
tax deferrals, etc. The actions of central banks
in advanced economies included more diverse,
large scale asset purchases and refinancing
facilities in addition to sweeping policy rate
reductions.TheUSFederalReserveannounced
changes to its monetary policy strategy, moving
to a flexible average inflation target of 2 per cent
over time, while providing forward guidance
on the maintenance of low interest rates. The
responses of central banks in emerging market
economies mainly comprised interest rate cuts,
new relending facilities and asset purchases.
Responding to these policy measures, global
economic and financial conditions showed some
improvement since June 2020. However, risks
appear to have re-emerged due to the second
wave of COVID-19 globally in recent months.
y Global inflation remained moderate due to
subdued aggregate demand conditions, in
spite of price pressures stemming from supply
disruptions due to the pandemic. Inflation
in advanced economies continued to remain
below pre-pandemic levels. Meanwhile, inflation
in emerging market and developing economies
declined sharply as the pandemic spread
rapidly. However, some countries witnessed
an acceleration of inflation reflecting supply
disruptions that caused an escalation of food
prices. Consumer price inflation in the advanced
economy group is projected at 0.8 per cent in
2020, before rising to 1.6 per cent in 2021. In the
group of emerging market and developing
economies, inflation is projected at 5.0 per cent in
2020 and 4.7 per cent in 2021. In global commodity
markets, gold was continued to be viewed as a
safe haven asset in the face of the COVID-19
pandemic. Accordingly, international gold prices
increased during the year and crossed the level of
USdollars2,000perounce in the firstweekof
August 2020, and declined thereafter to remain
aroundUSdollars1,898perouncebymidOctober
2020. Prices of crude oil, which plummeted
amidst the drastic decline in demand following
lockdowns and travel restrictions, demonstrated
a gradual increase since May 2020. Brent crude
oilprices,whichfelltoaroundUSdollars13.0per
barrel by late April 2020, gradually rose thereafter
toreachUSdollars46.1perbarrelbyendAugust
2020, primarily due to limited stocks of crude oil
as well as the expansion of activity in the United
States and China. However, crude oil prices
declined toaboutUSdollars43.4perbarrel by
mid October 2020. As per the October 2020 issue
of the WEO, average petroleum prices per barrel
areprojectedatUSdollars41.7in2020andUS
dollars 46.7 in 2021.
y The impact of the pandemic on vulnerable
groups of the society is expected to be
significantly high, resulting in a rise in
poverty and inequality globally, thereby
reversing some of the gains achieved over the
past several decades. Inequality is expected
to rise due to the disproportionate impact of the
crisis on various segments such as women, the
informally employed, young workers, and those
with relatively low educational attainment. People
who rely on daily wages and those who fall
outside the formal safety net, including migrant
workers, faced sudden income losses due to
the imposition of mobility restrictions. Further,
the burden of the crisis befell unevenly across
regions as well as nations. In some advanced
economies, working from home arrangements
were swiftly put in place, or people relied on
personal savings or social security benefits. In
low income economies, where adaptability was
relatively slow, people often faced difficulties
in withstanding the unexpected loss of income.
This underscored the importance of international
support for low income economies in facing the
pandemic.
y The uncertainty surrounding the evolution
of the pandemic will continue to affect the
assessments on the global economic outlook.
11
15
OVERVIEW
The current projections are based on public health
and economic factors that are inherently difficult to
predict. Further, the extent of global spillovers from
low aggregate demand, subdued tourism, and
low remittances also remains uncertain, let alone
heightened uncertainties in the global financial
markets. Moreover, a prolonged second wave
of COVID-19 infections could reduce economic
activity by more than expected in the latest round
of projections by multilateral agencies. As a result
of cross border spillovers from weak external
demand and tight financial conditions, there could
be significant adverse effects on global growth.
The extended economic slowdown and volatile
global financial market conditions, if persisted,
could have a strong bearing on debt dynamics
and debt sustainability of some emerging market
and developing economies. Nevertheless, upside
risks to economic recovery cannot also be ruled
out due to the ongoing efforts to finalise a vaccine
for COVID-19 and the continuation of large scale
policy support globally.
Expected Developments
y The Sri Lankan economy is expected to
rebound in 2021 as evidenced by the fast
recovery of activity since the relaxation of the
lockdown in May 2020, although a resurgence
of COVID-19 cases, as observed in October,
could affect the momentum to some extent.
The large scale policy support provided by the
Central Bank and the Government is expected to
facilitate a fast recovery of economic activity in the
near term, while growth oriented policies of the
Government are expected to sustain the recovery
over the medium term. In 2020, the economy is
projected to contract by 1.7 per cent reflecting the
impact of the pandemic induced fallout, particularly
in the second quarter of the year. The lagged
effect of extensive fiscal and monetary policy
stimuli provided thus far, along with improved
investor confidence due to the restoration of
political stability and the implementation of the
growth oriented policy agenda of the Government
would support sustainable and equitable growth
in the period ahead. In spite of disruptions to
economic activity in the near term, the pandemic
also created a window of opportunity for the
Government to introduce pro-growth policies with
increased emphasis on domestic agricultural and
industrial production. The essential infrastructure
development projects are expected to be
implemented with the unveiling of the national
budget for 2021, thereby increasing regional
connectivity and the productive capacity of the
economy. Education and skill development
policies are also being reoriented towards a
knowledge based growth promotion strategy.
Despite the adverse impact of the pandemic on
the vulnerable groups of the society in the near
term, inclusive growth policies of the Government
are expected to better target the marginalised
segments of the society, while providing near
term support with the assistance of the existing
welfare programmes.
y Despite the heightened vulnerabilities amidst
the COVID-19 pandemic, Sri Lanka’s external
sector is expected to show resilience over
the medium term with appropriate policies
implemented without delay. With the recovery
in global demand and the policy drive to improve
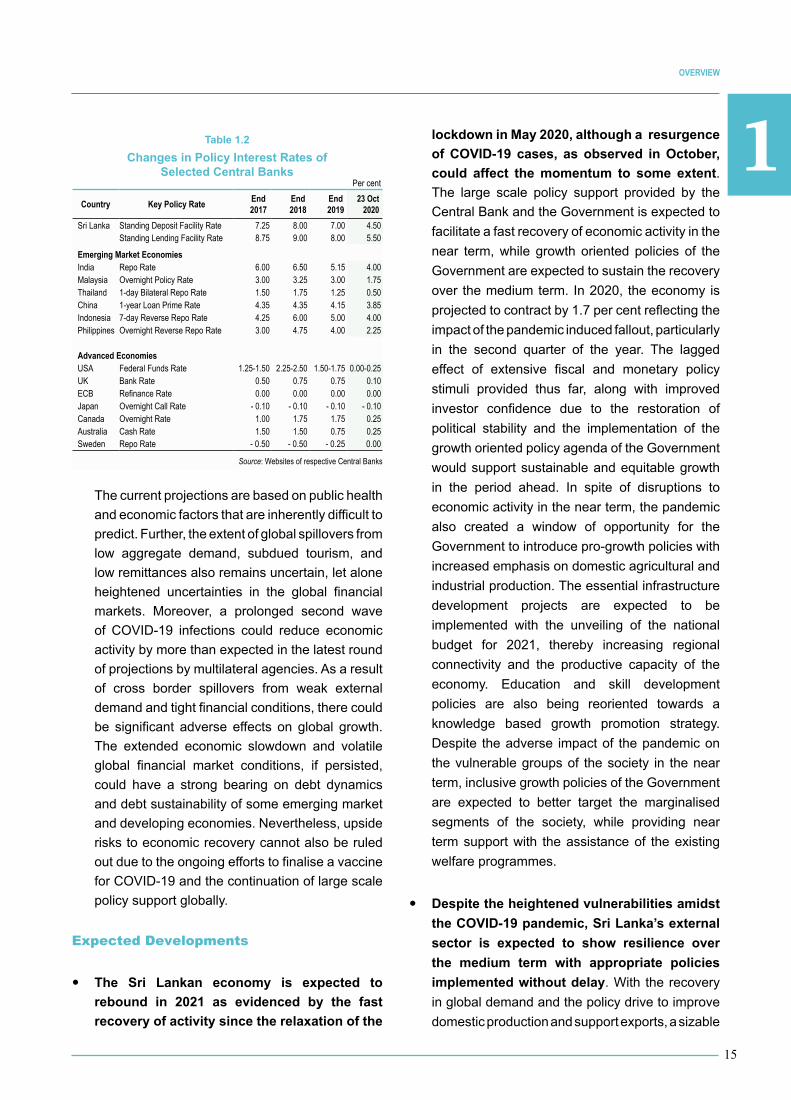
domesticproductionandsupportexports,asizable
Country Key Policy Rate End 2017
End 2018
End 2019
23 Oct2020
Sri Lanka Standing Deposit Facility Rate 7.25 8.00 7.00 4.50Standing Lending Facility Rate 8.75 9.00 8.00 5.50
Emerging Market EconomiesIndia Repo Rate 6.00 6.50 5.15 4.00Malaysia Overnight Policy Rate 3.00 3.25 3.00 1.75Thailand 1-day Bilateral Repo Rate 1.50 1.75 1.25 0.50China 1-year Loan Prime Rate 4.35 4.35 4.15 3.85Indonesia 7-day Reverse Repo Rate 4.25 6.00 5.00 4.00Philippines Overnight Reverse Repo Rate 3.00 4.75 4.00 2.25
Advanced EconomiesUSA Federal Funds Rate 1.25-1.50 2.25-2.50 1.50-1.75 0.00-0.25UK Bank Rate 0.50 0.75 0.75 0.10ECB Refinance Rate 0.00 0.00 0.00 0.00Japan Overnight Call Rate - 0.10 - 0.10 - 0.10 - 0.10Canada Overnight Rate 1.00 1.75 1.75 0.25Australia Cash Rate 1.50 1.50 0.75 0.25Sweden Repo Rate - 0.50 - 0.50 - 0.25 0.00
Source: Websites of respective Central Banks
Per cent
Table 1.2
Changes in Policy Interest Rates of Selected Central Banks

1
16
CENTRAL BANK OF SRI LANKA | RECENT ECONOMIC DEVELOPMENTS: HIGHLIGHTS OF 2020 AND PROSPECTS FOR 2021
increase in earnings from exports is envisaged
in the medium term. Expenditure on imports
could rise in 2021, compared to substantially low
levels in 2020. The normalisation of oil prices
and the rise in demand for intermediate and
investment goods due to the expected expansion
of domestic production and exports, are expected
to influence the level of expenditure on imports in
the period ahead. Accordingly, the trade deficit,
which is expected to decline substantially in
2020, is projected to improve over the medium
term after an initial adjustment in 2021. Despite
the setback in the tourism industry, the surplus
in the services account is expected to improve
steadily over the medium term, supported by the
envisaged recovery of the tourism industry as the
pandemic fears fade away in the period ahead.
Moreover, the growth in transport services and
IT/BPO, is also expected to support the expected
improvement in services exports. Meanwhile,
workers’ remittances are projected to grow, albeit
slowly, over the medium term. Consequently,
the external current account deficit, which is
expected to narrow to 1.5 per cent of GDP in
2020, is projected to increase to 2.4 per cent
of GDP in 2021 and decline gradually to
1.2 per cent of GDP by 2025. The moderation of
financial flows amidst the COVID-19 pandemic
is expected to affect the financial account of the
BOP in the near term. However, with positive
investor sentiments following the restoration of
political stability and the expected recovery in
the global economy, an increase in FDI inflows
and foreign investment to the CSE and the
government securities market is expected over
the medium term. Foreign investment flows are
expected, particularly on account of the Colombo
Port City and the Hambantota Industrial Zone
project. The Central Bank is expected to maintain
adequate levels of foreign reserves over the
medium term, while maintaining a flexible and
competitive exchange rate. The Government is
expected to take appropriate measures to ensure
the sustainability of Sri Lanka’s external debt,
through short term measures to secure adequate
financing and through longer term reforms to
ensure a sustained increase in merchandise
and services exports, while enhancing non debt
creating inflows in the form of FDI.
y Following the inevitable expansion in the fiscal
deficit and debt levels in 2020, performance of
the fiscal sector is projected to improve over
the medium term, supported by the envisaged
recovery of economic activity. The medium term
fiscal strategy of the Government, which is to be
announced with the presentation of the national
budget in mid November 2020, is expected
to include measures to strengthen the fiscal
consolidation path through tax policy reforms,
further rationalising recurrent expenditure, and
improving the efficiency of capital expenditure.
Meanwhile, measures to promote domestic
production in several earmarked areas and to
improve the performance of the SOBEs are
expected to support activity, while providing more
avenues of revenue for the Government in the
period ahead. As enunciated in the national policy
framework,“VistasofProsperityandSplendour”,
the Government is expected to achieve a budget
deficit of 4.0 per cent of GDP by 2025, along
with corresponding improvements in the current
account and primary balances. The envisaged
reduction of the budget deficit and the resulting
moderation in deficit financing are expected to
reduce the outstanding central government debt
with greater reliance on domestic financing, and
ensure sustainability of the public debt over the
medium term.
y Credit flows to the private sector are expected
to accelerate in the period ahead. As a result
of the substantial monetary easing measures
implemented in 2020, market lending rates
reduced to significantly low levels. With the
envisaged revival of economic activity in the
ensuing period along with improved business
confidence, the growth of credit flows to the
private sector is expected to accelerate in the
near term and stabilise thereafter. The large
volumes of credit obtained by the public sector

11
17
OVERVIEW
are expected to cause the growth of broad money
(M2b
) to accelerate in the near term. The growth
of broad money is projected to stabilise at around
12.5 per cent in the medium term mainly driven
by the expansion in credit extended to the private
sector.
y Inflation is expected to be maintained within
the desired range of 4-6 per cent over the
medium term. Headline inflation, as measured
by the year-on-year change in the Colombo
Consumer Price Index (CCPI), is envisaged to
be maintained broadly around mid single digit
levels in the period ahead. Inflation could reach
the upper level of this range in 2022 and 2023
with the expected rebound in aggregate demand,
reflecting the lagged impact of the fiscal and
monetary stimuli and expected normalisation
of petroleum prices globally. On the supply
side, the Government’s efforts to achieve
self-sufficiency in certain agricultural products
are expected to stabilise domestic food inflation
in the period ahead. The Central Bank stands
ready to implement appropriate policy measures
to arrest any build up of unwarranted inflationary
pressures arising from the demand side, while
the Government’s commitment to addressing
transitory supply side pressures and managing
the fiscal balances along the envisaged path
also remains crucial in ensuring low and stable
inflation and sustained economic growth over the
medium term.
Indicator Unit 2018 (b) 2019 (c)Projections (d)
2020 2021 2022 2023 2024 2025
Real Sector Real GDP Growth % 3.3 (c) 2.3 - 1.7 5.0 4.5 6.0 6.5 7.0GDP at Current Market Price Rs. bn 14,366 (c) 15,016 15,462 17,054 18,864 21,205 23,822 26,773Per Capita GDP US$ 4,079 (c) (e) 3,852 3,825 4,068 4,340 4,706 5,100 5,529Total Investment % of GDP 30.4 (c) (f) 27.4 26.9 27.3 27.8 28.1 28.4 28.7Domestic Savings % of GDP 23.0 (c) (f) 21.3 21.4 21.5 22.5 23.9 24.9 25.7National Savings % of GDP 27.3 (c) (f) 25.3 25.4 24.9 25.5 26.3 27.1 27.5
External SectorTrade Gap % of GDP -11.7 - 9.5 - 6.6 - 8.2 - 8.8 - 8.2 - 7.9 - 7.5 Exports US$ mn 11,890 11,940 10,245 12,404 13,682 15,124 17,022 18,559 Imports US$ mn 22,233 19,937 15,800 19,733 22,154 23,814 26,066 28,002 Current Account Balance % of GDP - 3.2 - 2.2 - 1.5 - 2.4 - 2.3 - 1.8 - 1.3 - 1.2External Official Reserves Months of Imports 3.7 4.6 4.8 3.7 3.8 3.9 4.0 4.0
Fiscal Sector Total Revenue and Grants % of GDP 13.5 (g) 12.6 9.7 10.6 11.2 11.8 12.4 13.1Expenditure and Net Lending % of GDP 18.7 (g) 19.4 18.9 18.4 18.3 17.8 17.6 17.1Current Account Balance % of GDP -1.2 (g) - 2.7 - 6.3 - 4.8 - 4.0 - 2.6 - 1.7 - 0.5Primary Balance % of GDP 0.6 (g) - 0.8 - 3.2 - 2.0 - 1.5 - 0.7 - 0.2 0.6Overall Fiscal Balance % of GDP - 5.3 (g) - 6.8 - 9.3 - 7.8 - 7.1 - 6.0 - 5.2 - 4.0Central Government Debt % of GDP 83.7 (g) 86.8 93.0 92.4 90.0 86.1 82.3 77.5
Monetary Sector and InflationBroad Money Growth (M2b) (h) % 13.0 7.0 20.6 15.0 12.5 12.5 12.5 12.5Private Sector Credit Growth (M2b) (h) % 15.9 4.3 6.0 13.9 12.5 12.0 12.0 12.0Annual Average Inflation (i) % 4.3 4.3 4.7 5.0 5.8 6.0 5.5 5.0
Table 1.3
Medium Term Macroeconomic Framework (a)
(a) Based on information available up to mid October 2020 (b) Revised (c) Provisional (d) Central Bank projections(e) Estimates are updated with the latest population figures.(f) Total investment, domestic savings and national savings as a % of GDP in 2018 were revised by the Department of Census and Statistics from 28.6%, 21.2% and 25.4%, respectively. (g) Based on the revised GDP estimates for 2018 released on 31 March 2020 by the Department of Census and Statistics(h) Year-on-year growth based on end year values (i) Based on CCPI (2013=100)
Sources : Ministry of Finance Department of Census and Statistics Central Bank of Sri Lanka

1
18
CENTRAL BANK OF SRI LANKA | RECENT ECONOMIC DEVELOPMENTS: HIGHLIGHTS OF 2020 AND PROSPECTS FOR 2021
y The achievement of the projected medium
term macroeconomic path is contingent
upon implementing the identified reforms in
the period ahead. Along with the establishment
of a stable Government, the COVID-19
outbreak has created an opportunity to review
macroeconomic policies and set appropriate
policy priorities and long term development
goals for the country. In this regard, the
Government’s drive to support and encourage
domestic production to reach self-sufficiency in
identified goods is likely to play a crucial role in
Sri Lanka’s economic transformation. However,
the maintenance of quality standards of
domestically produced goods and ensuring
availability at a reasonable price are vital to derive
intended benefits in the medium to long term.
Adequate investment in innovation and research
and development (R&D), and the promotion
of export oriented FDI are needed to improve
efficiency and enhance productivity, particularly
in the SME sector. As envisaged high growth
necessitates improved access to international
markets, trade negotiations with existing
and new partner economies must continue.
Reforms in relation to labour, land and financial
markets are also essential. The prevailing
low inflation environment must be preserved,
with timely, appropriate, and transparent
policies, thereby facilitating informed decision
making of businesses and households. Beyond
the near term economic hardships caused by
the pandemic, long term growth and
macroeconomic stability remain key priorities
thatSriLankamustbalanceinitsmarchtowards
shared prosperity.