Embed Size (px)
Citation preview
OVERVIEW
8 MAY 2012

© Commonwealth of Australia 2012
ISBN 978-0-642-74806-5
This publication is available for your use under a Creative Commons BY Attribution 3.0 Australia licence, with the exception of the Commonwealth Coat of Arms, third party content, diagram on page 27 and where otherwise stated. The full licence terms are available from http://creativecommons.org/licenses/by/3.0/au/legalcode.
Use of Treasury material under a Creative Commons BY Attribution 3.0 Australia licence requires you to attribute the work (but not in any way that suggests that the Treasury endorses you or your use of the work).
Treasury material used ‘as supplied’Provided you have not modified or transformed Treasury material in any way including, for example, by changing the Treasury text; calculating percentage changes; graphing or charting data; or deriving new statistics from published Treasury statistics — then Treasury prefers the following attribution:
Source: The Treasury
Derivative materialIf you have modified or transformed Treasury material, or derived new material from those of the Treasury in any way, then Treasury prefers the following attribution:
Based on Treasury data
Use of the Coat of ArmsThe terms under which the Coat of Arms can be used are set out on the It’s an Honour website (see www.itsanhonour.gov.au)
Other UsesInquiries regarding this licence and any other use of this document are welcome at:
Manager Communications The Treasury Langton Crescent Parkes ACT 2600
Email: [email protected]
InternetA copy of this document is available on the central Budget website at: www.budget.gov.au.
Printed by CanPrint Communications Pty Ltd

Budget at a glance 1
Returning to surplus is important 2
Sending a strong message of confidence 3
One of the world’s strongest economies 4
The resources boom and the Asian Century 5
Spreading the benefits of the boom 6
Helping households with the cost of living 7
Helping parents with the cost of school 8
Improving living standards in retirement 9
Historic step to a National Disability Insurance Scheme 10
A new way of delivering disability care and support 11
Supporting businesses to invest and compete 12
Additional support for small business 13
Strengthening Australian industry 14
Building our nation’s infrastructure 15
Moving to a clean energy future 16
Conserving Australia’s iconic environment 17
Better dental services for those in need 18
Living Longer. Living Better: aged care reform 19
Better health services for all Australians 20
Investing in regional hospitals and health care 21
Expanding access to high quality training 22
Reducing barriers to work 23
Expanding opportunity for all students 24
Delivering excellence in education 25
Stronger Futures in the Northern Territory 26
Continuing efforts to Close the Gap 27
Advancing our national security interests 28
Investing in Defence priority capabilities 29
Engaging with our region and beyond 30
Strategic investment in border security 31
Commemorating the Centenary of Anzac 32
Investing in our future sporting champions 33
Targeted spending cuts 34
A better and fairer tax system 35
Appendix A Australian Government budget aggregates 36
Appendix B Assessment against the fiscal target 37
Appendix C Helping households with the cost of living 38
Appendix D Lowering the tax burdens of Australians 39
Appendix E Major initiatives in the 2012-13 Budget 40
Appendix F Major savings in the 2012-13 Budget 41
Appendix G Australian Government taxation and spending 42
Appendix H Detailed economic forecasts 43
Appendix I Historical budget and net financial worth data 44
CONTENTS

KEY INITIATIVES OF THE 2012-13 BUDGETReturning the budget to surplus on time and as promised• Despite significant revenue losses since the GFC, we are returning the budget to surplus in 2012-13, while
ensuring families and businesses are sharing in the benefits of the resources boom
• A surplus is appropriate given our strong economic fundamentals and an economy returning to trend growth
• It is our best defence in uncertain times and allows monetary policy to respond to economic developments
Spreading the benefits of the boom• $1.8 billion to increase Family Tax Benefit Part A for all eligible families, commencing 1 July 2013
• $1.1 billion for a new Supplementary Allowance for the unemployed, students and parents with young children, on income support, with the first payment commencing March 2013
• In addition, an extra $2.1 billion over five years on a new Schoolkids Bonus, paid directly to eligible recipients
• From 1 July 2012, more than tripling the tax-free threshold from $6,000 to $18,200, freeing up to 1 million Australians from the need to lodge a tax return
First steps towards a National Disability Insurance Scheme• $1 billion over four years for the first stage of a National Disability Insurance Scheme
• 10,000 participants will start being assessed from July 2013, increasing to 20,000 participants from mid-2014
Helping business to invest• Allowing companies to carry-back tax losses so they get a refund against tax paid in the previous year in
2012-13, increasing to two years from 2013-14, providing a tax benefit of up to $300,000 per year
• From 1 July 2012, delivering tax breaks for small business, like the increase to the instant asset write-off threshold to $6,500
Investing in key health services• $515.3 million to improve dental services and strengthen the future dental workforce
• Delivering 76 major new regional health infrastructure projects across Australia, worth $475 million
• Investing $61 billion in 2012-13 in Australia’s health care system, an estimated 37 per cent increase on 2007-08 levels
• An additional $19.8 billion in reforms to public hospital funding over the period to 2019-20
Building an aged care system for the future• A $3.7 billion package to ensure a better, fairer, more sustainable and nationally consistent aged care system
• Increasing the number of Home Care packages by nearly 40,000, to nearly 100,000, over the next five years
Building a more productive workforce• $1.75 billion National Partnership Agreement on Skills Reform as agreed at COAG in April this year
• Investing an additional $225.1 million in Jobs, Education and Training Child Care Fee Assistance
• An additional $101 million of new skills measures to improve quality and better support mature age workers
Building productivity by investing in nation building infrastructure • Investing over $36 billion in roads, rail and ports over six years to 2013-14
• $3.6 billion to duplicate the Pacific Highway by 2016, conditional on agreement with the NSW Government
• $350 million per year for the Roads to Recovery program
• $232 million towards the Torrens and Goodwood rail project in Adelaide

1OVERVIEW
Budget at a glance
We are returning the budget to surplus while ensuring families and small businesses are sharing in the benefits of the resources boom.
A return to surplusThe Government is returning the budget to surplus on time and as promised. Despite a $150 billion loss of tax receipts since the GFC, over the five years to 2012-13, the budget forecasts strengthening surpluses in each of the next four years with a $1.5 billion surplus in 2012-13.
Returning to surplus is appropriate with the economy expected to grow around trend. It will allow monetary policy to respond to economic developments as appropriate.
It is also our best defence in uncertain times and when the global economy is changing dramatically.
It sends a clear sign of the strength of the Australian economy when many other countries are still struggling to recover from the GFC and recent global instability.
Spreading the benefits of the boomThis Budget ensures that the benefits of the boom are spread to families and businesses across Australia.
Revenue from the Minerals Resource Rent Tax will go to $1.8 billion worth of increases to family payments from 1 July 2013, and a new Supplementary Allowance of $1.1 billion for eligible income support recipients, with the first payment in March 2013. It will also support businesses left behind by the boom by reforming the tax system to deal better with losses.
An additional $2.1 billion investment in a new Schoolkids Bonus will guarantee families timely and flexible support with the costs of schooling.
From 1 July 2012, families will benefit from tripling the tax-free threshold, freeing up to one million taxpayers
from the need to lodge a tax return. Small businesses will benefit from new tax breaks such as the instant asset write-off and the new loss carry-back.
Foundations for a fairer, more productive future We are putting in place the big reforms in health and education and the investments in infrastructure to build the foundations for a fair and high productivity future.
This Budget commits to the first stage of a National Disability Insurance Scheme. It delivers long overdue reforms in aged care, with more access to services and greater sustainability.
We are ensuring Australians have the skills and opportunities to maximise the benefits from the Asian Century, with $1.75 billion over five years to support reforms to the national training system.
Actual Estimates Projections2010-11 2011-12 2012-13 2013-14 2014-15 2015-16
Underlying cash balance ($b)(a)4.03.01.01.00.3-4.3-PDG fo tnec reP
5.90.76.25.20.24-5.15-)b$( ecnalab lacsiF5.04.02.02.08.2-7.3-PDG fo tnec reP
(a) Excludes expected Future Fund earnings.
2011-12 2012-13 2013-14 2014-15 2015-16
3334/1 33PDG laeR2/1 12/1 12/1 14/1 12/1tnemyolpmE
552/1 52/1 54/1 5etar tnemyolpmenU2/1 22/1 22/1 24/1 34/1 1xedni ecirp remusnoC4/1 54/1 54/1 552/1 5PDG lanimoN
ProjectionsForecasts
(a) Real and nominal GDP are year average growth. Employment and CPI are through-the-year growth to the June quarter. The unemployment rate is the rate in the June quarter.
-47.7 -44.4 1.5 2.0 5.3 7.5

2 OVERVIEW
Returning to surplus is important Returning the budget to surplus is appropriate given Australia’s strong economic fundamentals and continues to give monetary policy scope to respond to economic developments.
Bringing the budget back to surplusThe Government is returning the budget to surplus in 2012-13, on time and as promised, with surpluses growing over the forward estimates.
During the GFC we took action and stepped in to support demand. We avoided recession and supported jobs. Over 750,000 jobs have been created since late 2007.
Consistent with our fiscal strategy we are now returning the budget to surplus, which is appropriate given the economy is expected to grow around trend.
Australia has strong economic fundamentals, solid growth, low unemployment, record levels of mining investment, and commodity prices
still around historical highs. In these circumstances, returning the budget to surplus in 2012-13 is appropriate.
This is being achieved despite tax receipts in the five years to 2012-13 being $150 billion lower than was expected before the GFC. The recovery in tax receipts has also been slow despite the solid growth in the economy following the GFC.
While this is a disciplined Budget, it also focuses on our key priorities and ensures funds are directed to the purposes and people who need them the most.
We have taken $33.6 billion in saves in this Budget, making room for priorities like $5 billion in new payments to low and middle income households.
Providing flexibility to monetary policy Returning the budget to surplus will allow monetary policy to respond to economic developments as appropriate.
This is important given the near-term challenges facing certain workers and businesses as a result of the patchwork economy and a strong Australian dollar.
In normal circumstances monetary policy should play the primary role in managing demand to keep the economy growing at close to capacity consistent with achieving its medium-term inflation target.
Returning the budget to surplus (Underlying cash balance)
-60
-50
-40
-30
-20
-10
0
10
-60
-50
-40
-30
-20
-10
0
10
2008-09 2009-10 2010-11 2011-12 2012-13 2013-14 2014-15 2015-16
$billion$billion

3OVERVIEW
Back to surplus faster (2011-2017)
Sending a strong message of confidenceReturning the budget to surplus sends a strong message of confidence and is our best defence in uncertain times.
Strong message of confidenceAustralia’s budget will return to surplus ahead of any major advanced economy. Returning to surplus is a clear sign of Australia’s economic strength.
The strength of our public finances is a key reason behind Australia receiving a AAA credit rating with a stable outlook from all three major rating agencies for the first time in our history. We are one of only eight countries that currently meets this standard.
Returning to surplus sends a strong message of confidence to the rest of the world during a period of heightened global uncertainty.
Best defence in uncertain timesReturning the budget to surplus is Australia’s best defence at a time when the global economy is undergoing dramatic structural changes and the global outlook remains uncertain.
While global financial stresses have eased since the acute bout of instability late last year, conditions remain weak and fragile.
Many other advanced economies are still facing the significant task of rebuilding and growing their economies as well as setting their public finances on a sustainable footing.
As we have seen from the global turbulence over the past four years, being prepared for changing economic conditions is critical.
A budget surplus is a key component of this preparation.
Surpluses strengthen the Government’s balance sheet and rebuild our fiscal reserves to create a buffer in uncertain global economic times.
This buffer will provide the Government with more options to respond, if necessary, in the most effective way to unexpected changes in the domestic and global economy.
-12
-10
-8
-6
-4
-2
0
2
-12
-10
-8
-6
-4
-2
0
2 Per cent of GDP Per cent of GDP
0
25
50
75
100
125
150
175
0
25
50
75
100
125
150
175 Per cent of GDP Per cent of GDP
-12
-10
-8
-6
-4
-2
0
2
-12
-10
-8
-6
-4
-2
0
2 Per cent of GDP Per cent of GDP
0
25
50
75
100
125
150
175
0
25
50
75
100
125
150
175 Per cent of GDP Per cent of GDP
Lower net debt (2011-2017)

4 OVERVIEW
Unemployment rates for advanced economies
One of the world’s strongest economiesOur strong economic fundamentals allow us to face our near term challenges and build for the future.
A stand out performer Australia has one of the strongest economies in the world.
While many other advanced economies are struggling to reach their pre-crisis level of output, our economy is now significantly larger than it was before the GFC. Over 750,000 jobs have been created in Australia since the end of 2007, while around 27 million jobs have been lost across the world over the same period.
With our strong public finances, solid economic growth, low unemployment rate, contained inflation, and very low levels of public debt, Australia’s economic strength is the envy of the world.
A bright outlookAustralia has a bright future in the fastest growing part of the global economy.
Emerging Asia’s unprecedented demand for resources, coupled with continued strong demand from traditional markets such as South Korea and Japan, underpins our historically high terms of trade and our unprecedented pipeline of resources investment.
Our strong ties with emerging Asia mean we have many new opportunities to prosper in the Asian Century.
Preparing for the futureBut we cannot afford to take our economic strength for granted and we must prepare the economy for the challenges of the future.
Australia is facing difficult long-term challenges including managing the ageing of the population and transitioning to a clean energy future.
By reducing barriers to work, particularly for older Australians, supporting businesses to invest and innovate, and introducing a price on carbon we are transforming the economy to ensure it is best placed to meet these challenges.
2
4
6
8
10
12
2
4
6
8
10
12
Jun-08 Sep-09 Dec-10 Mar-12
Per cent Per cent
Australia
Canada
euro area
United States
90
95
100
105
110
90
95
100
105
110
Jun-08 Mar-10 Dec-11
Australia
euro area
United States
Japan
Index(Jun-08=100)
2
4
6
8
10
12
2
4
6
8
10
12
Jun-08 Sep-09 Dec-10 Mar-12
Per cent Per cent
Australia
Canada
euro area
United States
90
95
100
105
110
90
95
100
105
110
Jun-08 Mar-10 Dec-11
Australia
euro area
United States
Japan
Index(Jun-08=100)
GDP levels for advanced economies

5OVERVIEW
The resources boom and the Asian CenturyGetting the settings right will allow Australia to manage the impact of the resources boom, boost our productivity, increase our living standards and take advantage of the emerging opportunities from the Asian Century.
The patchwork economyDramatic changes in the global economy are driving change in the Australian economy.
Mining related sectors are expanding as a share of GDP due to historically high terms of trade and a surge in mining related investment. Some other sectors, such as parts of the services sector, are also performing solidly.
Conditions remain difficult, however, for those sectors not benefiting from the resources boom. The high Australian dollar is weighing heavily on trade-exposed sectors like manufacturing and tourism.
At the same time, ongoing global uncertainty and cautious behaviour by consumers is creating further challenges for retail and related sectors.
More broadly, a shift towards knowledge based services has been occurring for several decades. This has been driven by higher incomes and demographic and technological change.
Opportunities in the Asian CenturyThe pace and scale of change occurring in Asia, including China and India, is unprecedented.
While it is difficult to predict patterns of development and growth, it is clear that as developing nations’ incomes rise, significant new markets, including from a growing middle class, will concentrate on our doorstep.
It is important that the right policy settings are in place to improve our productivity so we can take advantage of these opportunities.
These policies include our $36 billion investment in roads, rail and ports which support the physical economy and building the National Broadband Network to ensure we benefit from the digital economy.
We are building on our $3 billion investment in skills in the 2011-12 Budget by delivering lasting reforms to the national training system. In April we agreed a $1.75 billion partnership with the states on skills reform and in this Budget we are providing a further $101 million in related initiatives.
Undergraduate places are now fully uncapped at all public universities for the first time, driving an increase of 150,000 students this year compared to 2007 levels.
Australia’s merchandise export shares
0
10
20
30
40
50
60
70
80
90
0
10
20
30
40
50
60
70
80
90
1990-91 1995-96 2000-01 2005-06 2010-11
Advanced economies
Emerging Asia
Per cent Per cent
0
25
50
75
100
0
25
50
75
100
1900 1954 1971 2000 2009Services Agriculture Industry
Per cent Per cent
0
10
20
30
40
50
60
70
80
90
0
10
20
30
40
50
60
70
80
90
1990-91 1995-96 2000-01 2005-06 2010-11
Advanced economies
Emerging Asia
Per cent Per cent
0
25
50
75
100
0
25
50
75
100
1900 1954 1971 2000 2009Services Agriculture Industry
Per cent Per cent
Employment share by activity

6 OVERVIEW
Spreading the benefits of the boomThe core of this Budget is a plan to spread the benefits of the resources boom to help families on low and middle incomes with the costs of living, while still returning the budget to surplus on time and as promised.
Growth and prosperityThe Minerals Resource Rent Tax (MRRT) is a historic economic reform which means the benefits of the boom can be invested in Australia’s future.
The Government was going to use the proceeds of the MRRT to cut company tax rates but we are not able to secure the necessary Parliamentary support. We will now adopt a different approach to spread the benefits of the boom to families and businesses.
The Spreading the Benefits of the Boom package will deliver increases in income to families with children, young people and the unemployed.
This package, combined with the new Schoolkids Bonus, will provide around $5 billion in support to low and middle
income households which will in turn support consumption and spending in businesses, including small businesses, across the country.
Increasing Family Tax Benefit Part AFrom 1 July 2013 Family Tax Benefit Part A (FTB-A) will increase for all eligible families.
For those on the maximum rate, the Government will deliver an increase of $300 per year for families with one child and an increase of $600 for families with two or more children. For families receiving the base rate, the increase will be $100 for families with one child and $200 for families with two or more children.
Around 1.1 million families will receive an increase of at least $300 per year as a result of the increase to the maximum rate of FTB-A. Of these, around 690,000 families with two or more children will receive $600 per year.
As a result of the increase to the base rate of FTB-A, around 460,000 families will receive at least an extra $100, of which around 250,000 will receive $200 per year.
These measures build on the Government’s strong record of support for families, including increasing rates of FTB-A for each child aged 16-19 in secondary school by up to $4,208 from 1 January this year.
Annual increase in Family Tax Benefit Part A
$100
$300$200
$600
$0
$100
$200
$300
$400
$500
$600
$700
$0
$100
$200
$300
$400
$500
$600
$700
Family receiving base rate Family receiving maximum rate
Increase in FTB-AIncrease in FTB-A
Increase in FTB-A for one child family Increase in FTB-A for family with two or more children

7OVERVIEW
Helping households with the cost of livingAustralian families, students and job seekers on income support will receive an extra $2.9 billion in increased support to help ensure the benefits of our strong economy reach households on low and middle incomes.
Supporting those most in needThe Government is investing $1.1 billion to create a new Supplementary Allowance for income support recipients on eligible payments to help them meet the costs of essential bills.
The Supplementary Allowance will assist Australians who are hardest hit by the increases in costs of living — the unemployed, students, and parents with young children.
Australians receiving Newstart Allowance, Youth Allowance and Parenting Payment, among others, will qualify for the Supplementary Allowance.
Singles will receive an additional yearly allowance of $210, and couples will receive $350, paid in two instalments
in March and September, with the first payment to commence on March 2013.
Supporting redundant workersIn addition to the package, the Government is doubling the liquid assets test thresholds for income support recipients. From 1 July 2013, newly unemployed people can access income support without waiting up to 13 weeks if they have liquid assets of up to $5,000 for singles without children and $10,000 for all others.
This allows people to be more financially secure, by retaining modest levels of savings, while being able to access income support.
Tripling the tax-free thresholdThese measures build on the $47 billion of tax cuts we have delivered since 2007-08, and the $8 billion tax reform package to be delivered over the next three years.
In 2012-13, people will pay less income tax due to the tripling of the tax-free threshold from $6,000 to $18,200. All taxpayers with incomes of up to $80,000 will get a tax cut, with most receiving at least $300 a year with many part time workers receiving up to $600. The tax-free threshold will further rise to $19,400 in 2015-16.
Regular wage earners below these thresholds will get to take home all of their pay and by 2016 over a million people need no longer lodge tax returns.
The Government’s record of increasing support for households
Personal income tax cuts worth $47 billion over three years from 2008-09
Medicare Levy Surcharge thresholds increased for the first time, and indexed
First Home Saver Accounts
Tax Bonus for Working Australians
Tripled the tax-free threshold
Further increase to tax-free threshold
Child Care Rebate (CCR) increased from 30 to 50 per cent
Child Care Rebate cap increased from $4,354 to $7,500 per annum
Secure and Sustainable Pension Reform
Parents given option to receive CCR fortnightly
Increased rates of FTB-A for children aged 16-19 years old
Clean Energy Advance payments begin
First payment of Supplementary Allowance
Increases to FTB-A
JUL 08 OCT 08 APR 09 SEP 09 JUL 11 JAN 12 MAY 12 JUL 12 MAR 13 JUL 13 JUL 15
Super contribution for low income earners
8 OVERVIEW
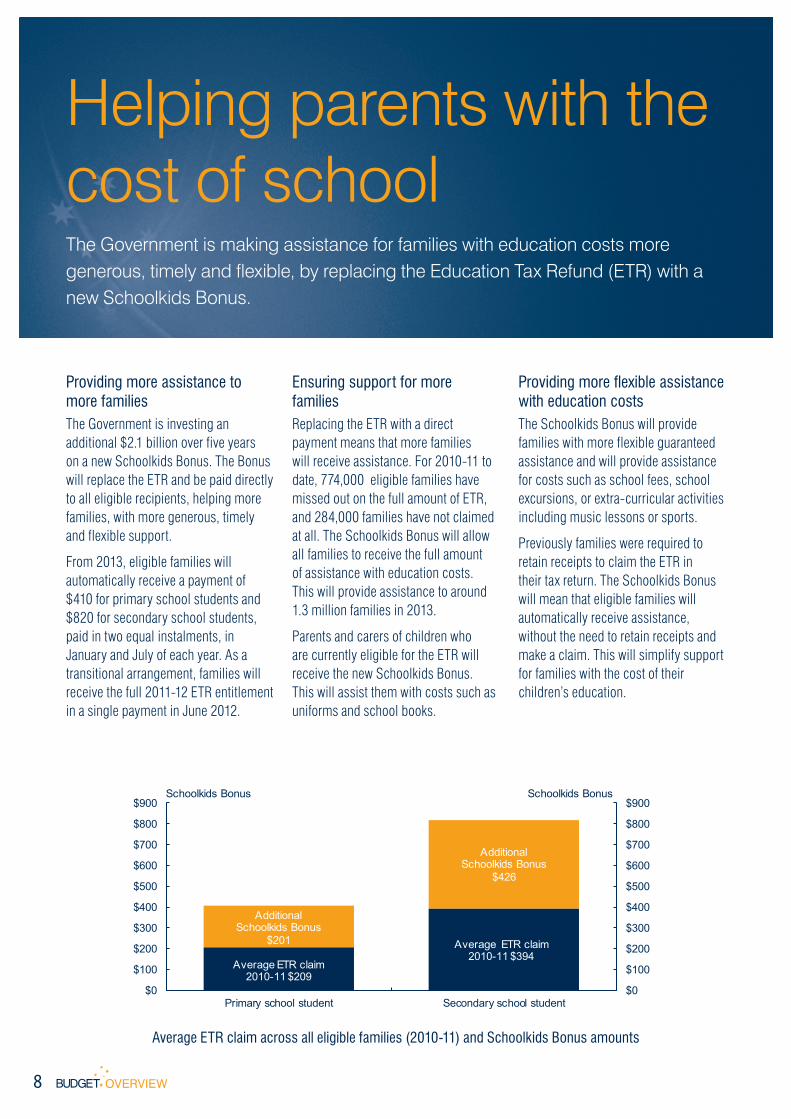
Helping parents with the cost of schoolThe Government is making assistance for families with education costs more generous, timely and flexible, by replacing the Education Tax Refund (ETR) with a new Schoolkids Bonus.
Providing more assistance to more familiesThe Government is investing an additional $2.1 billion over five years on a new Schoolkids Bonus. The Bonus will replace the ETR and be paid directly to all eligible recipients, helping more families, with more generous, timely and flexible support.
From 2013, eligible families will automatically receive a payment of $410 for primary school students and $820 for secondary school students, paid in two equal instalments, in January and July of each year. As a transitional arrangement, families will receive the full 2011-12 ETR entitlement in a single payment in June 2012.
Ensuring support for more familiesReplacing the ETR with a direct payment means that more families will receive assistance. For 2010-11 to date, 774,000 eligible families have missed out on the full amount of ETR, and 284,000 families have not claimed at all. The Schoolkids Bonus will allow all families to receive the full amount of assistance with education costs. This will provide assistance to around 1.3 million families in 2013.
Parents and carers of children who are currently eligible for the ETR will receive the new Schoolkids Bonus. This will assist them with costs such as uniforms and school books.
Providing more flexible assistance with education costsThe Schoolkids Bonus will provide families with more flexible guaranteed assistance and will provide assistance for costs such as school fees, school excursions, or extra-curricular activities including music lessons or sports.
Previously families were required to retain receipts to claim the ETR in their tax return. The Schoolkids Bonus will mean that eligible families will automatically receive assistance, without the need to retain receipts and make a claim. This will simplify support for families with the cost of their children’s education.
Average ETR claim across all eligible families (2010-11) and Schoolkids Bonus amounts
Average ETR claim 2010-11 $209
Average ETR claim 2010-11 $394
Additional Schoolkids Bonus
$201
Additional Schoolkids Bonus
$426
$0
$100
$200
$300
$400
$500
$600
$700
$800
$900
$0
$100
$200
$300
$400
$500
$600
$700
$800
$900
Primary school student Secondary school student
Schoolkids BonusSchoolkids Bonus

9OVERVIEW
Improving living standards in retirementThe Government’s superannuation and pension reforms will help Australians achieve a better quality of life in their retirement by increasing retirement savings and ensuring the pension remains an adequate and sustainable safety net.
Living comfortably in retirementAustralians are living longer in retirement. The Government’s Stronger, Fairer, Simpler tax reforms will boost superannuation savings to allow for a better standard of living in retirement.
Workers will also benefit from reductions in fees and charges on their superannuation, and a more efficient superannuation system, as a result of the Government’s Stronger Super reforms.
More superannuation for workers8.4 million Australian workers will benefit from the superannuation guarantee rate progressively increasing from 9 to 12 per cent, from 1 July 2013 to 1 July 2019.
A 30 year old worker on average full time earnings will retire at age 67 with around $118,000 extra in superannuation.
The maximum age limit for the superannuation guarantee will be abolished, to increase incentives for workers aged 70 and over to remain in the workforce and further boost retirement savings.
Supporting low income AustraliansAround 3.6 million workers earning up to $37,000 will get a boost of up to $500 to their superannuation savings from 1 July 2012. This reform will make superannuation concessions fairer by ensuring these low-paid workers effectively pay no
tax on their superannuation guarantee contributions.
Secure and Sustainable PensionsAround 3.4 million pensioners have benefited from our 2009 pension reforms. These historic reforms increased the rate and improved the indexation arrangements of the pension.
Since 2009, the maximum rate of the pension has increased by $154 per fortnight for singles and $156 per fortnight for couples combined.
Full and part rate pensioners will receive further annual increases of $338 for singles and $255 each for couples to assist with the impact of the carbon price, beginning in May 2012.
Increase in retirement savings as a result of the superannuation reforms
$0
$50,000
$100,000
$150,000
$200,000
$250,000
$0
$50,000
$100,000
$150,000
$200,000
$250,000
Current age 20 Current age 30 Current age 40 Current age 50
Current wage $30,000
Current wage $70,000
Increase in retirement savings Increase in retirement savings
10 OVERVIEW
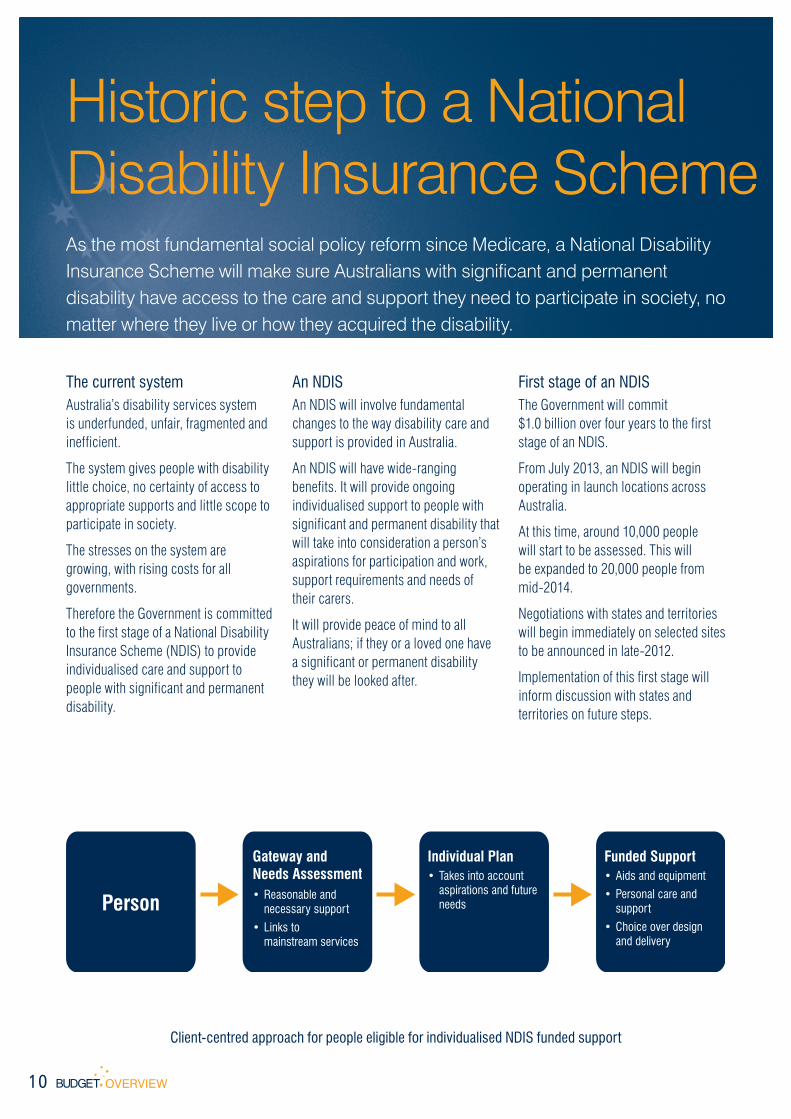
Historic step to a National Disability Insurance SchemeAs the most fundamental social policy reform since Medicare, a National Disability Insurance Scheme will make sure Australians with significant and permanent disability have access to the care and support they need to participate in society, no matter where they live or how they acquired the disability.
The current systemAustralia’s disability services system is underfunded, unfair, fragmented and inefficient.
The system gives people with disability little choice, no certainty of access to appropriate supports and little scope to participate in society.
The stresses on the system are growing, with rising costs for all governments.
Therefore the Government is committed to the first stage of a National Disability Insurance Scheme (NDIS) to provide individualised care and support to people with significant and permanent disability.
An NDIS An NDIS will involve fundamental changes to the way disability care and support is provided in Australia.
An NDIS will have wide-ranging benefits. It will provide ongoing individualised support to people with significant and permanent disability that will take into consideration a person’s aspirations for participation and work, support requirements and needs of their carers.
It will provide peace of mind to all Australians; if they or a loved one have a significant or permanent disability they will be looked after.
First stage of an NDISThe Government will commit $1.0 billion over four years to the first stage of an NDIS.
From July 2013, an NDIS will begin operating in launch locations across Australia.
At this time, around 10,000 people will start to be assessed. This will be expanded to 20,000 people from mid-2014.
Negotiations with states and territories will begin immediately on selected sites to be announced in late-2012.
Implementation of this first stage will inform discussion with states and territories on future steps.
Client-centred approach for people eligible for individualised NDIS funded support
Person
Gateway and Needs Assessment• Reasonable and necessary support
• Links to mainstream services
Individual Plan• Takes into account aspirations and future needs
Funded Support• Aids and equipment
• Personal care and support
• Choice over design and delivery

11OVERVIEW
A new way of delivering disability care and supportThe first stage of a National Disability Insurance Scheme will begin with roll-out in launch locations from July 2013.
Individualised care and support The first stage of an NDIS will provide individualised care and support based on a person’s needs.
Control and choice will be central. Overall life goals for social and economic participation will be the focus of the care and services provided.
People with disability and their families will have certainty that their future support needs will be met. At the most basic level people with disability will have control over their service and support.
Assessment processThose most in need — people with significant and permanent disability — will have access to an assessment that develops an individual support plan with funding allocated for reasonable and necessary supports.
Case managementLocal Area Coordinators will work with clients, providing information needed to make informed decisions in navigating the system and assisting in planning.
They will oversee the delivery of appropriate local supports and services, monitor progress of the client and work to ensure that people with disability are fully included in their communities.
Increased servicesIncreased formal care services will include in home support and respite care and early intervention services to improve functioning and delay or lessen a decline in functioning.
Support provided by an NDIS would build on broader community supports, mainstream services and an individual’s family support networks. An NDIS is not intended to replace the important care and support provided by families and informal carers, but to help make it more sustainable.
Unmet need for people with profound or severe disability requiring help with basic tasks
Historic step to a National Disability Insurance Scheme
0 20,000 40,000 60,000 80,000 100,000
Self-care
Mobility
Communication
Reading or writing tasks
Transport
Meal preparation
Number of people across Australia not receiving assistance when needed
12 OVERVIEW
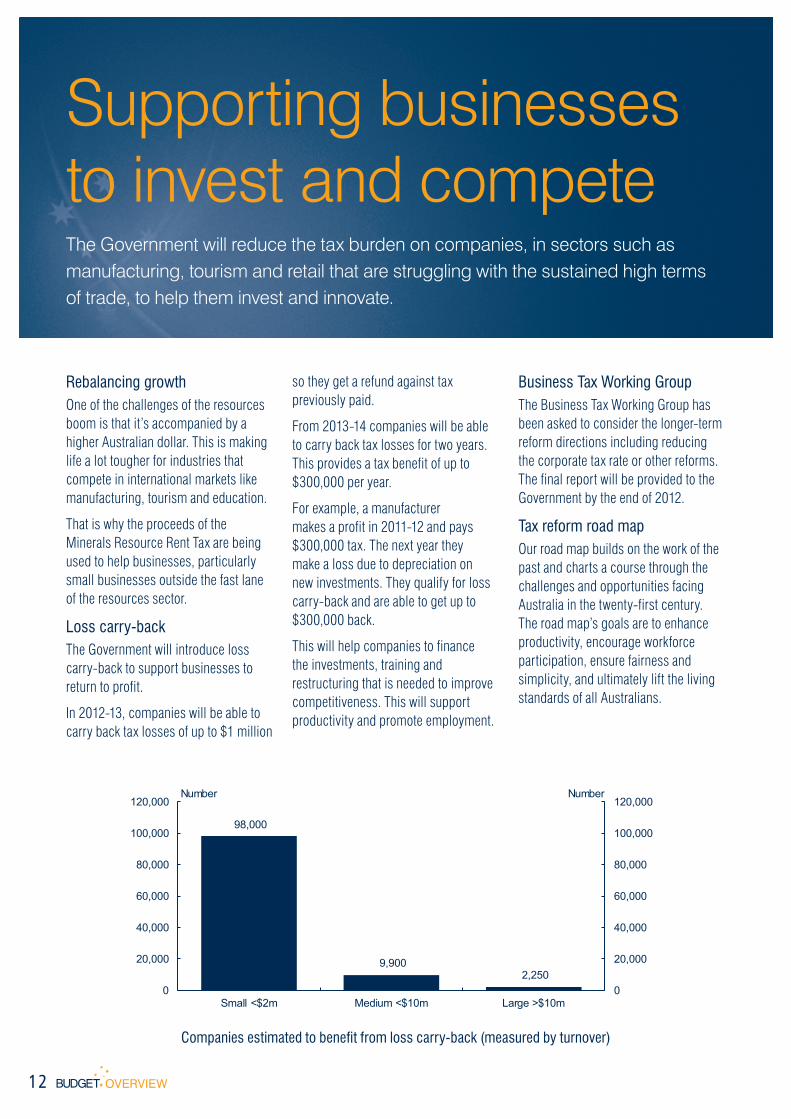
Supporting businesses to invest and competeThe Government will reduce the tax burden on companies, in sectors such as manufacturing, tourism and retail that are struggling with the sustained high terms of trade, to help them invest and innovate.
Rebalancing growthOne of the challenges of the resources boom is that it’s accompanied by a higher Australian dollar. This is making life a lot tougher for industries that compete in international markets like manufacturing, tourism and education.
That is why the proceeds of the Minerals Resource Rent Tax are being used to help businesses, particularly small businesses outside the fast lane of the resources sector.
Loss carry-backThe Government will introduce loss carry-back to support businesses to return to profit.
In 2012-13, companies will be able to carry back tax losses of up to $1 million
so they get a refund against tax previously paid.
From 2013-14 companies will be able to carry back tax losses for two years. This provides a tax benefit of up to $300,000 per year.
For example, a manufacturer makes a profit in 2011-12 and pays $300,000 tax. The next year they make a loss due to depreciation on new investments. They qualify for loss carry-back and are able to get up to $300,000 back.
This will help companies to finance the investments, training and restructuring that is needed to improve competitiveness. This will support productivity and promote employment.
Business Tax Working GroupThe Business Tax Working Group has been asked to consider the longer-term reform directions including reducing the corporate tax rate or other reforms. The final report will be provided to the Government by the end of 2012.
Tax reform road mapOur road map builds on the work of the past and charts a course through the challenges and opportunities facing Australia in the twenty-first century. The road map’s goals are to enhance productivity, encourage workforce participation, ensure fairness and simplicity, and ultimately lift the living standards of all Australians.
Companies estimated to benefit from loss carry-back (measured by turnover)
98,000
9,900 2,250
0
20,000
40,000
60,000
80,000
100,000
120,000
0
20,000
40,000
60,000
80,000
100,000
120,000
Small <$2m Medium <$10m Large >$10m
NumberNumber

13OVERVIEW
Additional support for small businessThe Government understands the small business sector is the engine room of the Australian economy, employing millions of Australians and making up over a third of the economy.
Tax breaks for small business The Government recognises the importance of simplifying taxation for small business.
From 1 July this year, all small businesses — whether they are run by sole traders, partnerships, trusts or through companies — will be able to immediately write off each eligible business asset they buy costing less than $6,500 per asset.
This measure will improve cash flow and reduce red tape for up to 2.7 million small businesses (with a turnover of less than $2 million) allowing them to reinvest more time and profits back into growing their businesses and improving productivity.
For example a café operating as an incorporated small business purchases a $2,000 lounge, a $4,000 coffee machine and a $3,000 fridge. Under the new rules the café can deduct the full amount of each asset, lowering their taxable income by $7,650 and providing a tax saving of $2,295.
Assets costing $6,500 or more will be depreciated in a single pool at 30 per cent (15 per cent in the first year).
These two measures are worth around $1 billion in the first year.
In addition, small businesses will be able to claim up to $5,000 as an immediate deduction for new or used motor vehicles acquired from 1 July.
Support for small businessThe highly successful Small Business Advisory Service (SBAS), which funds service providers across Australia to assist small businesses through additional support and advisory services, will be made ongoing, with additional funding of $28 million over the next four years.
The Small Business Support Line, which provides information and referral services, will also be extended to 2015-16.
The Government will appoint an Australian Small Business Commissioner to represent and advocate small business interests to the Australian Government.
Small business by selected industry
0 2 4 6 8 10 12 14 16
Electricity, gas, water and waste servicesMining
Public administration and safetyInformation media and telecommunications
Education and trainingArts and recreation services
Wholesale tradeAccommodation and food services
ManufacturingHealth care and social assistance
Other servicesTransport, postal and warehousing
Administrative and support servicesRetail trade
Agriculture, forestry and fishingProfessional, scientific and technical services
Rental, hiring and real estate servicesFinancial and insurance services
Construction
Per cent
14 OVERVIEW
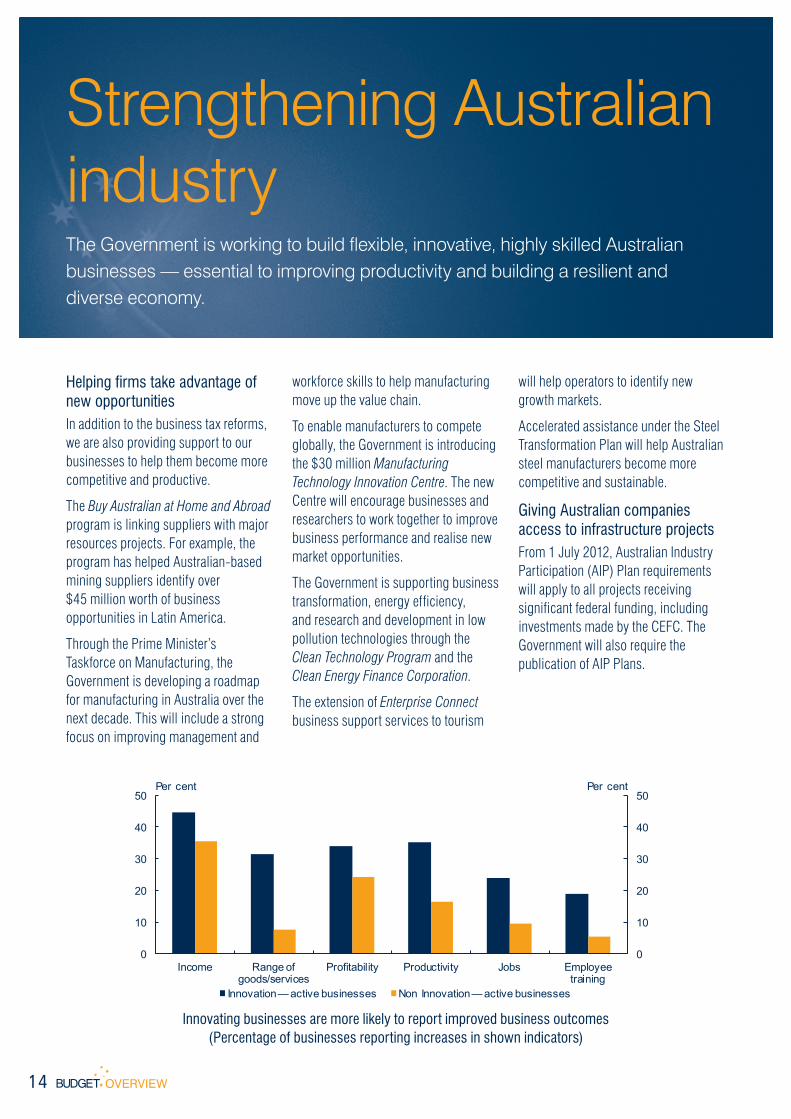
Strengthening Australian industryThe Government is working to build flexible, innovative, highly skilled Australian businesses — essential to improving productivity and building a resilient and diverse economy.
Helping firms take advantage of new opportunitiesIn addition to the business tax reforms, we are also providing support to our businesses to help them become more competitive and productive.
The Buy Australian at Home and Abroad program is linking suppliers with major resources projects. For example, the program has helped Australian-based mining suppliers identify over $45 million worth of business opportunities in Latin America.
Through the Prime Minister’s Taskforce on Manufacturing, the Government is developing a roadmap for manufacturing in Australia over the next decade. This will include a strong focus on improving management and
workforce skills to help manufacturing move up the value chain.
To enable manufacturers to compete globally, the Government is introducing the $30 million Manufacturing Technology Innovation Centre. The new Centre will encourage businesses and researchers to work together to improve business performance and realise new market opportunities.
The Government is supporting business transformation, energy efficiency, and research and development in low pollution technologies through the Clean Technology Program and the Clean Energy Finance Corporation.
The extension of Enterprise Connect business support services to tourism
will help operators to identify new growth markets.
Accelerated assistance under the Steel Transformation Plan will help Australian steel manufacturers become more competitive and sustainable.
Giving Australian companies access to infrastructure projectsFrom 1 July 2012, Australian Industry Participation (AIP) Plan requirements will apply to all projects receiving significant federal funding, including investments made by the CEFC. The Government will also require the publication of AIP Plans.
Innovating businesses are more likely to report improved business outcomes (Percentage of businesses reporting increases in shown indicators)
0
10
20
30
40
50
0
10
20
30
40
50
Income Range ofgoods/services
Profitability Productivity Jobs Employeetraining
Per centPer cent
Innovation— active businesses Non Innovation— active businesses

15OVERVIEW
Building our nation’s infrastructureThis Budget continues the Government’s strong record of investing in Australia’s nationally significant infrastructure to expand our productive capacity, relieve congestion and improve road safety.
Enhancing productivityInvestment in quality infrastructure drives improvements in productivity, which underpin increases in living standards for all Australians.
The Government is investing over $36 billion in roads, rail and ports over the six years to 2013-14, as part of its Nation Building programs.
The Budget contains additional measures to boost productivity and improve road safety:
• an additional $3.6 billion to meet the commitment to duplicate the Pacific Highway by 2016, conditional on the NSW Government agreeing to meet 50 per cent of the funding costs;
• a commitment to the development of an intermodal terminal at Moorebank in South Western Sydney — in cooperation with the private sector. This key project is crucial to addressing congestion problems in the Port Botany Precinct and improving the productivity performance of Sydney’s freight network;
• a commitment to fund important road safety programs, including $350 million per year for the Roads to Recovery program and $60 million per year for the Black Spots program; and
• $232 million towards the Torrens and Goodwood rail project, which will help ease congestion on
Adelaide’s suburban and freight rail networks. The Government has now contributed funding towards all of the projects assessed as ‘ready to proceed’ on Infrastructure Australia’s 2009 Priority List.
National Broadband NetworkAs of 31 March 2012, NBN Co estimates that work had commenced in providing fibre to around 270,000 premises across Australia. Over the next three years, NBN Co will commence work in over 1,500 communities, covering 3.5 million premises throughout Australia.
Per capita Australian Government transport infrastructure funding
0
500
1,000
1,500
2,000
2,500
3,000
0
500
1,000
1,500
2,000
2,500
3,000
NSW Vic Qld WA SA Tas NT ACT
$average $average
2002-03 to 2007-08 2008-09 to 2013-14
16 OVERVIEW
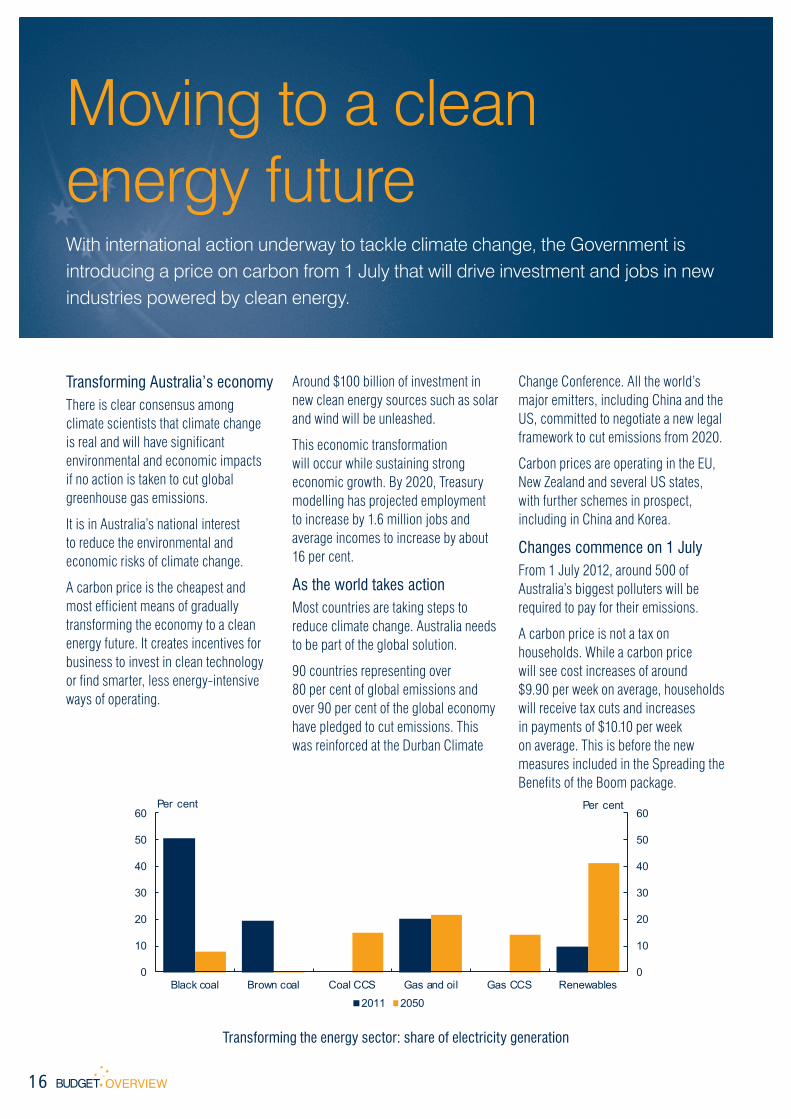
Moving to a clean energy futureWith international action underway to tackle climate change, the Government is introducing a price on carbon from 1 July that will drive investment and jobs in new industries powered by clean energy.
Transforming Australia’s economyThere is clear consensus among climate scientists that climate change is real and will have significant environmental and economic impacts if no action is taken to cut global greenhouse gas emissions.
It is in Australia’s national interest to reduce the environmental and economic risks of climate change.
A carbon price is the cheapest and most efficient means of gradually transforming the economy to a clean energy future. It creates incentives for business to invest in clean technology or find smarter, less energy-intensive ways of operating.
Around $100 billion of investment in new clean energy sources such as solar and wind will be unleashed.
This economic transformation will occur while sustaining strong economic growth. By 2020, Treasury modelling has projected employment to increase by 1.6 million jobs and average incomes to increase by about 16 per cent.
As the world takes action Most countries are taking steps to reduce climate change. Australia needs to be part of the global solution.
90 countries representing over 80 per cent of global emissions and over 90 per cent of the global economy have pledged to cut emissions. This was reinforced at the Durban Climate
Change Conference. All the world’s major emitters, including China and the US, committed to negotiate a new legal framework to cut emissions from 2020.
Carbon prices are operating in the EU, New Zealand and several US states, with further schemes in prospect, including in China and Korea.
Changes commence on 1 JulyFrom 1 July 2012, around 500 of Australia’s biggest polluters will be required to pay for their emissions.
A carbon price is not a tax on households. While a carbon price will see cost increases of around $9.90 per week on average, households will receive tax cuts and increases in payments of $10.10 per week on average. This is before the new measures included in the Spreading the Benefits of the Boom package.
Transforming the energy sector: share of electricity generation
0
10
20
30
40
50
60
0
10
20
30
40
50
60
Black coal Brown coal Coal CCS Gas and oil Gas CCS Renewables
Per centPer cent
2011 2050

17OVERVIEW
Conserving Australia’s iconic environmentThe Government is providing $2.2 billion over 5 years (from 2013-14) to support environmental priorities through a second phase of the Caring for our Country program.
Caring for our CountryThe Government has committed to a second phase of the Caring for our Country program, investing a further $2.2 billion over 5 years (from 2013-14).
This builds on the success of Phase 1, which exceeded its outcomes in nearly all national priority areas, including:
• securing over 47,000 hectares of nationally threatened ecological communities; and
• more than 30,000 farmers adopting improved sustainable farm and land management practices.
Phase 2 of Caring for our Country will build on this success.
The program is based on continual improvement and consultation, to
ensure that the needs of stakeholders and the environment can be best met. To this end, the program will now be delivered through a national sustainable environment stream and a national sustainable agriculture stream.
Protecting our oceansThe Government is working to ensure a sustainable marine environment. We are investing $58 million over six years to develop and manage new Commonwealth marine reserves, supported by bioregional planning and a fisheries adjustment policy.
The reserves will improve the way our oceans are managed — helping them remain healthy while recognising the needs of individuals and industry.
This Budget also supports our Great Barrier Reef. An additional $12.5 million over four years (from 2013-14) will fund research to help the Reef adapt to climate change. $8 million has also been prioritised under the Caring for our Country program to ensure the Reef’s resilience through continuation of the Reef Guardian initiative, and funding for the Great Barrier Reef Marine Park Authority.
Reforming environmental regulationThe Budget also provides $38 million to implement Commonwealth environmental law reforms —streamlining legislation and leading to better environmental outcomes and stakeholder cooperation.
Caring for our Country — Highlights Phase 1
Caring for ourCountry
HighlightsPhase 1
Over 680 Indigenous rangers have been contracted under the Working on CountryIndigenous ranger program, to manage significant environmental outcomes.
67 new properties and 25 new Indigenous Protected Areas have been added to theNational Reserve System, increasing the protection of
under-represented bioregions by over 7.6 million hectares.
Since 2008, the Government has approved over $2 billion to achieve an environment that is healthier, better protected, well-managed, resilient, and provides essential ecosystem
services in a changing climate.
Through Reef Rescue more than 1100 farmers and more than 480 pastoralists received grants to improve water quality.

18 OVERVIEW
Better dental services for those in needThe Government is investing $515.3 million to provide dental services for those who can least afford it and to strengthen the dental workforce including $345.9 million to help reduce public dental waiting lists.
Targeting those in need Dental health varies across the population according to income. Where access to dental services is poor, dental health outcomes are generally worse.
That is why the Government is investing in a $515.3 million dental health package to improve access to dental services for those who can least afford it.
Traditionally the states and territories have provided dental services for those on low incomes. However, there are long waiting times for public services. It is estimated there are currently 400,000 patients on public waiting lists.
That is why the Government is providing funding of $345.9 million over three years to help reduce public dental waiting lists.
Dental workforce for the futureThe Government is building on commitments announced in the 2011-12 Budget by expanding the voluntary dental graduate program at a cost of $35.7 million over three years and introducing an oral health therapist graduate year program at a cost of $45.2 million over four years.
These programs will increase capacity in the public sector and in areas of need.
The dental workforce is not evenly distributed across our cities and rural
and regional areas. Most dentists choose to practise in urban areas.
That is why we are investing $77.7 million over four years for grants to support the relocation of dentists to regional, rural and remote areas and improve access to services beyond our cities.
Oral health promotionWe will invest $10.5 million over three years for oral health promotion activities to improve Australia’s oral health.
Pro bono services We are providing funding to support the delivery of pro bono services for the most disadvantaged groups in our community who traditionally have the most difficulty accessing services.
Decayed, missing teeth by household income, Australia 2004-2006
0
2
4
6
8
10
12
14
0
2
4
6
8
10
12
14
<$12,000 $12,000 -<$20,000
$20,000 -<$30,000
$30,000 -<$40,000
$40,000 -<$60,000
$60,000 -<$80,000
$80,000 -<$100,000
$100,000+
Average decayed, missing teethAverage decayed, missing teeth
19OVERVIEW
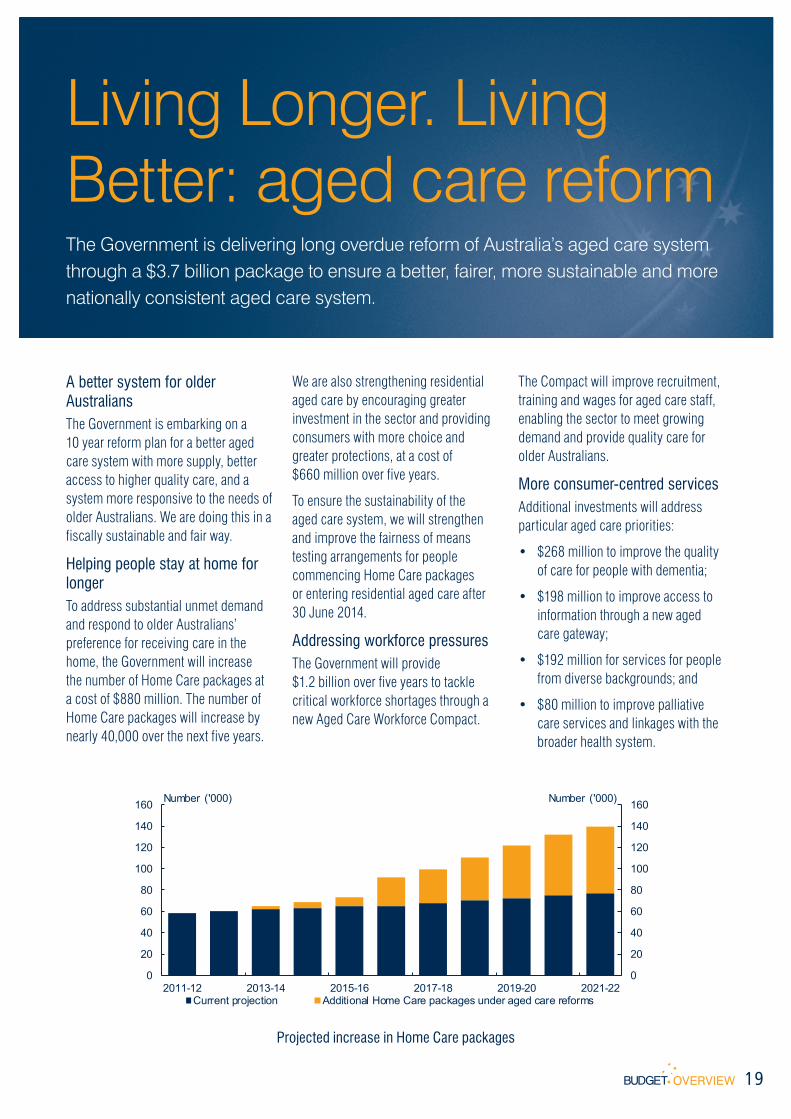
Living Longer. Living Better: aged care reformThe Government is delivering long overdue reform of Australia’s aged care system through a $3.7 billion package to ensure a better, fairer, more sustainable and more nationally consistent aged care system.
A better system for older AustraliansThe Government is embarking on a 10 year reform plan for a better aged care system with more supply, better access to higher quality care, and a system more responsive to the needs of older Australians. We are doing this in a fiscally sustainable and fair way.
Helping people stay at home for longerTo address substantial unmet demand and respond to older Australians’ preference for receiving care in the home, the Government will increase the number of Home Care packages at a cost of $880 million. The number of Home Care packages will increase by nearly 40,000 over the next five years.
We are also strengthening residential aged care by encouraging greater investment in the sector and providing consumers with more choice and greater protections, at a cost of $660 million over five years.
To ensure the sustainability of the aged care system, we will strengthen and improve the fairness of means testing arrangements for people commencing Home Care packages or entering residential aged care after 30 June 2014.
Addressing workforce pressuresThe Government will provide $1.2 billion over five years to tackle critical workforce shortages through a new Aged Care Workforce Compact.
The Compact will improve recruitment, training and wages for aged care staff, enabling the sector to meet growing demand and provide quality care for older Australians.
More consumer-centred servicesAdditional investments will address particular aged care priorities:
• $268 million to improve the quality of care for people with dementia;
• $198 million to improve access to information through a new aged care gateway;
• $192 million for services for people from diverse backgrounds; and
• $80 million to improve palliative care services and linkages with the broader health system.
Projected increase in Home Care packages
0
20
40
60
80
100
120
140
160
0
20
40
60
80
100
120
140
160
2011-12 2013-14 2015-16 2017-18 2019-20 2021-22
Number ('000)Number ('000)
Current projection Additional Home Care packages under aged care reforms
20 OVERVIEW
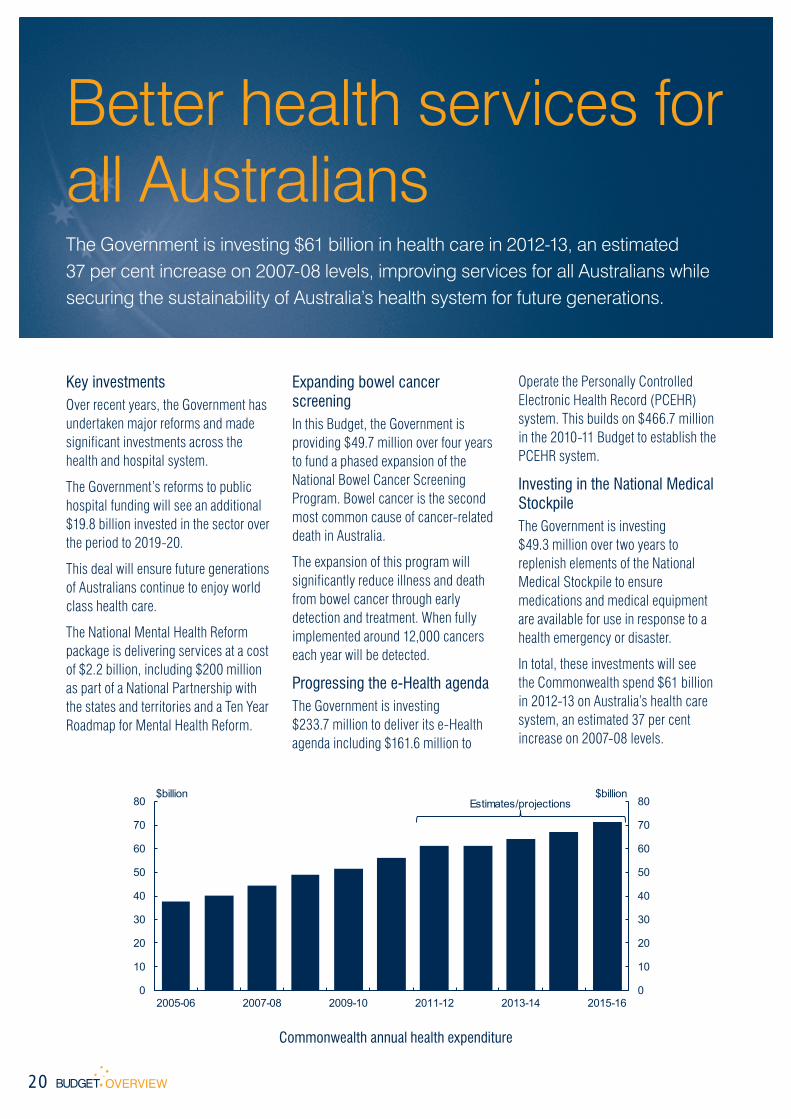
Better health services for all AustraliansThe Government is investing $61 billion in health care in 2012-13, an estimated 37 per cent increase on 2007-08 levels, improving services for all Australians while securing the sustainability of Australia’s health system for future generations.
Key investmentsOver recent years, the Government has undertaken major reforms and made significant investments across the health and hospital system.
The Government’s reforms to public hospital funding will see an additional $19.8 billion invested in the sector over the period to 2019-20.
This deal will ensure future generations of Australians continue to enjoy world class health care.
The National Mental Health Reform package is delivering services at a cost of $2.2 billion, including $200 million as part of a National Partnership with the states and territories and a Ten Year Roadmap for Mental Health Reform.
Expanding bowel cancer screening In this Budget, the Government is providing $49.7 million over four years to fund a phased expansion of the National Bowel Cancer Screening Program. Bowel cancer is the second most common cause of cancer-related death in Australia.
The expansion of this program will significantly reduce illness and death from bowel cancer through early detection and treatment. When fully implemented around 12,000 cancers each year will be detected.
Progressing the e-Health agendaThe Government is investing $233.7 million to deliver its e-Health agenda including $161.6 million to
Operate the Personally Controlled Electronic Health Record (PCEHR) system. This builds on $466.7 million in the 2010-11 Budget to establish the PCEHR system.
Investing in the National Medical Stockpile The Government is investing $49.3 million over two years to replenish elements of the National Medical Stockpile to ensure medications and medical equipment are available for use in response to a health emergency or disaster.
In total, these investments will see the Commonwealth spend $61 billion in 2012-13 on Australia’s health care system, an estimated 37 per cent increase on 2007-08 levels.
Commonwealth annual health expenditure
0
10
20
30
40
50
60
70
80
0
10
20
30
40
50
60
70
80
2005-06 2007-08 2009-10 2011-12 2013-14 2015-16
$billion$billionEstimates/projections

21OVERVIEW
Investing in regional hospitals and health careThe Government is investing $475 million through the Health and Hospitals Fund (HHF) as part of the $5 billion investment in health infrastructure to improve access to health care services across Australia.
Record investments in regional healthThis is the second regional specific round of the HHF. It will deliver 76 major new regional health infrastructure projects across Australia.
Supporting regional hospitals and health careThe Government is providing $475 million through the HHF to: support the clinical training capacity of regional hospitals; upgrade regional health infrastructure; and expand regional hospitals.
This completes the $1.8 billion HHF Regional Priority Round announced in the 2011-12 Budget, bringing the total number of regional projects to 139.
Investing in areas of national priorityConsistent with the Government’s health reform priorities, the $475 million investment includes:
• $171.6 million for 14 acute care projects;
• $128.7 million for 27 primary health care projects; and
• $8.2 million for four dental health projects.
76 new regional projectsThese projects include:
• $60.3 million — Lismore Base Hospital redevelopment (NSW);
• $35.0 million — Regional Queensland eHealth project; and
• $15.3 million — Mildura Community Health Services redevelopment (Vic).
Building on past investmentWe have delivered a record investment in health infrastructure — $5 billion has been invested since 2009 from the HHF across 224 projects. This latest investment builds on:
• $1.3 billion in the 2011-12 Budget under the first regional-specific funding round; and
• $3.2 billion in the 2009-10 Budget to upgrade hospital and health infrastructure, help deliver nationally consistent cancer services, and expand medical research and training infrastructure.
Regional health infrastructure projects across Australia — Round 4
Projects located at a single site
Projects located across multiple sites

22 OVERVIEW
Expanding access to high quality trainingThe Government has secured state and territory agreement to the $1.75 billion reform agenda for vocational education and training to drive productivity and grow the workforce with another $101 million in related initiatives in this Budget to improve the quality of skills training.
Skills for jobs, growth and productivityThe Australian economy is undergoing a major transformation. Its patchwork nature means some industries and regions are growing rapidly while others are finding it difficult to compete and remain profitable.
A highly skilled workforce ensures that our businesses are resilient, innovative and competitive in the global economy and individuals can secure a job and earn a good income.
Our $3 billion skills package from last year’s Budget has already committed funding for over 50,000 training places with business contributing around a third of the cost, and mentoring support for 12,000 apprentices.
Reform of the VET systemIn recent weeks the Government has secured COAG support for a $1.75 billion package to support lasting reforms to the national training system. This is in addition to the base agreement on skills funding with the states and territories worth $7.2 billion.
The reforms now agreed by COAG will:• skill more Australians through a
national training entitlement;
• reduce upfront costs for students through expanded access to HECS style income-contingent loans;
• provide better support for disadvantaged Australians; and
• improve the quality of training.
Driving the agendaIn this Budget, the Government is investing an additional $101 million over four years to support and build on the reform agenda.
Recently qualified tradespeople who want to set up their own business will be eligible for up to $5,000 in business skills training.
The Government is establishing three Australian Skills Centres of Excellence to support innovative teaching and learning methods in the VET sector.
The Government is also providing additional resourcing for the national VET regulator and for the new MySkills website to strengthen the quality of the national training system.
Key elements of the National Partnership Agreement on Skills Reform
Skills Reform
Access Transparency QualityEquity &
Efficiency
Support for disadvantaged
students
Incentives for higher completions
Entitlement to a minimum first Certificate III
Expanded access to income-contingent
loans
Better data collection, sharing
and publication
New Unique Student Identifier
External validation of assessments
National regulator
New My Skills website
23OVERVIEW
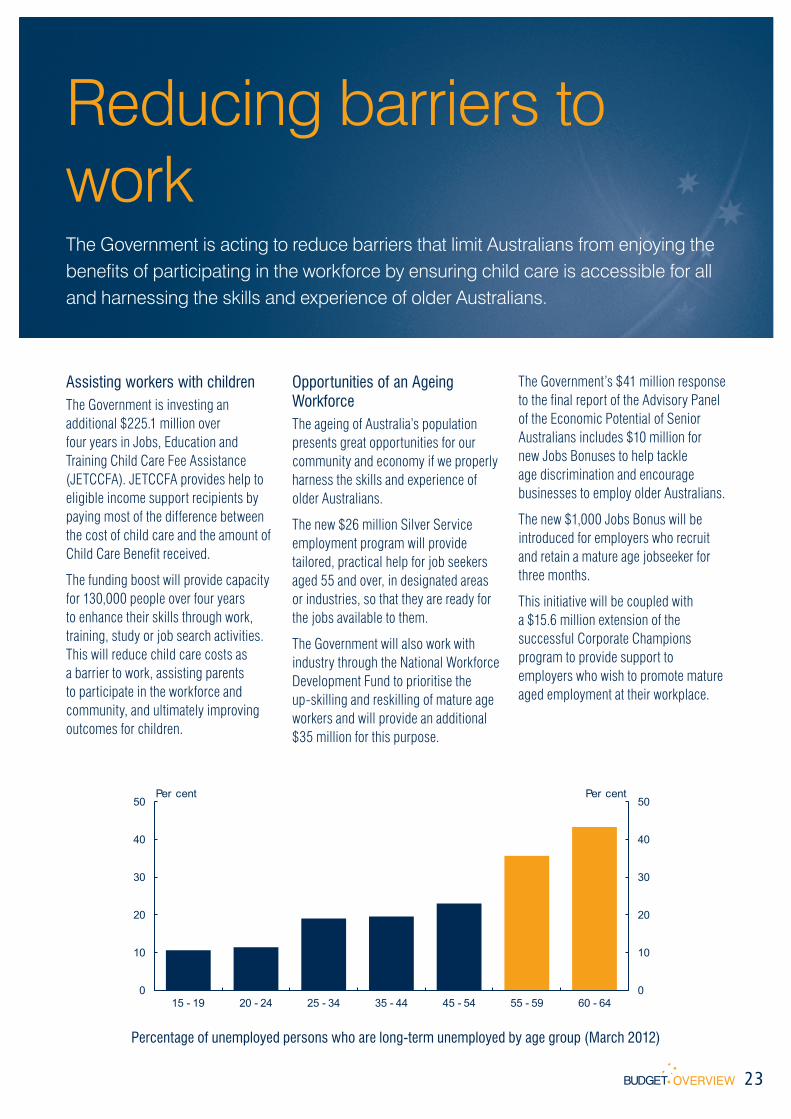
Reducing barriers to workThe Government is acting to reduce barriers that limit Australians from enjoying the benefits of participating in the workforce by ensuring child care is accessible for all and harnessing the skills and experience of older Australians.
Assisting workers with childrenThe Government is investing an additional $225.1 million over four years in Jobs, Education and Training Child Care Fee Assistance (JETCCFA). JETCCFA provides help to eligible income support recipients by paying most of the difference between the cost of child care and the amount of Child Care Benefit received.
The funding boost will provide capacity for 130,000 people over four years to enhance their skills through work, training, study or job search activities. This will reduce child care costs as a barrier to work, assisting parents to participate in the workforce and community, and ultimately improving outcomes for children.
Opportunities of an Ageing WorkforceThe ageing of Australia’s population presents great opportunities for our community and economy if we properly harness the skills and experience of older Australians.
The new $26 million Silver Service employment program will provide tailored, practical help for job seekers aged 55 and over, in designated areas or industries, so that they are ready for the jobs available to them.
The Government will also work with industry through the National Workforce Development Fund to prioritise the up-skilling and reskilling of mature age workers and will provide an additional $35 million for this purpose.
The Government’s $41 million response to the final report of the Advisory Panel of the Economic Potential of Senior Australians includes $10 million for new Jobs Bonuses to help tackle age discrimination and encourage businesses to employ older Australians.
The new $1,000 Jobs Bonus will be introduced for employers who recruit and retain a mature age jobseeker for three months.
This initiative will be coupled with a $15.6 million extension of the successful Corporate Champions program to provide support to employers who wish to promote mature aged employment at their workplace.
Percentage of unemployed persons who are long-term unemployed by age group (March 2012)
0
10
20
30
40
50
0
10
20
30
40
50
15 - 19 20 - 24 25 - 34 35 - 44 45 - 54 55 - 59 60 - 64
Per centPer cent

24 OVERVIEW
Expanding opportunity for all studentsThe Government’s education reforms are delivering real benefits to students from early childhood through to university.
Delivering on reformThe Australian Government has delivered a computer for every year 9 to 12 student in the country.
Undergraduate students in 2012 have increased by 150,000 over 2007 levels, driven by student demand, through the uncapping of places.
By 2013, an early childhood education place will be available for every child.
These reforms mean every student can get the great education they deserve.
Early ChildhoodResearch suggests that a child’s first five years set a course for the rest of their life. The Australian Government, in partnership with state and territory governments, is making a record
investment in early childhood, ensuring every child gets the opportunity for the best start in life.
Every child will have access to a quality early childhood education program for at least 15 hours per week in the year before they start school.
The new National Quality Agenda for early childhood education and care will also introduce improved, nationally consistent educator-to-child ratios and staff qualification requirements.
SchoolsIn addition to delivering a computer for every year 9 to 12 student and upgrading facilities at schools across the country, the Government is tackling educational disadvantage.
The Smarter Schools National Partnerships make major national investments in teacher quality, literacy and numeracy and support for disadvantaged students.
These targeted investments will support Australia’s first national curriculum and professional standards for teachers, ensuring every student gets an excellent education.
The Government is now working collaboratively with all stakeholders in considering the proposals of the Gonski Review of school funding, to deliver the best and fairest future funding model.
Commonwealth spending on the child care system and child care fee assistance
0
1
2
3
4
5
6
0
1
2
3
4
5
6
2003-04 2005-06 2007-08 2009-10 2011-12 2013-14 2015-16
$billion$billion
Child Care System Child Care Benefit Child Care Rebate
Estimates/projections
25OVERVIEW
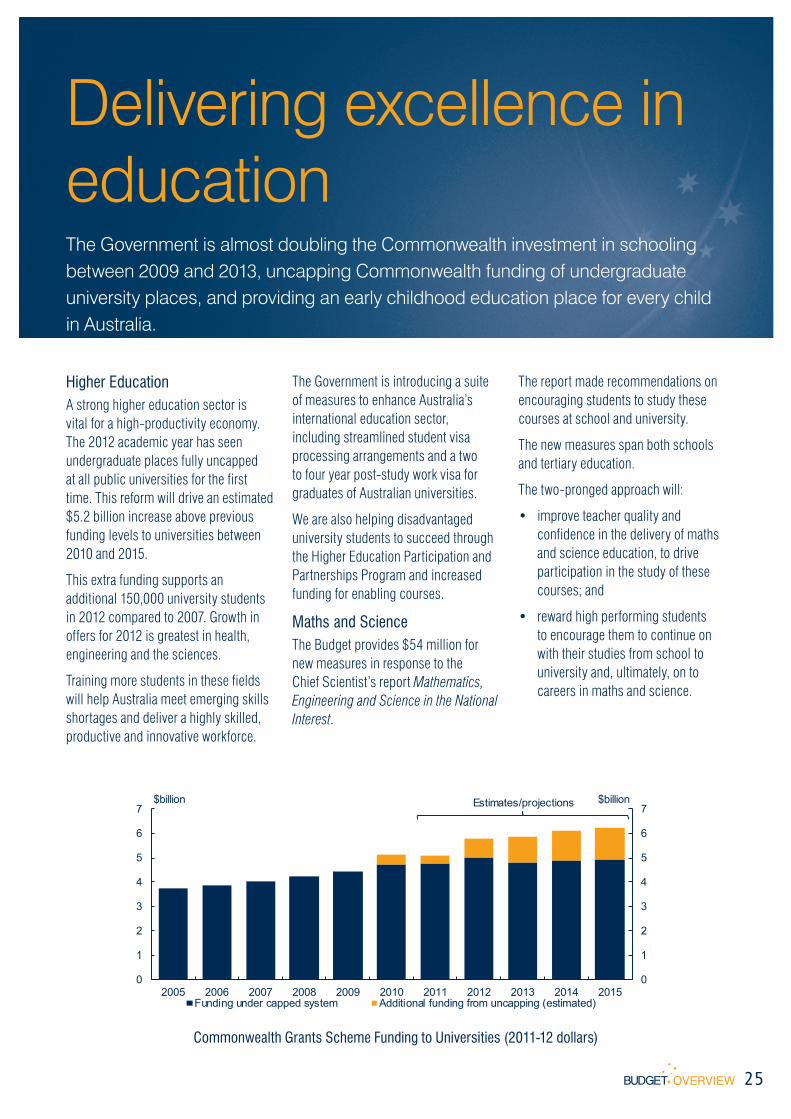
Delivering excellence in educationThe Government is almost doubling the Commonwealth investment in schooling between 2009 and 2013, uncapping Commonwealth funding of undergraduate university places, and providing an early childhood education place for every child in Australia.
Higher EducationA strong higher education sector is vital for a high-productivity economy. The 2012 academic year has seen undergraduate places fully uncapped at all public universities for the first time. This reform will drive an estimated $5.2 billion increase above previous funding levels to universities between 2010 and 2015.
This extra funding supports an additional 150,000 university students in 2012 compared to 2007. Growth in offers for 2012 is greatest in health, engineering and the sciences.
Training more students in these fields will help Australia meet emerging skills shortages and deliver a highly skilled, productive and innovative workforce.
The Government is introducing a suite of measures to enhance Australia’s international education sector, including streamlined student visa processing arrangements and a two to four year post-study work visa for graduates of Australian universities.
We are also helping disadvantaged university students to succeed through the Higher Education Participation and Partnerships Program and increased funding for enabling courses.
Maths and ScienceThe Budget provides $54 million for new measures in response to the Chief Scientist’s report Mathematics, Engineering and Science in the National Interest.
The report made recommendations on encouraging students to study these courses at school and university.
The new measures span both schools and tertiary education.
The two-pronged approach will:
• improve teacher quality and confidence in the delivery of maths and science education, to drive participation in the study of these courses; and
• reward high performing students to encourage them to continue on with their studies from school to university and, ultimately, on to careers in maths and science.
Commonwealth Grants Scheme Funding to Universities (2011-12 dollars)
0
1
2
3
4
5
6
7
0
1
2
3
4
5
6
7
2005 2006 2007 2008 2009 2010 2011 2012 2013 2014 2015
$billion$billion
Funding under capped system Additional funding from uncapping (estimated)
Estimates/projections

26 OVERVIEW
Stronger Futures in the Northern TerritoryThe Government is investing around $3.4 billion over ten years to work with Aboriginal people and the Northern Territory Government to Close the Gap in Indigenous disadvantage in the Northern Territory.
A consultative approach Reflecting our commitment to mutual respect and engagement with Indigenous communities, the Government undertook extensive consultations to determine what would happen after the Northern Territory Emergency Response (NTER) expired in mid-2012.
Those consultations showed that while there have been some improvements, communities remain concerned about several priority issues, including alcohol misuse, education, employment and community safety.
Stronger Futures in the NTThe Government has made a 10 year commitment to work with Aboriginal people in the NT to build
stronger futures. Towards this, the Commonwealth has committed:
• $713.5 million for primary health care and improved access to health and allied services;
• $694.9 million for community safety, remote policing and tackling alcohol abuse;
• $442.4 million to strengthen the safety and wellbeing of Aboriginal children and youth, plus $13.7 million for the Alice Springs Transformation Plan;
• $602.5 million to boost jobs and improve access to and quality of education (including $107.5 million for the Improving School Enrolment and Attendance through Welfare Reform Measure);
• $427.4 million will be invested to improve the way government and communities work together, including additional Indigenous engagement officers;
• $283.5 million to improve Indigenous housing; and
• $206.4 million to support basic essential and municipal services in NT outstations and homelands.
Components of Stronger Futures in the Northern Territory
Health $713 million
Alice Springs Transformation Plan
$13.7 million
Child, family and community services
$442 million
Remote Engagement$427 million
Municipal and Essential Services
$206 million
Housing $283 million
Food Security $41 million
Community Safety, Remote Policing and
Alcohol Abuse$695 million
Education and employment $603 million
27OVERVIEW
Continuing efforts to Close the GapThe Government remains committed to Closing the Gap in Indigenous disadvantage, and is continuing its efforts across a range of policy priorities, particularly in remote areas, where the largest disparities exist.
Improving economic participation The Government is supporting Indigenous economic development and opportunity, providing $1.6 billion over five years for:
• the Remote Jobs and Communities Program to provide an integrated approach to participation and employment services in remote areas;
• support for Indigenous education, including to attract high calibre teachers to remote areas;
• flexible provision of concessional home loans to assist Indigenous people to own their own home; and
• increasing Indigenous employment in the Australian Public Service.
Access to servicesTo underpin improvements that need to be made in remote areas, the Government is providing $43.4 million in 2012-13 for remote municipal services, and $21.2 million over four years to work with the Queensland Government for major infrastructure works in the Torres Strait.
Indigenous people will also benefit from $48.6 million for integrated health services, funded through the second regional-specific round of the Health and Hospitals Fund, and $30.6 million over four years for 200 culturally appropriate aged care places.
Recognising Indigenous culture The 2012-13 Budget includes several new initiatives that recognise the
unique and significant place of our first peoples. This includes around $80 million over four years:
• to establish a free-to-air Indigenous television channel, which will have national reach;
• to support the Australian Institute of Aboriginal and Torres Strait Islander Studies; and
• to continue to build understanding and support for constitutional recognition of Indigenous Australians.
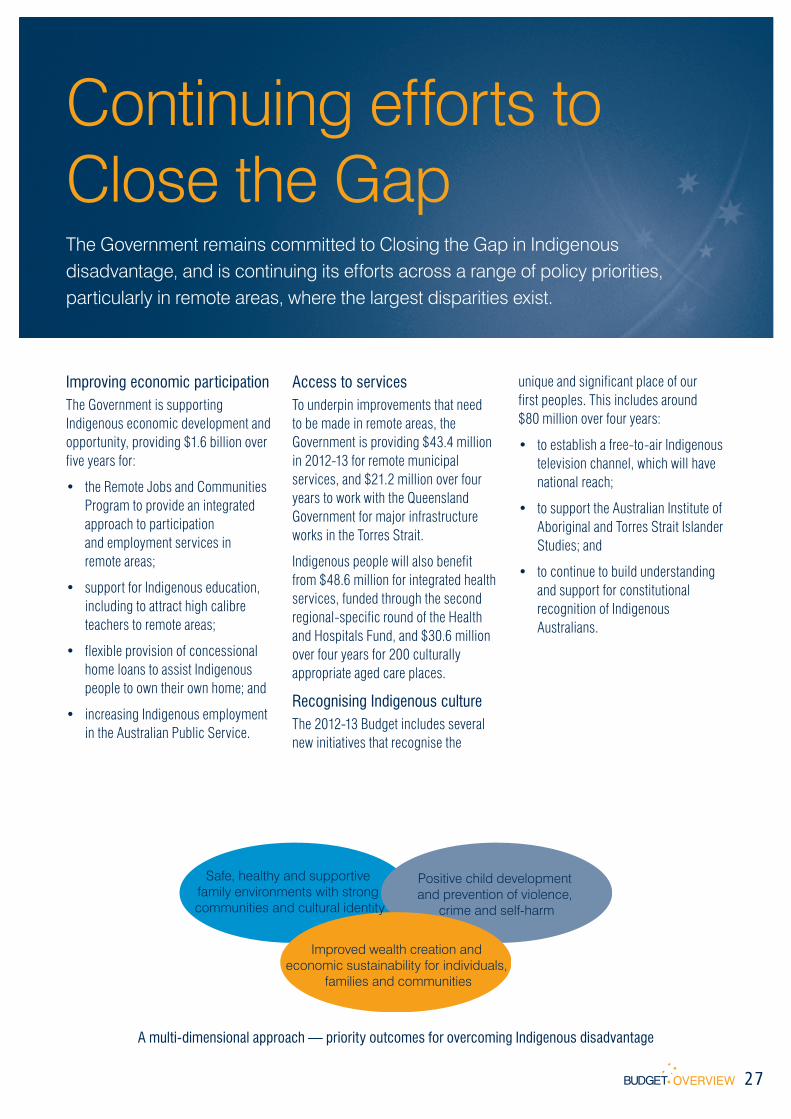
A multi-dimensional approach — priority outcomes for overcoming Indigenous disadvantage
Safe, healthy and supportive family environments with strong communities and cultural identity
Positive child development and prevention of violence,
crime and self-harm
Improved wealth creation and economic sustainability for individuals,
families and communities

28 OVERVIEW
Advancing our national security interestsThe Government will ensure that the Australian Defence Force (ADF) remains well-equipped for ongoing Defence operations, and to respond to humanitarian and disaster crises both at home and in our region.
Confronting security challengesThe 2012-13 Budget maintains Australia’s efforts in confronting global security challenges, including maintaining our presence in Afghanistan and supporting stability in East Timor and the Solomon Islands.
The Government is funding new defence capabilities that are expected to be in high demand now and into the future. These investments include vital air and sea transport platforms which support current operations and build on Australia’s capacity to respond to humanitarian crises and natural disasters domestically and in our region.
Maintaining Defence forces in a constrained fiscal environment The Department of Defence will contribute to broader government savings.
But the Government remains committed to ensuring the Australian Defence forces are properly funded and equipped for operations.
There will be no adverse impact on operations in Afghanistan, East Timor and the Solomon Islands. The provision of equipment to Defence personnel deployed or preparing to deploy overseas will not be adversely affected. There will be no adverse impact on the number of military personnel in the ADF.
Supporting peace in our region and around the worldThe Government is playing an important role in improving global security, and the budget invests in activities which support peace and stability around the world. This includes:
• $1.6 billion to continue Australia’s military and civilian efforts in Afghanistan and the Middle East;
• $79 million to maintain an ADF presence in East Timor during East Timorese national elections;
• $46 million for the ADF to support stability in the Solomon Islands; and
• a number of Australian Federal Police law enforcement capacity building deployments.
2010 Military Expenditure (US$2010) Per Capita for Australia, G7 countries and China
0
500
1000
1500
2000
2500
0
500
1000
1500
2000
2500
US Australia UK France Canada Italy Germany Japan China
$ per capita $ per capita

29OVERVIEW
Investing in Defence priority capabilitiesThe Government has announced a new Defence White Paper for 2013 which provides an opportunity to update our defence posture, future force structure and defence budget.
Investing in proven capabilitiesThe Government is focussed on capital investments that will improve Defence’s capacity to support global operations as well as help in humanitarian and disaster relief efforts.
The Government is providing $280 million for a sixth C-17A Globemaster III long-range heavy-lift aircraft. In 2011, Australia’s fleet of Globemasters supported overseas military operations, including in Afghanistan, provided assistance to Japan following the tsunami, and to Queensland following the floods and Cyclone Yasi.
The Government is also providing $40 million for two additional CH-47D Chinook transport helicopters.
The Chinook is a versatile helicopter that can be deployed in a range of scenarios including overseas military operations, disaster relief, and domestic search and rescue.
The Government will further provide $123 million for an Offshore Support Vessel (OSV) to be shared by the Department of Defence and the Australian Customs and Border Protection Service.
The OSV will be available to Defence to respond to domestic and international crises and will be also used by Customs for maritime surveillance, particularly in the Southern Ocean.
Long term Defence capabilitiesThese investments are balanced by adjusting the Defence capital investment program, including deferring or rescoping some Defence acquisitions, and delivering further operating efficiencies, while delivering on priority operational and 2009 Defence White Paper capabilities.
The Government has announced it will deliver a new Defence White Paper in 2013. Significant developments internationally and domestically since the 2009 White Paper are influencing Australia’s defence posture, future force structure and defence budget. It is important that these impacts are assessed through a proper process.
Average real national security funding
0
5
10
15
20
25
30
35
0
5
10
15
20
25
30
35
2001-02 to 2007-08 2008-09 to 2015-16
$billion$billion
Average real Defence Average real non-Defence national security

30 OVERVIEW
Engaging with our region and beyond The Government will continue to promote Australia’s national interests by strengthening our diplomatic presence abroad and increasing needed assistance to countries in our region and beyond, while continuing to grow Australia’s official development assistance (ODA).
Securing Australia’s interests abroadAn effective international diplomatic presence reinforces national security and enhances our prosperity.
The Government will provide $52.6 million over five years to fund new diplomatic posts in China and Senegal to support trade, investment and diplomacy in strategic locations.
Funding will also be provided to continue our diplomatic presence and political engagement in Afghanistan during the handover of security responsibility to the Afghan Government.
Providing assistance in our region and beyondThe Government will provide $5.2 billion in 2012-13 to assist development in our region and beyond.
This includes $384.5 million over four years to the Pacific to increase rates of child immunisation and improve access to education.
A further $208.6 million over four years will be provided to improve development outcomes in East Asia, including expanded assistance to Burma and Cambodia for programs addressing maternal and child health and for climate change mitigation programs in Vietnam.
Growing Australia’s foreign aid budgetWe are continuing to increase our ODA but will delay meeting our 0.5 per cent ODA to Gross National Income (GNI) target by one year to 2016-17. This will contribute to broader government savings.
Importantly, our aid will still grow every year and remain on track to double between 2007-08 and 2014-15.
Australia’s projected ODA contribution could see Australia rank as high as sixth in the OECD’s ODA donor ranking by 2015-16, up from tenth in 2011.
Australia’s increasing official development assistance
0.25
0.30
0.35
0.40
0.45
0.50
0.55
0.25
0.30
0.35
0.40
0.45
0.50
0.55
2007-08 2010-11 2013-14 2016-17
ODA/GNI (Per cent) ODA/GNI (Per cent)

31OVERVIEW
Strategic investment in border security The Budget provides targeted investment for our border security regime, maintenance of a strong biosecurity system and improving immigration processes.
Investing in key capabilitiesThe Government is investing in strategic border security and border control capabilities:
• a new forensic facility for the Australian Federal Police to help in investigations of terrorism, transnational crime, and disaster victim identification;
• a new vessel to guard against people smuggling, environmental degradation and illegal fishing at Ashmore Reef; and
• expanding the SmartGate system at international airports to allow more Australians returning from overseas to use ePassports to clear Customs instead of waiting in a queue.
Investing in biosecurityThe Government is investing strongly in Australia’s biosecurity system, including:
• $380 million over seven years to construct a new Commonwealth operated post-entry quarantine station, allowing industry to continue to safely import animals and plants into Australia while protecting our agricultural industries and the environment;
• $144 million over four years to continue to manage risks to the environment and agriculture; and
• $96 million over seven years to support eradication programs for nationally significant agricultural and environmental pests and diseases.
Improving immigration processesThis Budget provides $21 million to improve immigration processes by:
• streamlining protection visa assessment processes by transferring assessment duties to the Refugee Review Tribunal;
• helping asylum seekers who wish to return to their country of origin to do so; and
• reforming migration health requirements for both humanitarian and other visa applicants.
A strong maritime surveillance presence is deterring illegal foreign fishing
0
50
100
150
200
250
300
350
400
0
50
100
150
200
250
300
350
400
2004-05 2005-06 2006-07 2007-08 2008-09 2009-10 2010-11
NumberNumber
Apprehensions of illegal foreign fishing vessels

32 OVERVIEW
Commemorating the Centenary of AnzacThe Government will spend $83.5 million over seven years from 2012-13 to commemorate one hundred years since our nation’s involvement in the First World War.
Commemorating an historic event in our nation’s history Australia will commemorate the Centenary of Anzac between 2014 and 2018. This will mark one hundred years since our involvement in the First World War, including the Gallipoli landings on 25 April 1915 when the Anzac tradition was born.
The Centenary will be a unique opportunity to honour and reflect upon the service and sacrifice of our past and current servicemen and servicewomen in all wars, conflicts and peacekeeping operations.
The Government will provide opportunities for all Australians to participate in the commemoration.
Australian War Memorial The Australian War Memorial’s First World War Galleries will be refurbished at a cost of $27 million. A new permanent exhibition will, in particular, showcase the Memorial’s collections that relate to significant battles and the experiences of Australians who served.
The refurbishment will help conserve the heritage-listed dioramas and integrate new technologies to the galleries, providing new ways to illustrate the major campaigns of World War One.
The refurbishment will be a fitting tribute to all Australians who served in the First World War.
Supporting Community CommemorationTo give all Australians an opportunity to participate in the commemoration, a local grants program will be established to provide around $9.5 million to help fund local commemoration activities.
An Arts and Cultural Fund will also be established to support artists and cultural institutions to create commemorative displays and events.
To improve awareness of our military history, the Government will fund a communications program, including an education and multimedia element at a cost of around $3.4 million.
Average Anzac Day Dawn Service attendance at the Australian War Memorial
0
5,000
10,000
15,000
20,000
25,000
30,000
0
5,000
10,000
15,000
20,000
25,000
30,000
1998-2004 2005-2012
Average number of peopleAverage number of people

33OVERVIEW
Investing in our future sporting championsIn the lead up to the 2012 London Olympic Games, the Government will continue to invest in sport as an integral part of Australian culture.
Support for major eventsMajor sporting events like the 2012 London Olympic Games provide role models for future generations of Australians. In the four years to 2011-12, the Government has invested over $380 million to help our athletes succeed in London.
The Government is supporting major sporting events including the 2015 Cricket World Cup and 2015 Asian Cup by contributing:
• $50 million to the Stage 2 redevelopment of the Sydney Cricket Ground;
• $30 million to the redevelopment of the Adelaide Oval; and
• $15 million to the redevelopment of the Bellerive Oval in Hobart.
Keeping our kids active and safeThe Government is providing $39.2 million in 2013 to encourage children to participate in after-school sport and other physical activities through the Active After-School Communities program. Around 190,000 primary school children participate in the program.
We are funding a new initiative to reduce drowning among young children. The new initiative includes the development of water safety education material and a water safety curriculum that can be delivered in early childhood centres.
Investing in local sporting infrastructureThe Government is investing some $30 million in the 2012-13 Budget for local sporting infrastructure including $10 million for a new community sports centre in the Olympic Park Precinct in Melbourne.
The Government is allocating $5 million in western Sydney to support local football players and teams, as well as local football infrastructure and community engagement programs and $3 million towards the redevelopment of Football New South Wales headquarters.
Australia’s Olympic medal tally
0
10
20
30
40
50
60
70
0
10
20
30
40
50
60
70
1896 1912 1928 1948 1960 1972 1984 1996 2008
Number of medalsNumber of medals
Gold Silver Bronze

34 OVERVIEW
Targeted spending cuts
In returning to surplus the Government has ensured the budget is in good shape over the long term while maintaining our commitment to fairness and improving skills, health and education services.
Ensuring balanceWe are returning the budget to surplus through targeted spending cuts, which retain fairness, place the budget on firmer ground and achieve better value for taxpayers’ money.
Over $33.6 billion in saves have been identified in this Budget with less than half being tax. This builds on the over $100 billion of savings we identified over the last four Budgets.
In making these decisions we have applied our core values of protecting the most vulnerable in our community and the frontline services Australian families rely on.
We remain committed to providing the skills for tomorrow’s workforce and
continuing to improve our health and education systems.
By focusing on fairness and value for money the Government has been able to prioritise spending to people most in need.
Putting the budget on firmer groundThe Government is seeking greater efficiencies from the Australian Public Service. As announced in MYEFO an additional efficiency dividend of 2.5 per cent will apply to most Commonwealth agencies in 2012-13.
The Government has agreed to changes to the Pharmaceutical Benefits Scheme which will see more competitively priced medicines and the listing of new
items that can be used in place of more expensive medicines.
This will save $163.5 million, which is on top of the $1.9 billion in savings we have negotiated with the sector.
The Government is also better targeting the safety net arrangements under the Medicare Benefits Schedule including reducing opportunities for practitioners to charge excessive fees. This will save $96.5 million over four years.
We are better targeting support under the Family Tax Benefit system by limiting access to FTB-A to children under 18 or in full time secondary school.
Savings identified since the Mid-Year Economic and Fiscal Outlook 2011-12
0
2
4
6
8
10
12
0
2
4
6
8
10
12
2011-12 2012-13 2013-14 2014-15 2015-16
$billion$billion

35OVERVIEW
A better and fairer tax systemThe 2012-13 Budget includes tax reforms aimed at improving the fairness of the personal tax and superannuation systems.
Fairer access to superannuation concessionsThe Government is making the superannuation system fairer by reducing the tax concession which very high income earners receive on their concessional contributions, so it is more in line with the concession received by average income earners.
From 1 July 2012, individuals with income greater than $300,000 will have the tax concession on their contributions cut from 30 per cent to 15 per cent (excluding the Medicare levy).
This reform will affect around 128,000 people or 1.2 per cent of people contributing to superannuation.
It builds on the Low Income Superannuation Contribution which will make the system of superannuation concessions fairer for 3.6 million low income earners.
Better targeting tax concessionsThe Government will further reform the tax concession for living-away-from-home allowances and benefits, by ensuring it can only be used for the expenses of people who are legitimately maintaining a second home in addition to their actual home, for a maximum period of 12 months.
This reform will apply from 1 July 2012 for arrangements entered into after 7.30pm (AEST) on 8 May 2012, and from 1 July 2014 for arrangements entered into prior to that time.
From 1 July 2012, we will better target tax breaks for golden handshakes. To reduce this concession, which currently provides a greater benefit to high income earners, the tax break will only apply to that part of a payment that, when combined with other taxable income, does not exceed $180,000.
To improve participation incentives, eight dependency offsets will be consolidated into one, from 1 July 2012. This reflects community attitudes by targeting assistance to taxpayers with dependants who are genuinely unable to work.
Change in concession for superannuation contributions, 2012-13 (cents per dollar of contributions)
Change in concession for superannuation contributions, 2012-13 (average dollar value of total concession)
0
5
10
15
20
25
30
35
0
5
10
15
20
25
30
35
$30,000 $70,000 Top 1 percent
Before reforms
After reforms
Cents per dollar Cents per dollar
Taxable income
$0
$1,000
$2,000
$3,000
$4,000
$5,000
$6,000
$7,000
$0
$1,000
$2,000
$3,000
$4,000
$5,000
$6,000
$7,000
$30,000 $70,000 Top 1 percent
Before reforms
After reforms
Average dollar value
Taxable income

36 OVERVIEW
APPENDIX A
Australian Government budget aggregatesThe table below shows the main cash and accrual budget aggregates for the Australian Government general government sector over the period 2010-11 to 2015-16. The underlying cash surplus is estimated to be $1.5 billion in 2012-13. In accrual terms, a fiscal surplus of $2.5 billion is expected.
Actual Estimates Projections2010-11 2011-12 2012-13 2013-14 2014-15 2015-16
$b $b $b $b $b $bReceipts(a) 302.0 330.0 368.8 392.5 413.6 438.4Per cent of GDP 21.6 22.3 23.8 24.0 24.0 24.2
Payments(b) 346.1 371.3 364.2 387.3 404.9 427.3Per cent of GDP 24.7 25.1 23.5 23.7 23.5 23.6
Future Fund earnings 3.7 3.0 3.0 3.2 3.4 3.7
Underlying cash balance(c) -47.7 -44.4 1.5 2.0 5.3 7.5Per cent of GDP -3.4 -3.0 0.1 0.1 0.3 0.4
Revenue(a) 309.9 336.4 376.1 402.2 424.8 449.6Per cent of GDP 22.1 22.8 24.2 24.6 24.7 24.8
Expenses 356.1 373.7 376.3 398.5 416.4 439.0Per cent of GDP 25.4 25.3 24.3 24.4 24.2 24.2
Net operating balance -46.2 -37.3 -0.2 3.7 8.4 10.5Net capital investment 5.3 4.7 -2.7 1.0 1.4 1.1
Fiscal balance -51.5 -42.0 2.5 2.6 7.0 9.5Per cent of GDP -3.7 -2.8 0.2 0.2 0.4 0.5
Memorandum item:Headline cash balance -51.1 -48.4 -8.7 -6.8 -0.1 2.0
(a) Includes expected Future Fund earnings.(b) Equivalent to cash payments for operating activities, purchases of non-financial assets and net acquisition of assets under finance leases.(c) Excludes expected Future Fund earnings.

37OVERVIEW
APPENDIX B
Assessment against the fiscal targetIn this Budget, the Government is delivering on its fiscal strategy, returning the budget to surplus in 2012-13 and strengthening surpluses in each of the next four years.
2011-12 2012-13 2013-14 2014-15 2015-16 Total$m $m $m $m $m $m
Effect of policy decisions since MYEFO (a)
Spends -2,917 -1,744 -4,278 -6,695 -6,801 -22,435
Saves 216 4,668 8,212 9,187 11,323 33,605
Payments 140 2,606 4,531 4,144 4,949 16,370Non-tax Receipts 6 466 194 312 316 1,294Tax Receipts 70 1,596 3,487 4,730 6,058 15,941
Total effect of policy decisions -2,701 2,924 3,934 2,491 4,522 11,170since MYEFOAdd Contingency Reserve
offsets to policy decisions 27 126 191 2,425 3,080 5,849
Net budget impact of policy decisions -2,674 3,050 4,125 4,916 7,603 17,019
Estimates Projections
(a) On an underlying cash basis.

38 OVERVIEW
APPENDIX C
Helping households with the cost of livingThe spending power of Australian households has increased over the term of this Government, thanks to four years’ worth of tax cuts and other benefits to help families and pensioners to make ends meet. In addition, a Schoolkids Bonus will replace the Education Tax Refund and be paid directly to eligible recipients as a guaranteed payment rather than a tax refund. A new Supplementary Allowance will help the unemployed, young Australians and parents with young children to help them meet the costs of essential bills with the first payment commencing in March 2013.
Estimated improvement in the real disposable incomes and net tax thresholds of different household types from 2007-08 to 2012-13 (a)Household type (wage as a percentage of the average wage)
2007-08 2012-13 (b) % change 2007-08 2012-13 (b) % changeSingle person (67%) $35,922 $39,434 9.8% $20,508 $22,328 8.9%Single person (100%) $49,968 $54,419 8.9% $20,508 $22,328 8.9%Single person (167%) $77,063 $83,614 8.5% $20,508 $22,328 8.9%Sole parent (0%) $29,800 $31,901 7.1% $56,676 $59,605 5.2%Sole parent (67%) $50,615 $54,698 8.1% $56,676 $59,605 5.2%Single income couple (133%) (c) $66,645 $71,324 7.0% $36,822 $37,771 2.6%Single income couple (167%) (c) $79,405 $85,966 8.3% $36,822 $37,771 2.6%Dual income couple (100% & 33%) $69,617 $76,606 10.0% $38,135 $39,194 2.8%Dual income couple (100% & 67%) $85,890 $93,853 9.3% $38,264 $40,860 6.8%Single income couple with children (100%) $60,302 $64,422 6.8% $56,676 $59,605 5.2%Single income couple with children (133%) $72,519 $77,954 7.5% $56,676 $59,605 5.2%Single income couple with children (167%) $84,990 $87,964 3.5% $56,676 $59,605 5.2%Dual income couple with children (100% & 33%) (d) $78,155 $86,328 10.5% $67,331 $73,397 9.0%Dual income couple with children (100% & 67%) (d) $95,483 $102,072 6.9% $71,442 $80,603 12.8%Dual income couple with children (167% & 100%) (d) $133,135 $145,312 9.1% $70,663 $79,494 12.5%Single pensioner (0%) (e) $16,087 $19,726 22.6% $30,175 $34,123 13.1%Pensioner couple (0% & 0%) (e) $26,514 $29,741 12.2% $49,151 $60,457 23.0%
Real disposable income Real net tax threshold($2011-12) ($2011-12)
(a) The average weekly ordinary time earnings (AWOTE) for full-time employees is used as the average wage. Disposable income is the sum of private income and government cash transfers less net tax paid. The net tax threshold is the private income above which taxes paid exceed cash benefits received. Families with children have two children, aged 3 and 8 years. Families hold Private Health Insurance cover.
(b) Inclusive of the Clean Energy Advances which are paid to assist households with the impact of the carbon price in 2012-13.(c) The spouses of single income couples without children are 60 years old. Consequently, their partners may be eligible for the Dependant Spouse Tax Offset.(d) The hourly rate of child care is $5.70 per hour in 2007-08 and $7.30 per hour in 2012-13. For the calculation of real disposable incomes, the younger child is in
long day care for 2 days, 4 days and 5 days per week for families earning 100% & 33%, 100% & 67% and 167% & 100%, respectively. For the calculation of net tax thresholds, the hours of care are consistent with the income of the second earner. The older child is not in care.
(e) In calculating net tax thresholds, income is assumed to be from investments which earn a rate of return, equal to the current deeming rates. The calculations include the effects of the assets test.
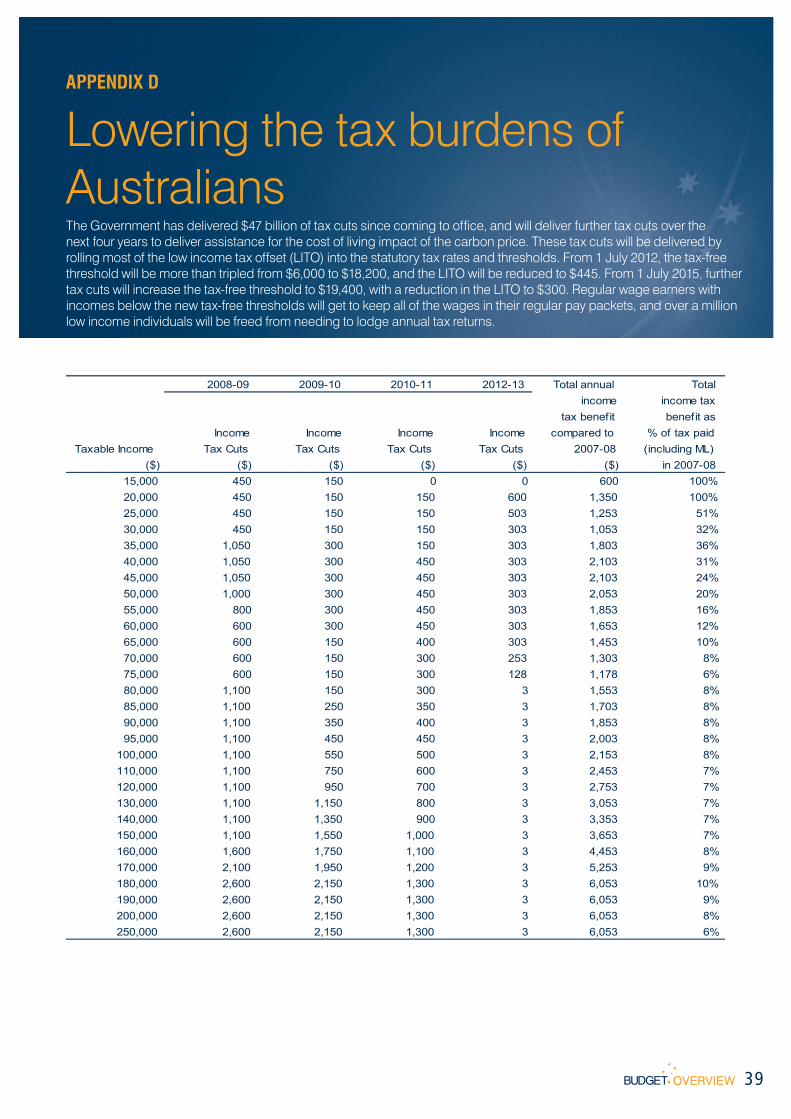
39OVERVIEW
APPENDIX D
Lowering the tax burdens of AustraliansThe Government has delivered $47 billion of tax cuts since coming to office, and will deliver further tax cuts over the next four years to deliver assistance for the cost of living impact of the carbon price. These tax cuts will be delivered by rolling most of the low income tax offset (LITO) into the statutory tax rates and thresholds. From 1 July 2012, the tax-free threshold will be more than tripled from $6,000 to $18,200, and the LITO will be reduced to $445. From 1 July 2015, further tax cuts will increase the tax-free threshold to $19,400, with a reduction in the LITO to $300. Regular wage earners with incomes below the new tax-free thresholds will get to keep all of the wages in their regular pay packets, and over a million low income individuals will be freed from needing to lodge annual tax returns.
2008-09 2009-10 2010-11 2012-13 Total annual Total income income tax
tax benefit benefit asIncome Income Income Income compared to % of tax paid
Taxable Income Tax Cuts Tax Cuts Tax Cuts Tax Cuts 2007-08 (including ML)($) ($) ($) ($) ($) ($) in 2007-08
15,000 450 150 0 0 600 100%20,000 450 150 150 600 1,350 100%25,000 450 150 150 503 1,253 51%30,000 450 150 150 303 1,053 32%35,000 1,050 300 150 303 1,803 36%40,000 1,050 300 450 303 2,103 31%45,000 1,050 300 450 303 2,103 24%50,000 1,000 300 450 303 2,053 20%55,000 800 300 450 303 1,853 16%60,000 600 300 450 303 1,653 12%65,000 600 150 400 303 1,453 10%70,000 600 150 300 253 1,303 8%75,000 600 150 300 128 1,178 6%80,000 1,100 150 300 3 1,553 8%85,000 1,100 250 350 3 1,703 8%90,000 1,100 350 400 3 1,853 8%95,000 1,100 450 450 3 2,003 8%
100,000 1,100 550 500 3 2,153 8%110,000 1,100 750 600 3 2,453 7%120,000 1,100 950 700 3 2,753 7%130,000 1,100 1,150 800 3 3,053 7%140,000 1,100 1,350 900 3 3,353 7%150,000 1,100 1,550 1,000 3 3,653 7%160,000 1,600 1,750 1,100 3 4,453 8%170,000 2,100 1,950 1,200 3 5,253 9%180,000 2,600 2,150 1,300 3 6,053 10%190,000 2,600 2,150 1,300 3 6,053 9%200,000 2,600 2,150 1,300 3 6,053 8%250,000 2,600 2,150 1,300 3 6,053 6%

40 OVERVIEW
APPENDIX E
Major initiatives in the 2012-13 BudgetThe table below provides a summary of major initiatives in the 2012-13 Budget and their impact on the fiscal balance. More comprehensive information is provided in Budget Paper No. 2, Budget Measures 2012-13.
2011-12 2012-13 2013-14 2014-15 2015-16 Total$m $m $m $m $m $m
Spreading benefits of the boom and support for familiesIncreasing the rate of Family Tax Benefit Part A 0.0 -0.3 -602.9 -615.4 -625.8 -1,844.4New income support supplement 0.0 -152.7 -298.9 -305.7 -313.0 -1,070.3Replacing the Education Tax Refund with a Schoolkids Bonus -516.4 -426.2 -370.9 -375.3 -393.5 -2,082.2
Helping the most vulnerable in societyFirst stage of a National Disability Insurance Scheme 0.0 -83.9 -234.3 -345.4 -363.0 -1,026.5Dental health - Alleviating pressure on public dental waiting lists 0.0 -70.0 -155.8 -120.0 0.0 -345.9Dental health - Increasing the capacity of the dental workforce 0.0 -14.4 -51.0 -47.3 -45.9 -158.6
Building an aged care system for the futureAddressing workforce pressures 0.0 -1.8 -110.5 -232.0 -372.8 -717.1Residential care 0.0 -22.6 -27.0 -142.0 -205.2 -396.9Staying at home -0.1 -2.9 -26.5 -98.6 -104.7 -232.7Tackling dementia 0.0 -15.5 -30.7 -28.6 -29.3 -104.2Older Australians with diverse backgrounds 0.0 -6.0 -27.4 -30.4 -33.1 -96.9
Helping businesses to investIntroduction of loss carry-back for businesses 0.0 -6.7 -155.3 -251.2 -300.7 -713.9
Nation building infrastrutureAdditional funding for Pacific Highway(a) 0.0 0.0 -231.0 -1,025.0 -1,400.0 -2,656.0Roads to Recovery program - continuation(a) 0.0 0.0 0.0 -350.0 -350.0 -700.0Intermodal Terminal at Moorebank in Western Sydney 0.0 -0.1 0.1 -342.9 -15.0 -357.9Torrens and Goodwood Junctions rail project 0.0 0.0 0.0 0.0 -232.1 -232.1Black Spots program - continuation(a) 0.0 0.0 0.0 -60.0 -60.0 -120.0
Building opportunities for a more productive workforceReform of Jobs, Education and Training Child Care Fee Assistance -0.5 -39.5 -37.7 -62.2 -85.8 -225.6
Program - introduction of a package of reformsRemote Jobs and Communities program - establishment 0.0 0.0 -38.7 -48.8 -50.0 -137.5
of the Community Development ProgramMeasures to improve the quality of skills 0.0 -20.8 -31.7 -25.3 -23.4 -101.1Measures to encourage participation of older Australians in the 0.0 -10.2 -14.9 -19.8 -22.1 -67.0
workforce and the communityOther priorities
National eHealth program - continuation -33.4 -79.2 -121.0 0.0 0.0 -233.7Reforming Australia's Biosecurity system - new Post-Entry 0.0 -27.7 -101.4 -69.2 -22.3 -220.5
Quarantine facilityDefence operations 0.0 -1,087.1 -215.3 -133.2 -50.0 -1,485.6
(a) These programs will be funded out of the Nation Building Program 2 provision in the contingency reserve and so have no net budget impact.

41OVERVIEW
APPENDIX F
Major savings in the 2012-13 BudgetThe table below provides a summary of major savings in the 2012-13 Budget and their impact on the fiscal balance. More comprehensive information is provided in Budget Paper No. 2, Budget Measures 2012-13.
2 0 11- 12 2 0 12 - 13 2 0 13 - 14 2 0 14 - 15 2 0 15 - 16 Tota l$ m $ m $ m $ m $ m $ m
Spreading the benefits of the boomDo not proceed with the company tax cut 50.0 316.6 1,232.2 1,596.0 1,561.0 4,755.8
Reprioritising the tax reform agendaDo not proceed with standard deduction 0.0 2.5 91.9 600.0 1,400.0 2,094.4Superannuation - Deferral of higher concessional 0.0 602.7 745.0 129.5 -17.7 1,459.5
contributions capDo not proceed with 50 per cent discount on interest 0.0 7.3 37.2 323.2 555.8 923.5Tax Breaks for Green Buildings - closure 0.8 4.2 14.2 104.0 282.0 405.2
Improving fairness in the tax systemFurther reform of living-away-from-home allowances 0.0 47.1 212.2 347.6 394.4 1,001.3
and benefitsSuperannuation - Reduction of higher tax concession for 0.0 -15.6 174.3 332.0 455.9 946.5
contributions of very high income earnersChanges to the Net Medical Expenses Tax Offset 0.0 0.0 115.0 125.0 130.0 370.0Better targeting of the employment termination payment 17.1 14.7 49.7 54.9 60.0 196.4
tax offsetDuty free allowances - cigarettes and tobacco 0.0 115.0 150.0 160.0 175.0 600.0
Compliance measuresGST - compliance program - two year extension 0.0 0.0 0.0 228.6 203.5 432.1
DefenceDefence - Efficiencies and reprogramming 0.0 965.7 1,625.9 1,137.5 1,703.5 5,432.5
Official development assistanceOfficial development assistance - deferring Australia's 0.0 447.2 782.6 823.4 866.7 2,920.0
growth targetBetter targeting spending
Parenting Payment - changed eligibility for 1 July 2006 0.0 96.9 204.7 159.3 224.9 685.8grandfathered recipients
Family Tax Benefit Part A - change to age of eligibility 0.0 46.4 103.5 104.6 106.4 360.9Pharmaceutical Benefits Scheme - price changes 3.6 25.9 24.4 25.0 25.7 104.6Extended Medicare Safety Net - capping benefits 0.0 8.7 24.9 29.1 33.8 96.5
including for items with excessive feesAustralian Apprenticeships Incentives Program - better 0.0 59.5 99.8 97.8 96.6 353.6
targetingPortability of Australian Government Payments 0.0 13.2 36.0 38.1 39.9 127.2Practice Incentives Program (PIP) – more effective targeting 0.0 1.1 30.9 26.5 24.9 83.5
Other revenueHeavy Vehicle Road User Charging 0.0 166.0 172.0 177.0 183.0 698.0Passenger Movement Charge - increase 0.0 85.0 140.0 175.0 210.0 610.0Dividend payments from Australian
Reinsurance Pool Corporation 0.0 175.0 75.0 75.0 75.0 400.0Australian Federal Police - Partial Cost Recovery 0.0 0.0 38.2 39.3 40.5 118.1
of Airport Policing Other 143.1 1,231.1 1,717.5 2,073.8 2,263.9 7,429.4Total saves (a) 214.4 4,416.1 7,897.1 8,982.1 11,094.9 32,604.7
(a) In underlying cash terms, the Budget delivers savings of $33.6 billion over five years.

42 OVERVIEW
APPENDIX G
Australian Government taxation and spendingThe charts below summarises Australian Government revenues and expenses for 2012-13 on an accrual basis. Total revenue for 2012-13 is expected to be $376.1 billion, a decrease of 1.7 per cent on estimated revenue since the Mid-Year Economic and Fiscal Outlook 2011-12. Total expenses for 2012-13 are expected to be $376.3 billion, a decrease of 1.0 per cent on
estimated expenses since the Mid-Year Economic and Fiscal Outlook 2011-12.
Where revenue comes from
Where taxpayers’ money is spent
Fringe benefits taxation$3,900 million
Carbon pricingmechanism$7,690 million
Superannuationtaxation$8,250 million
Company andresource rent taxes$82,442 million
Salestaxes$51,716million
Petroleum excise$17,790 million
Other excise$9,095 million
Customs duty$7,370 million
All other functions$40,433 million
Other purposes$69,994 million
Defence$21,559 million General public
services$22,054 million
Social security and welfare $131,656 million
Health$61,003 millionEducation
$29,572 million
Other taxation$3,323 million
Non-tax revenue$21,445 million
Individualsincometaxation$163,050million

43OVERVIEW
APPENDIX H
Detailed economic forecasts
The table below shows the Government’s macroeconomic forecasts(a). The Australian economy is expected to grow 3¼ per cent in 2012-13 and 3 per cent in 2013-14. More comprehensive information is provided in Budget Paper No. 1, Budget Strategy and Outlook 2012-13, Statement 2.
Outcomes(b)
2010-11 2011-12 2012-13 2013-14
Panel A - Demand and output(c)Household consumption 3.1 3 1/4 3 3
Private investmentDwellings 3.0 -1 0 2 1/2Total business investment(d) 5.6 18 12 1/2 8
Non-dwelling construction(d) 8.8 25 14 7 1/2Machinery and equipment(d) 3.0 16 1/2 12 1/2 8 1/2
Private final demand(d) 3.3 6 5 4 1/4Public final demand(d) 3.4 1 1/2 - 1/2 0Total final demand 3.3 5 3 3/4 3 1/4
Change in inventories(e) 0.5 0 0 0
Gross national expenditure 3.8 5 4 3 1/2
Exports of goods and services 0.2 4 4 1/2 4 1/2Imports of goods and services 10.4 12 1/2 7 1/2 5 1/2
Net exports(e) -2.0 -2 - 3/4 - 1/2
Real gross domestic product 2.0 3 3 1/4 3Non-farm product 1.9 3 1/4 3 1/4 3Farm product 7.1 -6 2 1
Nominal gross domestic product 8.3 5 1/2 5 5 1/4
Panel B - Other selected economic measuresExternal accounts
Terms of trade 20.6 3 1/4 -5 3/4 -3 1/4Current account balance (per cent of GDP) -2.4 -3 -4 3/4 -6
Labour marketEmployment (labour force survey basis)(f) 2.2 1/2 1 1/4 1 1/2Unemployment rate (per cent)(g) 4.9 5 1/4 5 1/2 5 1/2Participation rate (per cent)(g) 65.5 65 1/4 65 1/4 65 1/4
Prices and wagesConsumer price index(h) 3.6 1 1/4 3 1/4 2 1/2Gross non-farm product deflator 6.0 2 1/2 1 3/4 2 1/4Wage price index(f) 3.8 3 1/2 3 3/4 3 3/4
Forecasts
(a) Percentage change on preceding year unless otherwise indicated.(b) Calculated using original data unless otherwise indicated.(c) Chain volume measures except for nominal gross domestic product which is in current prices.(d) Excluding second-hand asset sales from the public sector to the private sector.(e) Percentage point contribution to growth in GDP.(f) Seasonally adjusted, through-the-year growth rate to the June quarter.(g) Seasonally adjusted rate for the June quarter.(h) Through-the-year growth rate to the June quarter.Note: The forecasts for the domestic economy are based on several technical assumptions. The exchange rate is assumed to remain around its recent average level — a trade-weighted index of around 77 and a US$ exchange rate of around 103 US cents. Interest rates are assumed to move broadly in line with market expectations. World oil prices (Malaysian Tapis) are assumed to remain around US$126 per barrel. The farm sector forecasts are based on average seasonal conditions in 2012-13 and 2013-14.Source: Australian Bureau of Statistics (ABS) cat. no. 5206.0, 5302.0, 6202.0, 6345.0, 6401.0, unpublished ABS data and Treasury.

44 OVERVIEW
APPENDIX I
Historical budget and net financial worth dataThe table below provides historical data and forward estimates for Australian Government general government sector cash receipts, cash payments, the underlying cash balance and net financial worth. More comprehensive information is provided in Budget Paper No. 1, Budget Strategy and Outlook in 2011-12, Statement 10.
1978-791979-801980-811981-821982-831983-841984-851985-861986-871987-881988-891989-901990-911991-921992-931993-941994-951995-961996-971997-981998-991999-002000-012001-022002-032003-042004-052005-062006-072007-082008-092009-102010-112011-12(e)2012-13(e)2013-14(e)2014-15(p)2015-16(p)
Receipts
$m26,12930,32135,99341,49945,46349,98158,81766,20674,72483,49190,74898,625
100,22795,84097,633
103,824113,458124,429133,592140,736152,063166,199182,996187,588204,613217,775235,984255,943272,637294,917292,600284,662302,024329,976368,774392,544413,618438,373
Per centof GDP
22.022.523.623.624.023.425.025.426.225.724.724.424.122.622.022.222.923.524.023.924.525.125.924.825.525.325.625.725.225.123.422.021.622.323.824.024.024.2
Payments
$m28,27231,64236,17641,15148,81056,99064,85371,32877,15882,03985,32692,684
100,665108,472115,751122,009127,619135,538139,689140,587148,175153,192177,123188,655197,243209,785222,407240,136253,321271,843316,046336,900346,102371,337364,209387,299404,892427,251
Per centof GDP
23.823.523.723.425.826.727.527.427.025.323.222.924.225.626.026.125.725.625.123.923.823.125.125.024.624.424.224.123.423.125.226.024.725.123.523.723.523.6
$m-2,142-1,322
-184348
-3,348-7,008-6,037-5,122-2,4341,4525,4215,942-438
-12,631-18,118-18,185-14,160-11,109-6,099
1493,889
13,0075,872
-1,0677,3707,990
13,57715,75617,18219,704
-27,079-54,750-47,746-44,402
1,5362,0445,3187,469
Per centof GDP
-1.8-1.0-0.10.2
-1.8-3.3-2.6-2.0-0.90.41.51.5
-0.1-3.0-4.1-3.9-2.9-2.1-1.10.00.62.00.8
-0.10.90.91.51.61.61.7
-2.2-4.2-3.4-3.00.10.10.30.4
Underlyingcash
balance(a)
$mnanananananananananananananananananananana
-68,178-73,097-79,012-84,645-74,159-60,257-63,440-39,976-18,070-74,094
-147,168-200,810-251,297-248,642-244,263-235,855-225,781
Per centof GDP
nanananananananananananananananananananana
-10.3-10.3-10.5-10.6-8.6-6.5-6.4-3.7-1.5-5.9
-11.4-14.3-17.0-16.0-15.0-13.7-12.4
worthNet financial
(a) Excludes Future Fund earnings from 2005-06 onwards.(e) Estimates.(p) Projections.na Data not available.