Embed Size (px)
Citation preview

1
BJTM COMPANY PERFORMANCE 7M16
2
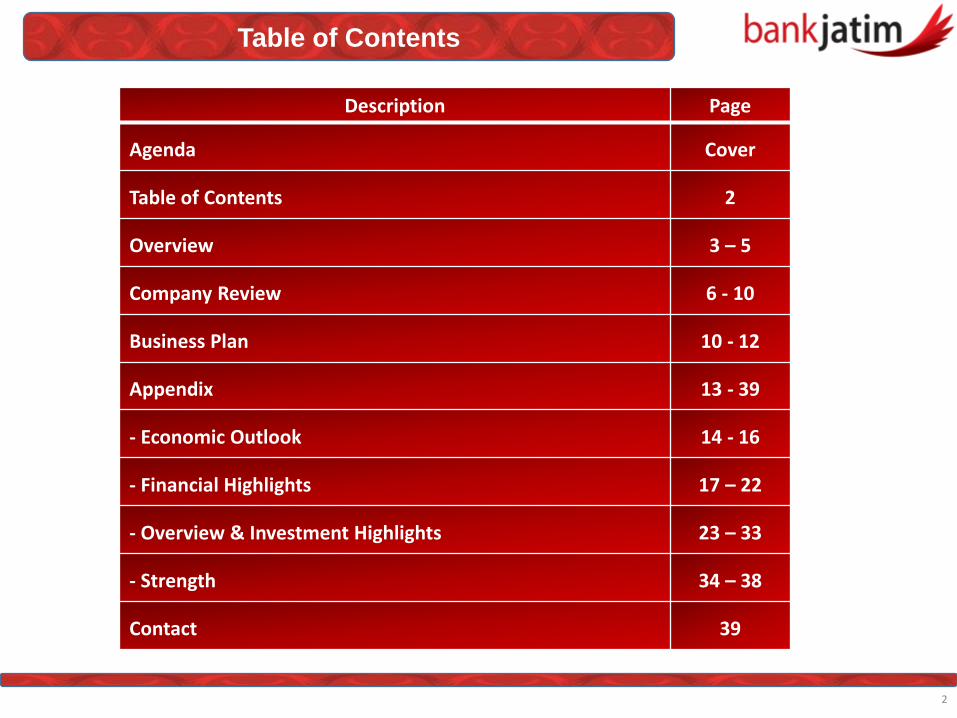
Table of Contents
Description Page
Agenda Cover
Table of Contents 2
Overview 3 ndash 5
Company Review 6 - 10
Business Plan 10 - 12
Appendix 13 - 39
- Economic Outlook 14 - 16
- Financial Highlights 17 ndash 22
- Overview amp Investment Highlights 23 ndash 33
- Strength 34 ndash 38
Contact 39
3
OVERVIEW
4
ASSET YoY Growth (318)
FUND
YoY Growth 215bull Current Account 129bull Saving Account 1371bull Time Deposit (595)
7M16 Overview
Improvement
Human Capital
And
IT Management 2016
LOAN
YoY Growth 222bull Commercial (489)bull SME (369)bull Consumer 632
RATIO
CASA 7056COF 283ROA 296ROE 1941
NET PROFIT YoY Growth 1937
5
STRENGTHbull Micro loan at 2 years NPL 082bull Multipurpose loan NPL 039
STOCK
bull (66 Foreign Shareholder)bull High Dividend Yield historybull Dividend Growthbull BJTM Price July 29 2016
IDR 585 sharebull PBV 139bull EPS 7036bull PER 831
7M16 Overview
The 1st Champion of
Indonesia Original
Brands Category
Regional Bank 2016
NPLbull NPL May 2016 479bull NPL June 2016 458bull NPL July 2016 483
6
COMPANY REVIEW
7
LOANIn million Rp
7M15 7M16 YoY
Loan 28654214 29290730 222
- Commercial 6204245 5900919 -489
- SME 4787018 4610501 -369
- Consumer 17662952 18779310 632
Financial Performance
bull Multi-purpose credit still becomes the largest contributor
bull Standby loan credit facilities start running again with collateral regulations adjustmentand more prudential analysis
bull Adjust with single digit rate from OJK PundiKencana (SME) Credit Facility implemented with 10 rate and micro credit from government funding with rate under 10
FUNDIn million Rp
7M15 7M16 YoY
Third Party Fund 41644181 42537452 215
- Current Account 17698264 17926232 129
- Saving Account 10629904 12087219 1371
- Time Deposit 13316012 12524002 -595
bull Current account and Saving account increase low rate cost funding
bull Deposits with high interest rates have been reduced to lower the interest expense
8
InformationIn million Rp
7M15 7M16 YoY
Net Interest Income 1813868 1969020 855
Net Non Interest Operational Income
(Expense)(1119825) (1124772) 044
Net profit 512966 612315 1937
- ROA 274 296
- ROE 1599 1941
- NIM 655 665
Financial Performance
bull Dealer Treasury activityrsquos become thesignificant contributor for interest income the portion up to 20 from interest income
bull Operational profit increased due to higher interest income and lower impairment losses
9
Non Performing Loan
bull Bank Jatim still faces the non performing loan and yet to decrease the rising of the NPL last year was caused by
- Commercial credit npl standby loan and keppres
- Multipurpose npl from death and fired people decrease from insurance claim
- Financial Services Authority policy on lending quality of sharia rural bank based on capital adequate ratio level
bull Bank Jatimrsquos Credit Risk Division and Adhoc team keep attempting to reduce the NPL
bull The current NPL comes from the same debtors similar to last year and we still maintain the debtor to restructuring or rescheduling the credit based on their business Some of the standby loanrsquos debtors are waiting from the appeal completion in court
bull Managementrsquos efforts to reduce NPL are by conducting collection and auction the collateral
bull Strengthening capability assessment for credit officer improvement credit regulation and reconstruction of credit intern law
NPL 1H15 9M15 FY15 1M16 2M16 3M16 4M16 5M16 1H16 7M16
Consumer 075 086 074 077 081 082 085 089 085 091
SME 759 802 1111 1144 1165 1162 1154 1146 1136 1160
Commercial 978 1053 997 1159 1146 1142 1133 1181 1127 1190
NPL GROSS 382 422 429 451 457 459 465 479 458 483
Coverage Ratio 7582 8428 8102 8214 8217 8087 8194 8420 8337 8512
10
BUSINESS PLAN
11
Business Plan 2016
Description 2015 2016 E
Total Asset 1265 536
Loan 846 1207
Third Party Fund 1319 505
Financial Ratio
- CAR 2122 1899
- LDR 8292 8846
- NPL Gross 429 425
- NIM 641 744
- BOPO 7611 8454
- ROE 1611 1838
- ROA 267 321
LOAN STRATEGY
bull Credit for vehicle acquirement
bull Increasing MoU with government institutions for multipurpose also private corporates
bull Intensifying linkage program to rural bank members of Perbamida or Perbarindo
FUNDING STRATEGY
bull Cooperating with competent institutions to distribute school operational fund
bull Expanding funding networks
bull Intensifying new funding products implementation
bull Pricing Strategy for lower interest rate
NPL STRATEGY
bull Collection with credit restructuring
bull Special collection for rest of government payment project terms
bull Insurances claim accelerations and recoveries
bull Collateral auction
GENERAL STRATEGY
bull Revitalization into competence and professional human capital to shape competency based on resource management
bull Development and reorganization of head office and branches for customer centric
12
NETWORK
Network 2009 2010 2011 2012 2013 2014 2015 7M16NETWORK
2016
SHARIA
2016
Head Office 1 1 1 1 1 1 1 1 1
Branch Office 39 41 41 41 41 43 45 46 1 2
Sub Branch
Office26 44 67 81 107 153 165 166 5 10
Cash office 151 154 164 164 176 165 185 185 9 6
Sharia service
office37 37 47 47 47 97 97 97 94
Payment Point 78 88 115 138 155 167 171 173 8 7
Mobile cash 45 49 57 57 59 62 65 78 11 6
Mobile ATM - 4 4 6 6 6 6 6
CDM 1 1 1 1 1 2 2 2
ATM 87 142 262 368 479 595 688 692 13 15
Total network 465 561 759 904 1072 1291 1425 1446
13
APPENDIX
14
ECONOMIC OUTLOOK
550 525 525
575 575 600725 750 750 750 750 775 750
675 650 650
430
590 590
840 838732
670
453
836
335
445345 321
FY12 3M13 1H13 9M13 FY13 3M14 1H14 9M14 FY14 FY15 3M16 1H16 7M16
LOANbillion
FUNDbillion
JIBOR
INFLASI
BI RATE
LOANbillion
FUNDbillion
INFLASI
BI RATE
BI 7-Day Repo Rate
15Source Bank Indonesia
MACRO ECONOMY REVIEW
In billion Rp
3225198 3243136 3374272 3526188 3663968 3618064 3834503 3995803 4114420 4198577 4319749 4464083 4413056 4478409
2725674 2787372 2982436 3170805 3319842 3334011 3494968 3592087 3706501 3713544 3861172 3990464 4092104 4035929
FY12 3M13 1H13 9M13 FY13 3M14 1H14 9M14 FY14 3M15 1H15 9M15 FY15 4M16
NATIONALYoY
EAST JAVAYoY
16Source East Java Gov
East Java amp National BPS
Regional Economic Growth
640562 521 512 500 500 471 470 473 479 492
727
615 640 594 591 590518 525 544 544 534
FY12 FY13 3M14 1H14 9M14 FY14 3M15 1H15 9M15 FY15 3M16
17
FINANCIAL HIGHLIGHTS
18
Balance Sheet
InformationIn million Rp
7M15 7M16 YoY
Total Asset 49222516 50786968 318
Placement BI amp SBI 14108042 11775816 -1653
Loan 28654214 29290730 222
Allowance for Impairment Losses (937449) (1203961) 2843
Third Party Fund 41644181 42537452 215
- Current Account 17698264 17926232 129
- Saving Account 10629904 12087219 1371
- Time Deposit 13316012 12524002 -595
Equity 5922719 6266316 580
19
Profit amp Loss
InformationIn million Rp
7M15 7M16 YoY
Interest Income 2636359 2792540 592
Interest Expense (822491) (823520) 013
Nett Interest Income 1813868 1969020 855
Non Interest Operational Income 274986 257429 -638
Non Interest Operational Expense (1394811) (1058368) -2412
Provision for Impairment Losses (428576) (323833) -2444
Nett Non Interest Operational Income (Expense)
(1119825) (1124772) 044
Operational Profit 694043 844248 2164
Non Operational Profit 41924 4298 -8975
Pre Tax Profit 735967 848546 1530
Taxes (223001) (236231) 593
Net profit 512966 612315 1937
142 157 163 174200
249291
331
380
525 508
46 55 74
101
131
161 186
223
262
287 293
120 132 137 145162
201222
260
303
446425
04 0405 05
09 09
0708
094
118
06106
07 07 07 0708
0908
12
134
082
17 172 21
27 28 2933
41
46
279
TOTAL ASSET (Rp Tril)
INTEREST INCOME (Rp Tril) INTEREST EXPENSE (Rp Tril)
CAGR =
1261
CAGR =
1142
CAGR =
1256
NET PROFIT (Rp Tril)
THIRD PARTY FUND(Rp Tril)
CAGR =
1533
LOAN (Rp Tril)
CAGR =
2153
CAGR =
1524
20
Financial Performance
R
O
A
R
O
E
N
I
M
Financial Ratio
23
261
414 407
355394
375
558
497
334
382352
267
380
318296
2004 2005 2006 2007 2008 2009 2010 2011 2012 2013 2014 2015 3M16 1H16 7M16
3054
36903848
308531482859
4057
3365
1896190418981611
23492087
1941
2004 2005 2006 2007 2008 2009 2010 2011 2012 2013 2014 2015 3M16 1H16 7M16
910 939 934
728
835766
917
795
648714 690
641683 669 665
2004 2005 2006 2007 2008 2009 2010 2011 2012 2013 2014 2015 3M16 1H16 7M16
L
D
R
C
A
R
B
O
P
O
22
Financial Ratio
4545 4513
38754211
5404
6967
8070 80118355 8498 8654
8292
68117264
6886
2004 2005 2006 2007 2008 2009 2010 2011 2012 2013 2014 2015 3M16 1H16 7M16
15291817
3845
3339
2536
21321919
1653
26562372
2217 21221946 2065 2047
2004 2005 2006 2007 2008 2009 2010 2011 2012 2013 2014 2015 3M16 1H16 7M16
7467 73836943 6820 6742 6604
5958 6002
6869 7028 6963
7611
6532
70567232
2004 2005 2006 2007 2008 2009 2010 2011 2012 2013 2014 2015 3M16 1H16 7M16
23
OVERVIEW amp INVESTMENT HIGHLIGHTS
24
Current AccountYoY 129
Saving AccountYoY 1371
Time DepositYoY (595)
Third Party Fund
9662
12083
9969
16563
11649
18292
20116
17698
13494
21037
15345
17926
81747064
9970
8082
10991
9172 9128
10630
12753
1098712379 12087
4374
8269
6048
10834
7630
10509
13437 13316
8016
9482
12578 12524
FY12 1H13 FY13 1H14 FY14 3M15 1H15 7M15 FY15 3M16 1H16 7M16
Current Account
Saving Account
Time Deposit
In Billion Rp
In Billion Rp
Government Current
Acc
YoY (1752)
Private Current Acc
YoY 20528
YoY
SIMPEDA 1091
SIKLUS 4390
Hajj Saving 289
TabunganKu 2476
Barokah Saving 3115
Time Deposit
YoY (595)
25
Detailed Third Party Fund
13821 11959 7220 14710 15803 16204 17985
5718 16715
10411 13365
2742 3491 4429
3582 4313 1494 1596
7776
4322 4933
4561
1H14 9M14 FY14 3M15 1H15 7M15 9M15 FY15 3M16 1H16 7M16
Current Account
Government Private
241 290 657 418 535 560 581 861 674 752 806 179 194 208 218 199 204 215 224 230 208 210
6946 7682
9239 7705 7543
8977 8535
10561 9046
10330 9957
651 687
795
748 762
797 814
994
925
980 994
65 70
93
83 87
92 94
112
112
110 120
1H14 9M14 FY14 3M15 1H15 7M15 9M15 FY15 3M16 1H16 7M16
Saving Account
SIKLUS Hajj Saving SIMPEDA TabunganKu Barokah Saving
10834 11331 7630 10509 13437 13316 13934 8016 9482 12578 12524
1H14 9M14 FY14 3M15 1H15 7M15 9M15 FY15 3M16 1H16 7M16
Time Deposit
26
Third Party Fund Customer
In million Rp
FY12 3M13 1H13 9M13 FY13 3M14 1H14 9M14 FY14 3M15 1H15 9M15 FY15 1H16 7M16
44
13
7
43
63
4
44
25
4
45
33
4
46
85
3
47
01
4
48
35
8
49
41
1
50
13
4
50
92
7
53
65
8
54
36
9
51
36
1
53
33
7
53
49
3
20
45
785
21
00
510
21
44
912
25
11
507
41
26
826
41
61
277
41
99
590
42
55
204
43
33
820
44
03
899
44
62
107
45
43
12
9
46
26
910
48
21
838
48
39
565
23
61
6
24
42
5
24
53
8
25
27
4
26
17
6
25
27
7
27
20
9
28
17
3
29
19
4
30
72
8
30
78
8
32
69
2
34
16
7
35
87
2
36
77
2
Total Customer
Current Account Saving Account Time Deposit
21831
27733 27304 27883
21277 24866
34252 31270
23236
35918 37489 36015
26273 28769
33511
399 322 329 303 242 199 192 210 254 208 205 225 276 257 250
18521 27761
33698 33250
23107
32546
39819 40218
26134
34200
43644 42621
23462
35063 34059
FY12 3M13 1H13 9M13 FY13 3M14 1H14 9M14 FY14 3M15 1H15 9M15 FY15 1H16 7M16
Ticket Size
Current Account Saving Account Time Deposit
27
Competitive Product
CONSUMER
COMMERCIAL
SME
CONSUMER LOAN Julyrsquo15 Julyrsquo16
Multipurpose 5447 5597
Mortgage 481 514
Others 236 301
Total 6164 6411
COMMERCIAL LOAN Julyrsquo15 Julyrsquo16
Standby Loan 374 224
Keppres 370 354
Overdraft 963 986
Syndicate 458 452
Total 2165 2015
Small Medium Ent Julyrsquo15 Julyrsquo16
KUR 241 082
Pundi Kencana 392 428
Jatim Mikro 160 188
Others 879 877
Total 1671 1574
28
Loan Proportion
In Billion Rp
YoY
Consumer
632
Commercial
(489)
SME
(369)
29
Type Of Loan
15599 16224 16711 17064 17575 17663 17939 18186 18427 18875 18779
5019 5624 5180 5054
6024 6204 6586 5697 5334 5789 5901
4203 4239 4304 4450 4689 4787 4710 4528 4507 4612 4611
1H14 9M14 FY14 3M15 1H15 7M15 9M15 FY15 3M16 1H16 7M16
Consumer Commercial SME
In Billion Rp
YoY
Multi
purpose
503
Mortgage
919
Others
3012
30
Type Of Loan
13864 14408
14849 15152 15609 15608 15794 15924 16117
16499 16394
1177 1233 1299 1340 1369 1379 1399 1434 1465 1502 1505
559 583 563 572 597 677 746 827 845 875 880
1H14 9M14 FY14 3M15 1H15 7M15 9M15 FY15 3M16 1H16 7M16
CONSUMER LOAN
Multipurpose Mortgage Others
In Billion Rp
YoY
Standby
Loan
(3877)
Keppres
(235)
Overdraft
462
Syndicate
071
31
Type Of Loan1
0
75
12
86
10
13
81
2
10
23
10
71
12
44
84
7
59
4
65
6
65
6
82
4 11
57
68
7
44
9
97
8
10
60
13
37
74
8
55
9
96
4
10
35
22
17
22
59
23
08
25
75
27
41
27
59
26
92
27
66
28
22
28
67
28
87
90
3
92
2
11
71
12
18
12
81
13
14
13
14
13
36
13
60
13
01
13
23
1H14 9M14 FY14 3M15 1H15 7M15 9M15 FY15 3M16 1H16 7M16
Commercial Loan
Standby Loan Keppres Overdraft Syndicate
In Billion Rp
YoY
KUR
(6532)
Pundi
Kencana
1163
Mikro
2031
Others
200
32
Type Of Loan1218
1128
1058
893
735
689
601
451
347
258
239
693
747
796
950
1108
1123
1157
1178
1223
1273
1254
78
165
264
345
452
457
491
520
530
557
550
2214
2199
2186
2262
2395
2517
2461
2380
2407
2523
2568
1H14 9M14 FY14 3M15 1H15 7M15 9M15 FY15 3M16 1H16 7M16
SME Loan
KUR Pundi Kencana Mikro Others
33
Type Of Loan
26
22
93
26
06
47
25
96
58
26
17
30
26
36
14
26
39
07
25
45
01
25
34
43
25
37
33
25
35
85
85
98
96
44
87
30
71
94
96
70
11
5
82
83
64
64
02
91
60
94
88
45
9
51
43
9
86
42
7
49
43
2
81
45
2
44
44
1
49
41
6
35
41
8
61
42
3
00
42
2
37
1H14 9M14 FY14 3M15 1H15 9M15 FY15 3M16 1H16 7M16
Total Customer
Consumer Commercial SME
5947 6225 6436 652 6667 6797 7146 7271 7439 7406
58231 58311 5933
702662292
56868
68119
83319
63196 62194
9147 9637 10069 1028 10366 10669 10877 10767 10903 10916
1H14 9M14 FY14 3M15 1H15 9M15 FY15 3M16 1H16 7M16
Ticket Size
Consumer Commercial SME
34
STRENGTH
35
Strength Of Funding
517
460 477426
403435
463 480431 407 435
384 385 394 421
246
254 288
362358
241
250284 359
354368
384 363 372284
237 285 235212
239 237287
237 210 239197
232 252 234294
2002 2003 2004 2005 2006 2007 2008 2009 2010 2011 2012 2013 2014 2015 7M16
Time deposit Saving deposit Current account
448 453
300 253 302 318 321261
316 354 348268 301
368256 301 284 283
492 500
275239
310 328 331
258326
381 371
267345
395
250277 297 296
3M12 1H12 9M12 FY12 3M13 1H13 9M13 FY13 3M14 1H14 9M14 FY14 3M15 1H15 FY15 3M16 1H16 7M16
Cost of Fund(+) Local Government (-) Local Government
Description Details
Civil Servants (per December 2014) 426545
Multipurpose Customer (Civil Servants) 238965
5602
NPL 039 as of Julyrsquo 2016
36
Strength of Loan (Multipurpose Loan)
567 593 612 619 631 640
666 675 690 686
1H14 9M14 FY14 3M15 1H15 9M15 FY15 3M16 1H16 7M16
Multiguna Ticket Size (million) Rp
13864
14408
14849
15152
1560915794
1592416117
1649916394
1H14 9M14 FY14 3M15 1H15 9M15 FY15 3M16 1H16 7M16
Multiguna Loan Balance
( Billion Rp )
Foreign Institution Investor
7260 from public shares
Foreign Institution Investor
6581 from public shares
Public shares 20
from paid capital Domestic Investor
3419 from public shares
Domestic Investor
2740 from public shares
37
No Country Share
1 INDONESIA 3419402 LUKSEMBURG 161267
3 AMERIKA 1341304 NORWEGIA 1111345 SIPRUS 838626 FINLANDIA 577797 VIRGIN ISLAND 41059
8 INGGRIS 223339 IRLANDIA 17073
10 AUSTRALIA 0964611 JEPANG 0839812 KANADA 05512
No Country Share
14 SWEDIA 0248915 SINGAPURA 0201816 CAYMAN ISLAND 0060317 GREENLAND 0033118 CINA 0019319 SWITSERLAND 0011320 KOREA SELATAN 0007421 FILIPINA 0002222 MALAYSIA 0001523 HONGKONG 0000824 JERMAN 00001
Total 100
STRENGTH OF INSTITUTIONS INVESTOR
38
Awards amp Achievements
The Most Trusted Banking in
Microfinance Services of The
Year 2015
Very Good Predicate for 2014
Financial Performance
Infobank Awards 2015
Bank Jatim Regional Banks with
excellent service of the year
2016
Excellence in Building and
Managing Corporate Image
Corporate Image Award 2015
The 1st Champion of Indonesia
Original Brand 2015
Top BPD HRampIT Management
2016
39
Investor Relations (IR)
Corporate Secretary
(031) 5310090 ext 469
Email irubankjatimcoid
Contact
2
Table of Contents
Description Page
Agenda Cover
Table of Contents 2
Overview 3 ndash 5
Company Review 6 - 10
Business Plan 10 - 12
Appendix 13 - 39
- Economic Outlook 14 - 16
- Financial Highlights 17 ndash 22
- Overview amp Investment Highlights 23 ndash 33
- Strength 34 ndash 38
Contact 39
3
OVERVIEW
4
ASSET YoY Growth (318)
FUND
YoY Growth 215bull Current Account 129bull Saving Account 1371bull Time Deposit (595)
7M16 Overview
Improvement
Human Capital
And
IT Management 2016
LOAN
YoY Growth 222bull Commercial (489)bull SME (369)bull Consumer 632
RATIO
CASA 7056COF 283ROA 296ROE 1941
NET PROFIT YoY Growth 1937
5
STRENGTHbull Micro loan at 2 years NPL 082bull Multipurpose loan NPL 039
STOCK
bull (66 Foreign Shareholder)bull High Dividend Yield historybull Dividend Growthbull BJTM Price July 29 2016
IDR 585 sharebull PBV 139bull EPS 7036bull PER 831
7M16 Overview
The 1st Champion of
Indonesia Original
Brands Category
Regional Bank 2016
NPLbull NPL May 2016 479bull NPL June 2016 458bull NPL July 2016 483
6
COMPANY REVIEW
7
LOANIn million Rp
7M15 7M16 YoY
Loan 28654214 29290730 222
- Commercial 6204245 5900919 -489
- SME 4787018 4610501 -369
- Consumer 17662952 18779310 632
Financial Performance
bull Multi-purpose credit still becomes the largest contributor
bull Standby loan credit facilities start running again with collateral regulations adjustmentand more prudential analysis
bull Adjust with single digit rate from OJK PundiKencana (SME) Credit Facility implemented with 10 rate and micro credit from government funding with rate under 10
FUNDIn million Rp
7M15 7M16 YoY
Third Party Fund 41644181 42537452 215
- Current Account 17698264 17926232 129
- Saving Account 10629904 12087219 1371
- Time Deposit 13316012 12524002 -595
bull Current account and Saving account increase low rate cost funding
bull Deposits with high interest rates have been reduced to lower the interest expense
8
InformationIn million Rp
7M15 7M16 YoY
Net Interest Income 1813868 1969020 855
Net Non Interest Operational Income
(Expense)(1119825) (1124772) 044
Net profit 512966 612315 1937
- ROA 274 296
- ROE 1599 1941
- NIM 655 665
Financial Performance
bull Dealer Treasury activityrsquos become thesignificant contributor for interest income the portion up to 20 from interest income
bull Operational profit increased due to higher interest income and lower impairment losses
9
Non Performing Loan
bull Bank Jatim still faces the non performing loan and yet to decrease the rising of the NPL last year was caused by
- Commercial credit npl standby loan and keppres
- Multipurpose npl from death and fired people decrease from insurance claim
- Financial Services Authority policy on lending quality of sharia rural bank based on capital adequate ratio level
bull Bank Jatimrsquos Credit Risk Division and Adhoc team keep attempting to reduce the NPL
bull The current NPL comes from the same debtors similar to last year and we still maintain the debtor to restructuring or rescheduling the credit based on their business Some of the standby loanrsquos debtors are waiting from the appeal completion in court
bull Managementrsquos efforts to reduce NPL are by conducting collection and auction the collateral
bull Strengthening capability assessment for credit officer improvement credit regulation and reconstruction of credit intern law
NPL 1H15 9M15 FY15 1M16 2M16 3M16 4M16 5M16 1H16 7M16
Consumer 075 086 074 077 081 082 085 089 085 091
SME 759 802 1111 1144 1165 1162 1154 1146 1136 1160
Commercial 978 1053 997 1159 1146 1142 1133 1181 1127 1190
NPL GROSS 382 422 429 451 457 459 465 479 458 483
Coverage Ratio 7582 8428 8102 8214 8217 8087 8194 8420 8337 8512
10
BUSINESS PLAN
11
Business Plan 2016
Description 2015 2016 E
Total Asset 1265 536
Loan 846 1207
Third Party Fund 1319 505
Financial Ratio
- CAR 2122 1899
- LDR 8292 8846
- NPL Gross 429 425
- NIM 641 744
- BOPO 7611 8454
- ROE 1611 1838
- ROA 267 321
LOAN STRATEGY
bull Credit for vehicle acquirement
bull Increasing MoU with government institutions for multipurpose also private corporates
bull Intensifying linkage program to rural bank members of Perbamida or Perbarindo
FUNDING STRATEGY
bull Cooperating with competent institutions to distribute school operational fund
bull Expanding funding networks
bull Intensifying new funding products implementation
bull Pricing Strategy for lower interest rate
NPL STRATEGY
bull Collection with credit restructuring
bull Special collection for rest of government payment project terms
bull Insurances claim accelerations and recoveries
bull Collateral auction
GENERAL STRATEGY
bull Revitalization into competence and professional human capital to shape competency based on resource management
bull Development and reorganization of head office and branches for customer centric
12
NETWORK
Network 2009 2010 2011 2012 2013 2014 2015 7M16NETWORK
2016
SHARIA
2016
Head Office 1 1 1 1 1 1 1 1 1
Branch Office 39 41 41 41 41 43 45 46 1 2
Sub Branch
Office26 44 67 81 107 153 165 166 5 10
Cash office 151 154 164 164 176 165 185 185 9 6
Sharia service
office37 37 47 47 47 97 97 97 94
Payment Point 78 88 115 138 155 167 171 173 8 7
Mobile cash 45 49 57 57 59 62 65 78 11 6
Mobile ATM - 4 4 6 6 6 6 6
CDM 1 1 1 1 1 2 2 2
ATM 87 142 262 368 479 595 688 692 13 15
Total network 465 561 759 904 1072 1291 1425 1446
13
APPENDIX
14
ECONOMIC OUTLOOK
550 525 525
575 575 600725 750 750 750 750 775 750
675 650 650
430
590 590
840 838732
670
453
836
335
445345 321
FY12 3M13 1H13 9M13 FY13 3M14 1H14 9M14 FY14 FY15 3M16 1H16 7M16
LOANbillion
FUNDbillion
JIBOR
INFLASI
BI RATE
LOANbillion
FUNDbillion
INFLASI
BI RATE
BI 7-Day Repo Rate
15Source Bank Indonesia
MACRO ECONOMY REVIEW
In billion Rp
3225198 3243136 3374272 3526188 3663968 3618064 3834503 3995803 4114420 4198577 4319749 4464083 4413056 4478409
2725674 2787372 2982436 3170805 3319842 3334011 3494968 3592087 3706501 3713544 3861172 3990464 4092104 4035929
FY12 3M13 1H13 9M13 FY13 3M14 1H14 9M14 FY14 3M15 1H15 9M15 FY15 4M16
NATIONALYoY
EAST JAVAYoY
16Source East Java Gov
East Java amp National BPS
Regional Economic Growth
640562 521 512 500 500 471 470 473 479 492
727
615 640 594 591 590518 525 544 544 534
FY12 FY13 3M14 1H14 9M14 FY14 3M15 1H15 9M15 FY15 3M16
17
FINANCIAL HIGHLIGHTS
18
Balance Sheet
InformationIn million Rp
7M15 7M16 YoY
Total Asset 49222516 50786968 318
Placement BI amp SBI 14108042 11775816 -1653
Loan 28654214 29290730 222
Allowance for Impairment Losses (937449) (1203961) 2843
Third Party Fund 41644181 42537452 215
- Current Account 17698264 17926232 129
- Saving Account 10629904 12087219 1371
- Time Deposit 13316012 12524002 -595
Equity 5922719 6266316 580
19
Profit amp Loss
InformationIn million Rp
7M15 7M16 YoY
Interest Income 2636359 2792540 592
Interest Expense (822491) (823520) 013
Nett Interest Income 1813868 1969020 855
Non Interest Operational Income 274986 257429 -638
Non Interest Operational Expense (1394811) (1058368) -2412
Provision for Impairment Losses (428576) (323833) -2444
Nett Non Interest Operational Income (Expense)
(1119825) (1124772) 044
Operational Profit 694043 844248 2164
Non Operational Profit 41924 4298 -8975
Pre Tax Profit 735967 848546 1530
Taxes (223001) (236231) 593
Net profit 512966 612315 1937
142 157 163 174200
249291
331
380
525 508
46 55 74
101
131
161 186
223
262
287 293
120 132 137 145162
201222
260
303
446425
04 0405 05
09 09
0708
094
118
06106
07 07 07 0708
0908
12
134
082
17 172 21
27 28 2933
41
46
279
TOTAL ASSET (Rp Tril)
INTEREST INCOME (Rp Tril) INTEREST EXPENSE (Rp Tril)
CAGR =
1261
CAGR =
1142
CAGR =
1256
NET PROFIT (Rp Tril)
THIRD PARTY FUND(Rp Tril)
CAGR =
1533
LOAN (Rp Tril)
CAGR =
2153
CAGR =
1524
20
Financial Performance
R
O
A
R
O
E
N
I
M
Financial Ratio
23
261
414 407
355394
375
558
497
334
382352
267
380
318296
2004 2005 2006 2007 2008 2009 2010 2011 2012 2013 2014 2015 3M16 1H16 7M16
3054
36903848
308531482859
4057
3365
1896190418981611
23492087
1941
2004 2005 2006 2007 2008 2009 2010 2011 2012 2013 2014 2015 3M16 1H16 7M16
910 939 934
728
835766
917
795
648714 690
641683 669 665
2004 2005 2006 2007 2008 2009 2010 2011 2012 2013 2014 2015 3M16 1H16 7M16
L
D
R
C
A
R
B
O
P
O
22
Financial Ratio
4545 4513
38754211
5404
6967
8070 80118355 8498 8654
8292
68117264
6886
2004 2005 2006 2007 2008 2009 2010 2011 2012 2013 2014 2015 3M16 1H16 7M16
15291817
3845
3339
2536
21321919
1653
26562372
2217 21221946 2065 2047
2004 2005 2006 2007 2008 2009 2010 2011 2012 2013 2014 2015 3M16 1H16 7M16
7467 73836943 6820 6742 6604
5958 6002
6869 7028 6963
7611
6532
70567232
2004 2005 2006 2007 2008 2009 2010 2011 2012 2013 2014 2015 3M16 1H16 7M16
23
OVERVIEW amp INVESTMENT HIGHLIGHTS
24
Current AccountYoY 129
Saving AccountYoY 1371
Time DepositYoY (595)
Third Party Fund
9662
12083
9969
16563
11649
18292
20116
17698
13494
21037
15345
17926
81747064
9970
8082
10991
9172 9128
10630
12753
1098712379 12087
4374
8269
6048
10834
7630
10509
13437 13316
8016
9482
12578 12524
FY12 1H13 FY13 1H14 FY14 3M15 1H15 7M15 FY15 3M16 1H16 7M16
Current Account
Saving Account
Time Deposit
In Billion Rp
In Billion Rp
Government Current
Acc
YoY (1752)
Private Current Acc
YoY 20528
YoY
SIMPEDA 1091
SIKLUS 4390
Hajj Saving 289
TabunganKu 2476
Barokah Saving 3115
Time Deposit
YoY (595)
25
Detailed Third Party Fund
13821 11959 7220 14710 15803 16204 17985
5718 16715
10411 13365
2742 3491 4429
3582 4313 1494 1596
7776
4322 4933
4561
1H14 9M14 FY14 3M15 1H15 7M15 9M15 FY15 3M16 1H16 7M16
Current Account
Government Private
241 290 657 418 535 560 581 861 674 752 806 179 194 208 218 199 204 215 224 230 208 210
6946 7682
9239 7705 7543
8977 8535
10561 9046
10330 9957
651 687
795
748 762
797 814
994
925
980 994
65 70
93
83 87
92 94
112
112
110 120
1H14 9M14 FY14 3M15 1H15 7M15 9M15 FY15 3M16 1H16 7M16
Saving Account
SIKLUS Hajj Saving SIMPEDA TabunganKu Barokah Saving
10834 11331 7630 10509 13437 13316 13934 8016 9482 12578 12524
1H14 9M14 FY14 3M15 1H15 7M15 9M15 FY15 3M16 1H16 7M16
Time Deposit
26
Third Party Fund Customer
In million Rp
FY12 3M13 1H13 9M13 FY13 3M14 1H14 9M14 FY14 3M15 1H15 9M15 FY15 1H16 7M16
44
13
7
43
63
4
44
25
4
45
33
4
46
85
3
47
01
4
48
35
8
49
41
1
50
13
4
50
92
7
53
65
8
54
36
9
51
36
1
53
33
7
53
49
3
20
45
785
21
00
510
21
44
912
25
11
507
41
26
826
41
61
277
41
99
590
42
55
204
43
33
820
44
03
899
44
62
107
45
43
12
9
46
26
910
48
21
838
48
39
565
23
61
6
24
42
5
24
53
8
25
27
4
26
17
6
25
27
7
27
20
9
28
17
3
29
19
4
30
72
8
30
78
8
32
69
2
34
16
7
35
87
2
36
77
2
Total Customer
Current Account Saving Account Time Deposit
21831
27733 27304 27883
21277 24866
34252 31270
23236
35918 37489 36015
26273 28769
33511
399 322 329 303 242 199 192 210 254 208 205 225 276 257 250
18521 27761
33698 33250
23107
32546
39819 40218
26134
34200
43644 42621
23462
35063 34059
FY12 3M13 1H13 9M13 FY13 3M14 1H14 9M14 FY14 3M15 1H15 9M15 FY15 1H16 7M16
Ticket Size
Current Account Saving Account Time Deposit
27
Competitive Product
CONSUMER
COMMERCIAL
SME
CONSUMER LOAN Julyrsquo15 Julyrsquo16
Multipurpose 5447 5597
Mortgage 481 514
Others 236 301
Total 6164 6411
COMMERCIAL LOAN Julyrsquo15 Julyrsquo16
Standby Loan 374 224
Keppres 370 354
Overdraft 963 986
Syndicate 458 452
Total 2165 2015
Small Medium Ent Julyrsquo15 Julyrsquo16
KUR 241 082
Pundi Kencana 392 428
Jatim Mikro 160 188
Others 879 877
Total 1671 1574
28
Loan Proportion
In Billion Rp
YoY
Consumer
632
Commercial
(489)
SME
(369)
29
Type Of Loan
15599 16224 16711 17064 17575 17663 17939 18186 18427 18875 18779
5019 5624 5180 5054
6024 6204 6586 5697 5334 5789 5901
4203 4239 4304 4450 4689 4787 4710 4528 4507 4612 4611
1H14 9M14 FY14 3M15 1H15 7M15 9M15 FY15 3M16 1H16 7M16
Consumer Commercial SME
In Billion Rp
YoY
Multi
purpose
503
Mortgage
919
Others
3012
30
Type Of Loan
13864 14408
14849 15152 15609 15608 15794 15924 16117
16499 16394
1177 1233 1299 1340 1369 1379 1399 1434 1465 1502 1505
559 583 563 572 597 677 746 827 845 875 880
1H14 9M14 FY14 3M15 1H15 7M15 9M15 FY15 3M16 1H16 7M16
CONSUMER LOAN
Multipurpose Mortgage Others
In Billion Rp
YoY
Standby
Loan
(3877)
Keppres
(235)
Overdraft
462
Syndicate
071
31
Type Of Loan1
0
75
12
86
10
13
81
2
10
23
10
71
12
44
84
7
59
4
65
6
65
6
82
4 11
57
68
7
44
9
97
8
10
60
13
37
74
8
55
9
96
4
10
35
22
17
22
59
23
08
25
75
27
41
27
59
26
92
27
66
28
22
28
67
28
87
90
3
92
2
11
71
12
18
12
81
13
14
13
14
13
36
13
60
13
01
13
23
1H14 9M14 FY14 3M15 1H15 7M15 9M15 FY15 3M16 1H16 7M16
Commercial Loan
Standby Loan Keppres Overdraft Syndicate
In Billion Rp
YoY
KUR
(6532)
Pundi
Kencana
1163
Mikro
2031
Others
200
32
Type Of Loan1218
1128
1058
893
735
689
601
451
347
258
239
693
747
796
950
1108
1123
1157
1178
1223
1273
1254
78
165
264
345
452
457
491
520
530
557
550
2214
2199
2186
2262
2395
2517
2461
2380
2407
2523
2568
1H14 9M14 FY14 3M15 1H15 7M15 9M15 FY15 3M16 1H16 7M16
SME Loan
KUR Pundi Kencana Mikro Others
33
Type Of Loan
26
22
93
26
06
47
25
96
58
26
17
30
26
36
14
26
39
07
25
45
01
25
34
43
25
37
33
25
35
85
85
98
96
44
87
30
71
94
96
70
11
5
82
83
64
64
02
91
60
94
88
45
9
51
43
9
86
42
7
49
43
2
81
45
2
44
44
1
49
41
6
35
41
8
61
42
3
00
42
2
37
1H14 9M14 FY14 3M15 1H15 9M15 FY15 3M16 1H16 7M16
Total Customer
Consumer Commercial SME
5947 6225 6436 652 6667 6797 7146 7271 7439 7406
58231 58311 5933
702662292
56868
68119
83319
63196 62194
9147 9637 10069 1028 10366 10669 10877 10767 10903 10916
1H14 9M14 FY14 3M15 1H15 9M15 FY15 3M16 1H16 7M16
Ticket Size
Consumer Commercial SME
34
STRENGTH
35
Strength Of Funding
517
460 477426
403435
463 480431 407 435
384 385 394 421
246
254 288
362358
241
250284 359
354368
384 363 372284
237 285 235212
239 237287
237 210 239197
232 252 234294
2002 2003 2004 2005 2006 2007 2008 2009 2010 2011 2012 2013 2014 2015 7M16
Time deposit Saving deposit Current account
448 453
300 253 302 318 321261
316 354 348268 301
368256 301 284 283
492 500
275239
310 328 331
258326
381 371
267345
395
250277 297 296
3M12 1H12 9M12 FY12 3M13 1H13 9M13 FY13 3M14 1H14 9M14 FY14 3M15 1H15 FY15 3M16 1H16 7M16
Cost of Fund(+) Local Government (-) Local Government
Description Details
Civil Servants (per December 2014) 426545
Multipurpose Customer (Civil Servants) 238965
5602
NPL 039 as of Julyrsquo 2016
36
Strength of Loan (Multipurpose Loan)
567 593 612 619 631 640
666 675 690 686
1H14 9M14 FY14 3M15 1H15 9M15 FY15 3M16 1H16 7M16
Multiguna Ticket Size (million) Rp
13864
14408
14849
15152
1560915794
1592416117
1649916394
1H14 9M14 FY14 3M15 1H15 9M15 FY15 3M16 1H16 7M16
Multiguna Loan Balance
( Billion Rp )
Foreign Institution Investor
7260 from public shares
Foreign Institution Investor
6581 from public shares
Public shares 20
from paid capital Domestic Investor
3419 from public shares
Domestic Investor
2740 from public shares
37
No Country Share
1 INDONESIA 3419402 LUKSEMBURG 161267
3 AMERIKA 1341304 NORWEGIA 1111345 SIPRUS 838626 FINLANDIA 577797 VIRGIN ISLAND 41059
8 INGGRIS 223339 IRLANDIA 17073
10 AUSTRALIA 0964611 JEPANG 0839812 KANADA 05512
No Country Share
14 SWEDIA 0248915 SINGAPURA 0201816 CAYMAN ISLAND 0060317 GREENLAND 0033118 CINA 0019319 SWITSERLAND 0011320 KOREA SELATAN 0007421 FILIPINA 0002222 MALAYSIA 0001523 HONGKONG 0000824 JERMAN 00001
Total 100
STRENGTH OF INSTITUTIONS INVESTOR
38
Awards amp Achievements
The Most Trusted Banking in
Microfinance Services of The
Year 2015
Very Good Predicate for 2014
Financial Performance
Infobank Awards 2015
Bank Jatim Regional Banks with
excellent service of the year
2016
Excellence in Building and
Managing Corporate Image
Corporate Image Award 2015
The 1st Champion of Indonesia
Original Brand 2015
Top BPD HRampIT Management
2016
39
Investor Relations (IR)
Corporate Secretary
(031) 5310090 ext 469
Email irubankjatimcoid
Contact

3
OVERVIEW
4
ASSET YoY Growth (318)
FUND
YoY Growth 215bull Current Account 129bull Saving Account 1371bull Time Deposit (595)
7M16 Overview
Improvement
Human Capital
And
IT Management 2016
LOAN
YoY Growth 222bull Commercial (489)bull SME (369)bull Consumer 632
RATIO
CASA 7056COF 283ROA 296ROE 1941
NET PROFIT YoY Growth 1937
5
STRENGTHbull Micro loan at 2 years NPL 082bull Multipurpose loan NPL 039
STOCK
bull (66 Foreign Shareholder)bull High Dividend Yield historybull Dividend Growthbull BJTM Price July 29 2016
IDR 585 sharebull PBV 139bull EPS 7036bull PER 831
7M16 Overview
The 1st Champion of
Indonesia Original
Brands Category
Regional Bank 2016
NPLbull NPL May 2016 479bull NPL June 2016 458bull NPL July 2016 483
6
COMPANY REVIEW
7
LOANIn million Rp
7M15 7M16 YoY
Loan 28654214 29290730 222
- Commercial 6204245 5900919 -489
- SME 4787018 4610501 -369
- Consumer 17662952 18779310 632
Financial Performance
bull Multi-purpose credit still becomes the largest contributor
bull Standby loan credit facilities start running again with collateral regulations adjustmentand more prudential analysis
bull Adjust with single digit rate from OJK PundiKencana (SME) Credit Facility implemented with 10 rate and micro credit from government funding with rate under 10
FUNDIn million Rp
7M15 7M16 YoY
Third Party Fund 41644181 42537452 215
- Current Account 17698264 17926232 129
- Saving Account 10629904 12087219 1371
- Time Deposit 13316012 12524002 -595
bull Current account and Saving account increase low rate cost funding
bull Deposits with high interest rates have been reduced to lower the interest expense
8
InformationIn million Rp
7M15 7M16 YoY
Net Interest Income 1813868 1969020 855
Net Non Interest Operational Income
(Expense)(1119825) (1124772) 044
Net profit 512966 612315 1937
- ROA 274 296
- ROE 1599 1941
- NIM 655 665
Financial Performance
bull Dealer Treasury activityrsquos become thesignificant contributor for interest income the portion up to 20 from interest income
bull Operational profit increased due to higher interest income and lower impairment losses
9
Non Performing Loan
bull Bank Jatim still faces the non performing loan and yet to decrease the rising of the NPL last year was caused by
- Commercial credit npl standby loan and keppres
- Multipurpose npl from death and fired people decrease from insurance claim
- Financial Services Authority policy on lending quality of sharia rural bank based on capital adequate ratio level
bull Bank Jatimrsquos Credit Risk Division and Adhoc team keep attempting to reduce the NPL
bull The current NPL comes from the same debtors similar to last year and we still maintain the debtor to restructuring or rescheduling the credit based on their business Some of the standby loanrsquos debtors are waiting from the appeal completion in court
bull Managementrsquos efforts to reduce NPL are by conducting collection and auction the collateral
bull Strengthening capability assessment for credit officer improvement credit regulation and reconstruction of credit intern law
NPL 1H15 9M15 FY15 1M16 2M16 3M16 4M16 5M16 1H16 7M16
Consumer 075 086 074 077 081 082 085 089 085 091
SME 759 802 1111 1144 1165 1162 1154 1146 1136 1160
Commercial 978 1053 997 1159 1146 1142 1133 1181 1127 1190
NPL GROSS 382 422 429 451 457 459 465 479 458 483
Coverage Ratio 7582 8428 8102 8214 8217 8087 8194 8420 8337 8512
10
BUSINESS PLAN
11
Business Plan 2016
Description 2015 2016 E
Total Asset 1265 536
Loan 846 1207
Third Party Fund 1319 505
Financial Ratio
- CAR 2122 1899
- LDR 8292 8846
- NPL Gross 429 425
- NIM 641 744
- BOPO 7611 8454
- ROE 1611 1838
- ROA 267 321
LOAN STRATEGY
bull Credit for vehicle acquirement
bull Increasing MoU with government institutions for multipurpose also private corporates
bull Intensifying linkage program to rural bank members of Perbamida or Perbarindo
FUNDING STRATEGY
bull Cooperating with competent institutions to distribute school operational fund
bull Expanding funding networks
bull Intensifying new funding products implementation
bull Pricing Strategy for lower interest rate
NPL STRATEGY
bull Collection with credit restructuring
bull Special collection for rest of government payment project terms
bull Insurances claim accelerations and recoveries
bull Collateral auction
GENERAL STRATEGY
bull Revitalization into competence and professional human capital to shape competency based on resource management
bull Development and reorganization of head office and branches for customer centric
12
NETWORK
Network 2009 2010 2011 2012 2013 2014 2015 7M16NETWORK
2016
SHARIA
2016
Head Office 1 1 1 1 1 1 1 1 1
Branch Office 39 41 41 41 41 43 45 46 1 2
Sub Branch
Office26 44 67 81 107 153 165 166 5 10
Cash office 151 154 164 164 176 165 185 185 9 6
Sharia service
office37 37 47 47 47 97 97 97 94
Payment Point 78 88 115 138 155 167 171 173 8 7
Mobile cash 45 49 57 57 59 62 65 78 11 6
Mobile ATM - 4 4 6 6 6 6 6
CDM 1 1 1 1 1 2 2 2
ATM 87 142 262 368 479 595 688 692 13 15
Total network 465 561 759 904 1072 1291 1425 1446
13
APPENDIX
14
ECONOMIC OUTLOOK
550 525 525
575 575 600725 750 750 750 750 775 750
675 650 650
430
590 590
840 838732
670
453
836
335
445345 321
FY12 3M13 1H13 9M13 FY13 3M14 1H14 9M14 FY14 FY15 3M16 1H16 7M16
LOANbillion
FUNDbillion
JIBOR
INFLASI
BI RATE
LOANbillion
FUNDbillion
INFLASI
BI RATE
BI 7-Day Repo Rate
15Source Bank Indonesia
MACRO ECONOMY REVIEW
In billion Rp
3225198 3243136 3374272 3526188 3663968 3618064 3834503 3995803 4114420 4198577 4319749 4464083 4413056 4478409
2725674 2787372 2982436 3170805 3319842 3334011 3494968 3592087 3706501 3713544 3861172 3990464 4092104 4035929
FY12 3M13 1H13 9M13 FY13 3M14 1H14 9M14 FY14 3M15 1H15 9M15 FY15 4M16
NATIONALYoY
EAST JAVAYoY
16Source East Java Gov
East Java amp National BPS
Regional Economic Growth
640562 521 512 500 500 471 470 473 479 492
727
615 640 594 591 590518 525 544 544 534
FY12 FY13 3M14 1H14 9M14 FY14 3M15 1H15 9M15 FY15 3M16
17
FINANCIAL HIGHLIGHTS
18
Balance Sheet
InformationIn million Rp
7M15 7M16 YoY
Total Asset 49222516 50786968 318
Placement BI amp SBI 14108042 11775816 -1653
Loan 28654214 29290730 222
Allowance for Impairment Losses (937449) (1203961) 2843
Third Party Fund 41644181 42537452 215
- Current Account 17698264 17926232 129
- Saving Account 10629904 12087219 1371
- Time Deposit 13316012 12524002 -595
Equity 5922719 6266316 580
19
Profit amp Loss
InformationIn million Rp
7M15 7M16 YoY
Interest Income 2636359 2792540 592
Interest Expense (822491) (823520) 013
Nett Interest Income 1813868 1969020 855
Non Interest Operational Income 274986 257429 -638
Non Interest Operational Expense (1394811) (1058368) -2412
Provision for Impairment Losses (428576) (323833) -2444
Nett Non Interest Operational Income (Expense)
(1119825) (1124772) 044
Operational Profit 694043 844248 2164
Non Operational Profit 41924 4298 -8975
Pre Tax Profit 735967 848546 1530
Taxes (223001) (236231) 593
Net profit 512966 612315 1937
142 157 163 174200
249291
331
380
525 508
46 55 74
101
131
161 186
223
262
287 293
120 132 137 145162
201222
260
303
446425
04 0405 05
09 09
0708
094
118
06106
07 07 07 0708
0908
12
134
082
17 172 21
27 28 2933
41
46
279
TOTAL ASSET (Rp Tril)
INTEREST INCOME (Rp Tril) INTEREST EXPENSE (Rp Tril)
CAGR =
1261
CAGR =
1142
CAGR =
1256
NET PROFIT (Rp Tril)
THIRD PARTY FUND(Rp Tril)
CAGR =
1533
LOAN (Rp Tril)
CAGR =
2153
CAGR =
1524
20
Financial Performance
R
O
A
R
O
E
N
I
M
Financial Ratio
23
261
414 407
355394
375
558
497
334
382352
267
380
318296
2004 2005 2006 2007 2008 2009 2010 2011 2012 2013 2014 2015 3M16 1H16 7M16
3054
36903848
308531482859
4057
3365
1896190418981611
23492087
1941
2004 2005 2006 2007 2008 2009 2010 2011 2012 2013 2014 2015 3M16 1H16 7M16
910 939 934
728
835766
917
795
648714 690
641683 669 665
2004 2005 2006 2007 2008 2009 2010 2011 2012 2013 2014 2015 3M16 1H16 7M16
L
D
R
C
A
R
B
O
P
O
22
Financial Ratio
4545 4513
38754211
5404
6967
8070 80118355 8498 8654
8292
68117264
6886
2004 2005 2006 2007 2008 2009 2010 2011 2012 2013 2014 2015 3M16 1H16 7M16
15291817
3845
3339
2536
21321919
1653
26562372
2217 21221946 2065 2047
2004 2005 2006 2007 2008 2009 2010 2011 2012 2013 2014 2015 3M16 1H16 7M16
7467 73836943 6820 6742 6604
5958 6002
6869 7028 6963
7611
6532
70567232
2004 2005 2006 2007 2008 2009 2010 2011 2012 2013 2014 2015 3M16 1H16 7M16
23
OVERVIEW amp INVESTMENT HIGHLIGHTS
24
Current AccountYoY 129
Saving AccountYoY 1371
Time DepositYoY (595)
Third Party Fund
9662
12083
9969
16563
11649
18292
20116
17698
13494
21037
15345
17926
81747064
9970
8082
10991
9172 9128
10630
12753
1098712379 12087
4374
8269
6048
10834
7630
10509
13437 13316
8016
9482
12578 12524
FY12 1H13 FY13 1H14 FY14 3M15 1H15 7M15 FY15 3M16 1H16 7M16
Current Account
Saving Account
Time Deposit
In Billion Rp
In Billion Rp
Government Current
Acc
YoY (1752)
Private Current Acc
YoY 20528
YoY
SIMPEDA 1091
SIKLUS 4390
Hajj Saving 289
TabunganKu 2476
Barokah Saving 3115
Time Deposit
YoY (595)
25
Detailed Third Party Fund
13821 11959 7220 14710 15803 16204 17985
5718 16715
10411 13365
2742 3491 4429
3582 4313 1494 1596
7776
4322 4933
4561
1H14 9M14 FY14 3M15 1H15 7M15 9M15 FY15 3M16 1H16 7M16
Current Account
Government Private
241 290 657 418 535 560 581 861 674 752 806 179 194 208 218 199 204 215 224 230 208 210
6946 7682
9239 7705 7543
8977 8535
10561 9046
10330 9957
651 687
795
748 762
797 814
994
925
980 994
65 70
93
83 87
92 94
112
112
110 120
1H14 9M14 FY14 3M15 1H15 7M15 9M15 FY15 3M16 1H16 7M16
Saving Account
SIKLUS Hajj Saving SIMPEDA TabunganKu Barokah Saving
10834 11331 7630 10509 13437 13316 13934 8016 9482 12578 12524
1H14 9M14 FY14 3M15 1H15 7M15 9M15 FY15 3M16 1H16 7M16
Time Deposit
26
Third Party Fund Customer
In million Rp
FY12 3M13 1H13 9M13 FY13 3M14 1H14 9M14 FY14 3M15 1H15 9M15 FY15 1H16 7M16
44
13
7
43
63
4
44
25
4
45
33
4
46
85
3
47
01
4
48
35
8
49
41
1
50
13
4
50
92
7
53
65
8
54
36
9
51
36
1
53
33
7
53
49
3
20
45
785
21
00
510
21
44
912
25
11
507
41
26
826
41
61
277
41
99
590
42
55
204
43
33
820
44
03
899
44
62
107
45
43
12
9
46
26
910
48
21
838
48
39
565
23
61
6
24
42
5
24
53
8
25
27
4
26
17
6
25
27
7
27
20
9
28
17
3
29
19
4
30
72
8
30
78
8
32
69
2
34
16
7
35
87
2
36
77
2
Total Customer
Current Account Saving Account Time Deposit
21831
27733 27304 27883
21277 24866
34252 31270
23236
35918 37489 36015
26273 28769
33511
399 322 329 303 242 199 192 210 254 208 205 225 276 257 250
18521 27761
33698 33250
23107
32546
39819 40218
26134
34200
43644 42621
23462
35063 34059
FY12 3M13 1H13 9M13 FY13 3M14 1H14 9M14 FY14 3M15 1H15 9M15 FY15 1H16 7M16
Ticket Size
Current Account Saving Account Time Deposit
27
Competitive Product
CONSUMER
COMMERCIAL
SME
CONSUMER LOAN Julyrsquo15 Julyrsquo16
Multipurpose 5447 5597
Mortgage 481 514
Others 236 301
Total 6164 6411
COMMERCIAL LOAN Julyrsquo15 Julyrsquo16
Standby Loan 374 224
Keppres 370 354
Overdraft 963 986
Syndicate 458 452
Total 2165 2015
Small Medium Ent Julyrsquo15 Julyrsquo16
KUR 241 082
Pundi Kencana 392 428
Jatim Mikro 160 188
Others 879 877
Total 1671 1574
28
Loan Proportion
In Billion Rp
YoY
Consumer
632
Commercial
(489)
SME
(369)
29
Type Of Loan
15599 16224 16711 17064 17575 17663 17939 18186 18427 18875 18779
5019 5624 5180 5054
6024 6204 6586 5697 5334 5789 5901
4203 4239 4304 4450 4689 4787 4710 4528 4507 4612 4611
1H14 9M14 FY14 3M15 1H15 7M15 9M15 FY15 3M16 1H16 7M16
Consumer Commercial SME
In Billion Rp
YoY
Multi
purpose
503
Mortgage
919
Others
3012
30
Type Of Loan
13864 14408
14849 15152 15609 15608 15794 15924 16117
16499 16394
1177 1233 1299 1340 1369 1379 1399 1434 1465 1502 1505
559 583 563 572 597 677 746 827 845 875 880
1H14 9M14 FY14 3M15 1H15 7M15 9M15 FY15 3M16 1H16 7M16
CONSUMER LOAN
Multipurpose Mortgage Others
In Billion Rp
YoY
Standby
Loan
(3877)
Keppres
(235)
Overdraft
462
Syndicate
071
31
Type Of Loan1
0
75
12
86
10
13
81
2
10
23
10
71
12
44
84
7
59
4
65
6
65
6
82
4 11
57
68
7
44
9
97
8
10
60
13
37
74
8
55
9
96
4
10
35
22
17
22
59
23
08
25
75
27
41
27
59
26
92
27
66
28
22
28
67
28
87
90
3
92
2
11
71
12
18
12
81
13
14
13
14
13
36
13
60
13
01
13
23
1H14 9M14 FY14 3M15 1H15 7M15 9M15 FY15 3M16 1H16 7M16
Commercial Loan
Standby Loan Keppres Overdraft Syndicate
In Billion Rp
YoY
KUR
(6532)
Pundi
Kencana
1163
Mikro
2031
Others
200
32
Type Of Loan1218
1128
1058
893
735
689
601
451
347
258
239
693
747
796
950
1108
1123
1157
1178
1223
1273
1254
78
165
264
345
452
457
491
520
530
557
550
2214
2199
2186
2262
2395
2517
2461
2380
2407
2523
2568
1H14 9M14 FY14 3M15 1H15 7M15 9M15 FY15 3M16 1H16 7M16
SME Loan
KUR Pundi Kencana Mikro Others
33
Type Of Loan
26
22
93
26
06
47
25
96
58
26
17
30
26
36
14
26
39
07
25
45
01
25
34
43
25
37
33
25
35
85
85
98
96
44
87
30
71
94
96
70
11
5
82
83
64
64
02
91
60
94
88
45
9
51
43
9
86
42
7
49
43
2
81
45
2
44
44
1
49
41
6
35
41
8
61
42
3
00
42
2
37
1H14 9M14 FY14 3M15 1H15 9M15 FY15 3M16 1H16 7M16
Total Customer
Consumer Commercial SME
5947 6225 6436 652 6667 6797 7146 7271 7439 7406
58231 58311 5933
702662292
56868
68119
83319
63196 62194
9147 9637 10069 1028 10366 10669 10877 10767 10903 10916
1H14 9M14 FY14 3M15 1H15 9M15 FY15 3M16 1H16 7M16
Ticket Size
Consumer Commercial SME
34
STRENGTH
35
Strength Of Funding
517
460 477426
403435
463 480431 407 435
384 385 394 421
246
254 288
362358
241
250284 359
354368
384 363 372284
237 285 235212
239 237287
237 210 239197
232 252 234294
2002 2003 2004 2005 2006 2007 2008 2009 2010 2011 2012 2013 2014 2015 7M16
Time deposit Saving deposit Current account
448 453
300 253 302 318 321261
316 354 348268 301
368256 301 284 283
492 500
275239
310 328 331
258326
381 371
267345
395
250277 297 296
3M12 1H12 9M12 FY12 3M13 1H13 9M13 FY13 3M14 1H14 9M14 FY14 3M15 1H15 FY15 3M16 1H16 7M16
Cost of Fund(+) Local Government (-) Local Government
Description Details
Civil Servants (per December 2014) 426545
Multipurpose Customer (Civil Servants) 238965
5602
NPL 039 as of Julyrsquo 2016
36
Strength of Loan (Multipurpose Loan)
567 593 612 619 631 640
666 675 690 686
1H14 9M14 FY14 3M15 1H15 9M15 FY15 3M16 1H16 7M16
Multiguna Ticket Size (million) Rp
13864
14408
14849
15152
1560915794
1592416117
1649916394
1H14 9M14 FY14 3M15 1H15 9M15 FY15 3M16 1H16 7M16
Multiguna Loan Balance
( Billion Rp )
Foreign Institution Investor
7260 from public shares
Foreign Institution Investor
6581 from public shares
Public shares 20
from paid capital Domestic Investor
3419 from public shares
Domestic Investor
2740 from public shares
37
No Country Share
1 INDONESIA 3419402 LUKSEMBURG 161267
3 AMERIKA 1341304 NORWEGIA 1111345 SIPRUS 838626 FINLANDIA 577797 VIRGIN ISLAND 41059
8 INGGRIS 223339 IRLANDIA 17073
10 AUSTRALIA 0964611 JEPANG 0839812 KANADA 05512
No Country Share
14 SWEDIA 0248915 SINGAPURA 0201816 CAYMAN ISLAND 0060317 GREENLAND 0033118 CINA 0019319 SWITSERLAND 0011320 KOREA SELATAN 0007421 FILIPINA 0002222 MALAYSIA 0001523 HONGKONG 0000824 JERMAN 00001
Total 100
STRENGTH OF INSTITUTIONS INVESTOR
38
Awards amp Achievements
The Most Trusted Banking in
Microfinance Services of The
Year 2015
Very Good Predicate for 2014
Financial Performance
Infobank Awards 2015
Bank Jatim Regional Banks with
excellent service of the year
2016
Excellence in Building and
Managing Corporate Image
Corporate Image Award 2015
The 1st Champion of Indonesia
Original Brand 2015
Top BPD HRampIT Management
2016
39
Investor Relations (IR)
Corporate Secretary
(031) 5310090 ext 469
Email irubankjatimcoid
Contact

4
ASSET YoY Growth (318)
FUND
YoY Growth 215bull Current Account 129bull Saving Account 1371bull Time Deposit (595)
7M16 Overview
Improvement
Human Capital
And
IT Management 2016
LOAN
YoY Growth 222bull Commercial (489)bull SME (369)bull Consumer 632
RATIO
CASA 7056COF 283ROA 296ROE 1941
NET PROFIT YoY Growth 1937
5
STRENGTHbull Micro loan at 2 years NPL 082bull Multipurpose loan NPL 039
STOCK
bull (66 Foreign Shareholder)bull High Dividend Yield historybull Dividend Growthbull BJTM Price July 29 2016
IDR 585 sharebull PBV 139bull EPS 7036bull PER 831
7M16 Overview
The 1st Champion of
Indonesia Original
Brands Category
Regional Bank 2016
NPLbull NPL May 2016 479bull NPL June 2016 458bull NPL July 2016 483
6
COMPANY REVIEW
7
LOANIn million Rp
7M15 7M16 YoY
Loan 28654214 29290730 222
- Commercial 6204245 5900919 -489
- SME 4787018 4610501 -369
- Consumer 17662952 18779310 632
Financial Performance
bull Multi-purpose credit still becomes the largest contributor
bull Standby loan credit facilities start running again with collateral regulations adjustmentand more prudential analysis
bull Adjust with single digit rate from OJK PundiKencana (SME) Credit Facility implemented with 10 rate and micro credit from government funding with rate under 10
FUNDIn million Rp
7M15 7M16 YoY
Third Party Fund 41644181 42537452 215
- Current Account 17698264 17926232 129
- Saving Account 10629904 12087219 1371
- Time Deposit 13316012 12524002 -595
bull Current account and Saving account increase low rate cost funding
bull Deposits with high interest rates have been reduced to lower the interest expense
8
InformationIn million Rp
7M15 7M16 YoY
Net Interest Income 1813868 1969020 855
Net Non Interest Operational Income
(Expense)(1119825) (1124772) 044
Net profit 512966 612315 1937
- ROA 274 296
- ROE 1599 1941
- NIM 655 665
Financial Performance
bull Dealer Treasury activityrsquos become thesignificant contributor for interest income the portion up to 20 from interest income
bull Operational profit increased due to higher interest income and lower impairment losses
9
Non Performing Loan
bull Bank Jatim still faces the non performing loan and yet to decrease the rising of the NPL last year was caused by
- Commercial credit npl standby loan and keppres
- Multipurpose npl from death and fired people decrease from insurance claim
- Financial Services Authority policy on lending quality of sharia rural bank based on capital adequate ratio level
bull Bank Jatimrsquos Credit Risk Division and Adhoc team keep attempting to reduce the NPL
bull The current NPL comes from the same debtors similar to last year and we still maintain the debtor to restructuring or rescheduling the credit based on their business Some of the standby loanrsquos debtors are waiting from the appeal completion in court
bull Managementrsquos efforts to reduce NPL are by conducting collection and auction the collateral
bull Strengthening capability assessment for credit officer improvement credit regulation and reconstruction of credit intern law
NPL 1H15 9M15 FY15 1M16 2M16 3M16 4M16 5M16 1H16 7M16
Consumer 075 086 074 077 081 082 085 089 085 091
SME 759 802 1111 1144 1165 1162 1154 1146 1136 1160
Commercial 978 1053 997 1159 1146 1142 1133 1181 1127 1190
NPL GROSS 382 422 429 451 457 459 465 479 458 483
Coverage Ratio 7582 8428 8102 8214 8217 8087 8194 8420 8337 8512
10
BUSINESS PLAN
11
Business Plan 2016
Description 2015 2016 E
Total Asset 1265 536
Loan 846 1207
Third Party Fund 1319 505
Financial Ratio
- CAR 2122 1899
- LDR 8292 8846
- NPL Gross 429 425
- NIM 641 744
- BOPO 7611 8454
- ROE 1611 1838
- ROA 267 321
LOAN STRATEGY
bull Credit for vehicle acquirement
bull Increasing MoU with government institutions for multipurpose also private corporates
bull Intensifying linkage program to rural bank members of Perbamida or Perbarindo
FUNDING STRATEGY
bull Cooperating with competent institutions to distribute school operational fund
bull Expanding funding networks
bull Intensifying new funding products implementation
bull Pricing Strategy for lower interest rate
NPL STRATEGY
bull Collection with credit restructuring
bull Special collection for rest of government payment project terms
bull Insurances claim accelerations and recoveries
bull Collateral auction
GENERAL STRATEGY
bull Revitalization into competence and professional human capital to shape competency based on resource management
bull Development and reorganization of head office and branches for customer centric
12
NETWORK
Network 2009 2010 2011 2012 2013 2014 2015 7M16NETWORK
2016
SHARIA
2016
Head Office 1 1 1 1 1 1 1 1 1
Branch Office 39 41 41 41 41 43 45 46 1 2
Sub Branch
Office26 44 67 81 107 153 165 166 5 10
Cash office 151 154 164 164 176 165 185 185 9 6
Sharia service
office37 37 47 47 47 97 97 97 94
Payment Point 78 88 115 138 155 167 171 173 8 7
Mobile cash 45 49 57 57 59 62 65 78 11 6
Mobile ATM - 4 4 6 6 6 6 6
CDM 1 1 1 1 1 2 2 2
ATM 87 142 262 368 479 595 688 692 13 15
Total network 465 561 759 904 1072 1291 1425 1446
13
APPENDIX
14
ECONOMIC OUTLOOK
550 525 525
575 575 600725 750 750 750 750 775 750
675 650 650
430
590 590
840 838732
670
453
836
335
445345 321
FY12 3M13 1H13 9M13 FY13 3M14 1H14 9M14 FY14 FY15 3M16 1H16 7M16
LOANbillion
FUNDbillion
JIBOR
INFLASI
BI RATE
LOANbillion
FUNDbillion
INFLASI
BI RATE
BI 7-Day Repo Rate
15Source Bank Indonesia
MACRO ECONOMY REVIEW
In billion Rp
3225198 3243136 3374272 3526188 3663968 3618064 3834503 3995803 4114420 4198577 4319749 4464083 4413056 4478409
2725674 2787372 2982436 3170805 3319842 3334011 3494968 3592087 3706501 3713544 3861172 3990464 4092104 4035929
FY12 3M13 1H13 9M13 FY13 3M14 1H14 9M14 FY14 3M15 1H15 9M15 FY15 4M16
NATIONALYoY
EAST JAVAYoY
16Source East Java Gov
East Java amp National BPS
Regional Economic Growth
640562 521 512 500 500 471 470 473 479 492
727
615 640 594 591 590518 525 544 544 534
FY12 FY13 3M14 1H14 9M14 FY14 3M15 1H15 9M15 FY15 3M16
17
FINANCIAL HIGHLIGHTS
18
Balance Sheet
InformationIn million Rp
7M15 7M16 YoY
Total Asset 49222516 50786968 318
Placement BI amp SBI 14108042 11775816 -1653
Loan 28654214 29290730 222
Allowance for Impairment Losses (937449) (1203961) 2843
Third Party Fund 41644181 42537452 215
- Current Account 17698264 17926232 129
- Saving Account 10629904 12087219 1371
- Time Deposit 13316012 12524002 -595
Equity 5922719 6266316 580
19
Profit amp Loss
InformationIn million Rp
7M15 7M16 YoY
Interest Income 2636359 2792540 592
Interest Expense (822491) (823520) 013
Nett Interest Income 1813868 1969020 855
Non Interest Operational Income 274986 257429 -638
Non Interest Operational Expense (1394811) (1058368) -2412
Provision for Impairment Losses (428576) (323833) -2444
Nett Non Interest Operational Income (Expense)
(1119825) (1124772) 044
Operational Profit 694043 844248 2164
Non Operational Profit 41924 4298 -8975
Pre Tax Profit 735967 848546 1530
Taxes (223001) (236231) 593
Net profit 512966 612315 1937
142 157 163 174200
249291
331
380
525 508
46 55 74
101
131
161 186
223
262
287 293
120 132 137 145162
201222
260
303
446425
04 0405 05
09 09
0708
094
118
06106
07 07 07 0708
0908
12
134
082
17 172 21
27 28 2933
41
46
279
TOTAL ASSET (Rp Tril)
INTEREST INCOME (Rp Tril) INTEREST EXPENSE (Rp Tril)
CAGR =
1261
CAGR =
1142
CAGR =
1256
NET PROFIT (Rp Tril)
THIRD PARTY FUND(Rp Tril)
CAGR =
1533
LOAN (Rp Tril)
CAGR =
2153
CAGR =
1524
20
Financial Performance
R
O
A
R
O
E
N
I
M
Financial Ratio
23
261
414 407
355394
375
558
497
334
382352
267
380
318296
2004 2005 2006 2007 2008 2009 2010 2011 2012 2013 2014 2015 3M16 1H16 7M16
3054
36903848
308531482859
4057
3365
1896190418981611
23492087
1941
2004 2005 2006 2007 2008 2009 2010 2011 2012 2013 2014 2015 3M16 1H16 7M16
910 939 934
728
835766
917
795
648714 690
641683 669 665
2004 2005 2006 2007 2008 2009 2010 2011 2012 2013 2014 2015 3M16 1H16 7M16
L
D
R
C
A
R
B
O
P
O
22
Financial Ratio
4545 4513
38754211
5404
6967
8070 80118355 8498 8654
8292
68117264
6886
2004 2005 2006 2007 2008 2009 2010 2011 2012 2013 2014 2015 3M16 1H16 7M16
15291817
3845
3339
2536
21321919
1653
26562372
2217 21221946 2065 2047
2004 2005 2006 2007 2008 2009 2010 2011 2012 2013 2014 2015 3M16 1H16 7M16
7467 73836943 6820 6742 6604
5958 6002
6869 7028 6963
7611
6532
70567232
2004 2005 2006 2007 2008 2009 2010 2011 2012 2013 2014 2015 3M16 1H16 7M16
23
OVERVIEW amp INVESTMENT HIGHLIGHTS
24
Current AccountYoY 129
Saving AccountYoY 1371
Time DepositYoY (595)
Third Party Fund
9662
12083
9969
16563
11649
18292
20116
17698
13494
21037
15345
17926
81747064
9970
8082
10991
9172 9128
10630
12753
1098712379 12087
4374
8269
6048
10834
7630
10509
13437 13316
8016
9482
12578 12524
FY12 1H13 FY13 1H14 FY14 3M15 1H15 7M15 FY15 3M16 1H16 7M16
Current Account
Saving Account
Time Deposit
In Billion Rp
In Billion Rp
Government Current
Acc
YoY (1752)
Private Current Acc
YoY 20528
YoY
SIMPEDA 1091
SIKLUS 4390
Hajj Saving 289
TabunganKu 2476
Barokah Saving 3115
Time Deposit
YoY (595)
25
Detailed Third Party Fund
13821 11959 7220 14710 15803 16204 17985
5718 16715
10411 13365
2742 3491 4429
3582 4313 1494 1596
7776
4322 4933
4561
1H14 9M14 FY14 3M15 1H15 7M15 9M15 FY15 3M16 1H16 7M16
Current Account
Government Private
241 290 657 418 535 560 581 861 674 752 806 179 194 208 218 199 204 215 224 230 208 210
6946 7682
9239 7705 7543
8977 8535
10561 9046
10330 9957
651 687
795
748 762
797 814
994
925
980 994
65 70
93
83 87
92 94
112
112
110 120
1H14 9M14 FY14 3M15 1H15 7M15 9M15 FY15 3M16 1H16 7M16
Saving Account
SIKLUS Hajj Saving SIMPEDA TabunganKu Barokah Saving
10834 11331 7630 10509 13437 13316 13934 8016 9482 12578 12524
1H14 9M14 FY14 3M15 1H15 7M15 9M15 FY15 3M16 1H16 7M16
Time Deposit
26
Third Party Fund Customer
In million Rp
FY12 3M13 1H13 9M13 FY13 3M14 1H14 9M14 FY14 3M15 1H15 9M15 FY15 1H16 7M16
44
13
7
43
63
4
44
25
4
45
33
4
46
85
3
47
01
4
48
35
8
49
41
1
50
13
4
50
92
7
53
65
8
54
36
9
51
36
1
53
33
7
53
49
3
20
45
785
21
00
510
21
44
912
25
11
507
41
26
826
41
61
277
41
99
590
42
55
204
43
33
820
44
03
899
44
62
107
45
43
12
9
46
26
910
48
21
838
48
39
565
23
61
6
24
42
5
24
53
8
25
27
4
26
17
6
25
27
7
27
20
9
28
17
3
29
19
4
30
72
8
30
78
8
32
69
2
34
16
7
35
87
2
36
77
2
Total Customer
Current Account Saving Account Time Deposit
21831
27733 27304 27883
21277 24866
34252 31270
23236
35918 37489 36015
26273 28769
33511
399 322 329 303 242 199 192 210 254 208 205 225 276 257 250
18521 27761
33698 33250
23107
32546
39819 40218
26134
34200
43644 42621
23462
35063 34059
FY12 3M13 1H13 9M13 FY13 3M14 1H14 9M14 FY14 3M15 1H15 9M15 FY15 1H16 7M16
Ticket Size
Current Account Saving Account Time Deposit
27
Competitive Product
CONSUMER
COMMERCIAL
SME
CONSUMER LOAN Julyrsquo15 Julyrsquo16
Multipurpose 5447 5597
Mortgage 481 514
Others 236 301
Total 6164 6411
COMMERCIAL LOAN Julyrsquo15 Julyrsquo16
Standby Loan 374 224
Keppres 370 354
Overdraft 963 986
Syndicate 458 452
Total 2165 2015
Small Medium Ent Julyrsquo15 Julyrsquo16
KUR 241 082
Pundi Kencana 392 428
Jatim Mikro 160 188
Others 879 877
Total 1671 1574
28
Loan Proportion
In Billion Rp
YoY
Consumer
632
Commercial
(489)
SME
(369)
29
Type Of Loan
15599 16224 16711 17064 17575 17663 17939 18186 18427 18875 18779
5019 5624 5180 5054
6024 6204 6586 5697 5334 5789 5901
4203 4239 4304 4450 4689 4787 4710 4528 4507 4612 4611
1H14 9M14 FY14 3M15 1H15 7M15 9M15 FY15 3M16 1H16 7M16
Consumer Commercial SME
In Billion Rp
YoY
Multi
purpose
503
Mortgage
919
Others
3012
30
Type Of Loan
13864 14408
14849 15152 15609 15608 15794 15924 16117
16499 16394
1177 1233 1299 1340 1369 1379 1399 1434 1465 1502 1505
559 583 563 572 597 677 746 827 845 875 880
1H14 9M14 FY14 3M15 1H15 7M15 9M15 FY15 3M16 1H16 7M16
CONSUMER LOAN
Multipurpose Mortgage Others
In Billion Rp
YoY
Standby
Loan
(3877)
Keppres
(235)
Overdraft
462
Syndicate
071
31
Type Of Loan1
0
75
12
86
10
13
81
2
10
23
10
71
12
44
84
7
59
4
65
6
65
6
82
4 11
57
68
7
44
9
97
8
10
60
13
37
74
8
55
9
96
4
10
35
22
17
22
59
23
08
25
75
27
41
27
59
26
92
27
66
28
22
28
67
28
87
90
3
92
2
11
71
12
18
12
81
13
14
13
14
13
36
13
60
13
01
13
23
1H14 9M14 FY14 3M15 1H15 7M15 9M15 FY15 3M16 1H16 7M16
Commercial Loan
Standby Loan Keppres Overdraft Syndicate
In Billion Rp
YoY
KUR
(6532)
Pundi
Kencana
1163
Mikro
2031
Others
200
32
Type Of Loan1218
1128
1058
893
735
689
601
451
347
258
239
693
747
796
950
1108
1123
1157
1178
1223
1273
1254
78
165
264
345
452
457
491
520
530
557
550
2214
2199
2186
2262
2395
2517
2461
2380
2407
2523
2568
1H14 9M14 FY14 3M15 1H15 7M15 9M15 FY15 3M16 1H16 7M16
SME Loan
KUR Pundi Kencana Mikro Others
33
Type Of Loan
26
22
93
26
06
47
25
96
58
26
17
30
26
36
14
26
39
07
25
45
01
25
34
43
25
37
33
25
35
85
85
98
96
44
87
30
71
94
96
70
11
5
82
83
64
64
02
91
60
94
88
45
9
51
43
9
86
42
7
49
43
2
81
45
2
44
44
1
49
41
6
35
41
8
61
42
3
00
42
2
37
1H14 9M14 FY14 3M15 1H15 9M15 FY15 3M16 1H16 7M16
Total Customer
Consumer Commercial SME
5947 6225 6436 652 6667 6797 7146 7271 7439 7406
58231 58311 5933
702662292
56868
68119
83319
63196 62194
9147 9637 10069 1028 10366 10669 10877 10767 10903 10916
1H14 9M14 FY14 3M15 1H15 9M15 FY15 3M16 1H16 7M16
Ticket Size
Consumer Commercial SME
34
STRENGTH
35
Strength Of Funding
517
460 477426
403435
463 480431 407 435
384 385 394 421
246
254 288
362358
241
250284 359
354368
384 363 372284
237 285 235212
239 237287
237 210 239197
232 252 234294
2002 2003 2004 2005 2006 2007 2008 2009 2010 2011 2012 2013 2014 2015 7M16
Time deposit Saving deposit Current account
448 453
300 253 302 318 321261
316 354 348268 301
368256 301 284 283
492 500
275239
310 328 331
258326
381 371
267345
395
250277 297 296
3M12 1H12 9M12 FY12 3M13 1H13 9M13 FY13 3M14 1H14 9M14 FY14 3M15 1H15 FY15 3M16 1H16 7M16
Cost of Fund(+) Local Government (-) Local Government
Description Details
Civil Servants (per December 2014) 426545
Multipurpose Customer (Civil Servants) 238965
5602
NPL 039 as of Julyrsquo 2016
36
Strength of Loan (Multipurpose Loan)
567 593 612 619 631 640
666 675 690 686
1H14 9M14 FY14 3M15 1H15 9M15 FY15 3M16 1H16 7M16
Multiguna Ticket Size (million) Rp
13864
14408
14849
15152
1560915794
1592416117
1649916394
1H14 9M14 FY14 3M15 1H15 9M15 FY15 3M16 1H16 7M16
Multiguna Loan Balance
( Billion Rp )
Foreign Institution Investor
7260 from public shares
Foreign Institution Investor
6581 from public shares
Public shares 20
from paid capital Domestic Investor
3419 from public shares
Domestic Investor
2740 from public shares
37
No Country Share
1 INDONESIA 3419402 LUKSEMBURG 161267
3 AMERIKA 1341304 NORWEGIA 1111345 SIPRUS 838626 FINLANDIA 577797 VIRGIN ISLAND 41059
8 INGGRIS 223339 IRLANDIA 17073
10 AUSTRALIA 0964611 JEPANG 0839812 KANADA 05512
No Country Share
14 SWEDIA 0248915 SINGAPURA 0201816 CAYMAN ISLAND 0060317 GREENLAND 0033118 CINA 0019319 SWITSERLAND 0011320 KOREA SELATAN 0007421 FILIPINA 0002222 MALAYSIA 0001523 HONGKONG 0000824 JERMAN 00001
Total 100
STRENGTH OF INSTITUTIONS INVESTOR
38
Awards amp Achievements
The Most Trusted Banking in
Microfinance Services of The
Year 2015
Very Good Predicate for 2014
Financial Performance
Infobank Awards 2015
Bank Jatim Regional Banks with
excellent service of the year
2016
Excellence in Building and
Managing Corporate Image
Corporate Image Award 2015
The 1st Champion of Indonesia
Original Brand 2015
Top BPD HRampIT Management
2016
39
Investor Relations (IR)
Corporate Secretary
(031) 5310090 ext 469
Email irubankjatimcoid
Contact

5
STRENGTHbull Micro loan at 2 years NPL 082bull Multipurpose loan NPL 039
STOCK
bull (66 Foreign Shareholder)bull High Dividend Yield historybull Dividend Growthbull BJTM Price July 29 2016
IDR 585 sharebull PBV 139bull EPS 7036bull PER 831
7M16 Overview
The 1st Champion of
Indonesia Original
Brands Category
Regional Bank 2016
NPLbull NPL May 2016 479bull NPL June 2016 458bull NPL July 2016 483
6
COMPANY REVIEW
7
LOANIn million Rp
7M15 7M16 YoY
Loan 28654214 29290730 222
- Commercial 6204245 5900919 -489
- SME 4787018 4610501 -369
- Consumer 17662952 18779310 632
Financial Performance
bull Multi-purpose credit still becomes the largest contributor
bull Standby loan credit facilities start running again with collateral regulations adjustmentand more prudential analysis
bull Adjust with single digit rate from OJK PundiKencana (SME) Credit Facility implemented with 10 rate and micro credit from government funding with rate under 10
FUNDIn million Rp
7M15 7M16 YoY
Third Party Fund 41644181 42537452 215
- Current Account 17698264 17926232 129
- Saving Account 10629904 12087219 1371
- Time Deposit 13316012 12524002 -595
bull Current account and Saving account increase low rate cost funding
bull Deposits with high interest rates have been reduced to lower the interest expense
8
InformationIn million Rp
7M15 7M16 YoY
Net Interest Income 1813868 1969020 855
Net Non Interest Operational Income
(Expense)(1119825) (1124772) 044
Net profit 512966 612315 1937
- ROA 274 296
- ROE 1599 1941
- NIM 655 665
Financial Performance
bull Dealer Treasury activityrsquos become thesignificant contributor for interest income the portion up to 20 from interest income
bull Operational profit increased due to higher interest income and lower impairment losses
9
Non Performing Loan
bull Bank Jatim still faces the non performing loan and yet to decrease the rising of the NPL last year was caused by
- Commercial credit npl standby loan and keppres
- Multipurpose npl from death and fired people decrease from insurance claim
- Financial Services Authority policy on lending quality of sharia rural bank based on capital adequate ratio level
bull Bank Jatimrsquos Credit Risk Division and Adhoc team keep attempting to reduce the NPL
bull The current NPL comes from the same debtors similar to last year and we still maintain the debtor to restructuring or rescheduling the credit based on their business Some of the standby loanrsquos debtors are waiting from the appeal completion in court
bull Managementrsquos efforts to reduce NPL are by conducting collection and auction the collateral
bull Strengthening capability assessment for credit officer improvement credit regulation and reconstruction of credit intern law
NPL 1H15 9M15 FY15 1M16 2M16 3M16 4M16 5M16 1H16 7M16
Consumer 075 086 074 077 081 082 085 089 085 091
SME 759 802 1111 1144 1165 1162 1154 1146 1136 1160
Commercial 978 1053 997 1159 1146 1142 1133 1181 1127 1190
NPL GROSS 382 422 429 451 457 459 465 479 458 483
Coverage Ratio 7582 8428 8102 8214 8217 8087 8194 8420 8337 8512
10
BUSINESS PLAN
11
Business Plan 2016
Description 2015 2016 E
Total Asset 1265 536
Loan 846 1207
Third Party Fund 1319 505
Financial Ratio
- CAR 2122 1899
- LDR 8292 8846
- NPL Gross 429 425
- NIM 641 744
- BOPO 7611 8454
- ROE 1611 1838
- ROA 267 321
LOAN STRATEGY
bull Credit for vehicle acquirement
bull Increasing MoU with government institutions for multipurpose also private corporates
bull Intensifying linkage program to rural bank members of Perbamida or Perbarindo
FUNDING STRATEGY
bull Cooperating with competent institutions to distribute school operational fund
bull Expanding funding networks
bull Intensifying new funding products implementation
bull Pricing Strategy for lower interest rate
NPL STRATEGY
bull Collection with credit restructuring
bull Special collection for rest of government payment project terms
bull Insurances claim accelerations and recoveries
bull Collateral auction
GENERAL STRATEGY
bull Revitalization into competence and professional human capital to shape competency based on resource management
bull Development and reorganization of head office and branches for customer centric
12
NETWORK
Network 2009 2010 2011 2012 2013 2014 2015 7M16NETWORK
2016
SHARIA
2016
Head Office 1 1 1 1 1 1 1 1 1
Branch Office 39 41 41 41 41 43 45 46 1 2
Sub Branch
Office26 44 67 81 107 153 165 166 5 10
Cash office 151 154 164 164 176 165 185 185 9 6
Sharia service
office37 37 47 47 47 97 97 97 94
Payment Point 78 88 115 138 155 167 171 173 8 7
Mobile cash 45 49 57 57 59 62 65 78 11 6
Mobile ATM - 4 4 6 6 6 6 6
CDM 1 1 1 1 1 2 2 2
ATM 87 142 262 368 479 595 688 692 13 15
Total network 465 561 759 904 1072 1291 1425 1446
13
APPENDIX
14
ECONOMIC OUTLOOK
550 525 525
575 575 600725 750 750 750 750 775 750
675 650 650
430
590 590
840 838732
670
453
836
335
445345 321
FY12 3M13 1H13 9M13 FY13 3M14 1H14 9M14 FY14 FY15 3M16 1H16 7M16
LOANbillion
FUNDbillion
JIBOR
INFLASI
BI RATE
LOANbillion
FUNDbillion
INFLASI
BI RATE
BI 7-Day Repo Rate
15Source Bank Indonesia
MACRO ECONOMY REVIEW
In billion Rp
3225198 3243136 3374272 3526188 3663968 3618064 3834503 3995803 4114420 4198577 4319749 4464083 4413056 4478409
2725674 2787372 2982436 3170805 3319842 3334011 3494968 3592087 3706501 3713544 3861172 3990464 4092104 4035929
FY12 3M13 1H13 9M13 FY13 3M14 1H14 9M14 FY14 3M15 1H15 9M15 FY15 4M16
NATIONALYoY
EAST JAVAYoY
16Source East Java Gov
East Java amp National BPS
Regional Economic Growth
640562 521 512 500 500 471 470 473 479 492
727
615 640 594 591 590518 525 544 544 534
FY12 FY13 3M14 1H14 9M14 FY14 3M15 1H15 9M15 FY15 3M16
17
FINANCIAL HIGHLIGHTS
18
Balance Sheet
InformationIn million Rp
7M15 7M16 YoY
Total Asset 49222516 50786968 318
Placement BI amp SBI 14108042 11775816 -1653
Loan 28654214 29290730 222
Allowance for Impairment Losses (937449) (1203961) 2843
Third Party Fund 41644181 42537452 215
- Current Account 17698264 17926232 129
- Saving Account 10629904 12087219 1371
- Time Deposit 13316012 12524002 -595
Equity 5922719 6266316 580
19
Profit amp Loss
InformationIn million Rp
7M15 7M16 YoY
Interest Income 2636359 2792540 592
Interest Expense (822491) (823520) 013
Nett Interest Income 1813868 1969020 855
Non Interest Operational Income 274986 257429 -638
Non Interest Operational Expense (1394811) (1058368) -2412
Provision for Impairment Losses (428576) (323833) -2444
Nett Non Interest Operational Income (Expense)
(1119825) (1124772) 044
Operational Profit 694043 844248 2164
Non Operational Profit 41924 4298 -8975
Pre Tax Profit 735967 848546 1530
Taxes (223001) (236231) 593
Net profit 512966 612315 1937
142 157 163 174200
249291
331
380
525 508
46 55 74
101
131
161 186
223
262
287 293
120 132 137 145162
201222
260
303
446425
04 0405 05
09 09
0708
094
118
06106
07 07 07 0708
0908
12
134
082
17 172 21
27 28 2933
41
46
279
TOTAL ASSET (Rp Tril)
INTEREST INCOME (Rp Tril) INTEREST EXPENSE (Rp Tril)
CAGR =
1261
CAGR =
1142
CAGR =
1256
NET PROFIT (Rp Tril)
THIRD PARTY FUND(Rp Tril)
CAGR =
1533
LOAN (Rp Tril)
CAGR =
2153
CAGR =
1524
20
Financial Performance
R
O
A
R
O
E
N
I
M
Financial Ratio
23
261
414 407
355394
375
558
497
334
382352
267
380
318296
2004 2005 2006 2007 2008 2009 2010 2011 2012 2013 2014 2015 3M16 1H16 7M16
3054
36903848
308531482859
4057
3365
1896190418981611
23492087
1941
2004 2005 2006 2007 2008 2009 2010 2011 2012 2013 2014 2015 3M16 1H16 7M16
910 939 934
728
835766
917
795
648714 690
641683 669 665
2004 2005 2006 2007 2008 2009 2010 2011 2012 2013 2014 2015 3M16 1H16 7M16
L
D
R
C
A
R
B
O
P
O
22
Financial Ratio
4545 4513
38754211
5404
6967
8070 80118355 8498 8654
8292
68117264
6886
2004 2005 2006 2007 2008 2009 2010 2011 2012 2013 2014 2015 3M16 1H16 7M16
15291817
3845
3339
2536
21321919
1653
26562372
2217 21221946 2065 2047
2004 2005 2006 2007 2008 2009 2010 2011 2012 2013 2014 2015 3M16 1H16 7M16
7467 73836943 6820 6742 6604
5958 6002
6869 7028 6963
7611
6532
70567232
2004 2005 2006 2007 2008 2009 2010 2011 2012 2013 2014 2015 3M16 1H16 7M16
23
OVERVIEW amp INVESTMENT HIGHLIGHTS
24
Current AccountYoY 129
Saving AccountYoY 1371
Time DepositYoY (595)
Third Party Fund
9662
12083
9969
16563
11649
18292
20116
17698
13494
21037
15345
17926
81747064
9970
8082
10991
9172 9128
10630
12753
1098712379 12087
4374
8269
6048
10834
7630
10509
13437 13316
8016
9482
12578 12524
FY12 1H13 FY13 1H14 FY14 3M15 1H15 7M15 FY15 3M16 1H16 7M16
Current Account
Saving Account
Time Deposit
In Billion Rp
In Billion Rp
Government Current
Acc
YoY (1752)
Private Current Acc
YoY 20528
YoY
SIMPEDA 1091
SIKLUS 4390
Hajj Saving 289
TabunganKu 2476
Barokah Saving 3115
Time Deposit
YoY (595)
25
Detailed Third Party Fund
13821 11959 7220 14710 15803 16204 17985
5718 16715
10411 13365
2742 3491 4429
3582 4313 1494 1596
7776
4322 4933
4561
1H14 9M14 FY14 3M15 1H15 7M15 9M15 FY15 3M16 1H16 7M16
Current Account
Government Private
241 290 657 418 535 560 581 861 674 752 806 179 194 208 218 199 204 215 224 230 208 210
6946 7682
9239 7705 7543
8977 8535
10561 9046
10330 9957
651 687
795
748 762
797 814
994
925
980 994
65 70
93
83 87
92 94
112
112
110 120
1H14 9M14 FY14 3M15 1H15 7M15 9M15 FY15 3M16 1H16 7M16
Saving Account
SIKLUS Hajj Saving SIMPEDA TabunganKu Barokah Saving
10834 11331 7630 10509 13437 13316 13934 8016 9482 12578 12524
1H14 9M14 FY14 3M15 1H15 7M15 9M15 FY15 3M16 1H16 7M16
Time Deposit
26
Third Party Fund Customer
In million Rp
FY12 3M13 1H13 9M13 FY13 3M14 1H14 9M14 FY14 3M15 1H15 9M15 FY15 1H16 7M16
44
13
7
43
63
4
44
25
4
45
33
4
46
85
3
47
01
4
48
35
8
49
41
1
50
13
4
50
92
7
53
65
8
54
36
9
51
36
1
53
33
7
53
49
3
20
45
785
21
00
510
21
44
912
25
11
507
41
26
826
41
61
277
41
99
590
42
55
204
43
33
820
44
03
899
44
62
107
45
43
12
9
46
26
910
48
21
838
48
39
565
23
61
6
24
42
5
24
53
8
25
27
4
26
17
6
25
27
7
27
20
9
28
17
3
29
19
4
30
72
8
30
78
8
32
69
2
34
16
7
35
87
2
36
77
2
Total Customer
Current Account Saving Account Time Deposit
21831
27733 27304 27883
21277 24866
34252 31270
23236
35918 37489 36015
26273 28769
33511
399 322 329 303 242 199 192 210 254 208 205 225 276 257 250
18521 27761
33698 33250
23107
32546
39819 40218
26134
34200
43644 42621
23462
35063 34059
FY12 3M13 1H13 9M13 FY13 3M14 1H14 9M14 FY14 3M15 1H15 9M15 FY15 1H16 7M16
Ticket Size
Current Account Saving Account Time Deposit
27
Competitive Product
CONSUMER
COMMERCIAL
SME
CONSUMER LOAN Julyrsquo15 Julyrsquo16
Multipurpose 5447 5597
Mortgage 481 514
Others 236 301
Total 6164 6411
COMMERCIAL LOAN Julyrsquo15 Julyrsquo16
Standby Loan 374 224
Keppres 370 354
Overdraft 963 986
Syndicate 458 452
Total 2165 2015
Small Medium Ent Julyrsquo15 Julyrsquo16
KUR 241 082
Pundi Kencana 392 428
Jatim Mikro 160 188
Others 879 877
Total 1671 1574
28
Loan Proportion
In Billion Rp
YoY
Consumer
632
Commercial
(489)
SME
(369)
29
Type Of Loan
15599 16224 16711 17064 17575 17663 17939 18186 18427 18875 18779
5019 5624 5180 5054
6024 6204 6586 5697 5334 5789 5901
4203 4239 4304 4450 4689 4787 4710 4528 4507 4612 4611
1H14 9M14 FY14 3M15 1H15 7M15 9M15 FY15 3M16 1H16 7M16
Consumer Commercial SME
In Billion Rp
YoY
Multi
purpose
503
Mortgage
919
Others
3012
30
Type Of Loan
13864 14408
14849 15152 15609 15608 15794 15924 16117
16499 16394
1177 1233 1299 1340 1369 1379 1399 1434 1465 1502 1505
559 583 563 572 597 677 746 827 845 875 880
1H14 9M14 FY14 3M15 1H15 7M15 9M15 FY15 3M16 1H16 7M16
CONSUMER LOAN
Multipurpose Mortgage Others
In Billion Rp
YoY
Standby
Loan
(3877)
Keppres
(235)
Overdraft
462
Syndicate
071
31
Type Of Loan1
0
75
12
86
10
13
81
2
10
23
10
71
12
44
84
7
59
4
65
6
65
6
82
4 11
57
68
7
44
9
97
8
10
60
13
37
74
8
55
9
96
4
10
35
22
17
22
59
23
08
25
75
27
41
27
59
26
92
27
66
28
22
28
67
28
87
90
3
92
2
11
71
12
18
12
81
13
14
13
14
13
36
13
60
13
01
13
23
1H14 9M14 FY14 3M15 1H15 7M15 9M15 FY15 3M16 1H16 7M16
Commercial Loan
Standby Loan Keppres Overdraft Syndicate
In Billion Rp
YoY
KUR
(6532)
Pundi
Kencana
1163
Mikro
2031
Others
200
32
Type Of Loan1218
1128
1058
893
735
689
601
451
347
258
239
693
747
796
950
1108
1123
1157
1178
1223
1273
1254
78
165
264
345
452
457
491
520
530
557
550
2214
2199
2186
2262
2395
2517
2461
2380
2407
2523
2568
1H14 9M14 FY14 3M15 1H15 7M15 9M15 FY15 3M16 1H16 7M16
SME Loan
KUR Pundi Kencana Mikro Others
33
Type Of Loan
26
22
93
26
06
47
25
96
58
26
17
30
26
36
14
26
39
07
25
45
01
25
34
43
25
37
33
25
35
85
85
98
96
44
87
30
71
94
96
70
11
5
82
83
64
64
02
91
60
94
88
45
9
51
43
9
86
42
7
49
43
2
81
45
2
44
44
1
49
41
6
35
41
8
61
42
3
00
42
2
37
1H14 9M14 FY14 3M15 1H15 9M15 FY15 3M16 1H16 7M16
Total Customer
Consumer Commercial SME
5947 6225 6436 652 6667 6797 7146 7271 7439 7406
58231 58311 5933
702662292
56868
68119
83319
63196 62194
9147 9637 10069 1028 10366 10669 10877 10767 10903 10916
1H14 9M14 FY14 3M15 1H15 9M15 FY15 3M16 1H16 7M16
Ticket Size
Consumer Commercial SME
34
STRENGTH
35
Strength Of Funding
517
460 477426
403435
463 480431 407 435
384 385 394 421
246
254 288
362358
241
250284 359
354368
384 363 372284
237 285 235212
239 237287
237 210 239197
232 252 234294
2002 2003 2004 2005 2006 2007 2008 2009 2010 2011 2012 2013 2014 2015 7M16
Time deposit Saving deposit Current account
448 453
300 253 302 318 321261
316 354 348268 301
368256 301 284 283
492 500
275239
310 328 331
258326
381 371
267345
395
250277 297 296
3M12 1H12 9M12 FY12 3M13 1H13 9M13 FY13 3M14 1H14 9M14 FY14 3M15 1H15 FY15 3M16 1H16 7M16
Cost of Fund(+) Local Government (-) Local Government
Description Details
Civil Servants (per December 2014) 426545
Multipurpose Customer (Civil Servants) 238965
5602
NPL 039 as of Julyrsquo 2016
36
Strength of Loan (Multipurpose Loan)
567 593 612 619 631 640
666 675 690 686
1H14 9M14 FY14 3M15 1H15 9M15 FY15 3M16 1H16 7M16
Multiguna Ticket Size (million) Rp
13864
14408
14849
15152
1560915794
1592416117
1649916394
1H14 9M14 FY14 3M15 1H15 9M15 FY15 3M16 1H16 7M16
Multiguna Loan Balance
( Billion Rp )
Foreign Institution Investor
7260 from public shares
Foreign Institution Investor
6581 from public shares
Public shares 20
from paid capital Domestic Investor
3419 from public shares
Domestic Investor
2740 from public shares
37
No Country Share
1 INDONESIA 3419402 LUKSEMBURG 161267
3 AMERIKA 1341304 NORWEGIA 1111345 SIPRUS 838626 FINLANDIA 577797 VIRGIN ISLAND 41059
8 INGGRIS 223339 IRLANDIA 17073
10 AUSTRALIA 0964611 JEPANG 0839812 KANADA 05512
No Country Share
14 SWEDIA 0248915 SINGAPURA 0201816 CAYMAN ISLAND 0060317 GREENLAND 0033118 CINA 0019319 SWITSERLAND 0011320 KOREA SELATAN 0007421 FILIPINA 0002222 MALAYSIA 0001523 HONGKONG 0000824 JERMAN 00001
Total 100
STRENGTH OF INSTITUTIONS INVESTOR
38
Awards amp Achievements
The Most Trusted Banking in
Microfinance Services of The
Year 2015
Very Good Predicate for 2014
Financial Performance
Infobank Awards 2015
Bank Jatim Regional Banks with
excellent service of the year
2016
Excellence in Building and
Managing Corporate Image
Corporate Image Award 2015
The 1st Champion of Indonesia
Original Brand 2015
Top BPD HRampIT Management
2016
39
Investor Relations (IR)
Corporate Secretary
(031) 5310090 ext 469
Email irubankjatimcoid
Contact

6
COMPANY REVIEW
7
LOANIn million Rp
7M15 7M16 YoY
Loan 28654214 29290730 222
- Commercial 6204245 5900919 -489
- SME 4787018 4610501 -369
- Consumer 17662952 18779310 632
Financial Performance
bull Multi-purpose credit still becomes the largest contributor
bull Standby loan credit facilities start running again with collateral regulations adjustmentand more prudential analysis
bull Adjust with single digit rate from OJK PundiKencana (SME) Credit Facility implemented with 10 rate and micro credit from government funding with rate under 10
FUNDIn million Rp
7M15 7M16 YoY
Third Party Fund 41644181 42537452 215
- Current Account 17698264 17926232 129
- Saving Account 10629904 12087219 1371
- Time Deposit 13316012 12524002 -595
bull Current account and Saving account increase low rate cost funding
bull Deposits with high interest rates have been reduced to lower the interest expense
8
InformationIn million Rp
7M15 7M16 YoY
Net Interest Income 1813868 1969020 855
Net Non Interest Operational Income
(Expense)(1119825) (1124772) 044
Net profit 512966 612315 1937
- ROA 274 296
- ROE 1599 1941
- NIM 655 665
Financial Performance
bull Dealer Treasury activityrsquos become thesignificant contributor for interest income the portion up to 20 from interest income
bull Operational profit increased due to higher interest income and lower impairment losses
9
Non Performing Loan
bull Bank Jatim still faces the non performing loan and yet to decrease the rising of the NPL last year was caused by
- Commercial credit npl standby loan and keppres
- Multipurpose npl from death and fired people decrease from insurance claim
- Financial Services Authority policy on lending quality of sharia rural bank based on capital adequate ratio level
bull Bank Jatimrsquos Credit Risk Division and Adhoc team keep attempting to reduce the NPL
bull The current NPL comes from the same debtors similar to last year and we still maintain the debtor to restructuring or rescheduling the credit based on their business Some of the standby loanrsquos debtors are waiting from the appeal completion in court
bull Managementrsquos efforts to reduce NPL are by conducting collection and auction the collateral
bull Strengthening capability assessment for credit officer improvement credit regulation and reconstruction of credit intern law
NPL 1H15 9M15 FY15 1M16 2M16 3M16 4M16 5M16 1H16 7M16
Consumer 075 086 074 077 081 082 085 089 085 091
SME 759 802 1111 1144 1165 1162 1154 1146 1136 1160
Commercial 978 1053 997 1159 1146 1142 1133 1181 1127 1190
NPL GROSS 382 422 429 451 457 459 465 479 458 483
Coverage Ratio 7582 8428 8102 8214 8217 8087 8194 8420 8337 8512
10
BUSINESS PLAN
11
Business Plan 2016
Description 2015 2016 E
Total Asset 1265 536
Loan 846 1207
Third Party Fund 1319 505
Financial Ratio
- CAR 2122 1899
- LDR 8292 8846
- NPL Gross 429 425
- NIM 641 744
- BOPO 7611 8454
- ROE 1611 1838
- ROA 267 321
LOAN STRATEGY
bull Credit for vehicle acquirement
bull Increasing MoU with government institutions for multipurpose also private corporates
bull Intensifying linkage program to rural bank members of Perbamida or Perbarindo
FUNDING STRATEGY
bull Cooperating with competent institutions to distribute school operational fund
bull Expanding funding networks
bull Intensifying new funding products implementation
bull Pricing Strategy for lower interest rate
NPL STRATEGY
bull Collection with credit restructuring
bull Special collection for rest of government payment project terms
bull Insurances claim accelerations and recoveries
bull Collateral auction
GENERAL STRATEGY
bull Revitalization into competence and professional human capital to shape competency based on resource management
bull Development and reorganization of head office and branches for customer centric
12
NETWORK
Network 2009 2010 2011 2012 2013 2014 2015 7M16NETWORK
2016
SHARIA
2016
Head Office 1 1 1 1 1 1 1 1 1
Branch Office 39 41 41 41 41 43 45 46 1 2
Sub Branch
Office26 44 67 81 107 153 165 166 5 10
Cash office 151 154 164 164 176 165 185 185 9 6
Sharia service
office37 37 47 47 47 97 97 97 94
Payment Point 78 88 115 138 155 167 171 173 8 7
Mobile cash 45 49 57 57 59 62 65 78 11 6
Mobile ATM - 4 4 6 6 6 6 6
CDM 1 1 1 1 1 2 2 2
ATM 87 142 262 368 479 595 688 692 13 15
Total network 465 561 759 904 1072 1291 1425 1446
13
APPENDIX
14
ECONOMIC OUTLOOK
550 525 525
575 575 600725 750 750 750 750 775 750
675 650 650
430
590 590
840 838732
670
453
836
335
445345 321
FY12 3M13 1H13 9M13 FY13 3M14 1H14 9M14 FY14 FY15 3M16 1H16 7M16
LOANbillion
FUNDbillion
JIBOR
INFLASI
BI RATE
LOANbillion
FUNDbillion
INFLASI
BI RATE
BI 7-Day Repo Rate
15Source Bank Indonesia
MACRO ECONOMY REVIEW
In billion Rp
3225198 3243136 3374272 3526188 3663968 3618064 3834503 3995803 4114420 4198577 4319749 4464083 4413056 4478409
2725674 2787372 2982436 3170805 3319842 3334011 3494968 3592087 3706501 3713544 3861172 3990464 4092104 4035929
FY12 3M13 1H13 9M13 FY13 3M14 1H14 9M14 FY14 3M15 1H15 9M15 FY15 4M16
NATIONALYoY
EAST JAVAYoY
16Source East Java Gov
East Java amp National BPS
Regional Economic Growth
640562 521 512 500 500 471 470 473 479 492
727
615 640 594 591 590518 525 544 544 534
FY12 FY13 3M14 1H14 9M14 FY14 3M15 1H15 9M15 FY15 3M16
17
FINANCIAL HIGHLIGHTS
18
Balance Sheet
InformationIn million Rp
7M15 7M16 YoY
Total Asset 49222516 50786968 318
Placement BI amp SBI 14108042 11775816 -1653
Loan 28654214 29290730 222
Allowance for Impairment Losses (937449) (1203961) 2843
Third Party Fund 41644181 42537452 215
- Current Account 17698264 17926232 129
- Saving Account 10629904 12087219 1371
- Time Deposit 13316012 12524002 -595
Equity 5922719 6266316 580
19
Profit amp Loss
InformationIn million Rp
7M15 7M16 YoY
Interest Income 2636359 2792540 592
Interest Expense (822491) (823520) 013
Nett Interest Income 1813868 1969020 855
Non Interest Operational Income 274986 257429 -638
Non Interest Operational Expense (1394811) (1058368) -2412
Provision for Impairment Losses (428576) (323833) -2444
Nett Non Interest Operational Income (Expense)
(1119825) (1124772) 044
Operational Profit 694043 844248 2164
Non Operational Profit 41924 4298 -8975
Pre Tax Profit 735967 848546 1530
Taxes (223001) (236231) 593
Net profit 512966 612315 1937
142 157 163 174200
249291
331
380
525 508
46 55 74
101
131
161 186
223
262
287 293
120 132 137 145162
201222
260
303
446425
04 0405 05
09 09
0708
094
118
06106
07 07 07 0708
0908
12
134
082
17 172 21
27 28 2933
41
46
279
TOTAL ASSET (Rp Tril)
INTEREST INCOME (Rp Tril) INTEREST EXPENSE (Rp Tril)
CAGR =
1261
CAGR =
1142
CAGR =
1256
NET PROFIT (Rp Tril)
THIRD PARTY FUND(Rp Tril)
CAGR =
1533
LOAN (Rp Tril)
CAGR =
2153
CAGR =
1524
20
Financial Performance
R
O
A
R
O
E
N
I
M
Financial Ratio
23
261
414 407
355394
375
558
497
334
382352
267
380
318296
2004 2005 2006 2007 2008 2009 2010 2011 2012 2013 2014 2015 3M16 1H16 7M16
3054
36903848
308531482859
4057
3365
1896190418981611
23492087
1941
2004 2005 2006 2007 2008 2009 2010 2011 2012 2013 2014 2015 3M16 1H16 7M16
910 939 934
728
835766
917
795
648714 690
641683 669 665
2004 2005 2006 2007 2008 2009 2010 2011 2012 2013 2014 2015 3M16 1H16 7M16
L
D
R
C
A
R
B
O
P
O
22
Financial Ratio
4545 4513
38754211
5404
6967
8070 80118355 8498 8654
8292
68117264
6886
2004 2005 2006 2007 2008 2009 2010 2011 2012 2013 2014 2015 3M16 1H16 7M16
15291817
3845
3339
2536
21321919
1653
26562372
2217 21221946 2065 2047
2004 2005 2006 2007 2008 2009 2010 2011 2012 2013 2014 2015 3M16 1H16 7M16
7467 73836943 6820 6742 6604
5958 6002
6869 7028 6963
7611
6532
70567232
2004 2005 2006 2007 2008 2009 2010 2011 2012 2013 2014 2015 3M16 1H16 7M16
23
OVERVIEW amp INVESTMENT HIGHLIGHTS
24
Current AccountYoY 129
Saving AccountYoY 1371
Time DepositYoY (595)
Third Party Fund
9662
12083
9969
16563
11649
18292
20116
17698
13494
21037
15345
17926
81747064
9970
8082
10991
9172 9128
10630
12753
1098712379 12087
4374
8269
6048
10834
7630
10509
13437 13316
8016
9482
12578 12524
FY12 1H13 FY13 1H14 FY14 3M15 1H15 7M15 FY15 3M16 1H16 7M16
Current Account
Saving Account
Time Deposit
In Billion Rp
In Billion Rp
Government Current
Acc
YoY (1752)
Private Current Acc
YoY 20528
YoY
SIMPEDA 1091
SIKLUS 4390
Hajj Saving 289
TabunganKu 2476
Barokah Saving 3115
Time Deposit
YoY (595)
25
Detailed Third Party Fund
13821 11959 7220 14710 15803 16204 17985
5718 16715
10411 13365
2742 3491 4429
3582 4313 1494 1596
7776
4322 4933
4561
1H14 9M14 FY14 3M15 1H15 7M15 9M15 FY15 3M16 1H16 7M16
Current Account
Government Private
241 290 657 418 535 560 581 861 674 752 806 179 194 208 218 199 204 215 224 230 208 210
6946 7682
9239 7705 7543
8977 8535
10561 9046
10330 9957
651 687
795
748 762
797 814
994
925
980 994
65 70
93
83 87
92 94
112
112
110 120
1H14 9M14 FY14 3M15 1H15 7M15 9M15 FY15 3M16 1H16 7M16
Saving Account
SIKLUS Hajj Saving SIMPEDA TabunganKu Barokah Saving
10834 11331 7630 10509 13437 13316 13934 8016 9482 12578 12524
1H14 9M14 FY14 3M15 1H15 7M15 9M15 FY15 3M16 1H16 7M16
Time Deposit
26
Third Party Fund Customer
In million Rp
FY12 3M13 1H13 9M13 FY13 3M14 1H14 9M14 FY14 3M15 1H15 9M15 FY15 1H16 7M16
44
13
7
43
63
4
44
25
4
45
33
4
46
85
3
47
01
4
48
35
8
49
41
1
50
13
4
50
92
7
53
65
8
54
36
9
51
36
1
53
33
7
53
49
3
20
45
785
21
00
510
21
44
912
25
11
507
41
26
826
41
61
277
41
99
590
42
55
204
43
33
820
44
03
899
44
62
107
45
43
12
9
46
26
910
48
21
838
48
39
565
23
61
6
24
42
5
24
53
8
25
27
4
26
17
6
25
27
7
27
20
9
28
17
3
29
19
4
30
72
8
30
78
8
32
69
2
34
16
7
35
87
2
36
77
2
Total Customer
Current Account Saving Account Time Deposit
21831
27733 27304 27883
21277 24866
34252 31270
23236
35918 37489 36015
26273 28769
33511
399 322 329 303 242 199 192 210 254 208 205 225 276 257 250
18521 27761
33698 33250
23107
32546
39819 40218
26134
34200
43644 42621
23462
35063 34059
FY12 3M13 1H13 9M13 FY13 3M14 1H14 9M14 FY14 3M15 1H15 9M15 FY15 1H16 7M16
Ticket Size
Current Account Saving Account Time Deposit
27
Competitive Product
CONSUMER
COMMERCIAL
SME
CONSUMER LOAN Julyrsquo15 Julyrsquo16
Multipurpose 5447 5597
Mortgage 481 514
Others 236 301
Total 6164 6411
COMMERCIAL LOAN Julyrsquo15 Julyrsquo16
Standby Loan 374 224
Keppres 370 354
Overdraft 963 986
Syndicate 458 452
Total 2165 2015
Small Medium Ent Julyrsquo15 Julyrsquo16
KUR 241 082
Pundi Kencana 392 428
Jatim Mikro 160 188
Others 879 877
Total 1671 1574
28
Loan Proportion
In Billion Rp
YoY
Consumer
632
Commercial
(489)
SME
(369)
29
Type Of Loan
15599 16224 16711 17064 17575 17663 17939 18186 18427 18875 18779
5019 5624 5180 5054
6024 6204 6586 5697 5334 5789 5901
4203 4239 4304 4450 4689 4787 4710 4528 4507 4612 4611
1H14 9M14 FY14 3M15 1H15 7M15 9M15 FY15 3M16 1H16 7M16
Consumer Commercial SME
In Billion Rp
YoY
Multi
purpose
503
Mortgage
919
Others
3012
30
Type Of Loan
13864 14408
14849 15152 15609 15608 15794 15924 16117
16499 16394
1177 1233 1299 1340 1369 1379 1399 1434 1465 1502 1505
559 583 563 572 597 677 746 827 845 875 880
1H14 9M14 FY14 3M15 1H15 7M15 9M15 FY15 3M16 1H16 7M16
CONSUMER LOAN
Multipurpose Mortgage Others
In Billion Rp
YoY
Standby
Loan
(3877)
Keppres
(235)
Overdraft
462
Syndicate
071
31
Type Of Loan1
0
75
12
86
10
13
81
2
10
23
10
71
12
44
84
7
59
4
65
6
65
6
82
4 11
57
68
7
44
9
97
8
10
60
13
37
74
8
55
9
96
4
10
35
22
17
22
59
23
08
25
75
27
41
27
59
26
92
27
66
28
22
28
67
28
87
90
3
92
2
11
71
12
18
12
81
13
14
13
14
13
36
13
60
13
01
13
23
1H14 9M14 FY14 3M15 1H15 7M15 9M15 FY15 3M16 1H16 7M16
Commercial Loan
Standby Loan Keppres Overdraft Syndicate
In Billion Rp
YoY
KUR
(6532)
Pundi
Kencana
1163
Mikro
2031
Others
200
32
Type Of Loan1218
1128
1058
893
735
689
601
451
347
258
239
693
747
796
950
1108
1123
1157
1178
1223
1273
1254
78
165
264
345
452
457
491
520
530
557
550
2214
2199
2186
2262
2395
2517
2461
2380
2407
2523
2568
1H14 9M14 FY14 3M15 1H15 7M15 9M15 FY15 3M16 1H16 7M16
SME Loan
KUR Pundi Kencana Mikro Others
33
Type Of Loan
26
22
93
26
06
47
25
96
58
26
17
30
26
36
14
26
39
07
25
45
01
25
34
43
25
37
33
25
35
85
85
98
96
44
87
30
71
94
96
70
11
5
82
83
64
64
02
91
60
94
88
45
9
51
43
9
86
42
7
49
43
2
81
45
2
44
44
1
49
41
6
35
41
8
61
42
3
00
42
2
37
1H14 9M14 FY14 3M15 1H15 9M15 FY15 3M16 1H16 7M16
Total Customer
Consumer Commercial SME
5947 6225 6436 652 6667 6797 7146 7271 7439 7406
58231 58311 5933
702662292
56868
68119
83319
63196 62194
9147 9637 10069 1028 10366 10669 10877 10767 10903 10916
1H14 9M14 FY14 3M15 1H15 9M15 FY15 3M16 1H16 7M16
Ticket Size
Consumer Commercial SME
34
STRENGTH
35
Strength Of Funding
517
460 477426
403435
463 480431 407 435
384 385 394 421
246
254 288
362358
241
250284 359
354368
384 363 372284
237 285 235212
239 237287
237 210 239197
232 252 234294
2002 2003 2004 2005 2006 2007 2008 2009 2010 2011 2012 2013 2014 2015 7M16
Time deposit Saving deposit Current account
448 453
300 253 302 318 321261
316 354 348268 301
368256 301 284 283
492 500
275239
310 328 331
258326
381 371
267345
395
250277 297 296
3M12 1H12 9M12 FY12 3M13 1H13 9M13 FY13 3M14 1H14 9M14 FY14 3M15 1H15 FY15 3M16 1H16 7M16
Cost of Fund(+) Local Government (-) Local Government
Description Details
Civil Servants (per December 2014) 426545
Multipurpose Customer (Civil Servants) 238965
5602
NPL 039 as of Julyrsquo 2016
36
Strength of Loan (Multipurpose Loan)
567 593 612 619 631 640
666 675 690 686
1H14 9M14 FY14 3M15 1H15 9M15 FY15 3M16 1H16 7M16
Multiguna Ticket Size (million) Rp
13864
14408
14849
15152
1560915794
1592416117
1649916394
1H14 9M14 FY14 3M15 1H15 9M15 FY15 3M16 1H16 7M16
Multiguna Loan Balance
( Billion Rp )
Foreign Institution Investor
7260 from public shares
Foreign Institution Investor
6581 from public shares
Public shares 20
from paid capital Domestic Investor
3419 from public shares
Domestic Investor
2740 from public shares
37
No Country Share
1 INDONESIA 3419402 LUKSEMBURG 161267
3 AMERIKA 1341304 NORWEGIA 1111345 SIPRUS 838626 FINLANDIA 577797 VIRGIN ISLAND 41059
8 INGGRIS 223339 IRLANDIA 17073
10 AUSTRALIA 0964611 JEPANG 0839812 KANADA 05512
No Country Share
14 SWEDIA 0248915 SINGAPURA 0201816 CAYMAN ISLAND 0060317 GREENLAND 0033118 CINA 0019319 SWITSERLAND 0011320 KOREA SELATAN 0007421 FILIPINA 0002222 MALAYSIA 0001523 HONGKONG 0000824 JERMAN 00001
Total 100
STRENGTH OF INSTITUTIONS INVESTOR
38
Awards amp Achievements
The Most Trusted Banking in
Microfinance Services of The
Year 2015
Very Good Predicate for 2014
Financial Performance
Infobank Awards 2015
Bank Jatim Regional Banks with
excellent service of the year
2016
Excellence in Building and
Managing Corporate Image
Corporate Image Award 2015
The 1st Champion of Indonesia
Original Brand 2015
Top BPD HRampIT Management
2016
39
Investor Relations (IR)
Corporate Secretary
(031) 5310090 ext 469
Email irubankjatimcoid
Contact

7
LOANIn million Rp
7M15 7M16 YoY
Loan 28654214 29290730 222
- Commercial 6204245 5900919 -489
- SME 4787018 4610501 -369
- Consumer 17662952 18779310 632
Financial Performance
bull Multi-purpose credit still becomes the largest contributor
bull Standby loan credit facilities start running again with collateral regulations adjustmentand more prudential analysis
bull Adjust with single digit rate from OJK PundiKencana (SME) Credit Facility implemented with 10 rate and micro credit from government funding with rate under 10
FUNDIn million Rp
7M15 7M16 YoY
Third Party Fund 41644181 42537452 215
- Current Account 17698264 17926232 129
- Saving Account 10629904 12087219 1371
- Time Deposit 13316012 12524002 -595
bull Current account and Saving account increase low rate cost funding
bull Deposits with high interest rates have been reduced to lower the interest expense
8
InformationIn million Rp
7M15 7M16 YoY
Net Interest Income 1813868 1969020 855
Net Non Interest Operational Income
(Expense)(1119825) (1124772) 044
Net profit 512966 612315 1937
- ROA 274 296
- ROE 1599 1941
- NIM 655 665
Financial Performance
bull Dealer Treasury activityrsquos become thesignificant contributor for interest income the portion up to 20 from interest income
bull Operational profit increased due to higher interest income and lower impairment losses
9
Non Performing Loan
bull Bank Jatim still faces the non performing loan and yet to decrease the rising of the NPL last year was caused by
- Commercial credit npl standby loan and keppres
- Multipurpose npl from death and fired people decrease from insurance claim
- Financial Services Authority policy on lending quality of sharia rural bank based on capital adequate ratio level
bull Bank Jatimrsquos Credit Risk Division and Adhoc team keep attempting to reduce the NPL
bull The current NPL comes from the same debtors similar to last year and we still maintain the debtor to restructuring or rescheduling the credit based on their business Some of the standby loanrsquos debtors are waiting from the appeal completion in court
bull Managementrsquos efforts to reduce NPL are by conducting collection and auction the collateral
bull Strengthening capability assessment for credit officer improvement credit regulation and reconstruction of credit intern law
NPL 1H15 9M15 FY15 1M16 2M16 3M16 4M16 5M16 1H16 7M16
Consumer 075 086 074 077 081 082 085 089 085 091
SME 759 802 1111 1144 1165 1162 1154 1146 1136 1160
Commercial 978 1053 997 1159 1146 1142 1133 1181 1127 1190
NPL GROSS 382 422 429 451 457 459 465 479 458 483
Coverage Ratio 7582 8428 8102 8214 8217 8087 8194 8420 8337 8512
10
BUSINESS PLAN
11
Business Plan 2016
Description 2015 2016 E
Total Asset 1265 536
Loan 846 1207
Third Party Fund 1319 505
Financial Ratio
- CAR 2122 1899
- LDR 8292 8846
- NPL Gross 429 425
- NIM 641 744
- BOPO 7611 8454
- ROE 1611 1838
- ROA 267 321
LOAN STRATEGY
bull Credit for vehicle acquirement
bull Increasing MoU with government institutions for multipurpose also private corporates
bull Intensifying linkage program to rural bank members of Perbamida or Perbarindo
FUNDING STRATEGY
bull Cooperating with competent institutions to distribute school operational fund
bull Expanding funding networks
bull Intensifying new funding products implementation
bull Pricing Strategy for lower interest rate
NPL STRATEGY
bull Collection with credit restructuring
bull Special collection for rest of government payment project terms
bull Insurances claim accelerations and recoveries
bull Collateral auction
GENERAL STRATEGY
bull Revitalization into competence and professional human capital to shape competency based on resource management
bull Development and reorganization of head office and branches for customer centric
12
NETWORK
Network 2009 2010 2011 2012 2013 2014 2015 7M16NETWORK
2016
SHARIA
2016
Head Office 1 1 1 1 1 1 1 1 1
Branch Office 39 41 41 41 41 43 45 46 1 2
Sub Branch
Office26 44 67 81 107 153 165 166 5 10
Cash office 151 154 164 164 176 165 185 185 9 6
Sharia service
office37 37 47 47 47 97 97 97 94
Payment Point 78 88 115 138 155 167 171 173 8 7
Mobile cash 45 49 57 57 59 62 65 78 11 6
Mobile ATM - 4 4 6 6 6 6 6
CDM 1 1 1 1 1 2 2 2
ATM 87 142 262 368 479 595 688 692 13 15
Total network 465 561 759 904 1072 1291 1425 1446
13
APPENDIX
14
ECONOMIC OUTLOOK
550 525 525
575 575 600725 750 750 750 750 775 750
675 650 650
430
590 590
840 838732
670
453
836
335
445345 321
FY12 3M13 1H13 9M13 FY13 3M14 1H14 9M14 FY14 FY15 3M16 1H16 7M16
LOANbillion
FUNDbillion
JIBOR
INFLASI
BI RATE
LOANbillion
FUNDbillion
INFLASI
BI RATE
BI 7-Day Repo Rate
15Source Bank Indonesia
MACRO ECONOMY REVIEW
In billion Rp
3225198 3243136 3374272 3526188 3663968 3618064 3834503 3995803 4114420 4198577 4319749 4464083 4413056 4478409
2725674 2787372 2982436 3170805 3319842 3334011 3494968 3592087 3706501 3713544 3861172 3990464 4092104 4035929
FY12 3M13 1H13 9M13 FY13 3M14 1H14 9M14 FY14 3M15 1H15 9M15 FY15 4M16
NATIONALYoY
EAST JAVAYoY
16Source East Java Gov
East Java amp National BPS
Regional Economic Growth
640562 521 512 500 500 471 470 473 479 492
727
615 640 594 591 590518 525 544 544 534
FY12 FY13 3M14 1H14 9M14 FY14 3M15 1H15 9M15 FY15 3M16
17
FINANCIAL HIGHLIGHTS
18
Balance Sheet
InformationIn million Rp
7M15 7M16 YoY
Total Asset 49222516 50786968 318
Placement BI amp SBI 14108042 11775816 -1653
Loan 28654214 29290730 222
Allowance for Impairment Losses (937449) (1203961) 2843
Third Party Fund 41644181 42537452 215
- Current Account 17698264 17926232 129
- Saving Account 10629904 12087219 1371
- Time Deposit 13316012 12524002 -595
Equity 5922719 6266316 580
19
Profit amp Loss
InformationIn million Rp
7M15 7M16 YoY
Interest Income 2636359 2792540 592
Interest Expense (822491) (823520) 013
Nett Interest Income 1813868 1969020 855
Non Interest Operational Income 274986 257429 -638
Non Interest Operational Expense (1394811) (1058368) -2412
Provision for Impairment Losses (428576) (323833) -2444
Nett Non Interest Operational Income (Expense)
(1119825) (1124772) 044
Operational Profit 694043 844248 2164
Non Operational Profit 41924 4298 -8975
Pre Tax Profit 735967 848546 1530
Taxes (223001) (236231) 593
Net profit 512966 612315 1937
142 157 163 174200
249291
331
380
525 508
46 55 74
101
131
161 186
223
262
287 293
120 132 137 145162
201222
260
303
446425
04 0405 05
09 09
0708
094
118
06106
07 07 07 0708
0908
12
134
082
17 172 21
27 28 2933
41
46
279
TOTAL ASSET (Rp Tril)
INTEREST INCOME (Rp Tril) INTEREST EXPENSE (Rp Tril)
CAGR =
1261
CAGR =
1142
CAGR =
1256
NET PROFIT (Rp Tril)
THIRD PARTY FUND(Rp Tril)
CAGR =
1533
LOAN (Rp Tril)
CAGR =
2153
CAGR =
1524
20
Financial Performance
R
O
A
R
O
E
N
I
M
Financial Ratio
23
261
414 407
355394
375
558
497
334
382352
267
380
318296
2004 2005 2006 2007 2008 2009 2010 2011 2012 2013 2014 2015 3M16 1H16 7M16
3054
36903848
308531482859
4057
3365
1896190418981611
23492087
1941
2004 2005 2006 2007 2008 2009 2010 2011 2012 2013 2014 2015 3M16 1H16 7M16
910 939 934
728
835766
917
795
648714 690
641683 669 665
2004 2005 2006 2007 2008 2009 2010 2011 2012 2013 2014 2015 3M16 1H16 7M16
L
D
R
C
A
R
B
O
P
O
22
Financial Ratio
4545 4513
38754211
5404
6967
8070 80118355 8498 8654
8292
68117264
6886
2004 2005 2006 2007 2008 2009 2010 2011 2012 2013 2014 2015 3M16 1H16 7M16
15291817
3845
3339
2536
21321919
1653
26562372
2217 21221946 2065 2047
2004 2005 2006 2007 2008 2009 2010 2011 2012 2013 2014 2015 3M16 1H16 7M16
7467 73836943 6820 6742 6604
5958 6002
6869 7028 6963
7611
6532
70567232
2004 2005 2006 2007 2008 2009 2010 2011 2012 2013 2014 2015 3M16 1H16 7M16
23
OVERVIEW amp INVESTMENT HIGHLIGHTS
24
Current AccountYoY 129
Saving AccountYoY 1371
Time DepositYoY (595)
Third Party Fund
9662
12083
9969
16563
11649
18292
20116
17698
13494
21037
15345
17926
81747064
9970
8082
10991
9172 9128
10630
12753
1098712379 12087
4374
8269
6048
10834
7630
10509
13437 13316
8016
9482
12578 12524
FY12 1H13 FY13 1H14 FY14 3M15 1H15 7M15 FY15 3M16 1H16 7M16
Current Account
Saving Account
Time Deposit
In Billion Rp
In Billion Rp
Government Current
Acc
YoY (1752)
Private Current Acc
YoY 20528
YoY
SIMPEDA 1091
SIKLUS 4390
Hajj Saving 289
TabunganKu 2476
Barokah Saving 3115
Time Deposit
YoY (595)
25
Detailed Third Party Fund
13821 11959 7220 14710 15803 16204 17985
5718 16715
10411 13365
2742 3491 4429
3582 4313 1494 1596
7776
4322 4933
4561
1H14 9M14 FY14 3M15 1H15 7M15 9M15 FY15 3M16 1H16 7M16
Current Account
Government Private
241 290 657 418 535 560 581 861 674 752 806 179 194 208 218 199 204 215 224 230 208 210
6946 7682
9239 7705 7543
8977 8535
10561 9046
10330 9957
651 687
795
748 762
797 814
994
925
980 994
65 70
93
83 87
92 94
112
112
110 120
1H14 9M14 FY14 3M15 1H15 7M15 9M15 FY15 3M16 1H16 7M16
Saving Account
SIKLUS Hajj Saving SIMPEDA TabunganKu Barokah Saving
10834 11331 7630 10509 13437 13316 13934 8016 9482 12578 12524
1H14 9M14 FY14 3M15 1H15 7M15 9M15 FY15 3M16 1H16 7M16
Time Deposit
26
Third Party Fund Customer
In million Rp
FY12 3M13 1H13 9M13 FY13 3M14 1H14 9M14 FY14 3M15 1H15 9M15 FY15 1H16 7M16
44
13
7
43
63
4
44
25
4
45
33
4
46
85
3
47
01
4
48
35
8
49
41
1
50
13
4
50
92
7
53
65
8
54
36
9
51
36
1
53
33
7
53
49
3
20
45
785
21
00
510
21
44
912
25
11
507
41
26
826
41
61
277
41
99
590
42
55
204
43
33
820
44
03
899
44
62
107
45
43
12
9
46
26
910
48
21
838
48
39
565
23
61
6
24
42
5
24
53
8
25
27
4
26
17
6
25
27
7
27
20
9
28
17
3
29
19
4
30
72
8
30
78
8
32
69
2
34
16
7
35
87
2
36
77
2
Total Customer
Current Account Saving Account Time Deposit
21831
27733 27304 27883
21277 24866
34252 31270
23236
35918 37489 36015
26273 28769
33511
399 322 329 303 242 199 192 210 254 208 205 225 276 257 250
18521 27761
33698 33250
23107
32546
39819 40218
26134
34200
43644 42621
23462
35063 34059
FY12 3M13 1H13 9M13 FY13 3M14 1H14 9M14 FY14 3M15 1H15 9M15 FY15 1H16 7M16
Ticket Size
Current Account Saving Account Time Deposit
27
Competitive Product
CONSUMER
COMMERCIAL
SME
CONSUMER LOAN Julyrsquo15 Julyrsquo16
Multipurpose 5447 5597
Mortgage 481 514
Others 236 301
Total 6164 6411
COMMERCIAL LOAN Julyrsquo15 Julyrsquo16
Standby Loan 374 224
Keppres 370 354
Overdraft 963 986
Syndicate 458 452
Total 2165 2015
Small Medium Ent Julyrsquo15 Julyrsquo16
KUR 241 082
Pundi Kencana 392 428
Jatim Mikro 160 188
Others 879 877
Total 1671 1574
28
Loan Proportion
In Billion Rp
YoY
Consumer
632
Commercial
(489)
SME
(369)
29
Type Of Loan
15599 16224 16711 17064 17575 17663 17939 18186 18427 18875 18779
5019 5624 5180 5054
6024 6204 6586 5697 5334 5789 5901
4203 4239 4304 4450 4689 4787 4710 4528 4507 4612 4611
1H14 9M14 FY14 3M15 1H15 7M15 9M15 FY15 3M16 1H16 7M16
Consumer Commercial SME
In Billion Rp
YoY
Multi
purpose
503
Mortgage
919
Others
3012
30
Type Of Loan
13864 14408
14849 15152 15609 15608 15794 15924 16117
16499 16394
1177 1233 1299 1340 1369 1379 1399 1434 1465 1502 1505
559 583 563 572 597 677 746 827 845 875 880
1H14 9M14 FY14 3M15 1H15 7M15 9M15 FY15 3M16 1H16 7M16
CONSUMER LOAN
Multipurpose Mortgage Others
In Billion Rp
YoY
Standby
Loan
(3877)
Keppres
(235)
Overdraft
462
Syndicate
071
31
Type Of Loan1
0
75
12
86
10
13
81
2
10
23
10
71
12
44
84
7
59
4
65
6
65
6
82
4 11
57
68
7
44
9
97
8
10
60
13
37
74
8
55
9
96
4
10
35
22
17
22
59
23
08
25
75
27
41
27
59
26
92
27
66
28
22
28
67
28
87
90
3
92
2
11
71
12
18
12
81
13
14
13
14
13
36
13
60
13
01
13
23
1H14 9M14 FY14 3M15 1H15 7M15 9M15 FY15 3M16 1H16 7M16
Commercial Loan
Standby Loan Keppres Overdraft Syndicate
In Billion Rp
YoY
KUR
(6532)
Pundi
Kencana
1163
Mikro
2031
Others
200
32
Type Of Loan1218
1128
1058
893
735
689
601
451
347
258
239
693
747
796
950
1108
1123
1157
1178
1223
1273
1254
78
165
264
345
452
457
491
520
530
557
550
2214
2199
2186
2262
2395
2517
2461
2380
2407
2523
2568
1H14 9M14 FY14 3M15 1H15 7M15 9M15 FY15 3M16 1H16 7M16
SME Loan
KUR Pundi Kencana Mikro Others
33
Type Of Loan
26
22
93
26
06
47
25
96
58
26
17
30
26
36
14
26
39
07
25
45
01
25
34
43
25
37
33
25
35
85
85
98
96
44
87
30
71
94
96
70
11
5
82
83
64
64
02
91
60
94
88
45
9
51
43
9
86
42
7
49
43
2
81
45
2
44
44
1
49
41
6
35
41
8
61
42
3
00
42
2
37
1H14 9M14 FY14 3M15 1H15 9M15 FY15 3M16 1H16 7M16
Total Customer
Consumer Commercial SME
5947 6225 6436 652 6667 6797 7146 7271 7439 7406
58231 58311 5933
702662292
56868
68119
83319
63196 62194
9147 9637 10069 1028 10366 10669 10877 10767 10903 10916
1H14 9M14 FY14 3M15 1H15 9M15 FY15 3M16 1H16 7M16
Ticket Size
Consumer Commercial SME
34
STRENGTH
35
Strength Of Funding
517
460 477426
403435
463 480431 407 435
384 385 394 421
246
254 288
362358
241
250284 359
354368
384 363 372284
237 285 235212
239 237287
237 210 239197
232 252 234294
2002 2003 2004 2005 2006 2007 2008 2009 2010 2011 2012 2013 2014 2015 7M16
Time deposit Saving deposit Current account
448 453
300 253 302 318 321261
316 354 348268 301
368256 301 284 283
492 500
275239
310 328 331
258326
381 371
267345
395
250277 297 296
3M12 1H12 9M12 FY12 3M13 1H13 9M13 FY13 3M14 1H14 9M14 FY14 3M15 1H15 FY15 3M16 1H16 7M16
Cost of Fund(+) Local Government (-) Local Government
Description Details
Civil Servants (per December 2014) 426545
Multipurpose Customer (Civil Servants) 238965
5602
NPL 039 as of Julyrsquo 2016
36
Strength of Loan (Multipurpose Loan)
567 593 612 619 631 640
666 675 690 686
1H14 9M14 FY14 3M15 1H15 9M15 FY15 3M16 1H16 7M16
Multiguna Ticket Size (million) Rp
13864
14408
14849
15152
1560915794
1592416117
1649916394
1H14 9M14 FY14 3M15 1H15 9M15 FY15 3M16 1H16 7M16
Multiguna Loan Balance
( Billion Rp )
Foreign Institution Investor
7260 from public shares
Foreign Institution Investor
6581 from public shares
Public shares 20
from paid capital Domestic Investor
3419 from public shares
Domestic Investor
2740 from public shares
37
No Country Share
1 INDONESIA 3419402 LUKSEMBURG 161267
3 AMERIKA 1341304 NORWEGIA 1111345 SIPRUS 838626 FINLANDIA 577797 VIRGIN ISLAND 41059
8 INGGRIS 223339 IRLANDIA 17073
10 AUSTRALIA 0964611 JEPANG 0839812 KANADA 05512
No Country Share
14 SWEDIA 0248915 SINGAPURA 0201816 CAYMAN ISLAND 0060317 GREENLAND 0033118 CINA 0019319 SWITSERLAND 0011320 KOREA SELATAN 0007421 FILIPINA 0002222 MALAYSIA 0001523 HONGKONG 0000824 JERMAN 00001
Total 100
STRENGTH OF INSTITUTIONS INVESTOR
38
Awards amp Achievements
The Most Trusted Banking in
Microfinance Services of The
Year 2015
Very Good Predicate for 2014
Financial Performance
Infobank Awards 2015
Bank Jatim Regional Banks with
excellent service of the year
2016
Excellence in Building and
Managing Corporate Image
Corporate Image Award 2015
The 1st Champion of Indonesia
Original Brand 2015
Top BPD HRampIT Management
2016
39
Investor Relations (IR)
Corporate Secretary
(031) 5310090 ext 469
Email irubankjatimcoid
Contact

8
InformationIn million Rp
7M15 7M16 YoY
Net Interest Income 1813868 1969020 855
Net Non Interest Operational Income
(Expense)(1119825) (1124772) 044
Net profit 512966 612315 1937
- ROA 274 296
- ROE 1599 1941
- NIM 655 665
Financial Performance
bull Dealer Treasury activityrsquos become thesignificant contributor for interest income the portion up to 20 from interest income
bull Operational profit increased due to higher interest income and lower impairment losses
9
Non Performing Loan
bull Bank Jatim still faces the non performing loan and yet to decrease the rising of the NPL last year was caused by
- Commercial credit npl standby loan and keppres
- Multipurpose npl from death and fired people decrease from insurance claim
- Financial Services Authority policy on lending quality of sharia rural bank based on capital adequate ratio level
bull Bank Jatimrsquos Credit Risk Division and Adhoc team keep attempting to reduce the NPL
bull The current NPL comes from the same debtors similar to last year and we still maintain the debtor to restructuring or rescheduling the credit based on their business Some of the standby loanrsquos debtors are waiting from the appeal completion in court
bull Managementrsquos efforts to reduce NPL are by conducting collection and auction the collateral
bull Strengthening capability assessment for credit officer improvement credit regulation and reconstruction of credit intern law
NPL 1H15 9M15 FY15 1M16 2M16 3M16 4M16 5M16 1H16 7M16
Consumer 075 086 074 077 081 082 085 089 085 091
SME 759 802 1111 1144 1165 1162 1154 1146 1136 1160
Commercial 978 1053 997 1159 1146 1142 1133 1181 1127 1190
NPL GROSS 382 422 429 451 457 459 465 479 458 483
Coverage Ratio 7582 8428 8102 8214 8217 8087 8194 8420 8337 8512
10
BUSINESS PLAN
11
Business Plan 2016
Description 2015 2016 E
Total Asset 1265 536
Loan 846 1207
Third Party Fund 1319 505
Financial Ratio
- CAR 2122 1899
- LDR 8292 8846
- NPL Gross 429 425
- NIM 641 744
- BOPO 7611 8454
- ROE 1611 1838
- ROA 267 321
LOAN STRATEGY
bull Credit for vehicle acquirement
bull Increasing MoU with government institutions for multipurpose also private corporates
bull Intensifying linkage program to rural bank members of Perbamida or Perbarindo
FUNDING STRATEGY
bull Cooperating with competent institutions to distribute school operational fund
bull Expanding funding networks
bull Intensifying new funding products implementation
bull Pricing Strategy for lower interest rate
NPL STRATEGY
bull Collection with credit restructuring
bull Special collection for rest of government payment project terms
bull Insurances claim accelerations and recoveries
bull Collateral auction
GENERAL STRATEGY
bull Revitalization into competence and professional human capital to shape competency based on resource management
bull Development and reorganization of head office and branches for customer centric
12
NETWORK
Network 2009 2010 2011 2012 2013 2014 2015 7M16NETWORK
2016
SHARIA
2016
Head Office 1 1 1 1 1 1 1 1 1
Branch Office 39 41 41 41 41 43 45 46 1 2
Sub Branch
Office26 44 67 81 107 153 165 166 5 10
Cash office 151 154 164 164 176 165 185 185 9 6
Sharia service
office37 37 47 47 47 97 97 97 94
Payment Point 78 88 115 138 155 167 171 173 8 7
Mobile cash 45 49 57 57 59 62 65 78 11 6
Mobile ATM - 4 4 6 6 6 6 6
CDM 1 1 1 1 1 2 2 2
ATM 87 142 262 368 479 595 688 692 13 15
Total network 465 561 759 904 1072 1291 1425 1446
13
APPENDIX
14
ECONOMIC OUTLOOK
550 525 525
575 575 600725 750 750 750 750 775 750
675 650 650
430
590 590
840 838732
670
453
836
335
445345 321
FY12 3M13 1H13 9M13 FY13 3M14 1H14 9M14 FY14 FY15 3M16 1H16 7M16
LOANbillion
FUNDbillion
JIBOR
INFLASI
BI RATE
LOANbillion
FUNDbillion
INFLASI
BI RATE
BI 7-Day Repo Rate
15Source Bank Indonesia
MACRO ECONOMY REVIEW
In billion Rp
3225198 3243136 3374272 3526188 3663968 3618064 3834503 3995803 4114420 4198577 4319749 4464083 4413056 4478409
2725674 2787372 2982436 3170805 3319842 3334011 3494968 3592087 3706501 3713544 3861172 3990464 4092104 4035929
FY12 3M13 1H13 9M13 FY13 3M14 1H14 9M14 FY14 3M15 1H15 9M15 FY15 4M16
NATIONALYoY
EAST JAVAYoY
16Source East Java Gov
East Java amp National BPS
Regional Economic Growth
640562 521 512 500 500 471 470 473 479 492
727
615 640 594 591 590518 525 544 544 534
FY12 FY13 3M14 1H14 9M14 FY14 3M15 1H15 9M15 FY15 3M16
17
FINANCIAL HIGHLIGHTS
18
Balance Sheet
InformationIn million Rp
7M15 7M16 YoY
Total Asset 49222516 50786968 318
Placement BI amp SBI 14108042 11775816 -1653
Loan 28654214 29290730 222
Allowance for Impairment Losses (937449) (1203961) 2843
Third Party Fund 41644181 42537452 215
- Current Account 17698264 17926232 129
- Saving Account 10629904 12087219 1371
- Time Deposit 13316012 12524002 -595
Equity 5922719 6266316 580
19
Profit amp Loss
InformationIn million Rp
7M15 7M16 YoY
Interest Income 2636359 2792540 592
Interest Expense (822491) (823520) 013
Nett Interest Income 1813868 1969020 855
Non Interest Operational Income 274986 257429 -638
Non Interest Operational Expense (1394811) (1058368) -2412
Provision for Impairment Losses (428576) (323833) -2444
Nett Non Interest Operational Income (Expense)
(1119825) (1124772) 044
Operational Profit 694043 844248 2164
Non Operational Profit 41924 4298 -8975
Pre Tax Profit 735967 848546 1530
Taxes (223001) (236231) 593
Net profit 512966 612315 1937
142 157 163 174200
249291
331
380
525 508
46 55 74
101
131
161 186
223
262
287 293
120 132 137 145162
201222
260
303
446425
04 0405 05
09 09
0708
094
118
06106
07 07 07 0708
0908
12
134
082
17 172 21
27 28 2933
41
46
279
TOTAL ASSET (Rp Tril)
INTEREST INCOME (Rp Tril) INTEREST EXPENSE (Rp Tril)
CAGR =
1261
CAGR =
1142
CAGR =
1256
NET PROFIT (Rp Tril)
THIRD PARTY FUND(Rp Tril)
CAGR =
1533
LOAN (Rp Tril)
CAGR =
2153
CAGR =
1524
20
Financial Performance
R
O
A
R
O
E
N
I
M
Financial Ratio
23
261
414 407
355394
375
558
497
334
382352
267
380
318296
2004 2005 2006 2007 2008 2009 2010 2011 2012 2013 2014 2015 3M16 1H16 7M16
3054
36903848
308531482859
4057
3365
1896190418981611
23492087
1941
2004 2005 2006 2007 2008 2009 2010 2011 2012 2013 2014 2015 3M16 1H16 7M16
910 939 934
728
835766
917
795
648714 690
641683 669 665
2004 2005 2006 2007 2008 2009 2010 2011 2012 2013 2014 2015 3M16 1H16 7M16
L
D
R
C
A
R
B
O
P
O
22
Financial Ratio
4545 4513
38754211
5404
6967
8070 80118355 8498 8654
8292
68117264
6886
2004 2005 2006 2007 2008 2009 2010 2011 2012 2013 2014 2015 3M16 1H16 7M16
15291817
3845
3339
2536
21321919
1653
26562372
2217 21221946 2065 2047
2004 2005 2006 2007 2008 2009 2010 2011 2012 2013 2014 2015 3M16 1H16 7M16
7467 73836943 6820 6742 6604
5958 6002
6869 7028 6963
7611
6532
70567232
2004 2005 2006 2007 2008 2009 2010 2011 2012 2013 2014 2015 3M16 1H16 7M16
23
OVERVIEW amp INVESTMENT HIGHLIGHTS
24
Current AccountYoY 129
Saving AccountYoY 1371
Time DepositYoY (595)
Third Party Fund
9662
12083
9969
16563
11649
18292
20116
17698
13494
21037
15345
17926
81747064
9970
8082
10991
9172 9128
10630
12753
1098712379 12087
4374
8269
6048
10834
7630
10509
13437 13316
8016
9482
12578 12524
FY12 1H13 FY13 1H14 FY14 3M15 1H15 7M15 FY15 3M16 1H16 7M16
Current Account
Saving Account
Time Deposit
In Billion Rp
In Billion Rp
Government Current
Acc
YoY (1752)
Private Current Acc
YoY 20528
YoY
SIMPEDA 1091
SIKLUS 4390
Hajj Saving 289
TabunganKu 2476
Barokah Saving 3115
Time Deposit
YoY (595)
25
Detailed Third Party Fund
13821 11959 7220 14710 15803 16204 17985
5718 16715
10411 13365
2742 3491 4429
3582 4313 1494 1596
7776
4322 4933
4561
1H14 9M14 FY14 3M15 1H15 7M15 9M15 FY15 3M16 1H16 7M16
Current Account
Government Private
241 290 657 418 535 560 581 861 674 752 806 179 194 208 218 199 204 215 224 230 208 210
6946 7682
9239 7705 7543
8977 8535
10561 9046
10330 9957
651 687
795
748 762
797 814
994
925
980 994
65 70
93
83 87
92 94
112
112
110 120
1H14 9M14 FY14 3M15 1H15 7M15 9M15 FY15 3M16 1H16 7M16
Saving Account
SIKLUS Hajj Saving SIMPEDA TabunganKu Barokah Saving
10834 11331 7630 10509 13437 13316 13934 8016 9482 12578 12524
1H14 9M14 FY14 3M15 1H15 7M15 9M15 FY15 3M16 1H16 7M16
Time Deposit
26
Third Party Fund Customer
In million Rp
FY12 3M13 1H13 9M13 FY13 3M14 1H14 9M14 FY14 3M15 1H15 9M15 FY15 1H16 7M16
44
13
7
43
63
4
44
25
4
45
33
4
46
85
3
47
01
4
48
35
8
49
41
1
50
13
4
50
92
7
53
65
8
54
36
9
51
36
1
53
33
7
53
49
3
20
45
785
21
00
510
21
44
912
25
11
507
41
26
826
41
61
277
41
99
590
42
55
204
43
33
820
44
03
899
44
62
107
45
43
12
9
46
26
910
48
21
838
48
39
565
23
61
6
24
42
5
24
53
8
25
27
4
26
17
6
25
27
7
27
20
9
28
17
3
29
19
4
30
72
8
30
78
8
32
69
2
34
16
7
35
87
2
36
77
2
Total Customer
Current Account Saving Account Time Deposit
21831
27733 27304 27883
21277 24866
34252 31270
23236
35918 37489 36015
26273 28769
33511
399 322 329 303 242 199 192 210 254 208 205 225 276 257 250
18521 27761
33698 33250
23107
32546
39819 40218
26134
34200
43644 42621
23462
35063 34059
FY12 3M13 1H13 9M13 FY13 3M14 1H14 9M14 FY14 3M15 1H15 9M15 FY15 1H16 7M16
Ticket Size
Current Account Saving Account Time Deposit
27
Competitive Product
CONSUMER
COMMERCIAL
SME
CONSUMER LOAN Julyrsquo15 Julyrsquo16
Multipurpose 5447 5597
Mortgage 481 514
Others 236 301
Total 6164 6411
COMMERCIAL LOAN Julyrsquo15 Julyrsquo16
Standby Loan 374 224
Keppres 370 354
Overdraft 963 986
Syndicate 458 452
Total 2165 2015
Small Medium Ent Julyrsquo15 Julyrsquo16
KUR 241 082
Pundi Kencana 392 428
Jatim Mikro 160 188
Others 879 877
Total 1671 1574
28
Loan Proportion
In Billion Rp
YoY
Consumer
632
Commercial
(489)
SME
(369)
29
Type Of Loan
15599 16224 16711 17064 17575 17663 17939 18186 18427 18875 18779
5019 5624 5180 5054
6024 6204 6586 5697 5334 5789 5901
4203 4239 4304 4450 4689 4787 4710 4528 4507 4612 4611
1H14 9M14 FY14 3M15 1H15 7M15 9M15 FY15 3M16 1H16 7M16
Consumer Commercial SME
In Billion Rp
YoY
Multi
purpose
503
Mortgage
919
Others
3012
30
Type Of Loan
13864 14408
14849 15152 15609 15608 15794 15924 16117
16499 16394
1177 1233 1299 1340 1369 1379 1399 1434 1465 1502 1505
559 583 563 572 597 677 746 827 845 875 880
1H14 9M14 FY14 3M15 1H15 7M15 9M15 FY15 3M16 1H16 7M16
CONSUMER LOAN
Multipurpose Mortgage Others
In Billion Rp
YoY
Standby
Loan
(3877)
Keppres
(235)
Overdraft
462
Syndicate
071
31
Type Of Loan1
0
75
12
86
10
13
81
2
10
23
10
71
12
44
84
7
59
4
65
6
65
6
82
4 11
57
68
7
44
9
97
8
10
60
13
37
74
8
55
9
96
4
10
35
22
17
22
59
23
08
25
75
27
41
27
59
26
92
27
66
28
22
28
67
28
87
90
3
92
2
11
71
12
18
12
81
13
14
13
14
13
36
13
60
13
01
13
23
1H14 9M14 FY14 3M15 1H15 7M15 9M15 FY15 3M16 1H16 7M16
Commercial Loan
Standby Loan Keppres Overdraft Syndicate
In Billion Rp
YoY
KUR
(6532)
Pundi
Kencana
1163
Mikro
2031
Others
200
32
Type Of Loan1218
1128
1058
893
735
689
601
451
347
258
239
693
747
796
950
1108
1123
1157
1178
1223
1273
1254
78
165
264
345
452
457
491
520
530
557
550
2214
2199
2186
2262
2395
2517
2461
2380
2407
2523
2568
1H14 9M14 FY14 3M15 1H15 7M15 9M15 FY15 3M16 1H16 7M16
SME Loan
KUR Pundi Kencana Mikro Others
33
Type Of Loan
26
22
93
26
06
47
25
96
58
26
17
30
26
36
14
26
39
07
25
45
01
25
34
43
25
37
33
25
35
85
85
98
96
44
87
30
71
94
96
70
11
5
82
83
64
64
02
91
60
94
88
45
9
51
43
9
86
42
7
49
43
2
81
45
2
44
44
1
49
41
6
35
41
8
61
42
3
00
42
2
37
1H14 9M14 FY14 3M15 1H15 9M15 FY15 3M16 1H16 7M16
Total Customer
Consumer Commercial SME
5947 6225 6436 652 6667 6797 7146 7271 7439 7406
58231 58311 5933
702662292
56868
68119
83319
63196 62194
9147 9637 10069 1028 10366 10669 10877 10767 10903 10916
1H14 9M14 FY14 3M15 1H15 9M15 FY15 3M16 1H16 7M16
Ticket Size
Consumer Commercial SME
34
STRENGTH
35
Strength Of Funding
517
460 477426
403435
463 480431 407 435
384 385 394 421
246
254 288
362358
241
250284 359
354368
384 363 372284
237 285 235212
239 237287
237 210 239197
232 252 234294
2002 2003 2004 2005 2006 2007 2008 2009 2010 2011 2012 2013 2014 2015 7M16
Time deposit Saving deposit Current account
448 453
300 253 302 318 321261
316 354 348268 301
368256 301 284 283
492 500
275239
310 328 331
258326
381 371
267345
395
250277 297 296
3M12 1H12 9M12 FY12 3M13 1H13 9M13 FY13 3M14 1H14 9M14 FY14 3M15 1H15 FY15 3M16 1H16 7M16
Cost of Fund(+) Local Government (-) Local Government
Description Details
Civil Servants (per December 2014) 426545
Multipurpose Customer (Civil Servants) 238965
5602
NPL 039 as of Julyrsquo 2016
36
Strength of Loan (Multipurpose Loan)
567 593 612 619 631 640
666 675 690 686
1H14 9M14 FY14 3M15 1H15 9M15 FY15 3M16 1H16 7M16
Multiguna Ticket Size (million) Rp
13864
14408
14849
15152
1560915794
1592416117
1649916394
1H14 9M14 FY14 3M15 1H15 9M15 FY15 3M16 1H16 7M16
Multiguna Loan Balance
( Billion Rp )
Foreign Institution Investor
7260 from public shares
Foreign Institution Investor
6581 from public shares
Public shares 20
from paid capital Domestic Investor
3419 from public shares
Domestic Investor
2740 from public shares
37
No Country Share
1 INDONESIA 3419402 LUKSEMBURG 161267
3 AMERIKA 1341304 NORWEGIA 1111345 SIPRUS 838626 FINLANDIA 577797 VIRGIN ISLAND 41059
8 INGGRIS 223339 IRLANDIA 17073
10 AUSTRALIA 0964611 JEPANG 0839812 KANADA 05512
No Country Share
14 SWEDIA 0248915 SINGAPURA 0201816 CAYMAN ISLAND 0060317 GREENLAND 0033118 CINA 0019319 SWITSERLAND 0011320 KOREA SELATAN 0007421 FILIPINA 0002222 MALAYSIA 0001523 HONGKONG 0000824 JERMAN 00001
Total 100
STRENGTH OF INSTITUTIONS INVESTOR
38
Awards amp Achievements
The Most Trusted Banking in
Microfinance Services of The
Year 2015
Very Good Predicate for 2014
Financial Performance
Infobank Awards 2015
Bank Jatim Regional Banks with
excellent service of the year
2016
Excellence in Building and
Managing Corporate Image
Corporate Image Award 2015
The 1st Champion of Indonesia
Original Brand 2015
Top BPD HRampIT Management
2016
39
Investor Relations (IR)
Corporate Secretary
(031) 5310090 ext 469
Email irubankjatimcoid
Contact

9
Non Performing Loan
bull Bank Jatim still faces the non performing loan and yet to decrease the rising of the NPL last year was caused by
- Commercial credit npl standby loan and keppres
- Multipurpose npl from death and fired people decrease from insurance claim
- Financial Services Authority policy on lending quality of sharia rural bank based on capital adequate ratio level
bull Bank Jatimrsquos Credit Risk Division and Adhoc team keep attempting to reduce the NPL
bull The current NPL comes from the same debtors similar to last year and we still maintain the debtor to restructuring or rescheduling the credit based on their business Some of the standby loanrsquos debtors are waiting from the appeal completion in court
bull Managementrsquos efforts to reduce NPL are by conducting collection and auction the collateral
bull Strengthening capability assessment for credit officer improvement credit regulation and reconstruction of credit intern law
NPL 1H15 9M15 FY15 1M16 2M16 3M16 4M16 5M16 1H16 7M16
Consumer 075 086 074 077 081 082 085 089 085 091
SME 759 802 1111 1144 1165 1162 1154 1146 1136 1160
Commercial 978 1053 997 1159 1146 1142 1133 1181 1127 1190
NPL GROSS 382 422 429 451 457 459 465 479 458 483
Coverage Ratio 7582 8428 8102 8214 8217 8087 8194 8420 8337 8512
10
BUSINESS PLAN
11
Business Plan 2016
Description 2015 2016 E
Total Asset 1265 536
Loan 846 1207
Third Party Fund 1319 505
Financial Ratio
- CAR 2122 1899
- LDR 8292 8846
- NPL Gross 429 425
- NIM 641 744
- BOPO 7611 8454
- ROE 1611 1838
- ROA 267 321
LOAN STRATEGY
bull Credit for vehicle acquirement
bull Increasing MoU with government institutions for multipurpose also private corporates
bull Intensifying linkage program to rural bank members of Perbamida or Perbarindo
FUNDING STRATEGY
bull Cooperating with competent institutions to distribute school operational fund
bull Expanding funding networks
bull Intensifying new funding products implementation
bull Pricing Strategy for lower interest rate
NPL STRATEGY
bull Collection with credit restructuring
bull Special collection for rest of government payment project terms
bull Insurances claim accelerations and recoveries
bull Collateral auction
GENERAL STRATEGY
bull Revitalization into competence and professional human capital to shape competency based on resource management
bull Development and reorganization of head office and branches for customer centric
12
NETWORK
Network 2009 2010 2011 2012 2013 2014 2015 7M16NETWORK
2016
SHARIA
2016
Head Office 1 1 1 1 1 1 1 1 1
Branch Office 39 41 41 41 41 43 45 46 1 2
Sub Branch
Office26 44 67 81 107 153 165 166 5 10
Cash office 151 154 164 164 176 165 185 185 9 6
Sharia service
office37 37 47 47 47 97 97 97 94
Payment Point 78 88 115 138 155 167 171 173 8 7
Mobile cash 45 49 57 57 59 62 65 78 11 6
Mobile ATM - 4 4 6 6 6 6 6
CDM 1 1 1 1 1 2 2 2
ATM 87 142 262 368 479 595 688 692 13 15
Total network 465 561 759 904 1072 1291 1425 1446
13
APPENDIX
14
ECONOMIC OUTLOOK
550 525 525
575 575 600725 750 750 750 750 775 750
675 650 650
430
590 590
840 838732
670
453
836
335
445345 321
FY12 3M13 1H13 9M13 FY13 3M14 1H14 9M14 FY14 FY15 3M16 1H16 7M16
LOANbillion
FUNDbillion
JIBOR
INFLASI
BI RATE
LOANbillion
FUNDbillion
INFLASI
BI RATE
BI 7-Day Repo Rate
15Source Bank Indonesia
MACRO ECONOMY REVIEW
In billion Rp
3225198 3243136 3374272 3526188 3663968 3618064 3834503 3995803 4114420 4198577 4319749 4464083 4413056 4478409
2725674 2787372 2982436 3170805 3319842 3334011 3494968 3592087 3706501 3713544 3861172 3990464 4092104 4035929
FY12 3M13 1H13 9M13 FY13 3M14 1H14 9M14 FY14 3M15 1H15 9M15 FY15 4M16
NATIONALYoY
EAST JAVAYoY
16Source East Java Gov
East Java amp National BPS
Regional Economic Growth
640562 521 512 500 500 471 470 473 479 492
727
615 640 594 591 590518 525 544 544 534
FY12 FY13 3M14 1H14 9M14 FY14 3M15 1H15 9M15 FY15 3M16
17
FINANCIAL HIGHLIGHTS
18
Balance Sheet
InformationIn million Rp
7M15 7M16 YoY
Total Asset 49222516 50786968 318
Placement BI amp SBI 14108042 11775816 -1653
Loan 28654214 29290730 222
Allowance for Impairment Losses (937449) (1203961) 2843
Third Party Fund 41644181 42537452 215
- Current Account 17698264 17926232 129
- Saving Account 10629904 12087219 1371
- Time Deposit 13316012 12524002 -595
Equity 5922719 6266316 580
19
Profit amp Loss
InformationIn million Rp
7M15 7M16 YoY
Interest Income 2636359 2792540 592
Interest Expense (822491) (823520) 013
Nett Interest Income 1813868 1969020 855
Non Interest Operational Income 274986 257429 -638
Non Interest Operational Expense (1394811) (1058368) -2412
Provision for Impairment Losses (428576) (323833) -2444
Nett Non Interest Operational Income (Expense)
(1119825) (1124772) 044
Operational Profit 694043 844248 2164
Non Operational Profit 41924 4298 -8975
Pre Tax Profit 735967 848546 1530
Taxes (223001) (236231) 593
Net profit 512966 612315 1937
142 157 163 174200
249291
331
380
525 508
46 55 74
101
131
161 186
223
262
287 293
120 132 137 145162
201222
260
303
446425
04 0405 05
09 09
0708
094
118
06106
07 07 07 0708
0908
12
134
082
17 172 21
27 28 2933
41
46
279
TOTAL ASSET (Rp Tril)
INTEREST INCOME (Rp Tril) INTEREST EXPENSE (Rp Tril)
CAGR =
1261
CAGR =
1142
CAGR =
1256
NET PROFIT (Rp Tril)
THIRD PARTY FUND(Rp Tril)
CAGR =
1533
LOAN (Rp Tril)
CAGR =
2153
CAGR =
1524
20
Financial Performance
R
O
A
R
O
E
N
I
M
Financial Ratio
23
261
414 407
355394
375
558
497
334
382352
267
380
318296
2004 2005 2006 2007 2008 2009 2010 2011 2012 2013 2014 2015 3M16 1H16 7M16
3054
36903848
308531482859
4057
3365
1896190418981611
23492087
1941
2004 2005 2006 2007 2008 2009 2010 2011 2012 2013 2014 2015 3M16 1H16 7M16
910 939 934
728
835766
917
795
648714 690
641683 669 665
2004 2005 2006 2007 2008 2009 2010 2011 2012 2013 2014 2015 3M16 1H16 7M16
L
D
R
C
A
R
B
O
P
O
22
Financial Ratio
4545 4513
38754211
5404
6967
8070 80118355 8498 8654
8292
68117264
6886
2004 2005 2006 2007 2008 2009 2010 2011 2012 2013 2014 2015 3M16 1H16 7M16
15291817
3845
3339
2536
21321919
1653
26562372
2217 21221946 2065 2047
2004 2005 2006 2007 2008 2009 2010 2011 2012 2013 2014 2015 3M16 1H16 7M16
7467 73836943 6820 6742 6604
5958 6002
6869 7028 6963
7611
6532
70567232
2004 2005 2006 2007 2008 2009 2010 2011 2012 2013 2014 2015 3M16 1H16 7M16
23
OVERVIEW amp INVESTMENT HIGHLIGHTS
24
Current AccountYoY 129
Saving AccountYoY 1371
Time DepositYoY (595)
Third Party Fund
9662
12083
9969
16563
11649
18292
20116
17698
13494
21037
15345
17926
81747064
9970
8082
10991
9172 9128
10630
12753
1098712379 12087
4374
8269
6048
10834
7630
10509
13437 13316
8016
9482
12578 12524
FY12 1H13 FY13 1H14 FY14 3M15 1H15 7M15 FY15 3M16 1H16 7M16
Current Account
Saving Account
Time Deposit
In Billion Rp
In Billion Rp
Government Current
Acc
YoY (1752)
Private Current Acc
YoY 20528
YoY
SIMPEDA 1091
SIKLUS 4390
Hajj Saving 289
TabunganKu 2476
Barokah Saving 3115
Time Deposit
YoY (595)
25
Detailed Third Party Fund
13821 11959 7220 14710 15803 16204 17985
5718 16715
10411 13365
2742 3491 4429
3582 4313 1494 1596
7776
4322 4933
4561
1H14 9M14 FY14 3M15 1H15 7M15 9M15 FY15 3M16 1H16 7M16
Current Account
Government Private
241 290 657 418 535 560 581 861 674 752 806 179 194 208 218 199 204 215 224 230 208 210
6946 7682
9239 7705 7543
8977 8535
10561 9046
10330 9957
651 687
795
748 762
797 814
994
925
980 994
65 70
93
83 87
92 94
112
112
110 120
1H14 9M14 FY14 3M15 1H15 7M15 9M15 FY15 3M16 1H16 7M16
Saving Account
SIKLUS Hajj Saving SIMPEDA TabunganKu Barokah Saving
10834 11331 7630 10509 13437 13316 13934 8016 9482 12578 12524
1H14 9M14 FY14 3M15 1H15 7M15 9M15 FY15 3M16 1H16 7M16
Time Deposit
26
Third Party Fund Customer
In million Rp
FY12 3M13 1H13 9M13 FY13 3M14 1H14 9M14 FY14 3M15 1H15 9M15 FY15 1H16 7M16
44
13
7
43
63
4
44
25
4
45
33
4
46
85
3
47
01
4
48
35
8
49
41
1
50
13
4
50
92
7
53
65
8
54
36
9
51
36
1
53
33
7
53
49
3
20
45
785
21
00
510
21
44
912
25
11
507
41
26
826
41
61
277
41
99
590
42
55
204
43
33
820
44
03
899
44
62
107
45
43
12
9
46
26
910
48
21
838
48
39
565
23
61
6
24
42
5
24
53
8
25
27
4
26
17
6
25
27
7
27
20
9
28
17
3
29
19
4
30
72
8
30
78
8
32
69
2
34
16
7
35
87
2
36
77
2
Total Customer
Current Account Saving Account Time Deposit
21831
27733 27304 27883
21277 24866
34252 31270
23236
35918 37489 36015
26273 28769
33511
399 322 329 303 242 199 192 210 254 208 205 225 276 257 250
18521 27761
33698 33250
23107
32546
39819 40218
26134
34200
43644 42621
23462
35063 34059
FY12 3M13 1H13 9M13 FY13 3M14 1H14 9M14 FY14 3M15 1H15 9M15 FY15 1H16 7M16
Ticket Size
Current Account Saving Account Time Deposit
27
Competitive Product
CONSUMER
COMMERCIAL
SME
CONSUMER LOAN Julyrsquo15 Julyrsquo16
Multipurpose 5447 5597
Mortgage 481 514
Others 236 301
Total 6164 6411
COMMERCIAL LOAN Julyrsquo15 Julyrsquo16
Standby Loan 374 224
Keppres 370 354
Overdraft 963 986
Syndicate 458 452
Total 2165 2015
Small Medium Ent Julyrsquo15 Julyrsquo16
KUR 241 082
Pundi Kencana 392 428
Jatim Mikro 160 188
Others 879 877
Total 1671 1574
28
Loan Proportion
In Billion Rp
YoY
Consumer
632
Commercial
(489)
SME
(369)
29
Type Of Loan
15599 16224 16711 17064 17575 17663 17939 18186 18427 18875 18779
5019 5624 5180 5054
6024 6204 6586 5697 5334 5789 5901
4203 4239 4304 4450 4689 4787 4710 4528 4507 4612 4611
1H14 9M14 FY14 3M15 1H15 7M15 9M15 FY15 3M16 1H16 7M16
Consumer Commercial SME
In Billion Rp
YoY
Multi
purpose
503
Mortgage
919
Others
3012
30
Type Of Loan
13864 14408
14849 15152 15609 15608 15794 15924 16117
16499 16394
1177 1233 1299 1340 1369 1379 1399 1434 1465 1502 1505
559 583 563 572 597 677 746 827 845 875 880
1H14 9M14 FY14 3M15 1H15 7M15 9M15 FY15 3M16 1H16 7M16
CONSUMER LOAN
Multipurpose Mortgage Others
In Billion Rp
YoY
Standby
Loan
(3877)
Keppres
(235)
Overdraft
462
Syndicate
071
31
Type Of Loan1
0
75
12
86
10
13
81
2
10
23
10
71
12
44
84
7
59
4
65
6
65
6
82
4 11
57
68
7
44
9
97
8
10
60
13
37
74
8
55
9
96
4
10
35
22
17
22
59
23
08
25
75
27
41
27
59
26
92
27
66
28
22
28
67
28
87
90
3
92
2
11
71
12
18
12
81
13
14
13
14
13
36
13
60
13
01
13
23
1H14 9M14 FY14 3M15 1H15 7M15 9M15 FY15 3M16 1H16 7M16
Commercial Loan
Standby Loan Keppres Overdraft Syndicate
In Billion Rp
YoY
KUR
(6532)
Pundi
Kencana
1163
Mikro
2031
Others
200
32
Type Of Loan1218
1128
1058
893
735
689
601
451
347
258
239
693
747
796
950
1108
1123
1157
1178
1223
1273
1254
78
165
264
345
452
457
491
520
530
557
550
2214
2199
2186
2262
2395
2517
2461
2380
2407
2523
2568
1H14 9M14 FY14 3M15 1H15 7M15 9M15 FY15 3M16 1H16 7M16
SME Loan
KUR Pundi Kencana Mikro Others
33
Type Of Loan
26
22
93
26
06
47
25
96
58
26
17
30
26
36
14
26
39
07
25
45
01
25
34
43
25
37
33
25
35
85
85
98
96
44
87
30
71
94
96
70
11
5
82
83
64
64
02
91
60
94
88
45
9
51
43
9
86
42
7
49
43
2
81
45
2
44
44
1
49
41
6
35
41
8
61
42
3
00
42
2
37
1H14 9M14 FY14 3M15 1H15 9M15 FY15 3M16 1H16 7M16
Total Customer
Consumer Commercial SME
5947 6225 6436 652 6667 6797 7146 7271 7439 7406
58231 58311 5933
702662292
56868
68119
83319
63196 62194
9147 9637 10069 1028 10366 10669 10877 10767 10903 10916
1H14 9M14 FY14 3M15 1H15 9M15 FY15 3M16 1H16 7M16
Ticket Size
Consumer Commercial SME
34
STRENGTH
35
Strength Of Funding
517
460 477426
403435
463 480431 407 435
384 385 394 421
246
254 288
362358
241
250284 359
354368
384 363 372284
237 285 235212
239 237287
237 210 239197
232 252 234294
2002 2003 2004 2005 2006 2007 2008 2009 2010 2011 2012 2013 2014 2015 7M16
Time deposit Saving deposit Current account
448 453
300 253 302 318 321261
316 354 348268 301
368256 301 284 283
492 500
275239
310 328 331
258326
381 371
267345
395
250277 297 296
3M12 1H12 9M12 FY12 3M13 1H13 9M13 FY13 3M14 1H14 9M14 FY14 3M15 1H15 FY15 3M16 1H16 7M16
Cost of Fund(+) Local Government (-) Local Government
Description Details
Civil Servants (per December 2014) 426545
Multipurpose Customer (Civil Servants) 238965
5602
NPL 039 as of Julyrsquo 2016
36
Strength of Loan (Multipurpose Loan)
567 593 612 619 631 640
666 675 690 686
1H14 9M14 FY14 3M15 1H15 9M15 FY15 3M16 1H16 7M16
Multiguna Ticket Size (million) Rp
13864
14408
14849
15152
1560915794
1592416117
1649916394
1H14 9M14 FY14 3M15 1H15 9M15 FY15 3M16 1H16 7M16
Multiguna Loan Balance
( Billion Rp )
Foreign Institution Investor
7260 from public shares
Foreign Institution Investor
6581 from public shares
Public shares 20
from paid capital Domestic Investor
3419 from public shares
Domestic Investor
2740 from public shares
37
No Country Share
1 INDONESIA 3419402 LUKSEMBURG 161267
3 AMERIKA 1341304 NORWEGIA 1111345 SIPRUS 838626 FINLANDIA 577797 VIRGIN ISLAND 41059
8 INGGRIS 223339 IRLANDIA 17073
10 AUSTRALIA 0964611 JEPANG 0839812 KANADA 05512
No Country Share
14 SWEDIA 0248915 SINGAPURA 0201816 CAYMAN ISLAND 0060317 GREENLAND 0033118 CINA 0019319 SWITSERLAND 0011320 KOREA SELATAN 0007421 FILIPINA 0002222 MALAYSIA 0001523 HONGKONG 0000824 JERMAN 00001
Total 100
STRENGTH OF INSTITUTIONS INVESTOR
38
Awards amp Achievements
The Most Trusted Banking in
Microfinance Services of The
Year 2015
Very Good Predicate for 2014
Financial Performance
Infobank Awards 2015
Bank Jatim Regional Banks with
excellent service of the year
2016
Excellence in Building and
Managing Corporate Image
Corporate Image Award 2015
The 1st Champion of Indonesia
Original Brand 2015
Top BPD HRampIT Management
2016
39
Investor Relations (IR)
Corporate Secretary
(031) 5310090 ext 469
Email irubankjatimcoid
Contact

10
BUSINESS PLAN
11
Business Plan 2016
Description 2015 2016 E
Total Asset 1265 536
Loan 846 1207
Third Party Fund 1319 505
Financial Ratio
- CAR 2122 1899
- LDR 8292 8846
- NPL Gross 429 425
- NIM 641 744
- BOPO 7611 8454
- ROE 1611 1838
- ROA 267 321
LOAN STRATEGY
bull Credit for vehicle acquirement
bull Increasing MoU with government institutions for multipurpose also private corporates
bull Intensifying linkage program to rural bank members of Perbamida or Perbarindo
FUNDING STRATEGY
bull Cooperating with competent institutions to distribute school operational fund
bull Expanding funding networks
bull Intensifying new funding products implementation
bull Pricing Strategy for lower interest rate
NPL STRATEGY
bull Collection with credit restructuring
bull Special collection for rest of government payment project terms
bull Insurances claim accelerations and recoveries
bull Collateral auction
GENERAL STRATEGY
bull Revitalization into competence and professional human capital to shape competency based on resource management
bull Development and reorganization of head office and branches for customer centric
12
NETWORK
Network 2009 2010 2011 2012 2013 2014 2015 7M16NETWORK
2016
SHARIA
2016
Head Office 1 1 1 1 1 1 1 1 1
Branch Office 39 41 41 41 41 43 45 46 1 2
Sub Branch
Office26 44 67 81 107 153 165 166 5 10
Cash office 151 154 164 164 176 165 185 185 9 6
Sharia service
office37 37 47 47 47 97 97 97 94
Payment Point 78 88 115 138 155 167 171 173 8 7
Mobile cash 45 49 57 57 59 62 65 78 11 6
Mobile ATM - 4 4 6 6 6 6 6
CDM 1 1 1 1 1 2 2 2
ATM 87 142 262 368 479 595 688 692 13 15
Total network 465 561 759 904 1072 1291 1425 1446
13
APPENDIX
14
ECONOMIC OUTLOOK
550 525 525
575 575 600725 750 750 750 750 775 750
675 650 650
430
590 590
840 838732
670
453
836
335
445345 321
FY12 3M13 1H13 9M13 FY13 3M14 1H14 9M14 FY14 FY15 3M16 1H16 7M16
LOANbillion
FUNDbillion
JIBOR
INFLASI
BI RATE
LOANbillion
FUNDbillion
INFLASI
BI RATE
BI 7-Day Repo Rate
15Source Bank Indonesia
MACRO ECONOMY REVIEW
In billion Rp
3225198 3243136 3374272 3526188 3663968 3618064 3834503 3995803 4114420 4198577 4319749 4464083 4413056 4478409
2725674 2787372 2982436 3170805 3319842 3334011 3494968 3592087 3706501 3713544 3861172 3990464 4092104 4035929
FY12 3M13 1H13 9M13 FY13 3M14 1H14 9M14 FY14 3M15 1H15 9M15 FY15 4M16
NATIONALYoY
EAST JAVAYoY
16Source East Java Gov
East Java amp National BPS
Regional Economic Growth
640562 521 512 500 500 471 470 473 479 492
727
615 640 594 591 590518 525 544 544 534
FY12 FY13 3M14 1H14 9M14 FY14 3M15 1H15 9M15 FY15 3M16
17
FINANCIAL HIGHLIGHTS
18
Balance Sheet
InformationIn million Rp
7M15 7M16 YoY
Total Asset 49222516 50786968 318
Placement BI amp SBI 14108042 11775816 -1653
Loan 28654214 29290730 222
Allowance for Impairment Losses (937449) (1203961) 2843
Third Party Fund 41644181 42537452 215
- Current Account 17698264 17926232 129
- Saving Account 10629904 12087219 1371
- Time Deposit 13316012 12524002 -595
Equity 5922719 6266316 580
19
Profit amp Loss
InformationIn million Rp
7M15 7M16 YoY
Interest Income 2636359 2792540 592
Interest Expense (822491) (823520) 013
Nett Interest Income 1813868 1969020 855
Non Interest Operational Income 274986 257429 -638
Non Interest Operational Expense (1394811) (1058368) -2412
Provision for Impairment Losses (428576) (323833) -2444
Nett Non Interest Operational Income (Expense)
(1119825) (1124772) 044
Operational Profit 694043 844248 2164
Non Operational Profit 41924 4298 -8975
Pre Tax Profit 735967 848546 1530
Taxes (223001) (236231) 593
Net profit 512966 612315 1937
142 157 163 174200
249291
331
380
525 508
46 55 74
101
131
161 186
223
262
287 293
120 132 137 145162
201222
260
303
446425
04 0405 05
09 09
0708
094
118
06106
07 07 07 0708
0908
12
134
082
17 172 21
27 28 2933
41
46
279
TOTAL ASSET (Rp Tril)
INTEREST INCOME (Rp Tril) INTEREST EXPENSE (Rp Tril)
CAGR =
1261
CAGR =
1142
CAGR =
1256
NET PROFIT (Rp Tril)
THIRD PARTY FUND(Rp Tril)
CAGR =
1533
LOAN (Rp Tril)
CAGR =
2153
CAGR =
1524
20
Financial Performance
R
O
A
R
O
E
N
I
M
Financial Ratio
23
261
414 407
355394
375
558
497
334
382352
267
380
318296
2004 2005 2006 2007 2008 2009 2010 2011 2012 2013 2014 2015 3M16 1H16 7M16
3054
36903848
308531482859
4057
3365
1896190418981611
23492087
1941
2004 2005 2006 2007 2008 2009 2010 2011 2012 2013 2014 2015 3M16 1H16 7M16
910 939 934
728
835766
917
795
648714 690
641683 669 665
2004 2005 2006 2007 2008 2009 2010 2011 2012 2013 2014 2015 3M16 1H16 7M16
L
D
R
C
A
R
B
O
P
O
22
Financial Ratio
4545 4513
38754211
5404
6967
8070 80118355 8498 8654
8292
68117264
6886
2004 2005 2006 2007 2008 2009 2010 2011 2012 2013 2014 2015 3M16 1H16 7M16
15291817
3845
3339
2536
21321919
1653
26562372
2217 21221946 2065 2047
2004 2005 2006 2007 2008 2009 2010 2011 2012 2013 2014 2015 3M16 1H16 7M16
7467 73836943 6820 6742 6604
5958 6002
6869 7028 6963
7611
6532
70567232
2004 2005 2006 2007 2008 2009 2010 2011 2012 2013 2014 2015 3M16 1H16 7M16
23
OVERVIEW amp INVESTMENT HIGHLIGHTS
24
Current AccountYoY 129
Saving AccountYoY 1371
Time DepositYoY (595)
Third Party Fund
9662
12083
9969
16563
11649
18292
20116
17698
13494
21037
15345
17926
81747064
9970
8082
10991
9172 9128
10630
12753
1098712379 12087
4374
8269
6048
10834
7630
10509
13437 13316
8016
9482
12578 12524
FY12 1H13 FY13 1H14 FY14 3M15 1H15 7M15 FY15 3M16 1H16 7M16
Current Account
Saving Account
Time Deposit
In Billion Rp
In Billion Rp
Government Current
Acc
YoY (1752)
Private Current Acc
YoY 20528
YoY
SIMPEDA 1091
SIKLUS 4390
Hajj Saving 289
TabunganKu 2476
Barokah Saving 3115
Time Deposit
YoY (595)
25
Detailed Third Party Fund
13821 11959 7220 14710 15803 16204 17985
5718 16715
10411 13365
2742 3491 4429
3582 4313 1494 1596
7776
4322 4933
4561
1H14 9M14 FY14 3M15 1H15 7M15 9M15 FY15 3M16 1H16 7M16
Current Account
Government Private
241 290 657 418 535 560 581 861 674 752 806 179 194 208 218 199 204 215 224 230 208 210
6946 7682
9239 7705 7543
8977 8535
10561 9046
10330 9957
651 687
795
748 762
797 814
994
925
980 994
65 70
93
83 87
92 94
112
112
110 120
1H14 9M14 FY14 3M15 1H15 7M15 9M15 FY15 3M16 1H16 7M16
Saving Account
SIKLUS Hajj Saving SIMPEDA TabunganKu Barokah Saving
10834 11331 7630 10509 13437 13316 13934 8016 9482 12578 12524
1H14 9M14 FY14 3M15 1H15 7M15 9M15 FY15 3M16 1H16 7M16
Time Deposit
26
Third Party Fund Customer
In million Rp
FY12 3M13 1H13 9M13 FY13 3M14 1H14 9M14 FY14 3M15 1H15 9M15 FY15 1H16 7M16
44
13
7
43
63
4
44
25
4
45
33
4
46
85
3
47
01
4
48
35
8
49
41
1
50
13
4
50
92
7
53
65
8
54
36
9
51
36
1
53
33
7
53
49
3
20
45
785
21
00
510
21
44
912
25
11
507
41
26
826
41
61
277
41
99
590
42
55
204
43
33
820
44
03
899
44
62
107
45
43
12
9
46
26
910
48
21
838
48
39
565
23
61
6
24
42
5
24
53
8
25
27
4
26
17
6
25
27
7
27
20
9
28
17
3
29
19
4
30
72
8
30
78
8
32
69
2
34
16
7
35
87
2
36
77
2
Total Customer
Current Account Saving Account Time Deposit
21831
27733 27304 27883
21277 24866
34252 31270
23236
35918 37489 36015
26273 28769
33511
399 322 329 303 242 199 192 210 254 208 205 225 276 257 250
18521 27761
33698 33250
23107
32546
39819 40218
26134
34200
43644 42621
23462
35063 34059
FY12 3M13 1H13 9M13 FY13 3M14 1H14 9M14 FY14 3M15 1H15 9M15 FY15 1H16 7M16
Ticket Size
Current Account Saving Account Time Deposit
27
Competitive Product
CONSUMER
COMMERCIAL
SME
CONSUMER LOAN Julyrsquo15 Julyrsquo16
Multipurpose 5447 5597
Mortgage 481 514
Others 236 301
Total 6164 6411
COMMERCIAL LOAN Julyrsquo15 Julyrsquo16
Standby Loan 374 224
Keppres 370 354
Overdraft 963 986
Syndicate 458 452
Total 2165 2015
Small Medium Ent Julyrsquo15 Julyrsquo16
KUR 241 082
Pundi Kencana 392 428
Jatim Mikro 160 188
Others 879 877
Total 1671 1574
28
Loan Proportion
In Billion Rp
YoY
Consumer
632
Commercial
(489)
SME
(369)
29
Type Of Loan
15599 16224 16711 17064 17575 17663 17939 18186 18427 18875 18779
5019 5624 5180 5054
6024 6204 6586 5697 5334 5789 5901
4203 4239 4304 4450 4689 4787 4710 4528 4507 4612 4611
1H14 9M14 FY14 3M15 1H15 7M15 9M15 FY15 3M16 1H16 7M16
Consumer Commercial SME
In Billion Rp
YoY
Multi
purpose
503
Mortgage
919
Others
3012
30
Type Of Loan
13864 14408
14849 15152 15609 15608 15794 15924 16117
16499 16394
1177 1233 1299 1340 1369 1379 1399 1434 1465 1502 1505
559 583 563 572 597 677 746 827 845 875 880
1H14 9M14 FY14 3M15 1H15 7M15 9M15 FY15 3M16 1H16 7M16
CONSUMER LOAN
Multipurpose Mortgage Others
In Billion Rp
YoY
Standby
Loan
(3877)
Keppres
(235)
Overdraft
462
Syndicate
071
31
Type Of Loan1
0
75
12
86
10
13
81
2
10
23
10
71
12
44
84
7
59
4
65
6
65
6
82
4 11
57
68
7
44
9
97
8
10
60
13
37
74
8
55
9
96
4
10
35
22
17
22
59
23
08
25
75
27
41
27
59
26
92
27
66
28
22
28
67
28
87
90
3
92
2
11
71
12
18
12
81
13
14
13
14
13
36
13
60
13
01
13
23
1H14 9M14 FY14 3M15 1H15 7M15 9M15 FY15 3M16 1H16 7M16
Commercial Loan
Standby Loan Keppres Overdraft Syndicate
In Billion Rp
YoY
KUR
(6532)
Pundi
Kencana
1163
Mikro
2031
Others
200
32
Type Of Loan1218
1128
1058
893
735
689
601
451
347
258
239
693
747
796
950
1108
1123
1157
1178
1223
1273
1254
78
165
264
345
452
457
491
520
530
557
550
2214
2199
2186
2262
2395
2517
2461
2380
2407
2523
2568
1H14 9M14 FY14 3M15 1H15 7M15 9M15 FY15 3M16 1H16 7M16
SME Loan
KUR Pundi Kencana Mikro Others
33
Type Of Loan
26
22
93
26
06
47
25
96
58
26
17
30
26
36
14
26
39
07
25
45
01
25
34
43
25
37
33
25
35
85
85
98
96
44
87
30
71
94
96
70
11
5
82
83
64
64
02
91
60
94
88
45
9
51
43
9
86
42
7
49
43
2
81
45
2
44
44
1
49
41
6
35
41
8
61
42
3
00
42
2
37
1H14 9M14 FY14 3M15 1H15 9M15 FY15 3M16 1H16 7M16
Total Customer
Consumer Commercial SME
5947 6225 6436 652 6667 6797 7146 7271 7439 7406
58231 58311 5933
702662292
56868
68119
83319
63196 62194
9147 9637 10069 1028 10366 10669 10877 10767 10903 10916
1H14 9M14 FY14 3M15 1H15 9M15 FY15 3M16 1H16 7M16
Ticket Size
Consumer Commercial SME
34
STRENGTH
35
Strength Of Funding
517
460 477426
403435
463 480431 407 435
384 385 394 421
246
254 288
362358
241
250284 359
354368
384 363 372284
237 285 235212
239 237287
237 210 239197
232 252 234294
2002 2003 2004 2005 2006 2007 2008 2009 2010 2011 2012 2013 2014 2015 7M16
Time deposit Saving deposit Current account
448 453
300 253 302 318 321261
316 354 348268 301
368256 301 284 283
492 500
275239
310 328 331
258326
381 371
267345
395
250277 297 296
3M12 1H12 9M12 FY12 3M13 1H13 9M13 FY13 3M14 1H14 9M14 FY14 3M15 1H15 FY15 3M16 1H16 7M16
Cost of Fund(+) Local Government (-) Local Government
Description Details
Civil Servants (per December 2014) 426545
Multipurpose Customer (Civil Servants) 238965
5602
NPL 039 as of Julyrsquo 2016
36
Strength of Loan (Multipurpose Loan)
567 593 612 619 631 640
666 675 690 686
1H14 9M14 FY14 3M15 1H15 9M15 FY15 3M16 1H16 7M16
Multiguna Ticket Size (million) Rp
13864
14408
14849
15152
1560915794
1592416117
1649916394
1H14 9M14 FY14 3M15 1H15 9M15 FY15 3M16 1H16 7M16
Multiguna Loan Balance
( Billion Rp )
Foreign Institution Investor
7260 from public shares
Foreign Institution Investor
6581 from public shares
Public shares 20
from paid capital Domestic Investor
3419 from public shares
Domestic Investor
2740 from public shares
37
No Country Share
1 INDONESIA 3419402 LUKSEMBURG 161267
3 AMERIKA 1341304 NORWEGIA 1111345 SIPRUS 838626 FINLANDIA 577797 VIRGIN ISLAND 41059
8 INGGRIS 223339 IRLANDIA 17073
10 AUSTRALIA 0964611 JEPANG 0839812 KANADA 05512
No Country Share
14 SWEDIA 0248915 SINGAPURA 0201816 CAYMAN ISLAND 0060317 GREENLAND 0033118 CINA 0019319 SWITSERLAND 0011320 KOREA SELATAN 0007421 FILIPINA 0002222 MALAYSIA 0001523 HONGKONG 0000824 JERMAN 00001
Total 100
STRENGTH OF INSTITUTIONS INVESTOR
38
Awards amp Achievements
The Most Trusted Banking in
Microfinance Services of The
Year 2015
Very Good Predicate for 2014
Financial Performance
Infobank Awards 2015
Bank Jatim Regional Banks with
excellent service of the year
2016
Excellence in Building and
Managing Corporate Image
Corporate Image Award 2015
The 1st Champion of Indonesia
Original Brand 2015
Top BPD HRampIT Management
2016
39
Investor Relations (IR)
Corporate Secretary
(031) 5310090 ext 469
Email irubankjatimcoid
Contact

11
Business Plan 2016
Description 2015 2016 E
Total Asset 1265 536
Loan 846 1207
Third Party Fund 1319 505
Financial Ratio
- CAR 2122 1899
- LDR 8292 8846
- NPL Gross 429 425
- NIM 641 744
- BOPO 7611 8454
- ROE 1611 1838
- ROA 267 321
LOAN STRATEGY
bull Credit for vehicle acquirement
bull Increasing MoU with government institutions for multipurpose also private corporates
bull Intensifying linkage program to rural bank members of Perbamida or Perbarindo
FUNDING STRATEGY
bull Cooperating with competent institutions to distribute school operational fund
bull Expanding funding networks
bull Intensifying new funding products implementation
bull Pricing Strategy for lower interest rate
NPL STRATEGY
bull Collection with credit restructuring
bull Special collection for rest of government payment project terms
bull Insurances claim accelerations and recoveries
bull Collateral auction
GENERAL STRATEGY
bull Revitalization into competence and professional human capital to shape competency based on resource management
bull Development and reorganization of head office and branches for customer centric
12
NETWORK
Network 2009 2010 2011 2012 2013 2014 2015 7M16NETWORK
2016
SHARIA
2016
Head Office 1 1 1 1 1 1 1 1 1
Branch Office 39 41 41 41 41 43 45 46 1 2
Sub Branch
Office26 44 67 81 107 153 165 166 5 10
Cash office 151 154 164 164 176 165 185 185 9 6
Sharia service
office37 37 47 47 47 97 97 97 94
Payment Point 78 88 115 138 155 167 171 173 8 7
Mobile cash 45 49 57 57 59 62 65 78 11 6
Mobile ATM - 4 4 6 6 6 6 6
CDM 1 1 1 1 1 2 2 2
ATM 87 142 262 368 479 595 688 692 13 15
Total network 465 561 759 904 1072 1291 1425 1446
13
APPENDIX
14
ECONOMIC OUTLOOK
550 525 525
575 575 600725 750 750 750 750 775 750
675 650 650
430
590 590
840 838732
670
453
836
335
445345 321
FY12 3M13 1H13 9M13 FY13 3M14 1H14 9M14 FY14 FY15 3M16 1H16 7M16
LOANbillion
FUNDbillion
JIBOR
INFLASI
BI RATE
LOANbillion
FUNDbillion
INFLASI
BI RATE
BI 7-Day Repo Rate
15Source Bank Indonesia
MACRO ECONOMY REVIEW
In billion Rp
3225198 3243136 3374272 3526188 3663968 3618064 3834503 3995803 4114420 4198577 4319749 4464083 4413056 4478409
2725674 2787372 2982436 3170805 3319842 3334011 3494968 3592087 3706501 3713544 3861172 3990464 4092104 4035929
FY12 3M13 1H13 9M13 FY13 3M14 1H14 9M14 FY14 3M15 1H15 9M15 FY15 4M16
NATIONALYoY
EAST JAVAYoY
16Source East Java Gov
East Java amp National BPS
Regional Economic Growth
640562 521 512 500 500 471 470 473 479 492
727
615 640 594 591 590518 525 544 544 534
FY12 FY13 3M14 1H14 9M14 FY14 3M15 1H15 9M15 FY15 3M16
17
FINANCIAL HIGHLIGHTS
18
Balance Sheet
InformationIn million Rp
7M15 7M16 YoY
Total Asset 49222516 50786968 318
Placement BI amp SBI 14108042 11775816 -1653
Loan 28654214 29290730 222
Allowance for Impairment Losses (937449) (1203961) 2843
Third Party Fund 41644181 42537452 215
- Current Account 17698264 17926232 129
- Saving Account 10629904 12087219 1371
- Time Deposit 13316012 12524002 -595
Equity 5922719 6266316 580
19
Profit amp Loss
InformationIn million Rp
7M15 7M16 YoY
Interest Income 2636359 2792540 592
Interest Expense (822491) (823520) 013
Nett Interest Income 1813868 1969020 855
Non Interest Operational Income 274986 257429 -638
Non Interest Operational Expense (1394811) (1058368) -2412
Provision for Impairment Losses (428576) (323833) -2444
Nett Non Interest Operational Income (Expense)
(1119825) (1124772) 044
Operational Profit 694043 844248 2164
Non Operational Profit 41924 4298 -8975
Pre Tax Profit 735967 848546 1530
Taxes (223001) (236231) 593
Net profit 512966 612315 1937
142 157 163 174200
249291
331
380
525 508
46 55 74
101
131
161 186
223
262
287 293
120 132 137 145162
201222
260
303
446425
04 0405 05
09 09
0708
094
118
06106
07 07 07 0708
0908
12
134
082
17 172 21
27 28 2933
41
46
279
TOTAL ASSET (Rp Tril)
INTEREST INCOME (Rp Tril) INTEREST EXPENSE (Rp Tril)
CAGR =
1261
CAGR =
1142
CAGR =
1256
NET PROFIT (Rp Tril)
THIRD PARTY FUND(Rp Tril)
CAGR =
1533
LOAN (Rp Tril)
CAGR =
2153
CAGR =
1524
20
Financial Performance
R
O
A
R
O
E
N
I
M
Financial Ratio
23
261
414 407
355394
375
558
497
334
382352
267
380
318296
2004 2005 2006 2007 2008 2009 2010 2011 2012 2013 2014 2015 3M16 1H16 7M16
3054
36903848
308531482859
4057
3365
1896190418981611
23492087
1941
2004 2005 2006 2007 2008 2009 2010 2011 2012 2013 2014 2015 3M16 1H16 7M16
910 939 934
728
835766
917
795
648714 690
641683 669 665
2004 2005 2006 2007 2008 2009 2010 2011 2012 2013 2014 2015 3M16 1H16 7M16
L
D
R
C
A
R
B
O
P
O
22
Financial Ratio
4545 4513
38754211
5404
6967
8070 80118355 8498 8654
8292
68117264
6886
2004 2005 2006 2007 2008 2009 2010 2011 2012 2013 2014 2015 3M16 1H16 7M16
15291817
3845
3339
2536
21321919
1653
26562372
2217 21221946 2065 2047
2004 2005 2006 2007 2008 2009 2010 2011 2012 2013 2014 2015 3M16 1H16 7M16
7467 73836943 6820 6742 6604
5958 6002
6869 7028 6963
7611
6532
70567232
2004 2005 2006 2007 2008 2009 2010 2011 2012 2013 2014 2015 3M16 1H16 7M16
23
OVERVIEW amp INVESTMENT HIGHLIGHTS
24
Current AccountYoY 129
Saving AccountYoY 1371
Time DepositYoY (595)
Third Party Fund
9662
12083
9969
16563
11649
18292
20116
17698
13494
21037
15345
17926
81747064
9970
8082
10991
9172 9128
10630
12753
1098712379 12087
4374
8269
6048
10834
7630
10509
13437 13316
8016
9482
12578 12524
FY12 1H13 FY13 1H14 FY14 3M15 1H15 7M15 FY15 3M16 1H16 7M16
Current Account
Saving Account
Time Deposit
In Billion Rp
In Billion Rp
Government Current
Acc
YoY (1752)
Private Current Acc
YoY 20528
YoY
SIMPEDA 1091
SIKLUS 4390
Hajj Saving 289
TabunganKu 2476
Barokah Saving 3115
Time Deposit
YoY (595)
25
Detailed Third Party Fund
13821 11959 7220 14710 15803 16204 17985
5718 16715
10411 13365
2742 3491 4429
3582 4313 1494 1596
7776
4322 4933
4561
1H14 9M14 FY14 3M15 1H15 7M15 9M15 FY15 3M16 1H16 7M16
Current Account
Government Private
241 290 657 418 535 560 581 861 674 752 806 179 194 208 218 199 204 215 224 230 208 210
6946 7682
9239 7705 7543
8977 8535
10561 9046
10330 9957
651 687
795
748 762
797 814
994
925
980 994
65 70
93
83 87
92 94
112
112
110 120
1H14 9M14 FY14 3M15 1H15 7M15 9M15 FY15 3M16 1H16 7M16
Saving Account
SIKLUS Hajj Saving SIMPEDA TabunganKu Barokah Saving
10834 11331 7630 10509 13437 13316 13934 8016 9482 12578 12524
1H14 9M14 FY14 3M15 1H15 7M15 9M15 FY15 3M16 1H16 7M16
Time Deposit
26
Third Party Fund Customer
In million Rp
FY12 3M13 1H13 9M13 FY13 3M14 1H14 9M14 FY14 3M15 1H15 9M15 FY15 1H16 7M16
44
13
7
43
63
4
44
25
4
45
33
4
46
85
3
47
01
4
48
35
8
49
41
1
50
13
4
50
92
7
53
65
8
54
36
9
51
36
1
53
33
7
53
49
3
20
45
785
21
00
510
21
44
912
25
11
507
41
26
826
41
61
277
41
99
590
42
55
204
43
33
820
44
03
899
44
62
107
45
43
12
9
46
26
910
48
21
838
48
39
565
23
61
6
24
42
5
24
53
8
25
27
4
26
17
6
25
27
7
27
20
9
28
17
3
29
19
4
30
72
8
30
78
8
32
69
2
34
16
7
35
87
2
36
77
2
Total Customer
Current Account Saving Account Time Deposit
21831
27733 27304 27883
21277 24866
34252 31270
23236
35918 37489 36015
26273 28769
33511
399 322 329 303 242 199 192 210 254 208 205 225 276 257 250
18521 27761
33698 33250
23107
32546
39819 40218
26134
34200
43644 42621
23462
35063 34059
FY12 3M13 1H13 9M13 FY13 3M14 1H14 9M14 FY14 3M15 1H15 9M15 FY15 1H16 7M16
Ticket Size
Current Account Saving Account Time Deposit
27
Competitive Product
CONSUMER
COMMERCIAL
SME
CONSUMER LOAN Julyrsquo15 Julyrsquo16
Multipurpose 5447 5597
Mortgage 481 514
Others 236 301
Total 6164 6411
COMMERCIAL LOAN Julyrsquo15 Julyrsquo16
Standby Loan 374 224
Keppres 370 354
Overdraft 963 986
Syndicate 458 452
Total 2165 2015
Small Medium Ent Julyrsquo15 Julyrsquo16
KUR 241 082
Pundi Kencana 392 428
Jatim Mikro 160 188
Others 879 877
Total 1671 1574
28
Loan Proportion
In Billion Rp
YoY
Consumer
632
Commercial
(489)
SME
(369)
29
Type Of Loan
15599 16224 16711 17064 17575 17663 17939 18186 18427 18875 18779
5019 5624 5180 5054
6024 6204 6586 5697 5334 5789 5901
4203 4239 4304 4450 4689 4787 4710 4528 4507 4612 4611
1H14 9M14 FY14 3M15 1H15 7M15 9M15 FY15 3M16 1H16 7M16
Consumer Commercial SME
In Billion Rp
YoY
Multi
purpose
503
Mortgage
919
Others
3012
30
Type Of Loan
13864 14408
14849 15152 15609 15608 15794 15924 16117
16499 16394
1177 1233 1299 1340 1369 1379 1399 1434 1465 1502 1505
559 583 563 572 597 677 746 827 845 875 880
1H14 9M14 FY14 3M15 1H15 7M15 9M15 FY15 3M16 1H16 7M16
CONSUMER LOAN
Multipurpose Mortgage Others
In Billion Rp
YoY
Standby
Loan
(3877)
Keppres
(235)
Overdraft
462
Syndicate
071
31
Type Of Loan1
0
75
12
86
10
13
81
2
10
23
10
71
12
44
84
7
59
4
65
6
65
6
82
4 11
57
68
7
44
9
97
8
10
60
13
37
74
8
55
9
96
4
10
35
22
17
22
59
23
08
25
75
27
41
27
59
26
92
27
66
28
22
28
67
28
87
90
3
92
2
11
71
12
18
12
81
13
14
13
14
13
36
13
60
13
01
13
23
1H14 9M14 FY14 3M15 1H15 7M15 9M15 FY15 3M16 1H16 7M16
Commercial Loan
Standby Loan Keppres Overdraft Syndicate
In Billion Rp
YoY
KUR
(6532)
Pundi
Kencana
1163
Mikro
2031
Others
200
32
Type Of Loan1218
1128
1058
893
735
689
601
451
347
258
239
693
747
796
950
1108
1123
1157
1178
1223
1273
1254
78
165
264
345
452
457
491
520
530
557
550
2214
2199
2186
2262
2395
2517
2461
2380
2407
2523
2568
1H14 9M14 FY14 3M15 1H15 7M15 9M15 FY15 3M16 1H16 7M16
SME Loan
KUR Pundi Kencana Mikro Others
33
Type Of Loan
26
22
93
26
06
47
25
96
58
26
17
30
26
36
14
26
39
07
25
45
01
25
34
43
25
37
33
25
35
85
85
98
96
44
87
30
71
94
96
70
11
5
82
83
64
64
02
91
60
94
88
45
9
51
43
9
86
42
7
49
43
2
81
45
2
44
44
1
49
41
6
35
41
8
61
42
3
00
42
2
37
1H14 9M14 FY14 3M15 1H15 9M15 FY15 3M16 1H16 7M16
Total Customer
Consumer Commercial SME
5947 6225 6436 652 6667 6797 7146 7271 7439 7406
58231 58311 5933
702662292
56868
68119
83319
63196 62194
9147 9637 10069 1028 10366 10669 10877 10767 10903 10916
1H14 9M14 FY14 3M15 1H15 9M15 FY15 3M16 1H16 7M16
Ticket Size
Consumer Commercial SME
34
STRENGTH
35
Strength Of Funding
517
460 477426
403435
463 480431 407 435
384 385 394 421
246
254 288
362358
241
250284 359
354368
384 363 372284
237 285 235212
239 237287
237 210 239197
232 252 234294
2002 2003 2004 2005 2006 2007 2008 2009 2010 2011 2012 2013 2014 2015 7M16
Time deposit Saving deposit Current account
448 453
300 253 302 318 321261
316 354 348268 301
368256 301 284 283
492 500
275239
310 328 331
258326
381 371
267345
395
250277 297 296
3M12 1H12 9M12 FY12 3M13 1H13 9M13 FY13 3M14 1H14 9M14 FY14 3M15 1H15 FY15 3M16 1H16 7M16
Cost of Fund(+) Local Government (-) Local Government
Description Details
Civil Servants (per December 2014) 426545
Multipurpose Customer (Civil Servants) 238965
5602
NPL 039 as of Julyrsquo 2016
36
Strength of Loan (Multipurpose Loan)
567 593 612 619 631 640
666 675 690 686
1H14 9M14 FY14 3M15 1H15 9M15 FY15 3M16 1H16 7M16
Multiguna Ticket Size (million) Rp
13864
14408
14849
15152
1560915794
1592416117
1649916394
1H14 9M14 FY14 3M15 1H15 9M15 FY15 3M16 1H16 7M16
Multiguna Loan Balance
( Billion Rp )
Foreign Institution Investor
7260 from public shares
Foreign Institution Investor
6581 from public shares
Public shares 20
from paid capital Domestic Investor
3419 from public shares
Domestic Investor
2740 from public shares
37
No Country Share
1 INDONESIA 3419402 LUKSEMBURG 161267
3 AMERIKA 1341304 NORWEGIA 1111345 SIPRUS 838626 FINLANDIA 577797 VIRGIN ISLAND 41059
8 INGGRIS 223339 IRLANDIA 17073
10 AUSTRALIA 0964611 JEPANG 0839812 KANADA 05512
No Country Share
14 SWEDIA 0248915 SINGAPURA 0201816 CAYMAN ISLAND 0060317 GREENLAND 0033118 CINA 0019319 SWITSERLAND 0011320 KOREA SELATAN 0007421 FILIPINA 0002222 MALAYSIA 0001523 HONGKONG 0000824 JERMAN 00001
Total 100
STRENGTH OF INSTITUTIONS INVESTOR
38
Awards amp Achievements
The Most Trusted Banking in
Microfinance Services of The
Year 2015
Very Good Predicate for 2014
Financial Performance
Infobank Awards 2015
Bank Jatim Regional Banks with
excellent service of the year
2016
Excellence in Building and
Managing Corporate Image
Corporate Image Award 2015
The 1st Champion of Indonesia
Original Brand 2015
Top BPD HRampIT Management
2016
39
Investor Relations (IR)
Corporate Secretary
(031) 5310090 ext 469
Email irubankjatimcoid
Contact

12
NETWORK
Network 2009 2010 2011 2012 2013 2014 2015 7M16NETWORK
2016
SHARIA
2016
Head Office 1 1 1 1 1 1 1 1 1
Branch Office 39 41 41 41 41 43 45 46 1 2
Sub Branch
Office26 44 67 81 107 153 165 166 5 10
Cash office 151 154 164 164 176 165 185 185 9 6
Sharia service
office37 37 47 47 47 97 97 97 94
Payment Point 78 88 115 138 155 167 171 173 8 7
Mobile cash 45 49 57 57 59 62 65 78 11 6
Mobile ATM - 4 4 6 6 6 6 6
CDM 1 1 1 1 1 2 2 2
ATM 87 142 262 368 479 595 688 692 13 15
Total network 465 561 759 904 1072 1291 1425 1446
13
APPENDIX
14
ECONOMIC OUTLOOK
550 525 525
575 575 600725 750 750 750 750 775 750
675 650 650
430
590 590
840 838732
670
453
836
335
445345 321
FY12 3M13 1H13 9M13 FY13 3M14 1H14 9M14 FY14 FY15 3M16 1H16 7M16
LOANbillion
FUNDbillion
JIBOR
INFLASI
BI RATE
LOANbillion
FUNDbillion
INFLASI
BI RATE
BI 7-Day Repo Rate
15Source Bank Indonesia
MACRO ECONOMY REVIEW
In billion Rp
3225198 3243136 3374272 3526188 3663968 3618064 3834503 3995803 4114420 4198577 4319749 4464083 4413056 4478409
2725674 2787372 2982436 3170805 3319842 3334011 3494968 3592087 3706501 3713544 3861172 3990464 4092104 4035929
FY12 3M13 1H13 9M13 FY13 3M14 1H14 9M14 FY14 3M15 1H15 9M15 FY15 4M16
NATIONALYoY
EAST JAVAYoY
16Source East Java Gov
East Java amp National BPS
Regional Economic Growth
640562 521 512 500 500 471 470 473 479 492
727
615 640 594 591 590518 525 544 544 534
FY12 FY13 3M14 1H14 9M14 FY14 3M15 1H15 9M15 FY15 3M16
17
FINANCIAL HIGHLIGHTS
18
Balance Sheet
InformationIn million Rp
7M15 7M16 YoY
Total Asset 49222516 50786968 318
Placement BI amp SBI 14108042 11775816 -1653
Loan 28654214 29290730 222
Allowance for Impairment Losses (937449) (1203961) 2843
Third Party Fund 41644181 42537452 215
- Current Account 17698264 17926232 129
- Saving Account 10629904 12087219 1371
- Time Deposit 13316012 12524002 -595
Equity 5922719 6266316 580
19
Profit amp Loss
InformationIn million Rp
7M15 7M16 YoY
Interest Income 2636359 2792540 592
Interest Expense (822491) (823520) 013
Nett Interest Income 1813868 1969020 855
Non Interest Operational Income 274986 257429 -638
Non Interest Operational Expense (1394811) (1058368) -2412
Provision for Impairment Losses (428576) (323833) -2444
Nett Non Interest Operational Income (Expense)
(1119825) (1124772) 044
Operational Profit 694043 844248 2164
Non Operational Profit 41924 4298 -8975
Pre Tax Profit 735967 848546 1530
Taxes (223001) (236231) 593
Net profit 512966 612315 1937
142 157 163 174200
249291
331
380
525 508
46 55 74
101
131
161 186
223
262
287 293
120 132 137 145162
201222
260
303
446425
04 0405 05
09 09
0708
094
118
06106
07 07 07 0708
0908
12
134
082
17 172 21
27 28 2933
41
46
279
TOTAL ASSET (Rp Tril)
INTEREST INCOME (Rp Tril) INTEREST EXPENSE (Rp Tril)
CAGR =
1261
CAGR =
1142
CAGR =
1256
NET PROFIT (Rp Tril)
THIRD PARTY FUND(Rp Tril)
CAGR =
1533
LOAN (Rp Tril)
CAGR =
2153
CAGR =
1524
20
Financial Performance
R
O
A
R
O
E
N
I
M
Financial Ratio
23
261
414 407
355394
375
558
497
334
382352
267
380
318296
2004 2005 2006 2007 2008 2009 2010 2011 2012 2013 2014 2015 3M16 1H16 7M16
3054
36903848
308531482859
4057
3365
1896190418981611
23492087
1941
2004 2005 2006 2007 2008 2009 2010 2011 2012 2013 2014 2015 3M16 1H16 7M16
910 939 934
728
835766
917
795
648714 690
641683 669 665
2004 2005 2006 2007 2008 2009 2010 2011 2012 2013 2014 2015 3M16 1H16 7M16
L
D
R
C
A
R
B
O
P
O
22
Financial Ratio
4545 4513
38754211
5404
6967
8070 80118355 8498 8654
8292
68117264
6886
2004 2005 2006 2007 2008 2009 2010 2011 2012 2013 2014 2015 3M16 1H16 7M16
15291817
3845
3339
2536
21321919
1653
26562372
2217 21221946 2065 2047
2004 2005 2006 2007 2008 2009 2010 2011 2012 2013 2014 2015 3M16 1H16 7M16
7467 73836943 6820 6742 6604
5958 6002
6869 7028 6963
7611
6532
70567232
2004 2005 2006 2007 2008 2009 2010 2011 2012 2013 2014 2015 3M16 1H16 7M16
23
OVERVIEW amp INVESTMENT HIGHLIGHTS
24
Current AccountYoY 129
Saving AccountYoY 1371
Time DepositYoY (595)
Third Party Fund
9662
12083
9969
16563
11649
18292
20116
17698
13494
21037
15345
17926
81747064
9970
8082
10991
9172 9128
10630
12753
1098712379 12087
4374
8269
6048
10834
7630
10509
13437 13316
8016
9482
12578 12524
FY12 1H13 FY13 1H14 FY14 3M15 1H15 7M15 FY15 3M16 1H16 7M16
Current Account
Saving Account
Time Deposit
In Billion Rp
In Billion Rp
Government Current
Acc
YoY (1752)
Private Current Acc
YoY 20528
YoY
SIMPEDA 1091
SIKLUS 4390
Hajj Saving 289
TabunganKu 2476
Barokah Saving 3115
Time Deposit
YoY (595)
25
Detailed Third Party Fund
13821 11959 7220 14710 15803 16204 17985
5718 16715
10411 13365
2742 3491 4429
3582 4313 1494 1596
7776
4322 4933
4561
1H14 9M14 FY14 3M15 1H15 7M15 9M15 FY15 3M16 1H16 7M16
Current Account
Government Private
241 290 657 418 535 560 581 861 674 752 806 179 194 208 218 199 204 215 224 230 208 210
6946 7682
9239 7705 7543
8977 8535
10561 9046
10330 9957
651 687
795
748 762
797 814
994
925
980 994
65 70
93
83 87
92 94
112
112
110 120
1H14 9M14 FY14 3M15 1H15 7M15 9M15 FY15 3M16 1H16 7M16
Saving Account
SIKLUS Hajj Saving SIMPEDA TabunganKu Barokah Saving
10834 11331 7630 10509 13437 13316 13934 8016 9482 12578 12524
1H14 9M14 FY14 3M15 1H15 7M15 9M15 FY15 3M16 1H16 7M16
Time Deposit
26
Third Party Fund Customer
In million Rp
FY12 3M13 1H13 9M13 FY13 3M14 1H14 9M14 FY14 3M15 1H15 9M15 FY15 1H16 7M16
44
13
7
43
63
4
44
25
4
45
33
4
46
85
3
47
01
4
48
35
8
49
41
1
50
13
4
50
92
7
53
65
8
54
36
9
51
36
1
53
33
7
53
49
3
20
45
785
21
00
510
21
44
912
25
11
507
41
26
826
41
61
277
41
99
590
42
55
204
43
33
820
44
03
899
44
62
107
45
43
12
9
46
26
910
48
21
838
48
39
565
23
61
6
24
42
5
24
53
8
25
27
4
26
17
6
25
27
7
27
20
9
28
17
3
29
19
4
30
72
8
30
78
8
32
69
2
34
16
7
35
87
2
36
77
2
Total Customer
Current Account Saving Account Time Deposit
21831
27733 27304 27883
21277 24866
34252 31270
23236
35918 37489 36015
26273 28769
33511
399 322 329 303 242 199 192 210 254 208 205 225 276 257 250
18521 27761
33698 33250
23107
32546
39819 40218
26134
34200
43644 42621
23462
35063 34059
FY12 3M13 1H13 9M13 FY13 3M14 1H14 9M14 FY14 3M15 1H15 9M15 FY15 1H16 7M16
Ticket Size
Current Account Saving Account Time Deposit
27
Competitive Product
CONSUMER
COMMERCIAL
SME
CONSUMER LOAN Julyrsquo15 Julyrsquo16
Multipurpose 5447 5597
Mortgage 481 514
Others 236 301
Total 6164 6411
COMMERCIAL LOAN Julyrsquo15 Julyrsquo16
Standby Loan 374 224
Keppres 370 354
Overdraft 963 986
Syndicate 458 452
Total 2165 2015
Small Medium Ent Julyrsquo15 Julyrsquo16
KUR 241 082
Pundi Kencana 392 428
Jatim Mikro 160 188
Others 879 877
Total 1671 1574
28
Loan Proportion
In Billion Rp
YoY
Consumer
632
Commercial
(489)
SME
(369)
29
Type Of Loan
15599 16224 16711 17064 17575 17663 17939 18186 18427 18875 18779
5019 5624 5180 5054
6024 6204 6586 5697 5334 5789 5901
4203 4239 4304 4450 4689 4787 4710 4528 4507 4612 4611
1H14 9M14 FY14 3M15 1H15 7M15 9M15 FY15 3M16 1H16 7M16
Consumer Commercial SME
In Billion Rp
YoY
Multi
purpose
503
Mortgage
919
Others
3012
30
Type Of Loan
13864 14408
14849 15152 15609 15608 15794 15924 16117
16499 16394
1177 1233 1299 1340 1369 1379 1399 1434 1465 1502 1505
559 583 563 572 597 677 746 827 845 875 880
1H14 9M14 FY14 3M15 1H15 7M15 9M15 FY15 3M16 1H16 7M16
CONSUMER LOAN
Multipurpose Mortgage Others
In Billion Rp
YoY
Standby
Loan
(3877)
Keppres
(235)
Overdraft
462
Syndicate
071
31
Type Of Loan1
0
75
12
86
10
13
81
2
10
23
10
71
12
44
84
7
59
4
65
6
65
6
82
4 11
57
68
7
44
9
97
8
10
60
13
37
74
8
55
9
96
4
10
35
22
17
22
59
23
08
25
75
27
41
27
59
26
92
27
66
28
22
28
67
28
87
90
3
92
2
11
71
12
18
12
81
13
14
13
14
13
36
13
60
13
01
13
23
1H14 9M14 FY14 3M15 1H15 7M15 9M15 FY15 3M16 1H16 7M16
Commercial Loan
Standby Loan Keppres Overdraft Syndicate
In Billion Rp
YoY
KUR
(6532)
Pundi
Kencana
1163
Mikro
2031
Others
200
32
Type Of Loan1218
1128
1058
893
735
689
601
451
347
258
239
693
747
796
950
1108
1123
1157
1178
1223
1273
1254
78
165
264
345
452
457
491
520
530
557
550
2214
2199
2186
2262
2395
2517
2461
2380
2407
2523
2568
1H14 9M14 FY14 3M15 1H15 7M15 9M15 FY15 3M16 1H16 7M16
SME Loan
KUR Pundi Kencana Mikro Others
33
Type Of Loan
26
22
93
26
06
47
25
96
58
26
17
30
26
36
14
26
39
07
25
45
01
25
34
43
25
37
33
25
35
85
85
98
96
44
87
30
71
94
96
70
11
5
82
83
64
64
02
91
60
94
88
45
9
51
43
9
86
42
7
49
43
2
81
45
2
44
44
1
49
41
6
35
41
8
61
42
3
00
42
2
37
1H14 9M14 FY14 3M15 1H15 9M15 FY15 3M16 1H16 7M16
Total Customer
Consumer Commercial SME
5947 6225 6436 652 6667 6797 7146 7271 7439 7406
58231 58311 5933
702662292
56868
68119
83319
63196 62194
9147 9637 10069 1028 10366 10669 10877 10767 10903 10916
1H14 9M14 FY14 3M15 1H15 9M15 FY15 3M16 1H16 7M16
Ticket Size
Consumer Commercial SME
34
STRENGTH
35
Strength Of Funding
517
460 477426
403435
463 480431 407 435
384 385 394 421
246
254 288
362358
241
250284 359
354368
384 363 372284
237 285 235212
239 237287
237 210 239197
232 252 234294
2002 2003 2004 2005 2006 2007 2008 2009 2010 2011 2012 2013 2014 2015 7M16
Time deposit Saving deposit Current account
448 453
300 253 302 318 321261
316 354 348268 301
368256 301 284 283
492 500
275239
310 328 331
258326
381 371
267345
395
250277 297 296
3M12 1H12 9M12 FY12 3M13 1H13 9M13 FY13 3M14 1H14 9M14 FY14 3M15 1H15 FY15 3M16 1H16 7M16
Cost of Fund(+) Local Government (-) Local Government
Description Details
Civil Servants (per December 2014) 426545
Multipurpose Customer (Civil Servants) 238965
5602
NPL 039 as of Julyrsquo 2016
36
Strength of Loan (Multipurpose Loan)
567 593 612 619 631 640
666 675 690 686
1H14 9M14 FY14 3M15 1H15 9M15 FY15 3M16 1H16 7M16
Multiguna Ticket Size (million) Rp
13864
14408
14849
15152
1560915794
1592416117
1649916394
1H14 9M14 FY14 3M15 1H15 9M15 FY15 3M16 1H16 7M16
Multiguna Loan Balance
( Billion Rp )
Foreign Institution Investor
7260 from public shares
Foreign Institution Investor
6581 from public shares
Public shares 20
from paid capital Domestic Investor
3419 from public shares
Domestic Investor
2740 from public shares
37
No Country Share
1 INDONESIA 3419402 LUKSEMBURG 161267
3 AMERIKA 1341304 NORWEGIA 1111345 SIPRUS 838626 FINLANDIA 577797 VIRGIN ISLAND 41059
8 INGGRIS 223339 IRLANDIA 17073
10 AUSTRALIA 0964611 JEPANG 0839812 KANADA 05512
No Country Share
14 SWEDIA 0248915 SINGAPURA 0201816 CAYMAN ISLAND 0060317 GREENLAND 0033118 CINA 0019319 SWITSERLAND 0011320 KOREA SELATAN 0007421 FILIPINA 0002222 MALAYSIA 0001523 HONGKONG 0000824 JERMAN 00001
Total 100
STRENGTH OF INSTITUTIONS INVESTOR
38
Awards amp Achievements
The Most Trusted Banking in
Microfinance Services of The
Year 2015
Very Good Predicate for 2014
Financial Performance
Infobank Awards 2015
Bank Jatim Regional Banks with
excellent service of the year
2016
Excellence in Building and
Managing Corporate Image
Corporate Image Award 2015
The 1st Champion of Indonesia
Original Brand 2015
Top BPD HRampIT Management
2016
39
Investor Relations (IR)
Corporate Secretary
(031) 5310090 ext 469
Email irubankjatimcoid
Contact
13
APPENDIX
14
ECONOMIC OUTLOOK
550 525 525
575 575 600725 750 750 750 750 775 750
675 650 650
430
590 590
840 838732
670
453
836
335
445345 321
FY12 3M13 1H13 9M13 FY13 3M14 1H14 9M14 FY14 FY15 3M16 1H16 7M16
LOANbillion
FUNDbillion
JIBOR
INFLASI
BI RATE
LOANbillion
FUNDbillion
INFLASI
BI RATE
BI 7-Day Repo Rate
15Source Bank Indonesia
MACRO ECONOMY REVIEW
In billion Rp
3225198 3243136 3374272 3526188 3663968 3618064 3834503 3995803 4114420 4198577 4319749 4464083 4413056 4478409
2725674 2787372 2982436 3170805 3319842 3334011 3494968 3592087 3706501 3713544 3861172 3990464 4092104 4035929
FY12 3M13 1H13 9M13 FY13 3M14 1H14 9M14 FY14 3M15 1H15 9M15 FY15 4M16
NATIONALYoY
EAST JAVAYoY
16Source East Java Gov
East Java amp National BPS
Regional Economic Growth
640562 521 512 500 500 471 470 473 479 492
727
615 640 594 591 590518 525 544 544 534
FY12 FY13 3M14 1H14 9M14 FY14 3M15 1H15 9M15 FY15 3M16
17
FINANCIAL HIGHLIGHTS
18
Balance Sheet
InformationIn million Rp
7M15 7M16 YoY
Total Asset 49222516 50786968 318
Placement BI amp SBI 14108042 11775816 -1653
Loan 28654214 29290730 222
Allowance for Impairment Losses (937449) (1203961) 2843
Third Party Fund 41644181 42537452 215
- Current Account 17698264 17926232 129
- Saving Account 10629904 12087219 1371
- Time Deposit 13316012 12524002 -595
Equity 5922719 6266316 580
19
Profit amp Loss
InformationIn million Rp
7M15 7M16 YoY
Interest Income 2636359 2792540 592
Interest Expense (822491) (823520) 013
Nett Interest Income 1813868 1969020 855
Non Interest Operational Income 274986 257429 -638
Non Interest Operational Expense (1394811) (1058368) -2412
Provision for Impairment Losses (428576) (323833) -2444
Nett Non Interest Operational Income (Expense)
(1119825) (1124772) 044
Operational Profit 694043 844248 2164
Non Operational Profit 41924 4298 -8975
Pre Tax Profit 735967 848546 1530
Taxes (223001) (236231) 593
Net profit 512966 612315 1937
142 157 163 174200
249291
331
380
525 508
46 55 74
101
131
161 186
223
262
287 293
120 132 137 145162
201222
260
303
446425
04 0405 05
09 09
0708
094
118
06106
07 07 07 0708
0908
12
134
082
17 172 21
27 28 2933
41
46
279
TOTAL ASSET (Rp Tril)
INTEREST INCOME (Rp Tril) INTEREST EXPENSE (Rp Tril)
CAGR =
1261
CAGR =
1142
CAGR =
1256
NET PROFIT (Rp Tril)
THIRD PARTY FUND(Rp Tril)
CAGR =
1533
LOAN (Rp Tril)
CAGR =
2153
CAGR =
1524
20
Financial Performance
R
O
A
R
O
E
N
I
M
Financial Ratio
23
261
414 407
355394
375
558
497
334
382352
267
380
318296
2004 2005 2006 2007 2008 2009 2010 2011 2012 2013 2014 2015 3M16 1H16 7M16
3054
36903848
308531482859
4057
3365
1896190418981611
23492087
1941
2004 2005 2006 2007 2008 2009 2010 2011 2012 2013 2014 2015 3M16 1H16 7M16
910 939 934
728
835766
917
795
648714 690
641683 669 665
2004 2005 2006 2007 2008 2009 2010 2011 2012 2013 2014 2015 3M16 1H16 7M16
L
D
R
C
A
R
B
O
P
O
22
Financial Ratio
4545 4513
38754211
5404
6967
8070 80118355 8498 8654
8292
68117264
6886
2004 2005 2006 2007 2008 2009 2010 2011 2012 2013 2014 2015 3M16 1H16 7M16
15291817
3845
3339
2536
21321919
1653
26562372
2217 21221946 2065 2047
2004 2005 2006 2007 2008 2009 2010 2011 2012 2013 2014 2015 3M16 1H16 7M16
7467 73836943 6820 6742 6604
5958 6002
6869 7028 6963
7611
6532
70567232
2004 2005 2006 2007 2008 2009 2010 2011 2012 2013 2014 2015 3M16 1H16 7M16
23
OVERVIEW amp INVESTMENT HIGHLIGHTS
24
Current AccountYoY 129
Saving AccountYoY 1371
Time DepositYoY (595)
Third Party Fund
9662
12083
9969
16563
11649
18292
20116
17698
13494
21037
15345
17926
81747064
9970
8082
10991
9172 9128
10630
12753
1098712379 12087
4374
8269
6048
10834
7630
10509
13437 13316
8016
9482
12578 12524
FY12 1H13 FY13 1H14 FY14 3M15 1H15 7M15 FY15 3M16 1H16 7M16
Current Account
Saving Account
Time Deposit
In Billion Rp
In Billion Rp
Government Current
Acc
YoY (1752)
Private Current Acc
YoY 20528
YoY
SIMPEDA 1091
SIKLUS 4390
Hajj Saving 289
TabunganKu 2476
Barokah Saving 3115
Time Deposit
YoY (595)
25
Detailed Third Party Fund
13821 11959 7220 14710 15803 16204 17985
5718 16715
10411 13365
2742 3491 4429
3582 4313 1494 1596
7776
4322 4933
4561
1H14 9M14 FY14 3M15 1H15 7M15 9M15 FY15 3M16 1H16 7M16
Current Account
Government Private
241 290 657 418 535 560 581 861 674 752 806 179 194 208 218 199 204 215 224 230 208 210
6946 7682
9239 7705 7543
8977 8535
10561 9046
10330 9957
651 687
795
748 762
797 814
994
925
980 994
65 70
93
83 87
92 94
112
112
110 120
1H14 9M14 FY14 3M15 1H15 7M15 9M15 FY15 3M16 1H16 7M16
Saving Account
SIKLUS Hajj Saving SIMPEDA TabunganKu Barokah Saving
10834 11331 7630 10509 13437 13316 13934 8016 9482 12578 12524
1H14 9M14 FY14 3M15 1H15 7M15 9M15 FY15 3M16 1H16 7M16
Time Deposit
26
Third Party Fund Customer
In million Rp
FY12 3M13 1H13 9M13 FY13 3M14 1H14 9M14 FY14 3M15 1H15 9M15 FY15 1H16 7M16
44
13
7
43
63
4
44
25
4
45
33
4
46
85
3
47
01
4
48
35
8
49
41
1
50
13
4
50
92
7
53
65
8
54
36
9
51
36
1
53
33
7
53
49
3
20
45
785
21
00
510
21
44
912
25
11
507
41
26
826
41
61
277
41
99
590
42
55
204
43
33
820
44
03
899
44
62
107
45
43
12
9
46
26
910
48
21
838
48
39
565
23
61
6
24
42
5
24
53
8
25
27
4
26
17
6
25
27
7
27
20
9
28
17
3
29
19
4
30
72
8
30
78
8
32
69
2
34
16
7
35
87
2
36
77
2
Total Customer
Current Account Saving Account Time Deposit
21831
27733 27304 27883
21277 24866
34252 31270
23236
35918 37489 36015
26273 28769
33511
399 322 329 303 242 199 192 210 254 208 205 225 276 257 250
18521 27761
33698 33250
23107
32546
39819 40218
26134
34200
43644 42621
23462
35063 34059
FY12 3M13 1H13 9M13 FY13 3M14 1H14 9M14 FY14 3M15 1H15 9M15 FY15 1H16 7M16
Ticket Size
Current Account Saving Account Time Deposit
27
Competitive Product
CONSUMER
COMMERCIAL
SME
CONSUMER LOAN Julyrsquo15 Julyrsquo16
Multipurpose 5447 5597
Mortgage 481 514
Others 236 301
Total 6164 6411
COMMERCIAL LOAN Julyrsquo15 Julyrsquo16
Standby Loan 374 224
Keppres 370 354
Overdraft 963 986
Syndicate 458 452
Total 2165 2015
Small Medium Ent Julyrsquo15 Julyrsquo16
KUR 241 082
Pundi Kencana 392 428
Jatim Mikro 160 188
Others 879 877
Total 1671 1574
28
Loan Proportion
In Billion Rp
YoY
Consumer
632
Commercial
(489)
SME
(369)
29
Type Of Loan
15599 16224 16711 17064 17575 17663 17939 18186 18427 18875 18779
5019 5624 5180 5054
6024 6204 6586 5697 5334 5789 5901
4203 4239 4304 4450 4689 4787 4710 4528 4507 4612 4611
1H14 9M14 FY14 3M15 1H15 7M15 9M15 FY15 3M16 1H16 7M16
Consumer Commercial SME
In Billion Rp
YoY
Multi
purpose
503
Mortgage
919
Others
3012
30
Type Of Loan
13864 14408
14849 15152 15609 15608 15794 15924 16117
16499 16394
1177 1233 1299 1340 1369 1379 1399 1434 1465 1502 1505
559 583 563 572 597 677 746 827 845 875 880
1H14 9M14 FY14 3M15 1H15 7M15 9M15 FY15 3M16 1H16 7M16
CONSUMER LOAN
Multipurpose Mortgage Others
In Billion Rp
YoY
Standby
Loan
(3877)
Keppres
(235)
Overdraft
462
Syndicate
071
31
Type Of Loan1
0
75
12
86
10
13
81
2
10
23
10
71
12
44
84
7
59
4
65
6
65
6
82
4 11
57
68
7
44
9
97
8
10
60
13
37
74
8
55
9
96
4
10
35
22
17
22
59
23
08
25
75
27
41
27
59
26
92
27
66
28
22
28
67
28
87
90
3
92
2
11
71
12
18
12
81
13
14
13
14
13
36
13
60
13
01
13
23
1H14 9M14 FY14 3M15 1H15 7M15 9M15 FY15 3M16 1H16 7M16
Commercial Loan
Standby Loan Keppres Overdraft Syndicate
In Billion Rp
YoY
KUR
(6532)
Pundi
Kencana
1163
Mikro
2031
Others
200
32
Type Of Loan1218
1128
1058
893
735
689
601
451
347
258
239
693
747
796
950
1108
1123
1157
1178
1223
1273
1254
78
165
264
345
452
457
491
520
530
557
550
2214
2199
2186
2262
2395
2517
2461
2380
2407
2523
2568
1H14 9M14 FY14 3M15 1H15 7M15 9M15 FY15 3M16 1H16 7M16
SME Loan
KUR Pundi Kencana Mikro Others
33
Type Of Loan
26
22
93
26
06
47
25
96
58
26
17
30
26
36
14
26
39
07
25
45
01
25
34
43
25
37
33
25
35
85
85
98
96
44
87
30
71
94
96
70
11
5
82
83
64
64
02
91
60
94
88
45
9
51
43
9
86
42
7
49
43
2
81
45
2
44
44
1
49
41
6
35
41
8
61
42
3
00
42
2
37
1H14 9M14 FY14 3M15 1H15 9M15 FY15 3M16 1H16 7M16
Total Customer
Consumer Commercial SME
5947 6225 6436 652 6667 6797 7146 7271 7439 7406
58231 58311 5933
702662292
56868
68119
83319
63196 62194
9147 9637 10069 1028 10366 10669 10877 10767 10903 10916
1H14 9M14 FY14 3M15 1H15 9M15 FY15 3M16 1H16 7M16
Ticket Size
Consumer Commercial SME
34
STRENGTH
35
Strength Of Funding
517
460 477426
403435
463 480431 407 435
384 385 394 421
246
254 288
362358
241
250284 359
354368
384 363 372284
237 285 235212
239 237287
237 210 239197
232 252 234294
2002 2003 2004 2005 2006 2007 2008 2009 2010 2011 2012 2013 2014 2015 7M16
Time deposit Saving deposit Current account
448 453
300 253 302 318 321261
316 354 348268 301
368256 301 284 283
492 500
275239
310 328 331
258326
381 371
267345
395
250277 297 296
3M12 1H12 9M12 FY12 3M13 1H13 9M13 FY13 3M14 1H14 9M14 FY14 3M15 1H15 FY15 3M16 1H16 7M16
Cost of Fund(+) Local Government (-) Local Government
Description Details
Civil Servants (per December 2014) 426545
Multipurpose Customer (Civil Servants) 238965
5602
NPL 039 as of Julyrsquo 2016
36
Strength of Loan (Multipurpose Loan)
567 593 612 619 631 640
666 675 690 686
1H14 9M14 FY14 3M15 1H15 9M15 FY15 3M16 1H16 7M16
Multiguna Ticket Size (million) Rp
13864
14408
14849
15152
1560915794
1592416117
1649916394
1H14 9M14 FY14 3M15 1H15 9M15 FY15 3M16 1H16 7M16
Multiguna Loan Balance
( Billion Rp )
Foreign Institution Investor
7260 from public shares
Foreign Institution Investor
6581 from public shares
Public shares 20
from paid capital Domestic Investor
3419 from public shares
Domestic Investor
2740 from public shares
37
No Country Share
1 INDONESIA 3419402 LUKSEMBURG 161267
3 AMERIKA 1341304 NORWEGIA 1111345 SIPRUS 838626 FINLANDIA 577797 VIRGIN ISLAND 41059
8 INGGRIS 223339 IRLANDIA 17073
10 AUSTRALIA 0964611 JEPANG 0839812 KANADA 05512
No Country Share
14 SWEDIA 0248915 SINGAPURA 0201816 CAYMAN ISLAND 0060317 GREENLAND 0033118 CINA 0019319 SWITSERLAND 0011320 KOREA SELATAN 0007421 FILIPINA 0002222 MALAYSIA 0001523 HONGKONG 0000824 JERMAN 00001
Total 100
STRENGTH OF INSTITUTIONS INVESTOR
38
Awards amp Achievements
The Most Trusted Banking in
Microfinance Services of The
Year 2015
Very Good Predicate for 2014
Financial Performance
Infobank Awards 2015
Bank Jatim Regional Banks with
excellent service of the year
2016
Excellence in Building and
Managing Corporate Image
Corporate Image Award 2015
The 1st Champion of Indonesia
Original Brand 2015
Top BPD HRampIT Management
2016
39
Investor Relations (IR)
Corporate Secretary
(031) 5310090 ext 469
Email irubankjatimcoid
Contact

14
ECONOMIC OUTLOOK
550 525 525
575 575 600725 750 750 750 750 775 750
675 650 650
430
590 590
840 838732
670
453
836
335
445345 321
FY12 3M13 1H13 9M13 FY13 3M14 1H14 9M14 FY14 FY15 3M16 1H16 7M16
LOANbillion
FUNDbillion
JIBOR
INFLASI
BI RATE
LOANbillion
FUNDbillion
INFLASI
BI RATE
BI 7-Day Repo Rate
15Source Bank Indonesia
MACRO ECONOMY REVIEW
In billion Rp
3225198 3243136 3374272 3526188 3663968 3618064 3834503 3995803 4114420 4198577 4319749 4464083 4413056 4478409
2725674 2787372 2982436 3170805 3319842 3334011 3494968 3592087 3706501 3713544 3861172 3990464 4092104 4035929
FY12 3M13 1H13 9M13 FY13 3M14 1H14 9M14 FY14 3M15 1H15 9M15 FY15 4M16
NATIONALYoY
EAST JAVAYoY
16Source East Java Gov
East Java amp National BPS
Regional Economic Growth
640562 521 512 500 500 471 470 473 479 492
727
615 640 594 591 590518 525 544 544 534
FY12 FY13 3M14 1H14 9M14 FY14 3M15 1H15 9M15 FY15 3M16
17
FINANCIAL HIGHLIGHTS
18
Balance Sheet
InformationIn million Rp
7M15 7M16 YoY
Total Asset 49222516 50786968 318
Placement BI amp SBI 14108042 11775816 -1653
Loan 28654214 29290730 222
Allowance for Impairment Losses (937449) (1203961) 2843
Third Party Fund 41644181 42537452 215
- Current Account 17698264 17926232 129
- Saving Account 10629904 12087219 1371
- Time Deposit 13316012 12524002 -595
Equity 5922719 6266316 580
19
Profit amp Loss
InformationIn million Rp
7M15 7M16 YoY
Interest Income 2636359 2792540 592
Interest Expense (822491) (823520) 013
Nett Interest Income 1813868 1969020 855
Non Interest Operational Income 274986 257429 -638
Non Interest Operational Expense (1394811) (1058368) -2412
Provision for Impairment Losses (428576) (323833) -2444
Nett Non Interest Operational Income (Expense)
(1119825) (1124772) 044
Operational Profit 694043 844248 2164
Non Operational Profit 41924 4298 -8975
Pre Tax Profit 735967 848546 1530
Taxes (223001) (236231) 593
Net profit 512966 612315 1937
142 157 163 174200
249291
331
380
525 508
46 55 74
101
131
161 186
223
262
287 293
120 132 137 145162
201222
260
303
446425
04 0405 05
09 09
0708
094
118
06106
07 07 07 0708
0908
12
134
082
17 172 21
27 28 2933
41
46
279
TOTAL ASSET (Rp Tril)
INTEREST INCOME (Rp Tril) INTEREST EXPENSE (Rp Tril)
CAGR =
1261
CAGR =
1142
CAGR =
1256
NET PROFIT (Rp Tril)
THIRD PARTY FUND(Rp Tril)
CAGR =
1533
LOAN (Rp Tril)
CAGR =
2153
CAGR =
1524
20
Financial Performance
R
O
A
R
O
E
N
I
M
Financial Ratio
23
261
414 407
355394
375
558
497
334
382352
267
380
318296
2004 2005 2006 2007 2008 2009 2010 2011 2012 2013 2014 2015 3M16 1H16 7M16
3054
36903848
308531482859
4057
3365
1896190418981611
23492087
1941
2004 2005 2006 2007 2008 2009 2010 2011 2012 2013 2014 2015 3M16 1H16 7M16
910 939 934
728
835766
917
795
648714 690
641683 669 665
2004 2005 2006 2007 2008 2009 2010 2011 2012 2013 2014 2015 3M16 1H16 7M16
L
D
R
C
A
R
B
O
P
O
22
Financial Ratio
4545 4513
38754211
5404
6967
8070 80118355 8498 8654
8292
68117264
6886
2004 2005 2006 2007 2008 2009 2010 2011 2012 2013 2014 2015 3M16 1H16 7M16
15291817
3845
3339
2536
21321919
1653
26562372
2217 21221946 2065 2047
2004 2005 2006 2007 2008 2009 2010 2011 2012 2013 2014 2015 3M16 1H16 7M16
7467 73836943 6820 6742 6604
5958 6002
6869 7028 6963
7611
6532
70567232
2004 2005 2006 2007 2008 2009 2010 2011 2012 2013 2014 2015 3M16 1H16 7M16
23
OVERVIEW amp INVESTMENT HIGHLIGHTS
24
Current AccountYoY 129
Saving AccountYoY 1371
Time DepositYoY (595)
Third Party Fund
9662
12083
9969
16563
11649
18292
20116
17698
13494
21037
15345
17926
81747064
9970
8082
10991
9172 9128
10630
12753
1098712379 12087
4374
8269
6048
10834
7630
10509
13437 13316
8016
9482
12578 12524
FY12 1H13 FY13 1H14 FY14 3M15 1H15 7M15 FY15 3M16 1H16 7M16
Current Account
Saving Account
Time Deposit
In Billion Rp
In Billion Rp
Government Current
Acc
YoY (1752)
Private Current Acc
YoY 20528
YoY
SIMPEDA 1091
SIKLUS 4390
Hajj Saving 289
TabunganKu 2476
Barokah Saving 3115
Time Deposit
YoY (595)
25
Detailed Third Party Fund
13821 11959 7220 14710 15803 16204 17985
5718 16715
10411 13365
2742 3491 4429
3582 4313 1494 1596
7776
4322 4933
4561
1H14 9M14 FY14 3M15 1H15 7M15 9M15 FY15 3M16 1H16 7M16
Current Account
Government Private
241 290 657 418 535 560 581 861 674 752 806 179 194 208 218 199 204 215 224 230 208 210
6946 7682
9239 7705 7543
8977 8535
10561 9046
10330 9957
651 687
795
748 762
797 814
994
925
980 994
65 70
93
83 87
92 94
112
112
110 120
1H14 9M14 FY14 3M15 1H15 7M15 9M15 FY15 3M16 1H16 7M16
Saving Account
SIKLUS Hajj Saving SIMPEDA TabunganKu Barokah Saving
10834 11331 7630 10509 13437 13316 13934 8016 9482 12578 12524
1H14 9M14 FY14 3M15 1H15 7M15 9M15 FY15 3M16 1H16 7M16
Time Deposit
26
Third Party Fund Customer
In million Rp
FY12 3M13 1H13 9M13 FY13 3M14 1H14 9M14 FY14 3M15 1H15 9M15 FY15 1H16 7M16
44
13
7
43
63
4
44
25
4
45
33
4
46
85
3
47
01
4
48
35
8
49
41
1
50
13
4
50
92
7
53
65
8
54
36
9
51
36
1
53
33
7
53
49
3
20
45
785
21
00
510
21
44
912
25
11
507
41
26
826
41
61
277
41
99
590
42
55
204
43
33
820
44
03
899
44
62
107
45
43
12
9
46
26
910
48
21
838
48
39
565
23
61
6
24
42
5
24
53
8
25
27
4
26
17
6
25
27
7
27
20
9
28
17
3
29
19
4
30
72
8
30
78
8
32
69
2
34
16
7
35
87
2
36
77
2
Total Customer
Current Account Saving Account Time Deposit
21831
27733 27304 27883
21277 24866
34252 31270
23236
35918 37489 36015
26273 28769
33511
399 322 329 303 242 199 192 210 254 208 205 225 276 257 250
18521 27761
33698 33250
23107
32546
39819 40218
26134
34200
43644 42621
23462
35063 34059
FY12 3M13 1H13 9M13 FY13 3M14 1H14 9M14 FY14 3M15 1H15 9M15 FY15 1H16 7M16
Ticket Size
Current Account Saving Account Time Deposit
27
Competitive Product
CONSUMER
COMMERCIAL
SME
CONSUMER LOAN Julyrsquo15 Julyrsquo16
Multipurpose 5447 5597
Mortgage 481 514
Others 236 301
Total 6164 6411
COMMERCIAL LOAN Julyrsquo15 Julyrsquo16
Standby Loan 374 224
Keppres 370 354
Overdraft 963 986
Syndicate 458 452
Total 2165 2015
Small Medium Ent Julyrsquo15 Julyrsquo16
KUR 241 082
Pundi Kencana 392 428
Jatim Mikro 160 188
Others 879 877
Total 1671 1574
28
Loan Proportion
In Billion Rp
YoY
Consumer
632
Commercial
(489)
SME
(369)
29
Type Of Loan
15599 16224 16711 17064 17575 17663 17939 18186 18427 18875 18779
5019 5624 5180 5054
6024 6204 6586 5697 5334 5789 5901
4203 4239 4304 4450 4689 4787 4710 4528 4507 4612 4611
1H14 9M14 FY14 3M15 1H15 7M15 9M15 FY15 3M16 1H16 7M16
Consumer Commercial SME
In Billion Rp
YoY
Multi
purpose
503
Mortgage
919
Others
3012
30
Type Of Loan
13864 14408
14849 15152 15609 15608 15794 15924 16117
16499 16394
1177 1233 1299 1340 1369 1379 1399 1434 1465 1502 1505
559 583 563 572 597 677 746 827 845 875 880
1H14 9M14 FY14 3M15 1H15 7M15 9M15 FY15 3M16 1H16 7M16
CONSUMER LOAN
Multipurpose Mortgage Others
In Billion Rp
YoY
Standby
Loan
(3877)
Keppres
(235)
Overdraft
462
Syndicate
071
31
Type Of Loan1
0
75
12
86
10
13
81
2
10
23
10
71
12
44
84
7
59
4
65
6
65
6
82
4 11
57
68
7
44
9
97
8
10
60
13
37
74
8
55
9
96
4
10
35
22
17
22
59
23
08
25
75
27
41
27
59
26
92
27
66
28
22
28
67
28
87
90
3
92
2
11
71
12
18
12
81
13
14
13
14
13
36
13
60
13
01
13
23
1H14 9M14 FY14 3M15 1H15 7M15 9M15 FY15 3M16 1H16 7M16
Commercial Loan
Standby Loan Keppres Overdraft Syndicate
In Billion Rp
YoY
KUR
(6532)
Pundi
Kencana
1163
Mikro
2031
Others
200
32
Type Of Loan1218
1128
1058
893
735
689
601
451
347
258
239
693
747
796
950
1108
1123
1157
1178
1223
1273
1254
78
165
264
345
452
457
491
520
530
557
550
2214
2199
2186
2262
2395
2517
2461
2380
2407
2523
2568
1H14 9M14 FY14 3M15 1H15 7M15 9M15 FY15 3M16 1H16 7M16
SME Loan
KUR Pundi Kencana Mikro Others
33
Type Of Loan
26
22
93
26
06
47
25
96
58
26
17
30
26
36
14
26
39
07
25
45
01
25
34
43
25
37
33
25
35
85
85
98
96
44
87
30
71
94
96
70
11
5
82
83
64
64
02
91
60
94
88
45
9
51
43
9
86
42
7
49
43
2
81
45
2
44
44
1
49
41
6
35
41
8
61
42
3
00
42
2
37
1H14 9M14 FY14 3M15 1H15 9M15 FY15 3M16 1H16 7M16
Total Customer
Consumer Commercial SME
5947 6225 6436 652 6667 6797 7146 7271 7439 7406
58231 58311 5933
702662292
56868
68119
83319
63196 62194
9147 9637 10069 1028 10366 10669 10877 10767 10903 10916
1H14 9M14 FY14 3M15 1H15 9M15 FY15 3M16 1H16 7M16
Ticket Size
Consumer Commercial SME
34
STRENGTH
35
Strength Of Funding
517
460 477426
403435
463 480431 407 435
384 385 394 421
246
254 288
362358
241
250284 359
354368
384 363 372284
237 285 235212
239 237287
237 210 239197
232 252 234294
2002 2003 2004 2005 2006 2007 2008 2009 2010 2011 2012 2013 2014 2015 7M16
Time deposit Saving deposit Current account
448 453
300 253 302 318 321261
316 354 348268 301
368256 301 284 283
492 500
275239
310 328 331
258326
381 371
267345
395
250277 297 296
3M12 1H12 9M12 FY12 3M13 1H13 9M13 FY13 3M14 1H14 9M14 FY14 3M15 1H15 FY15 3M16 1H16 7M16
Cost of Fund(+) Local Government (-) Local Government
Description Details
Civil Servants (per December 2014) 426545
Multipurpose Customer (Civil Servants) 238965
5602
NPL 039 as of Julyrsquo 2016
36
Strength of Loan (Multipurpose Loan)
567 593 612 619 631 640
666 675 690 686
1H14 9M14 FY14 3M15 1H15 9M15 FY15 3M16 1H16 7M16
Multiguna Ticket Size (million) Rp
13864
14408
14849
15152
1560915794
1592416117
1649916394
1H14 9M14 FY14 3M15 1H15 9M15 FY15 3M16 1H16 7M16
Multiguna Loan Balance
( Billion Rp )
Foreign Institution Investor
7260 from public shares
Foreign Institution Investor
6581 from public shares
Public shares 20
from paid capital Domestic Investor
3419 from public shares
Domestic Investor
2740 from public shares
37
No Country Share
1 INDONESIA 3419402 LUKSEMBURG 161267
3 AMERIKA 1341304 NORWEGIA 1111345 SIPRUS 838626 FINLANDIA 577797 VIRGIN ISLAND 41059
8 INGGRIS 223339 IRLANDIA 17073
10 AUSTRALIA 0964611 JEPANG 0839812 KANADA 05512
No Country Share
14 SWEDIA 0248915 SINGAPURA 0201816 CAYMAN ISLAND 0060317 GREENLAND 0033118 CINA 0019319 SWITSERLAND 0011320 KOREA SELATAN 0007421 FILIPINA 0002222 MALAYSIA 0001523 HONGKONG 0000824 JERMAN 00001
Total 100
STRENGTH OF INSTITUTIONS INVESTOR
38
Awards amp Achievements
The Most Trusted Banking in
Microfinance Services of The
Year 2015
Very Good Predicate for 2014
Financial Performance
Infobank Awards 2015
Bank Jatim Regional Banks with
excellent service of the year
2016
Excellence in Building and
Managing Corporate Image
Corporate Image Award 2015
The 1st Champion of Indonesia
Original Brand 2015
Top BPD HRampIT Management
2016
39
Investor Relations (IR)
Corporate Secretary
(031) 5310090 ext 469
Email irubankjatimcoid
Contact
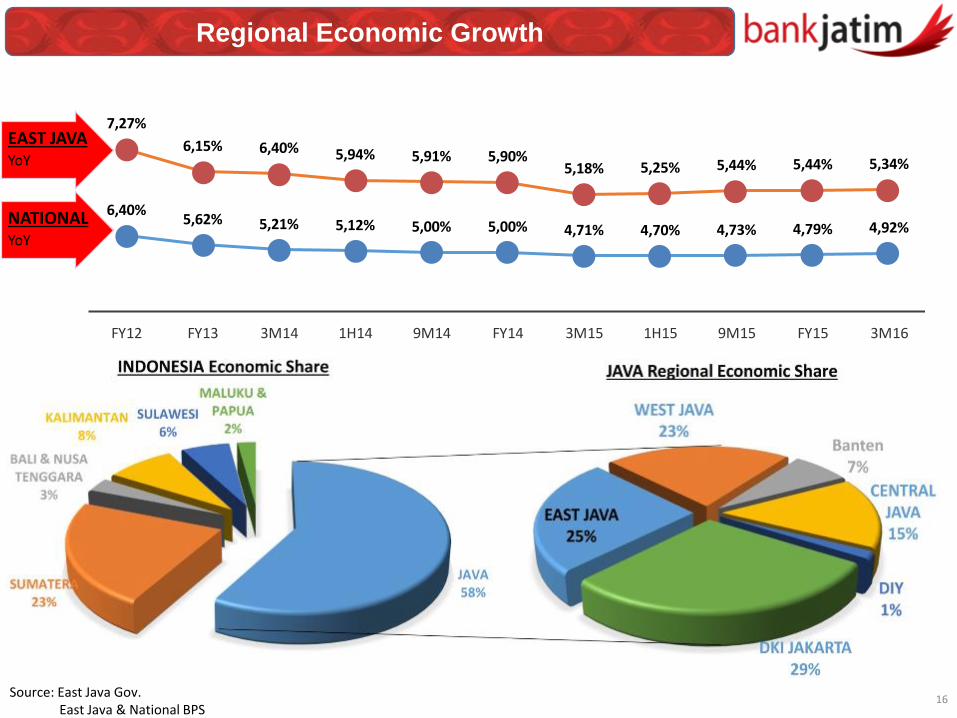

17
FINANCIAL HIGHLIGHTS
18
Balance Sheet
InformationIn million Rp
7M15 7M16 YoY
Total Asset 49222516 50786968 318
Placement BI amp SBI 14108042 11775816 -1653
Loan 28654214 29290730 222
Allowance for Impairment Losses (937449) (1203961) 2843
Third Party Fund 41644181 42537452 215
- Current Account 17698264 17926232 129
- Saving Account 10629904 12087219 1371
- Time Deposit 13316012 12524002 -595
Equity 5922719 6266316 580
19
Profit amp Loss
InformationIn million Rp
7M15 7M16 YoY
Interest Income 2636359 2792540 592
Interest Expense (822491) (823520) 013
Nett Interest Income 1813868 1969020 855
Non Interest Operational Income 274986 257429 -638
Non Interest Operational Expense (1394811) (1058368) -2412
Provision for Impairment Losses (428576) (323833) -2444
Nett Non Interest Operational Income (Expense)
(1119825) (1124772) 044
Operational Profit 694043 844248 2164
Non Operational Profit 41924 4298 -8975
Pre Tax Profit 735967 848546 1530
Taxes (223001) (236231) 593
Net profit 512966 612315 1937
142 157 163 174200
249291
331
380
525 508
46 55 74
101
131
161 186
223
262
287 293
120 132 137 145162
201222
260
303
446425
04 0405 05
09 09
0708
094
118
06106
07 07 07 0708
0908
12
134
082
17 172 21
27 28 2933
41
46
279
TOTAL ASSET (Rp Tril)
INTEREST INCOME (Rp Tril) INTEREST EXPENSE (Rp Tril)
CAGR =
1261
CAGR =
1142
CAGR =
1256
NET PROFIT (Rp Tril)
THIRD PARTY FUND(Rp Tril)
CAGR =
1533
LOAN (Rp Tril)
CAGR =
2153
CAGR =
1524
20
Financial Performance
R
O
A
R
O
E
N
I
M
Financial Ratio
23
261
414 407
355394
375
558
497
334
382352
267
380
318296
2004 2005 2006 2007 2008 2009 2010 2011 2012 2013 2014 2015 3M16 1H16 7M16
3054
36903848
308531482859
4057
3365
1896190418981611
23492087
1941
2004 2005 2006 2007 2008 2009 2010 2011 2012 2013 2014 2015 3M16 1H16 7M16
910 939 934
728
835766
917
795
648714 690
641683 669 665
2004 2005 2006 2007 2008 2009 2010 2011 2012 2013 2014 2015 3M16 1H16 7M16
L
D
R
C
A
R
B
O
P
O
22
Financial Ratio
4545 4513
38754211
5404
6967
8070 80118355 8498 8654
8292
68117264
6886
2004 2005 2006 2007 2008 2009 2010 2011 2012 2013 2014 2015 3M16 1H16 7M16
15291817
3845
3339
2536
21321919
1653
26562372
2217 21221946 2065 2047
2004 2005 2006 2007 2008 2009 2010 2011 2012 2013 2014 2015 3M16 1H16 7M16
7467 73836943 6820 6742 6604
5958 6002
6869 7028 6963
7611
6532
70567232
2004 2005 2006 2007 2008 2009 2010 2011 2012 2013 2014 2015 3M16 1H16 7M16
23
OVERVIEW amp INVESTMENT HIGHLIGHTS
24
Current AccountYoY 129
Saving AccountYoY 1371
Time DepositYoY (595)
Third Party Fund
9662
12083
9969
16563
11649
18292
20116
17698
13494
21037
15345
17926
81747064
9970
8082
10991
9172 9128
10630
12753
1098712379 12087
4374
8269
6048
10834
7630
10509
13437 13316
8016
9482
12578 12524
FY12 1H13 FY13 1H14 FY14 3M15 1H15 7M15 FY15 3M16 1H16 7M16
Current Account
Saving Account
Time Deposit
In Billion Rp
In Billion Rp
Government Current
Acc
YoY (1752)
Private Current Acc
YoY 20528
YoY
SIMPEDA 1091
SIKLUS 4390
Hajj Saving 289
TabunganKu 2476
Barokah Saving 3115
Time Deposit
YoY (595)
25
Detailed Third Party Fund
13821 11959 7220 14710 15803 16204 17985
5718 16715
10411 13365
2742 3491 4429
3582 4313 1494 1596
7776
4322 4933
4561
1H14 9M14 FY14 3M15 1H15 7M15 9M15 FY15 3M16 1H16 7M16
Current Account
Government Private
241 290 657 418 535 560 581 861 674 752 806 179 194 208 218 199 204 215 224 230 208 210
6946 7682
9239 7705 7543
8977 8535
10561 9046
10330 9957
651 687
795
748 762
797 814
994
925
980 994
65 70
93
83 87
92 94
112
112
110 120
1H14 9M14 FY14 3M15 1H15 7M15 9M15 FY15 3M16 1H16 7M16
Saving Account
SIKLUS Hajj Saving SIMPEDA TabunganKu Barokah Saving
10834 11331 7630 10509 13437 13316 13934 8016 9482 12578 12524
1H14 9M14 FY14 3M15 1H15 7M15 9M15 FY15 3M16 1H16 7M16
Time Deposit
26
Third Party Fund Customer
In million Rp
FY12 3M13 1H13 9M13 FY13 3M14 1H14 9M14 FY14 3M15 1H15 9M15 FY15 1H16 7M16
44
13
7
43
63
4
44
25
4
45
33
4
46
85
3
47
01
4
48
35
8
49
41
1
50
13
4
50
92
7
53
65
8
54
36
9
51
36
1
53
33
7
53
49
3
20
45
785
21
00
510
21
44
912
25
11
507
41
26
826
41
61
277
41
99
590
42
55
204
43
33
820
44
03
899
44
62
107
45
43
12
9
46
26
910
48
21
838
48
39
565
23
61
6
24
42
5
24
53
8
25
27
4
26
17
6
25
27
7
27
20
9
28
17
3
29
19
4
30
72
8
30
78
8
32
69
2
34
16
7
35
87
2
36
77
2
Total Customer
Current Account Saving Account Time Deposit
21831
27733 27304 27883
21277 24866
34252 31270
23236
35918 37489 36015
26273 28769
33511
399 322 329 303 242 199 192 210 254 208 205 225 276 257 250
18521 27761
33698 33250
23107
32546
39819 40218
26134
34200
43644 42621
23462
35063 34059
FY12 3M13 1H13 9M13 FY13 3M14 1H14 9M14 FY14 3M15 1H15 9M15 FY15 1H16 7M16
Ticket Size
Current Account Saving Account Time Deposit
27
Competitive Product
CONSUMER
COMMERCIAL
SME
CONSUMER LOAN Julyrsquo15 Julyrsquo16
Multipurpose 5447 5597
Mortgage 481 514
Others 236 301
Total 6164 6411
COMMERCIAL LOAN Julyrsquo15 Julyrsquo16
Standby Loan 374 224
Keppres 370 354
Overdraft 963 986
Syndicate 458 452
Total 2165 2015
Small Medium Ent Julyrsquo15 Julyrsquo16
KUR 241 082
Pundi Kencana 392 428
Jatim Mikro 160 188
Others 879 877
Total 1671 1574
28
Loan Proportion
In Billion Rp
YoY
Consumer
632
Commercial
(489)
SME
(369)
29
Type Of Loan
15599 16224 16711 17064 17575 17663 17939 18186 18427 18875 18779
5019 5624 5180 5054
6024 6204 6586 5697 5334 5789 5901
4203 4239 4304 4450 4689 4787 4710 4528 4507 4612 4611
1H14 9M14 FY14 3M15 1H15 7M15 9M15 FY15 3M16 1H16 7M16
Consumer Commercial SME
In Billion Rp
YoY
Multi
purpose
503
Mortgage
919
Others
3012
30
Type Of Loan
13864 14408
14849 15152 15609 15608 15794 15924 16117
16499 16394
1177 1233 1299 1340 1369 1379 1399 1434 1465 1502 1505
559 583 563 572 597 677 746 827 845 875 880
1H14 9M14 FY14 3M15 1H15 7M15 9M15 FY15 3M16 1H16 7M16
CONSUMER LOAN
Multipurpose Mortgage Others
In Billion Rp
YoY
Standby
Loan
(3877)
Keppres
(235)
Overdraft
462
Syndicate
071
31
Type Of Loan1
0
75
12
86
10
13
81
2
10
23
10
71
12
44
84
7
59
4
65
6
65
6
82
4 11
57
68
7
44
9
97
8
10
60
13
37
74
8
55
9
96
4
10
35
22
17
22
59
23
08
25
75
27
41
27
59
26
92
27
66
28
22
28
67
28
87
90
3
92
2
11
71
12
18
12
81
13
14
13
14
13
36
13
60
13
01
13
23
1H14 9M14 FY14 3M15 1H15 7M15 9M15 FY15 3M16 1H16 7M16
Commercial Loan
Standby Loan Keppres Overdraft Syndicate
In Billion Rp
YoY
KUR
(6532)
Pundi
Kencana
1163
Mikro
2031
Others
200
32
Type Of Loan1218
1128
1058
893
735
689
601
451
347
258
239
693
747
796
950
1108
1123
1157
1178
1223
1273
1254
78
165
264
345
452
457
491
520
530
557
550
2214
2199
2186
2262
2395
2517
2461
2380
2407
2523
2568
1H14 9M14 FY14 3M15 1H15 7M15 9M15 FY15 3M16 1H16 7M16
SME Loan
KUR Pundi Kencana Mikro Others
33
Type Of Loan
26
22
93
26
06
47
25
96
58
26
17
30
26
36
14
26
39
07
25
45
01
25
34
43
25
37
33
25
35
85
85
98
96
44
87
30
71
94
96
70
11
5
82
83
64
64
02
91
60
94
88
45
9
51
43
9
86
42
7
49
43
2
81
45
2
44
44
1
49
41
6
35
41
8
61
42
3
00
42
2
37
1H14 9M14 FY14 3M15 1H15 9M15 FY15 3M16 1H16 7M16
Total Customer
Consumer Commercial SME
5947 6225 6436 652 6667 6797 7146 7271 7439 7406
58231 58311 5933
702662292
56868
68119
83319
63196 62194
9147 9637 10069 1028 10366 10669 10877 10767 10903 10916
1H14 9M14 FY14 3M15 1H15 9M15 FY15 3M16 1H16 7M16
Ticket Size
Consumer Commercial SME
34
STRENGTH
35
Strength Of Funding
517
460 477426
403435
463 480431 407 435
384 385 394 421
246
254 288
362358
241
250284 359
354368
384 363 372284
237 285 235212
239 237287
237 210 239197
232 252 234294
2002 2003 2004 2005 2006 2007 2008 2009 2010 2011 2012 2013 2014 2015 7M16
Time deposit Saving deposit Current account
448 453
300 253 302 318 321261
316 354 348268 301
368256 301 284 283
492 500
275239
310 328 331
258326
381 371
267345
395
250277 297 296
3M12 1H12 9M12 FY12 3M13 1H13 9M13 FY13 3M14 1H14 9M14 FY14 3M15 1H15 FY15 3M16 1H16 7M16
Cost of Fund(+) Local Government (-) Local Government
Description Details
Civil Servants (per December 2014) 426545
Multipurpose Customer (Civil Servants) 238965
5602
NPL 039 as of Julyrsquo 2016
36
Strength of Loan (Multipurpose Loan)
567 593 612 619 631 640
666 675 690 686
1H14 9M14 FY14 3M15 1H15 9M15 FY15 3M16 1H16 7M16
Multiguna Ticket Size (million) Rp
13864
14408
14849
15152
1560915794
1592416117
1649916394
1H14 9M14 FY14 3M15 1H15 9M15 FY15 3M16 1H16 7M16
Multiguna Loan Balance
( Billion Rp )
Foreign Institution Investor
7260 from public shares
Foreign Institution Investor
6581 from public shares
Public shares 20
from paid capital Domestic Investor
3419 from public shares
Domestic Investor
2740 from public shares
37
No Country Share
1 INDONESIA 3419402 LUKSEMBURG 161267
3 AMERIKA 1341304 NORWEGIA 1111345 SIPRUS 838626 FINLANDIA 577797 VIRGIN ISLAND 41059
8 INGGRIS 223339 IRLANDIA 17073
10 AUSTRALIA 0964611 JEPANG 0839812 KANADA 05512
No Country Share
14 SWEDIA 0248915 SINGAPURA 0201816 CAYMAN ISLAND 0060317 GREENLAND 0033118 CINA 0019319 SWITSERLAND 0011320 KOREA SELATAN 0007421 FILIPINA 0002222 MALAYSIA 0001523 HONGKONG 0000824 JERMAN 00001
Total 100
STRENGTH OF INSTITUTIONS INVESTOR
38
Awards amp Achievements
The Most Trusted Banking in
Microfinance Services of The
Year 2015
Very Good Predicate for 2014
Financial Performance
Infobank Awards 2015
Bank Jatim Regional Banks with
excellent service of the year
2016
Excellence in Building and
Managing Corporate Image
Corporate Image Award 2015
The 1st Champion of Indonesia
Original Brand 2015
Top BPD HRampIT Management
2016
39
Investor Relations (IR)
Corporate Secretary
(031) 5310090 ext 469
Email irubankjatimcoid
Contact

18
Balance Sheet
InformationIn million Rp
7M15 7M16 YoY
Total Asset 49222516 50786968 318
Placement BI amp SBI 14108042 11775816 -1653
Loan 28654214 29290730 222
Allowance for Impairment Losses (937449) (1203961) 2843
Third Party Fund 41644181 42537452 215
- Current Account 17698264 17926232 129
- Saving Account 10629904 12087219 1371
- Time Deposit 13316012 12524002 -595
Equity 5922719 6266316 580
19
Profit amp Loss
InformationIn million Rp
7M15 7M16 YoY
Interest Income 2636359 2792540 592
Interest Expense (822491) (823520) 013
Nett Interest Income 1813868 1969020 855
Non Interest Operational Income 274986 257429 -638
Non Interest Operational Expense (1394811) (1058368) -2412
Provision for Impairment Losses (428576) (323833) -2444
Nett Non Interest Operational Income (Expense)
(1119825) (1124772) 044
Operational Profit 694043 844248 2164
Non Operational Profit 41924 4298 -8975
Pre Tax Profit 735967 848546 1530
Taxes (223001) (236231) 593
Net profit 512966 612315 1937
142 157 163 174200
249291
331
380
525 508
46 55 74
101
131
161 186
223
262
287 293
120 132 137 145162
201222
260
303
446425
04 0405 05
09 09
0708
094
118
06106
07 07 07 0708
0908
12
134
082
17 172 21
27 28 2933
41
46
279
TOTAL ASSET (Rp Tril)
INTEREST INCOME (Rp Tril) INTEREST EXPENSE (Rp Tril)
CAGR =
1261
CAGR =
1142
CAGR =
1256
NET PROFIT (Rp Tril)
THIRD PARTY FUND(Rp Tril)
CAGR =
1533
LOAN (Rp Tril)
CAGR =
2153
CAGR =
1524
20
Financial Performance
R
O
A
R
O
E
N
I
M
Financial Ratio
23
261
414 407
355394
375
558
497
334
382352
267
380
318296
2004 2005 2006 2007 2008 2009 2010 2011 2012 2013 2014 2015 3M16 1H16 7M16
3054
36903848
308531482859
4057
3365
1896190418981611
23492087
1941
2004 2005 2006 2007 2008 2009 2010 2011 2012 2013 2014 2015 3M16 1H16 7M16
910 939 934
728
835766
917
795
648714 690
641683 669 665
2004 2005 2006 2007 2008 2009 2010 2011 2012 2013 2014 2015 3M16 1H16 7M16
L
D
R
C
A
R
B
O
P
O
22
Financial Ratio
4545 4513
38754211
5404
6967
8070 80118355 8498 8654
8292
68117264
6886
2004 2005 2006 2007 2008 2009 2010 2011 2012 2013 2014 2015 3M16 1H16 7M16
15291817
3845
3339
2536
21321919
1653
26562372
2217 21221946 2065 2047
2004 2005 2006 2007 2008 2009 2010 2011 2012 2013 2014 2015 3M16 1H16 7M16
7467 73836943 6820 6742 6604
5958 6002
6869 7028 6963
7611
6532
70567232
2004 2005 2006 2007 2008 2009 2010 2011 2012 2013 2014 2015 3M16 1H16 7M16
23
OVERVIEW amp INVESTMENT HIGHLIGHTS
24
Current AccountYoY 129
Saving AccountYoY 1371
Time DepositYoY (595)
Third Party Fund
9662
12083
9969
16563
11649
18292
20116
17698
13494
21037
15345
17926
81747064
9970
8082
10991
9172 9128
10630
12753
1098712379 12087
4374
8269
6048
10834
7630
10509
13437 13316
8016
9482
12578 12524
FY12 1H13 FY13 1H14 FY14 3M15 1H15 7M15 FY15 3M16 1H16 7M16
Current Account
Saving Account
Time Deposit
In Billion Rp
In Billion Rp
Government Current
Acc
YoY (1752)
Private Current Acc
YoY 20528
YoY
SIMPEDA 1091
SIKLUS 4390
Hajj Saving 289
TabunganKu 2476
Barokah Saving 3115
Time Deposit
YoY (595)
25
Detailed Third Party Fund
13821 11959 7220 14710 15803 16204 17985
5718 16715
10411 13365
2742 3491 4429
3582 4313 1494 1596
7776
4322 4933
4561
1H14 9M14 FY14 3M15 1H15 7M15 9M15 FY15 3M16 1H16 7M16
Current Account
Government Private
241 290 657 418 535 560 581 861 674 752 806 179 194 208 218 199 204 215 224 230 208 210
6946 7682
9239 7705 7543
8977 8535
10561 9046
10330 9957
651 687
795
748 762
797 814
994
925
980 994
65 70
93
83 87
92 94
112
112
110 120
1H14 9M14 FY14 3M15 1H15 7M15 9M15 FY15 3M16 1H16 7M16
Saving Account
SIKLUS Hajj Saving SIMPEDA TabunganKu Barokah Saving
10834 11331 7630 10509 13437 13316 13934 8016 9482 12578 12524
1H14 9M14 FY14 3M15 1H15 7M15 9M15 FY15 3M16 1H16 7M16
Time Deposit
26
Third Party Fund Customer
In million Rp
FY12 3M13 1H13 9M13 FY13 3M14 1H14 9M14 FY14 3M15 1H15 9M15 FY15 1H16 7M16
44
13
7
43
63
4
44
25
4
45
33
4
46
85
3
47
01
4
48
35
8
49
41
1
50
13
4
50
92
7
53
65
8
54
36
9
51
36
1
53
33
7
53
49
3
20
45
785
21
00
510
21
44
912
25
11
507
41
26
826
41
61
277
41
99
590
42
55
204
43
33
820
44
03
899
44
62
107
45
43
12
9
46
26
910
48
21
838
48
39
565
23
61
6
24
42
5
24
53
8
25
27
4
26
17
6
25
27
7
27
20
9
28
17
3
29
19
4
30
72
8
30
78
8
32
69
2
34
16
7
35
87
2
36
77
2
Total Customer
Current Account Saving Account Time Deposit
21831
27733 27304 27883
21277 24866
34252 31270
23236
35918 37489 36015
26273 28769
33511
399 322 329 303 242 199 192 210 254 208 205 225 276 257 250
18521 27761
33698 33250
23107
32546
39819 40218
26134
34200
43644 42621
23462
35063 34059
FY12 3M13 1H13 9M13 FY13 3M14 1H14 9M14 FY14 3M15 1H15 9M15 FY15 1H16 7M16
Ticket Size
Current Account Saving Account Time Deposit
27
Competitive Product
CONSUMER
COMMERCIAL
SME
CONSUMER LOAN Julyrsquo15 Julyrsquo16
Multipurpose 5447 5597
Mortgage 481 514
Others 236 301
Total 6164 6411
COMMERCIAL LOAN Julyrsquo15 Julyrsquo16
Standby Loan 374 224
Keppres 370 354
Overdraft 963 986
Syndicate 458 452
Total 2165 2015
Small Medium Ent Julyrsquo15 Julyrsquo16
KUR 241 082
Pundi Kencana 392 428
Jatim Mikro 160 188
Others 879 877
Total 1671 1574
28
Loan Proportion
In Billion Rp
YoY
Consumer
632
Commercial
(489)
SME
(369)
29
Type Of Loan
15599 16224 16711 17064 17575 17663 17939 18186 18427 18875 18779
5019 5624 5180 5054
6024 6204 6586 5697 5334 5789 5901
4203 4239 4304 4450 4689 4787 4710 4528 4507 4612 4611
1H14 9M14 FY14 3M15 1H15 7M15 9M15 FY15 3M16 1H16 7M16
Consumer Commercial SME
In Billion Rp
YoY
Multi
purpose
503
Mortgage
919
Others
3012
30
Type Of Loan
13864 14408
14849 15152 15609 15608 15794 15924 16117
16499 16394
1177 1233 1299 1340 1369 1379 1399 1434 1465 1502 1505
559 583 563 572 597 677 746 827 845 875 880
1H14 9M14 FY14 3M15 1H15 7M15 9M15 FY15 3M16 1H16 7M16
CONSUMER LOAN
Multipurpose Mortgage Others
In Billion Rp
YoY
Standby
Loan
(3877)
Keppres
(235)
Overdraft
462
Syndicate
071
31
Type Of Loan1
0
75
12
86
10
13
81
2
10
23
10
71
12
44
84
7
59
4
65
6
65
6
82
4 11
57
68
7
44
9
97
8
10
60
13
37
74
8
55
9
96
4
10
35
22
17
22
59
23
08
25
75
27
41
27
59
26
92
27
66
28
22
28
67
28
87
90
3
92
2
11
71
12
18
12
81
13
14
13
14
13
36
13
60
13
01
13
23
1H14 9M14 FY14 3M15 1H15 7M15 9M15 FY15 3M16 1H16 7M16
Commercial Loan
Standby Loan Keppres Overdraft Syndicate
In Billion Rp
YoY
KUR
(6532)
Pundi
Kencana
1163
Mikro
2031
Others
200
32
Type Of Loan1218
1128
1058
893
735
689
601
451
347
258
239
693
747
796
950
1108
1123
1157
1178
1223
1273
1254
78
165
264
345
452
457
491
520
530
557
550
2214
2199
2186
2262
2395
2517
2461
2380
2407
2523
2568
1H14 9M14 FY14 3M15 1H15 7M15 9M15 FY15 3M16 1H16 7M16
SME Loan
KUR Pundi Kencana Mikro Others
33
Type Of Loan
26
22
93
26
06
47
25
96
58
26
17
30
26
36
14
26
39
07
25
45
01
25
34
43
25
37
33
25
35
85
85
98
96
44
87
30
71
94
96
70
11
5
82
83
64
64
02
91
60
94
88
45
9
51
43
9
86
42
7
49
43
2
81
45
2
44
44
1
49
41
6
35
41
8
61
42
3
00
42
2
37
1H14 9M14 FY14 3M15 1H15 9M15 FY15 3M16 1H16 7M16
Total Customer
Consumer Commercial SME
5947 6225 6436 652 6667 6797 7146 7271 7439 7406
58231 58311 5933
702662292
56868
68119
83319
63196 62194
9147 9637 10069 1028 10366 10669 10877 10767 10903 10916
1H14 9M14 FY14 3M15 1H15 9M15 FY15 3M16 1H16 7M16
Ticket Size
Consumer Commercial SME
34
STRENGTH
35
Strength Of Funding
517
460 477426
403435
463 480431 407 435
384 385 394 421
246
254 288
362358
241
250284 359
354368
384 363 372284
237 285 235212
239 237287
237 210 239197
232 252 234294
2002 2003 2004 2005 2006 2007 2008 2009 2010 2011 2012 2013 2014 2015 7M16
Time deposit Saving deposit Current account
448 453
300 253 302 318 321261
316 354 348268 301
368256 301 284 283
492 500
275239
310 328 331
258326
381 371
267345
395
250277 297 296
3M12 1H12 9M12 FY12 3M13 1H13 9M13 FY13 3M14 1H14 9M14 FY14 3M15 1H15 FY15 3M16 1H16 7M16
Cost of Fund(+) Local Government (-) Local Government
Description Details
Civil Servants (per December 2014) 426545
Multipurpose Customer (Civil Servants) 238965
5602
NPL 039 as of Julyrsquo 2016
36
Strength of Loan (Multipurpose Loan)
567 593 612 619 631 640
666 675 690 686
1H14 9M14 FY14 3M15 1H15 9M15 FY15 3M16 1H16 7M16
Multiguna Ticket Size (million) Rp
13864
14408
14849
15152
1560915794
1592416117
1649916394
1H14 9M14 FY14 3M15 1H15 9M15 FY15 3M16 1H16 7M16
Multiguna Loan Balance
( Billion Rp )
Foreign Institution Investor
7260 from public shares
Foreign Institution Investor
6581 from public shares
Public shares 20
from paid capital Domestic Investor
3419 from public shares
Domestic Investor
2740 from public shares
37
No Country Share
1 INDONESIA 3419402 LUKSEMBURG 161267
3 AMERIKA 1341304 NORWEGIA 1111345 SIPRUS 838626 FINLANDIA 577797 VIRGIN ISLAND 41059
8 INGGRIS 223339 IRLANDIA 17073
10 AUSTRALIA 0964611 JEPANG 0839812 KANADA 05512
No Country Share
14 SWEDIA 0248915 SINGAPURA 0201816 CAYMAN ISLAND 0060317 GREENLAND 0033118 CINA 0019319 SWITSERLAND 0011320 KOREA SELATAN 0007421 FILIPINA 0002222 MALAYSIA 0001523 HONGKONG 0000824 JERMAN 00001
Total 100
STRENGTH OF INSTITUTIONS INVESTOR
38
Awards amp Achievements
The Most Trusted Banking in
Microfinance Services of The
Year 2015
Very Good Predicate for 2014
Financial Performance
Infobank Awards 2015
Bank Jatim Regional Banks with
excellent service of the year
2016
Excellence in Building and
Managing Corporate Image
Corporate Image Award 2015
The 1st Champion of Indonesia
Original Brand 2015
Top BPD HRampIT Management
2016
39
Investor Relations (IR)
Corporate Secretary
(031) 5310090 ext 469
Email irubankjatimcoid
Contact

19
Profit amp Loss
InformationIn million Rp
7M15 7M16 YoY
Interest Income 2636359 2792540 592
Interest Expense (822491) (823520) 013
Nett Interest Income 1813868 1969020 855
Non Interest Operational Income 274986 257429 -638
Non Interest Operational Expense (1394811) (1058368) -2412
Provision for Impairment Losses (428576) (323833) -2444
Nett Non Interest Operational Income (Expense)
(1119825) (1124772) 044
Operational Profit 694043 844248 2164
Non Operational Profit 41924 4298 -8975
Pre Tax Profit 735967 848546 1530
Taxes (223001) (236231) 593
Net profit 512966 612315 1937
142 157 163 174200
249291
331
380
525 508
46 55 74
101
131
161 186
223
262
287 293
120 132 137 145162
201222
260
303
446425
04 0405 05
09 09
0708
094
118
06106
07 07 07 0708
0908
12
134
082
17 172 21
27 28 2933
41
46
279
TOTAL ASSET (Rp Tril)
INTEREST INCOME (Rp Tril) INTEREST EXPENSE (Rp Tril)
CAGR =
1261
CAGR =
1142
CAGR =
1256
NET PROFIT (Rp Tril)
THIRD PARTY FUND(Rp Tril)
CAGR =
1533
LOAN (Rp Tril)
CAGR =
2153
CAGR =
1524
20
Financial Performance
R
O
A
R
O
E
N
I
M
Financial Ratio
23
261
414 407
355394
375
558
497
334
382352
267
380
318296
2004 2005 2006 2007 2008 2009 2010 2011 2012 2013 2014 2015 3M16 1H16 7M16
3054
36903848
308531482859
4057
3365
1896190418981611
23492087
1941
2004 2005 2006 2007 2008 2009 2010 2011 2012 2013 2014 2015 3M16 1H16 7M16
910 939 934
728
835766
917
795
648714 690
641683 669 665
2004 2005 2006 2007 2008 2009 2010 2011 2012 2013 2014 2015 3M16 1H16 7M16
L
D
R
C
A
R
B
O
P
O
22
Financial Ratio
4545 4513
38754211
5404
6967
8070 80118355 8498 8654
8292
68117264
6886
2004 2005 2006 2007 2008 2009 2010 2011 2012 2013 2014 2015 3M16 1H16 7M16
15291817
3845
3339
2536
21321919
1653
26562372
2217 21221946 2065 2047
2004 2005 2006 2007 2008 2009 2010 2011 2012 2013 2014 2015 3M16 1H16 7M16
7467 73836943 6820 6742 6604
5958 6002
6869 7028 6963
7611
6532
70567232
2004 2005 2006 2007 2008 2009 2010 2011 2012 2013 2014 2015 3M16 1H16 7M16
23
OVERVIEW amp INVESTMENT HIGHLIGHTS
24
Current AccountYoY 129
Saving AccountYoY 1371
Time DepositYoY (595)
Third Party Fund
9662
12083
9969
16563
11649
18292
20116
17698
13494
21037
15345
17926
81747064
9970
8082
10991
9172 9128
10630
12753
1098712379 12087
4374
8269
6048
10834
7630
10509
13437 13316
8016
9482
12578 12524
FY12 1H13 FY13 1H14 FY14 3M15 1H15 7M15 FY15 3M16 1H16 7M16
Current Account
Saving Account
Time Deposit
In Billion Rp
In Billion Rp
Government Current
Acc
YoY (1752)
Private Current Acc
YoY 20528
YoY
SIMPEDA 1091
SIKLUS 4390
Hajj Saving 289
TabunganKu 2476
Barokah Saving 3115
Time Deposit
YoY (595)
25
Detailed Third Party Fund
13821 11959 7220 14710 15803 16204 17985
5718 16715
10411 13365
2742 3491 4429
3582 4313 1494 1596
7776
4322 4933
4561
1H14 9M14 FY14 3M15 1H15 7M15 9M15 FY15 3M16 1H16 7M16
Current Account
Government Private
241 290 657 418 535 560 581 861 674 752 806 179 194 208 218 199 204 215 224 230 208 210
6946 7682
9239 7705 7543
8977 8535
10561 9046
10330 9957
651 687
795
748 762
797 814
994
925
980 994
65 70
93
83 87
92 94
112
112
110 120
1H14 9M14 FY14 3M15 1H15 7M15 9M15 FY15 3M16 1H16 7M16
Saving Account
SIKLUS Hajj Saving SIMPEDA TabunganKu Barokah Saving
10834 11331 7630 10509 13437 13316 13934 8016 9482 12578 12524
1H14 9M14 FY14 3M15 1H15 7M15 9M15 FY15 3M16 1H16 7M16
Time Deposit
26
Third Party Fund Customer
In million Rp
FY12 3M13 1H13 9M13 FY13 3M14 1H14 9M14 FY14 3M15 1H15 9M15 FY15 1H16 7M16
44
13
7
43
63
4
44
25
4
45
33
4
46
85
3
47
01
4
48
35
8
49
41
1
50
13
4
50
92
7
53
65
8
54
36
9
51
36
1
53
33
7
53
49
3
20
45
785
21
00
510
21
44
912
25
11
507
41
26
826
41
61
277
41
99
590
42
55
204
43
33
820
44
03
899
44
62
107
45
43
12
9
46
26
910
48
21
838
48
39
565
23
61
6
24
42
5
24
53
8
25
27
4
26
17
6
25
27
7
27
20
9
28
17
3
29
19
4
30
72
8
30
78
8
32
69
2
34
16
7
35
87
2
36
77
2
Total Customer
Current Account Saving Account Time Deposit
21831
27733 27304 27883
21277 24866
34252 31270
23236
35918 37489 36015
26273 28769
33511
399 322 329 303 242 199 192 210 254 208 205 225 276 257 250
18521 27761
33698 33250
23107
32546
39819 40218
26134
34200
43644 42621
23462
35063 34059
FY12 3M13 1H13 9M13 FY13 3M14 1H14 9M14 FY14 3M15 1H15 9M15 FY15 1H16 7M16
Ticket Size
Current Account Saving Account Time Deposit
27
Competitive Product
CONSUMER
COMMERCIAL
SME
CONSUMER LOAN Julyrsquo15 Julyrsquo16
Multipurpose 5447 5597
Mortgage 481 514
Others 236 301
Total 6164 6411
COMMERCIAL LOAN Julyrsquo15 Julyrsquo16
Standby Loan 374 224
Keppres 370 354
Overdraft 963 986
Syndicate 458 452
Total 2165 2015
Small Medium Ent Julyrsquo15 Julyrsquo16
KUR 241 082
Pundi Kencana 392 428
Jatim Mikro 160 188
Others 879 877
Total 1671 1574
28
Loan Proportion
In Billion Rp
YoY
Consumer
632
Commercial
(489)
SME
(369)
29
Type Of Loan
15599 16224 16711 17064 17575 17663 17939 18186 18427 18875 18779
5019 5624 5180 5054
6024 6204 6586 5697 5334 5789 5901
4203 4239 4304 4450 4689 4787 4710 4528 4507 4612 4611
1H14 9M14 FY14 3M15 1H15 7M15 9M15 FY15 3M16 1H16 7M16
Consumer Commercial SME
In Billion Rp
YoY
Multi
purpose
503
Mortgage
919
Others
3012
30
Type Of Loan
13864 14408
14849 15152 15609 15608 15794 15924 16117
16499 16394
1177 1233 1299 1340 1369 1379 1399 1434 1465 1502 1505
559 583 563 572 597 677 746 827 845 875 880
1H14 9M14 FY14 3M15 1H15 7M15 9M15 FY15 3M16 1H16 7M16
CONSUMER LOAN
Multipurpose Mortgage Others
In Billion Rp
YoY
Standby
Loan
(3877)
Keppres
(235)
Overdraft
462
Syndicate
071
31
Type Of Loan1
0
75
12
86
10
13
81
2
10
23
10
71
12
44
84
7
59
4
65
6
65
6
82
4 11
57
68
7
44
9
97
8
10
60
13
37
74
8
55
9
96
4
10
35
22
17
22
59
23
08
25
75
27
41
27
59
26
92
27
66
28
22
28
67
28
87
90
3
92
2
11
71
12
18
12
81
13
14
13
14
13
36
13
60
13
01
13
23
1H14 9M14 FY14 3M15 1H15 7M15 9M15 FY15 3M16 1H16 7M16
Commercial Loan
Standby Loan Keppres Overdraft Syndicate
In Billion Rp
YoY
KUR
(6532)
Pundi
Kencana
1163
Mikro
2031
Others
200
32
Type Of Loan1218
1128
1058
893
735
689
601
451
347
258
239
693
747
796
950
1108
1123
1157
1178
1223
1273
1254
78
165
264
345
452
457
491
520
530
557
550
2214
2199
2186
2262
2395
2517
2461
2380
2407
2523
2568
1H14 9M14 FY14 3M15 1H15 7M15 9M15 FY15 3M16 1H16 7M16
SME Loan
KUR Pundi Kencana Mikro Others
33
Type Of Loan
26
22
93
26
06
47
25
96
58
26
17
30
26
36
14
26
39
07
25
45
01
25
34
43
25
37
33
25
35
85
85
98
96
44
87
30
71
94
96
70
11
5
82
83
64
64
02
91
60
94
88
45
9
51
43
9
86
42
7
49
43
2
81
45
2
44
44
1
49
41
6
35
41
8
61
42
3
00
42
2
37
1H14 9M14 FY14 3M15 1H15 9M15 FY15 3M16 1H16 7M16
Total Customer
Consumer Commercial SME
5947 6225 6436 652 6667 6797 7146 7271 7439 7406
58231 58311 5933
702662292
56868
68119
83319
63196 62194
9147 9637 10069 1028 10366 10669 10877 10767 10903 10916
1H14 9M14 FY14 3M15 1H15 9M15 FY15 3M16 1H16 7M16
Ticket Size
Consumer Commercial SME
34
STRENGTH
35
Strength Of Funding
517
460 477426
403435
463 480431 407 435
384 385 394 421
246
254 288
362358
241
250284 359
354368
384 363 372284
237 285 235212
239 237287
237 210 239197
232 252 234294
2002 2003 2004 2005 2006 2007 2008 2009 2010 2011 2012 2013 2014 2015 7M16
Time deposit Saving deposit Current account
448 453
300 253 302 318 321261
316 354 348268 301
368256 301 284 283
492 500
275239
310 328 331
258326
381 371
267345
395
250277 297 296
3M12 1H12 9M12 FY12 3M13 1H13 9M13 FY13 3M14 1H14 9M14 FY14 3M15 1H15 FY15 3M16 1H16 7M16
Cost of Fund(+) Local Government (-) Local Government
Description Details
Civil Servants (per December 2014) 426545
Multipurpose Customer (Civil Servants) 238965
5602
NPL 039 as of Julyrsquo 2016
36
Strength of Loan (Multipurpose Loan)
567 593 612 619 631 640
666 675 690 686
1H14 9M14 FY14 3M15 1H15 9M15 FY15 3M16 1H16 7M16
Multiguna Ticket Size (million) Rp
13864
14408
14849
15152
1560915794
1592416117
1649916394
1H14 9M14 FY14 3M15 1H15 9M15 FY15 3M16 1H16 7M16
Multiguna Loan Balance
( Billion Rp )
Foreign Institution Investor
7260 from public shares
Foreign Institution Investor
6581 from public shares
Public shares 20
from paid capital Domestic Investor
3419 from public shares
Domestic Investor
2740 from public shares
37
No Country Share
1 INDONESIA 3419402 LUKSEMBURG 161267
3 AMERIKA 1341304 NORWEGIA 1111345 SIPRUS 838626 FINLANDIA 577797 VIRGIN ISLAND 41059
8 INGGRIS 223339 IRLANDIA 17073
10 AUSTRALIA 0964611 JEPANG 0839812 KANADA 05512
No Country Share
14 SWEDIA 0248915 SINGAPURA 0201816 CAYMAN ISLAND 0060317 GREENLAND 0033118 CINA 0019319 SWITSERLAND 0011320 KOREA SELATAN 0007421 FILIPINA 0002222 MALAYSIA 0001523 HONGKONG 0000824 JERMAN 00001
Total 100
STRENGTH OF INSTITUTIONS INVESTOR
38
Awards amp Achievements
The Most Trusted Banking in
Microfinance Services of The
Year 2015
Very Good Predicate for 2014
Financial Performance
Infobank Awards 2015
Bank Jatim Regional Banks with
excellent service of the year
2016
Excellence in Building and
Managing Corporate Image
Corporate Image Award 2015
The 1st Champion of Indonesia
Original Brand 2015
Top BPD HRampIT Management
2016
39
Investor Relations (IR)
Corporate Secretary
(031) 5310090 ext 469
Email irubankjatimcoid
Contact

R
O
A
R
O
E
N
I
M
Financial Ratio
23
261
414 407
355394
375
558
497
334
382352
267
380
318296
2004 2005 2006 2007 2008 2009 2010 2011 2012 2013 2014 2015 3M16 1H16 7M16
3054
36903848
308531482859
4057
3365
1896190418981611
23492087
1941
2004 2005 2006 2007 2008 2009 2010 2011 2012 2013 2014 2015 3M16 1H16 7M16
910 939 934
728
835766
917
795
648714 690
641683 669 665
2004 2005 2006 2007 2008 2009 2010 2011 2012 2013 2014 2015 3M16 1H16 7M16
L
D
R
C
A
R
B
O
P
O
22
Financial Ratio
4545 4513
38754211
5404
6967
8070 80118355 8498 8654
8292
68117264
6886
2004 2005 2006 2007 2008 2009 2010 2011 2012 2013 2014 2015 3M16 1H16 7M16
15291817
3845
3339
2536
21321919
1653
26562372
2217 21221946 2065 2047
2004 2005 2006 2007 2008 2009 2010 2011 2012 2013 2014 2015 3M16 1H16 7M16
7467 73836943 6820 6742 6604
5958 6002
6869 7028 6963
7611
6532
70567232
2004 2005 2006 2007 2008 2009 2010 2011 2012 2013 2014 2015 3M16 1H16 7M16
23
OVERVIEW amp INVESTMENT HIGHLIGHTS
24
Current AccountYoY 129
Saving AccountYoY 1371
Time DepositYoY (595)
Third Party Fund
9662
12083
9969
16563
11649
18292
20116
17698
13494
21037
15345
17926
81747064
9970
8082
10991
9172 9128
10630
12753
1098712379 12087
4374
8269
6048
10834
7630
10509
13437 13316
8016
9482
12578 12524
FY12 1H13 FY13 1H14 FY14 3M15 1H15 7M15 FY15 3M16 1H16 7M16
Current Account
Saving Account
Time Deposit
In Billion Rp
In Billion Rp
Government Current
Acc
YoY (1752)
Private Current Acc
YoY 20528
YoY
SIMPEDA 1091
SIKLUS 4390
Hajj Saving 289
TabunganKu 2476
Barokah Saving 3115
Time Deposit
YoY (595)
25
Detailed Third Party Fund
13821 11959 7220 14710 15803 16204 17985
5718 16715
10411 13365
2742 3491 4429
3582 4313 1494 1596
7776
4322 4933
4561
1H14 9M14 FY14 3M15 1H15 7M15 9M15 FY15 3M16 1H16 7M16
Current Account
Government Private
241 290 657 418 535 560 581 861 674 752 806 179 194 208 218 199 204 215 224 230 208 210
6946 7682
9239 7705 7543
8977 8535
10561 9046
10330 9957
651 687
795
748 762
797 814
994
925
980 994
65 70
93
83 87
92 94
112
112
110 120
1H14 9M14 FY14 3M15 1H15 7M15 9M15 FY15 3M16 1H16 7M16
Saving Account
SIKLUS Hajj Saving SIMPEDA TabunganKu Barokah Saving
10834 11331 7630 10509 13437 13316 13934 8016 9482 12578 12524
1H14 9M14 FY14 3M15 1H15 7M15 9M15 FY15 3M16 1H16 7M16
Time Deposit
26
Third Party Fund Customer
In million Rp
FY12 3M13 1H13 9M13 FY13 3M14 1H14 9M14 FY14 3M15 1H15 9M15 FY15 1H16 7M16
44
13
7
43
63
4
44
25
4
45
33
4
46
85
3
47
01
4
48
35
8
49
41
1
50
13
4
50
92
7
53
65
8
54
36
9
51
36
1
53
33
7
53
49
3
20
45
785
21
00
510
21
44
912
25
11
507
41
26
826
41
61
277
41
99
590
42
55
204
43
33
820
44
03
899
44
62
107
45
43
12
9
46
26
910
48
21
838
48
39
565
23
61
6
24
42
5
24
53
8
25
27
4
26
17
6
25
27
7
27
20
9
28
17
3
29
19
4
30
72
8
30
78
8
32
69
2
34
16
7
35
87
2
36
77
2
Total Customer
Current Account Saving Account Time Deposit
21831
27733 27304 27883
21277 24866
34252 31270
23236
35918 37489 36015
26273 28769
33511
399 322 329 303 242 199 192 210 254 208 205 225 276 257 250
18521 27761
33698 33250
23107
32546
39819 40218
26134
34200
43644 42621
23462
35063 34059
FY12 3M13 1H13 9M13 FY13 3M14 1H14 9M14 FY14 3M15 1H15 9M15 FY15 1H16 7M16
Ticket Size
Current Account Saving Account Time Deposit
27
Competitive Product
CONSUMER
COMMERCIAL
SME
CONSUMER LOAN Julyrsquo15 Julyrsquo16
Multipurpose 5447 5597
Mortgage 481 514
Others 236 301
Total 6164 6411
COMMERCIAL LOAN Julyrsquo15 Julyrsquo16
Standby Loan 374 224
Keppres 370 354
Overdraft 963 986
Syndicate 458 452
Total 2165 2015
Small Medium Ent Julyrsquo15 Julyrsquo16
KUR 241 082
Pundi Kencana 392 428
Jatim Mikro 160 188
Others 879 877
Total 1671 1574
28
Loan Proportion
In Billion Rp
YoY
Consumer
632
Commercial
(489)
SME
(369)
29
Type Of Loan
15599 16224 16711 17064 17575 17663 17939 18186 18427 18875 18779
5019 5624 5180 5054
6024 6204 6586 5697 5334 5789 5901
4203 4239 4304 4450 4689 4787 4710 4528 4507 4612 4611
1H14 9M14 FY14 3M15 1H15 7M15 9M15 FY15 3M16 1H16 7M16
Consumer Commercial SME
In Billion Rp
YoY
Multi
purpose
503
Mortgage
919
Others
3012
30
Type Of Loan
13864 14408
14849 15152 15609 15608 15794 15924 16117
16499 16394
1177 1233 1299 1340 1369 1379 1399 1434 1465 1502 1505
559 583 563 572 597 677 746 827 845 875 880
1H14 9M14 FY14 3M15 1H15 7M15 9M15 FY15 3M16 1H16 7M16
CONSUMER LOAN
Multipurpose Mortgage Others
In Billion Rp
YoY
Standby
Loan
(3877)
Keppres
(235)
Overdraft
462
Syndicate
071
31
Type Of Loan1
0
75
12
86
10
13
81
2
10
23
10
71
12
44
84
7
59
4
65
6
65
6
82
4 11
57
68
7
44
9
97
8
10
60
13
37
74
8
55
9
96
4
10
35
22
17
22
59
23
08
25
75
27
41
27
59
26
92
27
66
28
22
28
67
28
87
90
3
92
2
11
71
12
18
12
81
13
14
13
14
13
36
13
60
13
01
13
23
1H14 9M14 FY14 3M15 1H15 7M15 9M15 FY15 3M16 1H16 7M16
Commercial Loan
Standby Loan Keppres Overdraft Syndicate
In Billion Rp
YoY
KUR
(6532)
Pundi
Kencana
1163
Mikro
2031
Others
200
32
Type Of Loan1218
1128
1058
893
735
689
601
451
347
258
239
693
747
796
950
1108
1123
1157
1178
1223
1273
1254
78
165
264
345
452
457
491
520
530
557
550
2214
2199
2186
2262
2395
2517
2461
2380
2407
2523
2568
1H14 9M14 FY14 3M15 1H15 7M15 9M15 FY15 3M16 1H16 7M16
SME Loan
KUR Pundi Kencana Mikro Others
33
Type Of Loan
26
22
93
26
06
47
25
96
58
26
17
30
26
36
14
26
39
07
25
45
01
25
34
43
25
37
33
25
35
85
85
98
96
44
87
30
71
94
96
70
11
5
82
83
64
64
02
91
60
94
88
45
9
51
43
9
86
42
7
49
43
2
81
45
2
44
44
1
49
41
6
35
41
8
61
42
3
00
42
2
37
1H14 9M14 FY14 3M15 1H15 9M15 FY15 3M16 1H16 7M16
Total Customer
Consumer Commercial SME
5947 6225 6436 652 6667 6797 7146 7271 7439 7406
58231 58311 5933
702662292
56868
68119
83319
63196 62194
9147 9637 10069 1028 10366 10669 10877 10767 10903 10916
1H14 9M14 FY14 3M15 1H15 9M15 FY15 3M16 1H16 7M16
Ticket Size
Consumer Commercial SME
34
STRENGTH
35
Strength Of Funding
517
460 477426
403435
463 480431 407 435
384 385 394 421
246
254 288
362358
241
250284 359
354368
384 363 372284
237 285 235212
239 237287
237 210 239197
232 252 234294
2002 2003 2004 2005 2006 2007 2008 2009 2010 2011 2012 2013 2014 2015 7M16
Time deposit Saving deposit Current account
448 453
300 253 302 318 321261
316 354 348268 301
368256 301 284 283
492 500
275239
310 328 331
258326
381 371
267345
395
250277 297 296
3M12 1H12 9M12 FY12 3M13 1H13 9M13 FY13 3M14 1H14 9M14 FY14 3M15 1H15 FY15 3M16 1H16 7M16
Cost of Fund(+) Local Government (-) Local Government
Description Details
Civil Servants (per December 2014) 426545
Multipurpose Customer (Civil Servants) 238965
5602
NPL 039 as of Julyrsquo 2016
36
Strength of Loan (Multipurpose Loan)
567 593 612 619 631 640
666 675 690 686
1H14 9M14 FY14 3M15 1H15 9M15 FY15 3M16 1H16 7M16
Multiguna Ticket Size (million) Rp
13864
14408
14849
15152
1560915794
1592416117
1649916394
1H14 9M14 FY14 3M15 1H15 9M15 FY15 3M16 1H16 7M16
Multiguna Loan Balance
( Billion Rp )
Foreign Institution Investor
7260 from public shares
Foreign Institution Investor
6581 from public shares
Public shares 20
from paid capital Domestic Investor
3419 from public shares
Domestic Investor
2740 from public shares
37
No Country Share
1 INDONESIA 3419402 LUKSEMBURG 161267
3 AMERIKA 1341304 NORWEGIA 1111345 SIPRUS 838626 FINLANDIA 577797 VIRGIN ISLAND 41059
8 INGGRIS 223339 IRLANDIA 17073
10 AUSTRALIA 0964611 JEPANG 0839812 KANADA 05512
No Country Share
14 SWEDIA 0248915 SINGAPURA 0201816 CAYMAN ISLAND 0060317 GREENLAND 0033118 CINA 0019319 SWITSERLAND 0011320 KOREA SELATAN 0007421 FILIPINA 0002222 MALAYSIA 0001523 HONGKONG 0000824 JERMAN 00001
Total 100
STRENGTH OF INSTITUTIONS INVESTOR
38
Awards amp Achievements
The Most Trusted Banking in
Microfinance Services of The
Year 2015
Very Good Predicate for 2014
Financial Performance
Infobank Awards 2015
Bank Jatim Regional Banks with
excellent service of the year
2016
Excellence in Building and
Managing Corporate Image
Corporate Image Award 2015
The 1st Champion of Indonesia
Original Brand 2015
Top BPD HRampIT Management
2016
39
Investor Relations (IR)
Corporate Secretary
(031) 5310090 ext 469
Email irubankjatimcoid
Contact

23
OVERVIEW amp INVESTMENT HIGHLIGHTS
24
Current AccountYoY 129
Saving AccountYoY 1371
Time DepositYoY (595)
Third Party Fund
9662
12083
9969
16563
11649
18292
20116
17698
13494
21037
15345
17926
81747064
9970
8082
10991
9172 9128
10630
12753
1098712379 12087
4374
8269
6048
10834
7630
10509
13437 13316
8016
9482
12578 12524
FY12 1H13 FY13 1H14 FY14 3M15 1H15 7M15 FY15 3M16 1H16 7M16
Current Account
Saving Account
Time Deposit
In Billion Rp
In Billion Rp
Government Current
Acc
YoY (1752)
Private Current Acc
YoY 20528
YoY
SIMPEDA 1091
SIKLUS 4390
Hajj Saving 289
TabunganKu 2476
Barokah Saving 3115
Time Deposit
YoY (595)
25
Detailed Third Party Fund
13821 11959 7220 14710 15803 16204 17985
5718 16715
10411 13365
2742 3491 4429
3582 4313 1494 1596
7776
4322 4933
4561
1H14 9M14 FY14 3M15 1H15 7M15 9M15 FY15 3M16 1H16 7M16
Current Account
Government Private
241 290 657 418 535 560 581 861 674 752 806 179 194 208 218 199 204 215 224 230 208 210
6946 7682
9239 7705 7543
8977 8535
10561 9046
10330 9957
651 687
795
748 762
797 814
994
925
980 994
65 70
93
83 87
92 94
112
112
110 120
1H14 9M14 FY14 3M15 1H15 7M15 9M15 FY15 3M16 1H16 7M16
Saving Account
SIKLUS Hajj Saving SIMPEDA TabunganKu Barokah Saving
10834 11331 7630 10509 13437 13316 13934 8016 9482 12578 12524
1H14 9M14 FY14 3M15 1H15 7M15 9M15 FY15 3M16 1H16 7M16
Time Deposit
26
Third Party Fund Customer
In million Rp
FY12 3M13 1H13 9M13 FY13 3M14 1H14 9M14 FY14 3M15 1H15 9M15 FY15 1H16 7M16
44
13
7
43
63
4
44
25
4
45
33
4
46
85
3
47
01
4
48
35
8
49
41
1
50
13
4
50
92
7
53
65
8
54
36
9
51
36
1
53
33
7
53
49
3
20
45
785
21
00
510
21
44
912
25
11
507
41
26
826
41
61
277
41
99
590
42
55
204
43
33
820
44
03
899
44
62
107
45
43
12
9
46
26
910
48
21
838
48
39
565
23
61
6
24
42
5
24
53
8
25
27
4
26
17
6
25
27
7
27
20
9
28
17
3
29
19
4
30
72
8
30
78
8
32
69
2
34
16
7
35
87
2
36
77
2
Total Customer
Current Account Saving Account Time Deposit
21831
27733 27304 27883
21277 24866
34252 31270
23236
35918 37489 36015
26273 28769
33511
399 322 329 303 242 199 192 210 254 208 205 225 276 257 250
18521 27761
33698 33250
23107
32546
39819 40218
26134
34200
43644 42621
23462
35063 34059
FY12 3M13 1H13 9M13 FY13 3M14 1H14 9M14 FY14 3M15 1H15 9M15 FY15 1H16 7M16
Ticket Size
Current Account Saving Account Time Deposit
27
Competitive Product
CONSUMER
COMMERCIAL
SME
CONSUMER LOAN Julyrsquo15 Julyrsquo16
Multipurpose 5447 5597
Mortgage 481 514
Others 236 301
Total 6164 6411
COMMERCIAL LOAN Julyrsquo15 Julyrsquo16
Standby Loan 374 224
Keppres 370 354
Overdraft 963 986
Syndicate 458 452
Total 2165 2015
Small Medium Ent Julyrsquo15 Julyrsquo16
KUR 241 082
Pundi Kencana 392 428
Jatim Mikro 160 188
Others 879 877
Total 1671 1574
28
Loan Proportion
In Billion Rp
YoY
Consumer
632
Commercial
(489)
SME
(369)
29
Type Of Loan
15599 16224 16711 17064 17575 17663 17939 18186 18427 18875 18779
5019 5624 5180 5054
6024 6204 6586 5697 5334 5789 5901
4203 4239 4304 4450 4689 4787 4710 4528 4507 4612 4611
1H14 9M14 FY14 3M15 1H15 7M15 9M15 FY15 3M16 1H16 7M16
Consumer Commercial SME
In Billion Rp
YoY
Multi
purpose
503
Mortgage
919
Others
3012
30
Type Of Loan
13864 14408
14849 15152 15609 15608 15794 15924 16117
16499 16394
1177 1233 1299 1340 1369 1379 1399 1434 1465 1502 1505
559 583 563 572 597 677 746 827 845 875 880
1H14 9M14 FY14 3M15 1H15 7M15 9M15 FY15 3M16 1H16 7M16
CONSUMER LOAN
Multipurpose Mortgage Others
In Billion Rp
YoY
Standby
Loan
(3877)
Keppres
(235)
Overdraft
462
Syndicate
071
31
Type Of Loan1
0
75
12
86
10
13
81
2
10
23
10
71
12
44
84
7
59
4
65
6
65
6
82
4 11
57
68
7
44
9
97
8
10
60
13
37
74
8
55
9
96
4
10
35
22
17
22
59
23
08
25
75
27
41
27
59
26
92
27
66
28
22
28
67
28
87
90
3
92
2
11
71
12
18
12
81
13
14
13
14
13
36
13
60
13
01
13
23
1H14 9M14 FY14 3M15 1H15 7M15 9M15 FY15 3M16 1H16 7M16
Commercial Loan
Standby Loan Keppres Overdraft Syndicate
In Billion Rp
YoY
KUR
(6532)
Pundi
Kencana
1163
Mikro
2031
Others
200
32
Type Of Loan1218
1128
1058
893
735
689
601
451
347
258
239
693
747
796
950
1108
1123
1157
1178
1223
1273
1254
78
165
264
345
452
457
491
520
530
557
550
2214
2199
2186
2262
2395
2517
2461
2380
2407
2523
2568
1H14 9M14 FY14 3M15 1H15 7M15 9M15 FY15 3M16 1H16 7M16
SME Loan
KUR Pundi Kencana Mikro Others
33
Type Of Loan
26
22
93
26
06
47
25
96
58
26
17
30
26
36
14
26
39
07
25
45
01
25
34
43
25
37
33
25
35
85
85
98
96
44
87
30
71
94
96
70
11
5
82
83
64
64
02
91
60
94
88
45
9
51
43
9
86
42
7
49
43
2
81
45
2
44
44
1
49
41
6
35
41
8
61
42
3
00
42
2
37
1H14 9M14 FY14 3M15 1H15 9M15 FY15 3M16 1H16 7M16
Total Customer
Consumer Commercial SME
5947 6225 6436 652 6667 6797 7146 7271 7439 7406
58231 58311 5933
702662292
56868
68119
83319
63196 62194
9147 9637 10069 1028 10366 10669 10877 10767 10903 10916
1H14 9M14 FY14 3M15 1H15 9M15 FY15 3M16 1H16 7M16
Ticket Size
Consumer Commercial SME
34
STRENGTH
35
Strength Of Funding
517
460 477426
403435
463 480431 407 435
384 385 394 421
246
254 288
362358
241
250284 359
354368
384 363 372284
237 285 235212
239 237287
237 210 239197
232 252 234294
2002 2003 2004 2005 2006 2007 2008 2009 2010 2011 2012 2013 2014 2015 7M16
Time deposit Saving deposit Current account
448 453
300 253 302 318 321261
316 354 348268 301
368256 301 284 283
492 500
275239
310 328 331
258326
381 371
267345
395
250277 297 296
3M12 1H12 9M12 FY12 3M13 1H13 9M13 FY13 3M14 1H14 9M14 FY14 3M15 1H15 FY15 3M16 1H16 7M16
Cost of Fund(+) Local Government (-) Local Government
Description Details
Civil Servants (per December 2014) 426545
Multipurpose Customer (Civil Servants) 238965
5602
NPL 039 as of Julyrsquo 2016
36
Strength of Loan (Multipurpose Loan)
567 593 612 619 631 640
666 675 690 686
1H14 9M14 FY14 3M15 1H15 9M15 FY15 3M16 1H16 7M16
Multiguna Ticket Size (million) Rp
13864
14408
14849
15152
1560915794
1592416117
1649916394
1H14 9M14 FY14 3M15 1H15 9M15 FY15 3M16 1H16 7M16
Multiguna Loan Balance
( Billion Rp )
Foreign Institution Investor
7260 from public shares
Foreign Institution Investor
6581 from public shares
Public shares 20
from paid capital Domestic Investor
3419 from public shares
Domestic Investor
2740 from public shares
37
No Country Share
1 INDONESIA 3419402 LUKSEMBURG 161267
3 AMERIKA 1341304 NORWEGIA 1111345 SIPRUS 838626 FINLANDIA 577797 VIRGIN ISLAND 41059
8 INGGRIS 223339 IRLANDIA 17073
10 AUSTRALIA 0964611 JEPANG 0839812 KANADA 05512
No Country Share
14 SWEDIA 0248915 SINGAPURA 0201816 CAYMAN ISLAND 0060317 GREENLAND 0033118 CINA 0019319 SWITSERLAND 0011320 KOREA SELATAN 0007421 FILIPINA 0002222 MALAYSIA 0001523 HONGKONG 0000824 JERMAN 00001
Total 100
STRENGTH OF INSTITUTIONS INVESTOR
38
Awards amp Achievements
The Most Trusted Banking in
Microfinance Services of The
Year 2015
Very Good Predicate for 2014
Financial Performance
Infobank Awards 2015
Bank Jatim Regional Banks with
excellent service of the year
2016
Excellence in Building and
Managing Corporate Image
Corporate Image Award 2015
The 1st Champion of Indonesia
Original Brand 2015
Top BPD HRampIT Management
2016
39
Investor Relations (IR)
Corporate Secretary
(031) 5310090 ext 469
Email irubankjatimcoid
Contact

24
Current AccountYoY 129
Saving AccountYoY 1371
Time DepositYoY (595)
Third Party Fund
9662
12083
9969
16563
11649
18292
20116
17698
13494
21037
15345
17926
81747064
9970
8082
10991
9172 9128
10630
12753
1098712379 12087
4374
8269
6048
10834
7630
10509
13437 13316
8016
9482
12578 12524
FY12 1H13 FY13 1H14 FY14 3M15 1H15 7M15 FY15 3M16 1H16 7M16
Current Account
Saving Account
Time Deposit
In Billion Rp
In Billion Rp
Government Current
Acc
YoY (1752)
Private Current Acc
YoY 20528
YoY
SIMPEDA 1091
SIKLUS 4390
Hajj Saving 289
TabunganKu 2476
Barokah Saving 3115
Time Deposit
YoY (595)
25
Detailed Third Party Fund
13821 11959 7220 14710 15803 16204 17985
5718 16715
10411 13365
2742 3491 4429
3582 4313 1494 1596
7776
4322 4933
4561
1H14 9M14 FY14 3M15 1H15 7M15 9M15 FY15 3M16 1H16 7M16
Current Account
Government Private
241 290 657 418 535 560 581 861 674 752 806 179 194 208 218 199 204 215 224 230 208 210
6946 7682
9239 7705 7543
8977 8535
10561 9046
10330 9957
651 687
795
748 762
797 814
994
925
980 994
65 70
93
83 87
92 94
112
112
110 120
1H14 9M14 FY14 3M15 1H15 7M15 9M15 FY15 3M16 1H16 7M16
Saving Account
SIKLUS Hajj Saving SIMPEDA TabunganKu Barokah Saving
10834 11331 7630 10509 13437 13316 13934 8016 9482 12578 12524
1H14 9M14 FY14 3M15 1H15 7M15 9M15 FY15 3M16 1H16 7M16
Time Deposit
26
Third Party Fund Customer
In million Rp
FY12 3M13 1H13 9M13 FY13 3M14 1H14 9M14 FY14 3M15 1H15 9M15 FY15 1H16 7M16
44
13
7
43
63
4
44
25
4
45
33
4
46
85
3
47
01
4
48
35
8
49
41
1
50
13
4
50
92
7
53
65
8
54
36
9
51
36
1
53
33
7
53
49
3
20
45
785
21
00
510
21
44
912
25
11
507
41
26
826
41
61
277
41
99
590
42
55
204
43
33
820
44
03
899
44
62
107
45
43
12
9
46
26
910
48
21
838
48
39
565
23
61
6
24
42
5
24
53
8
25
27
4
26
17
6
25
27
7
27
20
9
28
17
3
29
19
4
30
72
8
30
78
8
32
69
2
34
16
7
35
87
2
36
77
2
Total Customer
Current Account Saving Account Time Deposit
21831
27733 27304 27883
21277 24866
34252 31270
23236
35918 37489 36015
26273 28769
33511
399 322 329 303 242 199 192 210 254 208 205 225 276 257 250
18521 27761
33698 33250
23107
32546
39819 40218
26134
34200
43644 42621
23462
35063 34059
FY12 3M13 1H13 9M13 FY13 3M14 1H14 9M14 FY14 3M15 1H15 9M15 FY15 1H16 7M16
Ticket Size
Current Account Saving Account Time Deposit
27
Competitive Product
CONSUMER
COMMERCIAL
SME
CONSUMER LOAN Julyrsquo15 Julyrsquo16
Multipurpose 5447 5597
Mortgage 481 514
Others 236 301
Total 6164 6411
COMMERCIAL LOAN Julyrsquo15 Julyrsquo16
Standby Loan 374 224
Keppres 370 354
Overdraft 963 986
Syndicate 458 452
Total 2165 2015
Small Medium Ent Julyrsquo15 Julyrsquo16
KUR 241 082
Pundi Kencana 392 428
Jatim Mikro 160 188
Others 879 877
Total 1671 1574
28
Loan Proportion
In Billion Rp
YoY
Consumer
632
Commercial
(489)
SME
(369)
29
Type Of Loan
15599 16224 16711 17064 17575 17663 17939 18186 18427 18875 18779
5019 5624 5180 5054
6024 6204 6586 5697 5334 5789 5901
4203 4239 4304 4450 4689 4787 4710 4528 4507 4612 4611
1H14 9M14 FY14 3M15 1H15 7M15 9M15 FY15 3M16 1H16 7M16
Consumer Commercial SME
In Billion Rp
YoY
Multi
purpose
503
Mortgage
919
Others
3012
30
Type Of Loan
13864 14408
14849 15152 15609 15608 15794 15924 16117
16499 16394
1177 1233 1299 1340 1369 1379 1399 1434 1465 1502 1505
559 583 563 572 597 677 746 827 845 875 880
1H14 9M14 FY14 3M15 1H15 7M15 9M15 FY15 3M16 1H16 7M16
CONSUMER LOAN
Multipurpose Mortgage Others
In Billion Rp
YoY
Standby
Loan
(3877)
Keppres
(235)
Overdraft
462
Syndicate
071
31
Type Of Loan1
0
75
12
86
10
13
81
2
10
23
10
71
12
44
84
7
59
4
65
6
65
6
82
4 11
57
68
7
44
9
97
8
10
60
13
37
74
8
55
9
96
4
10
35
22
17
22
59
23
08
25
75
27
41
27
59
26
92
27
66
28
22
28
67
28
87
90
3
92
2
11
71
12
18
12
81
13
14
13
14
13
36
13
60
13
01
13
23
1H14 9M14 FY14 3M15 1H15 7M15 9M15 FY15 3M16 1H16 7M16
Commercial Loan
Standby Loan Keppres Overdraft Syndicate
In Billion Rp
YoY
KUR
(6532)
Pundi
Kencana
1163
Mikro
2031
Others
200
32
Type Of Loan1218
1128
1058
893
735
689
601
451
347
258
239
693
747
796
950
1108
1123
1157
1178
1223
1273
1254
78
165
264
345
452
457
491
520
530
557
550
2214
2199
2186
2262
2395
2517
2461
2380
2407
2523
2568
1H14 9M14 FY14 3M15 1H15 7M15 9M15 FY15 3M16 1H16 7M16
SME Loan
KUR Pundi Kencana Mikro Others
33
Type Of Loan
26
22
93
26
06
47
25
96
58
26
17
30
26
36
14
26
39
07
25
45
01
25
34
43
25
37
33
25
35
85
85
98
96
44
87
30
71
94
96
70
11
5
82
83
64
64
02
91
60
94
88
45
9
51
43
9
86
42
7
49
43
2
81
45
2
44
44
1
49
41
6
35
41
8
61
42
3
00
42
2
37
1H14 9M14 FY14 3M15 1H15 9M15 FY15 3M16 1H16 7M16
Total Customer
Consumer Commercial SME
5947 6225 6436 652 6667 6797 7146 7271 7439 7406
58231 58311 5933
702662292
56868
68119
83319
63196 62194
9147 9637 10069 1028 10366 10669 10877 10767 10903 10916
1H14 9M14 FY14 3M15 1H15 9M15 FY15 3M16 1H16 7M16
Ticket Size
Consumer Commercial SME
34
STRENGTH
35
Strength Of Funding
517
460 477426
403435
463 480431 407 435
384 385 394 421
246
254 288
362358
241
250284 359
354368
384 363 372284
237 285 235212
239 237287
237 210 239197
232 252 234294
2002 2003 2004 2005 2006 2007 2008 2009 2010 2011 2012 2013 2014 2015 7M16
Time deposit Saving deposit Current account
448 453
300 253 302 318 321261
316 354 348268 301
368256 301 284 283
492 500
275239
310 328 331
258326
381 371
267345
395
250277 297 296
3M12 1H12 9M12 FY12 3M13 1H13 9M13 FY13 3M14 1H14 9M14 FY14 3M15 1H15 FY15 3M16 1H16 7M16
Cost of Fund(+) Local Government (-) Local Government
Description Details
Civil Servants (per December 2014) 426545
Multipurpose Customer (Civil Servants) 238965
5602
NPL 039 as of Julyrsquo 2016
36
Strength of Loan (Multipurpose Loan)
567 593 612 619 631 640
666 675 690 686
1H14 9M14 FY14 3M15 1H15 9M15 FY15 3M16 1H16 7M16
Multiguna Ticket Size (million) Rp
13864
14408
14849
15152
1560915794
1592416117
1649916394
1H14 9M14 FY14 3M15 1H15 9M15 FY15 3M16 1H16 7M16
Multiguna Loan Balance
( Billion Rp )
Foreign Institution Investor
7260 from public shares
Foreign Institution Investor
6581 from public shares
Public shares 20
from paid capital Domestic Investor
3419 from public shares
Domestic Investor
2740 from public shares
37
No Country Share
1 INDONESIA 3419402 LUKSEMBURG 161267
3 AMERIKA 1341304 NORWEGIA 1111345 SIPRUS 838626 FINLANDIA 577797 VIRGIN ISLAND 41059
8 INGGRIS 223339 IRLANDIA 17073
10 AUSTRALIA 0964611 JEPANG 0839812 KANADA 05512
No Country Share
14 SWEDIA 0248915 SINGAPURA 0201816 CAYMAN ISLAND 0060317 GREENLAND 0033118 CINA 0019319 SWITSERLAND 0011320 KOREA SELATAN 0007421 FILIPINA 0002222 MALAYSIA 0001523 HONGKONG 0000824 JERMAN 00001
Total 100
STRENGTH OF INSTITUTIONS INVESTOR
38
Awards amp Achievements
The Most Trusted Banking in
Microfinance Services of The
Year 2015
Very Good Predicate for 2014
Financial Performance
Infobank Awards 2015
Bank Jatim Regional Banks with
excellent service of the year
2016
Excellence in Building and
Managing Corporate Image
Corporate Image Award 2015
The 1st Champion of Indonesia
Original Brand 2015
Top BPD HRampIT Management
2016
39
Investor Relations (IR)
Corporate Secretary
(031) 5310090 ext 469
Email irubankjatimcoid
Contact

In Billion Rp
Government Current
Acc
YoY (1752)
Private Current Acc
YoY 20528
YoY
SIMPEDA 1091
SIKLUS 4390
Hajj Saving 289
TabunganKu 2476
Barokah Saving 3115
Time Deposit
YoY (595)
25
Detailed Third Party Fund
13821 11959 7220 14710 15803 16204 17985
5718 16715
10411 13365
2742 3491 4429
3582 4313 1494 1596
7776
4322 4933
4561
1H14 9M14 FY14 3M15 1H15 7M15 9M15 FY15 3M16 1H16 7M16
Current Account
Government Private
241 290 657 418 535 560 581 861 674 752 806 179 194 208 218 199 204 215 224 230 208 210
6946 7682
9239 7705 7543
8977 8535
10561 9046
10330 9957
651 687
795
748 762
797 814
994
925
980 994
65 70
93
83 87
92 94
112
112
110 120
1H14 9M14 FY14 3M15 1H15 7M15 9M15 FY15 3M16 1H16 7M16
Saving Account
SIKLUS Hajj Saving SIMPEDA TabunganKu Barokah Saving
10834 11331 7630 10509 13437 13316 13934 8016 9482 12578 12524
1H14 9M14 FY14 3M15 1H15 7M15 9M15 FY15 3M16 1H16 7M16
Time Deposit
26
Third Party Fund Customer
In million Rp
FY12 3M13 1H13 9M13 FY13 3M14 1H14 9M14 FY14 3M15 1H15 9M15 FY15 1H16 7M16
44
13
7
43
63
4
44
25
4
45
33
4
46
85
3
47
01
4
48
35
8
49
41
1
50
13
4
50
92
7
53
65
8
54
36
9
51
36
1
53
33
7
53
49
3
20
45
785
21
00
510
21
44
912
25
11
507
41
26
826
41
61
277
41
99
590
42
55
204
43
33
820
44
03
899
44
62
107
45
43
12
9
46
26
910
48
21
838
48
39
565
23
61
6
24
42
5
24
53
8
25
27
4
26
17
6
25
27
7
27
20
9
28
17
3
29
19
4
30
72
8
30
78
8
32
69
2
34
16
7
35
87
2
36
77
2
Total Customer
Current Account Saving Account Time Deposit
21831
27733 27304 27883
21277 24866
34252 31270
23236
35918 37489 36015
26273 28769
33511
399 322 329 303 242 199 192 210 254 208 205 225 276 257 250
18521 27761
33698 33250
23107
32546
39819 40218
26134
34200
43644 42621
23462
35063 34059
FY12 3M13 1H13 9M13 FY13 3M14 1H14 9M14 FY14 3M15 1H15 9M15 FY15 1H16 7M16
Ticket Size
Current Account Saving Account Time Deposit
27
Competitive Product
CONSUMER
COMMERCIAL
SME
CONSUMER LOAN Julyrsquo15 Julyrsquo16
Multipurpose 5447 5597
Mortgage 481 514
Others 236 301
Total 6164 6411
COMMERCIAL LOAN Julyrsquo15 Julyrsquo16
Standby Loan 374 224
Keppres 370 354
Overdraft 963 986
Syndicate 458 452
Total 2165 2015
Small Medium Ent Julyrsquo15 Julyrsquo16
KUR 241 082
Pundi Kencana 392 428
Jatim Mikro 160 188
Others 879 877
Total 1671 1574
28
Loan Proportion
In Billion Rp
YoY
Consumer
632
Commercial
(489)
SME
(369)
29
Type Of Loan
15599 16224 16711 17064 17575 17663 17939 18186 18427 18875 18779
5019 5624 5180 5054
6024 6204 6586 5697 5334 5789 5901
4203 4239 4304 4450 4689 4787 4710 4528 4507 4612 4611
1H14 9M14 FY14 3M15 1H15 7M15 9M15 FY15 3M16 1H16 7M16
Consumer Commercial SME
In Billion Rp
YoY
Multi
purpose
503
Mortgage
919
Others
3012
30
Type Of Loan
13864 14408
14849 15152 15609 15608 15794 15924 16117
16499 16394
1177 1233 1299 1340 1369 1379 1399 1434 1465 1502 1505
559 583 563 572 597 677 746 827 845 875 880
1H14 9M14 FY14 3M15 1H15 7M15 9M15 FY15 3M16 1H16 7M16
CONSUMER LOAN
Multipurpose Mortgage Others
In Billion Rp
YoY
Standby
Loan
(3877)
Keppres
(235)
Overdraft
462
Syndicate
071
31
Type Of Loan1
0
75
12
86
10
13
81
2
10
23
10
71
12
44
84
7
59
4
65
6
65
6
82
4 11
57
68
7
44
9
97
8
10
60
13
37
74
8
55
9
96
4
10
35
22
17
22
59
23
08
25
75
27
41
27
59
26
92
27
66
28
22
28
67
28
87
90
3
92
2
11
71
12
18
12
81
13
14
13
14
13
36
13
60
13
01
13
23
1H14 9M14 FY14 3M15 1H15 7M15 9M15 FY15 3M16 1H16 7M16
Commercial Loan
Standby Loan Keppres Overdraft Syndicate
In Billion Rp
YoY
KUR
(6532)
Pundi
Kencana
1163
Mikro
2031
Others
200
32
Type Of Loan1218
1128
1058
893
735
689
601
451
347
258
239
693
747
796
950
1108
1123
1157
1178
1223
1273
1254
78
165
264
345
452
457
491
520
530
557
550
2214
2199
2186
2262
2395
2517
2461
2380
2407
2523
2568
1H14 9M14 FY14 3M15 1H15 7M15 9M15 FY15 3M16 1H16 7M16
SME Loan
KUR Pundi Kencana Mikro Others
33
Type Of Loan
26
22
93
26
06
47
25
96
58
26
17
30
26
36
14
26
39
07
25
45
01
25
34
43
25
37
33
25
35
85
85
98
96
44
87
30
71
94
96
70
11
5
82
83
64
64
02
91
60
94
88
45
9
51
43
9
86
42
7
49
43
2
81
45
2
44
44
1
49
41
6
35
41
8
61
42
3
00
42
2
37
1H14 9M14 FY14 3M15 1H15 9M15 FY15 3M16 1H16 7M16
Total Customer
Consumer Commercial SME
5947 6225 6436 652 6667 6797 7146 7271 7439 7406
58231 58311 5933
702662292
56868
68119
83319
63196 62194
9147 9637 10069 1028 10366 10669 10877 10767 10903 10916
1H14 9M14 FY14 3M15 1H15 9M15 FY15 3M16 1H16 7M16
Ticket Size
Consumer Commercial SME
34
STRENGTH
35
Strength Of Funding
517
460 477426
403435
463 480431 407 435
384 385 394 421
246
254 288
362358
241
250284 359
354368
384 363 372284
237 285 235212
239 237287
237 210 239197
232 252 234294
2002 2003 2004 2005 2006 2007 2008 2009 2010 2011 2012 2013 2014 2015 7M16
Time deposit Saving deposit Current account
448 453
300 253 302 318 321261
316 354 348268 301
368256 301 284 283
492 500
275239
310 328 331
258326
381 371
267345
395
250277 297 296
3M12 1H12 9M12 FY12 3M13 1H13 9M13 FY13 3M14 1H14 9M14 FY14 3M15 1H15 FY15 3M16 1H16 7M16
Cost of Fund(+) Local Government (-) Local Government
Description Details
Civil Servants (per December 2014) 426545
Multipurpose Customer (Civil Servants) 238965
5602
NPL 039 as of Julyrsquo 2016
36
Strength of Loan (Multipurpose Loan)
567 593 612 619 631 640
666 675 690 686
1H14 9M14 FY14 3M15 1H15 9M15 FY15 3M16 1H16 7M16
Multiguna Ticket Size (million) Rp
13864
14408
14849
15152
1560915794
1592416117
1649916394
1H14 9M14 FY14 3M15 1H15 9M15 FY15 3M16 1H16 7M16
Multiguna Loan Balance
( Billion Rp )
Foreign Institution Investor
7260 from public shares
Foreign Institution Investor
6581 from public shares
Public shares 20
from paid capital Domestic Investor
3419 from public shares
Domestic Investor
2740 from public shares
37
No Country Share
1 INDONESIA 3419402 LUKSEMBURG 161267
3 AMERIKA 1341304 NORWEGIA 1111345 SIPRUS 838626 FINLANDIA 577797 VIRGIN ISLAND 41059
8 INGGRIS 223339 IRLANDIA 17073
10 AUSTRALIA 0964611 JEPANG 0839812 KANADA 05512
No Country Share
14 SWEDIA 0248915 SINGAPURA 0201816 CAYMAN ISLAND 0060317 GREENLAND 0033118 CINA 0019319 SWITSERLAND 0011320 KOREA SELATAN 0007421 FILIPINA 0002222 MALAYSIA 0001523 HONGKONG 0000824 JERMAN 00001
Total 100
STRENGTH OF INSTITUTIONS INVESTOR
38
Awards amp Achievements
The Most Trusted Banking in
Microfinance Services of The
Year 2015
Very Good Predicate for 2014
Financial Performance
Infobank Awards 2015
Bank Jatim Regional Banks with
excellent service of the year
2016
Excellence in Building and
Managing Corporate Image
Corporate Image Award 2015
The 1st Champion of Indonesia
Original Brand 2015
Top BPD HRampIT Management
2016
39
Investor Relations (IR)
Corporate Secretary
(031) 5310090 ext 469
Email irubankjatimcoid
Contact
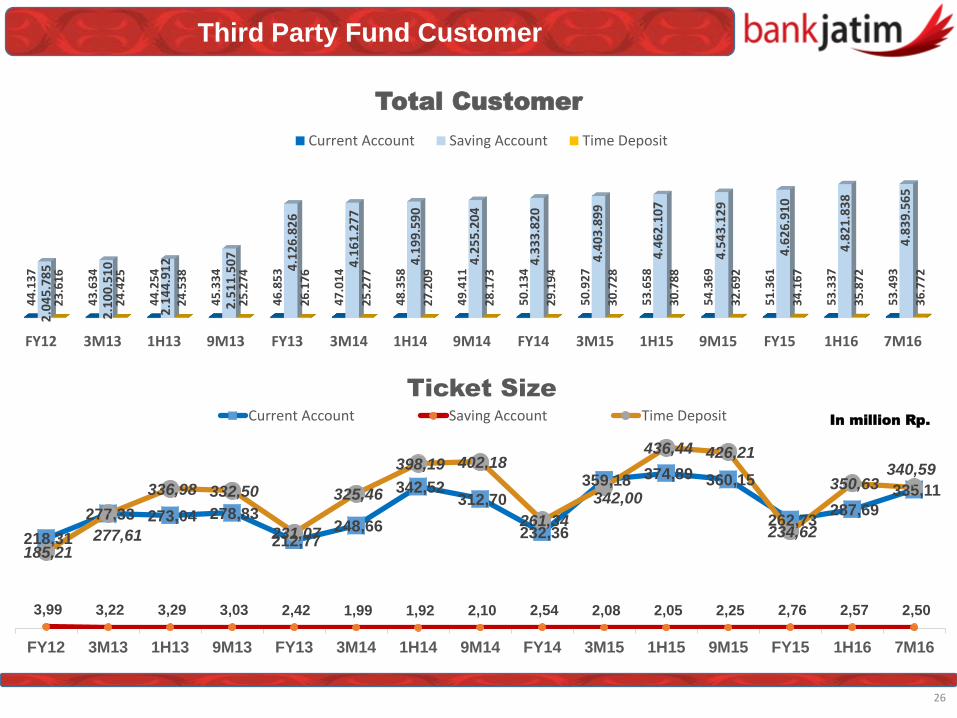
26
Third Party Fund Customer
In million Rp
FY12 3M13 1H13 9M13 FY13 3M14 1H14 9M14 FY14 3M15 1H15 9M15 FY15 1H16 7M16
44
13
7
43
63
4
44
25
4
45
33
4
46
85
3
47
01
4
48
35
8
49
41
1
50
13
4
50
92
7
53
65
8
54
36
9
51
36
1
53
33
7
53
49
3
20
45
785
21
00
510
21
44
912
25
11
507
41
26
826
41
61
277
41
99
590
42
55
204
43
33
820
44
03
899
44
62
107
45
43
12
9
46
26
910
48
21
838
48
39
565
23
61
6
24
42
5
24
53
8
25
27
4
26
17
6
25
27
7
27
20
9
28
17
3
29
19
4
30
72
8
30
78
8
32
69
2
34
16
7
35
87
2
36
77
2
Total Customer
Current Account Saving Account Time Deposit
21831
27733 27304 27883
21277 24866
34252 31270
23236
35918 37489 36015
26273 28769
33511
399 322 329 303 242 199 192 210 254 208 205 225 276 257 250
18521 27761
33698 33250
23107
32546
39819 40218
26134
34200
43644 42621
23462
35063 34059
FY12 3M13 1H13 9M13 FY13 3M14 1H14 9M14 FY14 3M15 1H15 9M15 FY15 1H16 7M16
Ticket Size
Current Account Saving Account Time Deposit
27
Competitive Product
CONSUMER
COMMERCIAL
SME
CONSUMER LOAN Julyrsquo15 Julyrsquo16
Multipurpose 5447 5597
Mortgage 481 514
Others 236 301
Total 6164 6411
COMMERCIAL LOAN Julyrsquo15 Julyrsquo16
Standby Loan 374 224
Keppres 370 354
Overdraft 963 986
Syndicate 458 452
Total 2165 2015
Small Medium Ent Julyrsquo15 Julyrsquo16
KUR 241 082
Pundi Kencana 392 428
Jatim Mikro 160 188
Others 879 877
Total 1671 1574
28
Loan Proportion
In Billion Rp
YoY
Consumer
632
Commercial
(489)
SME
(369)
29
Type Of Loan
15599 16224 16711 17064 17575 17663 17939 18186 18427 18875 18779
5019 5624 5180 5054
6024 6204 6586 5697 5334 5789 5901
4203 4239 4304 4450 4689 4787 4710 4528 4507 4612 4611
1H14 9M14 FY14 3M15 1H15 7M15 9M15 FY15 3M16 1H16 7M16
Consumer Commercial SME
In Billion Rp
YoY
Multi
purpose
503
Mortgage
919
Others
3012
30
Type Of Loan
13864 14408
14849 15152 15609 15608 15794 15924 16117
16499 16394
1177 1233 1299 1340 1369 1379 1399 1434 1465 1502 1505
559 583 563 572 597 677 746 827 845 875 880
1H14 9M14 FY14 3M15 1H15 7M15 9M15 FY15 3M16 1H16 7M16
CONSUMER LOAN
Multipurpose Mortgage Others
In Billion Rp
YoY
Standby
Loan
(3877)
Keppres
(235)
Overdraft
462
Syndicate
071
31
Type Of Loan1
0
75
12
86
10
13
81
2
10
23
10
71
12
44
84
7
59
4
65
6
65
6
82
4 11
57
68
7
44
9
97
8
10
60
13
37
74
8
55
9
96
4
10
35
22
17
22
59
23
08
25
75
27
41
27
59
26
92
27
66
28
22
28
67
28
87
90
3
92
2
11
71
12
18
12
81
13
14
13
14
13
36
13
60
13
01
13
23
1H14 9M14 FY14 3M15 1H15 7M15 9M15 FY15 3M16 1H16 7M16
Commercial Loan
Standby Loan Keppres Overdraft Syndicate
In Billion Rp
YoY
KUR
(6532)
Pundi
Kencana
1163
Mikro
2031
Others
200
32
Type Of Loan1218
1128
1058
893
735
689
601
451
347
258
239
693
747
796
950
1108
1123
1157
1178
1223
1273
1254
78
165
264
345
452
457
491
520
530
557
550
2214
2199
2186
2262
2395
2517
2461
2380
2407
2523
2568
1H14 9M14 FY14 3M15 1H15 7M15 9M15 FY15 3M16 1H16 7M16
SME Loan
KUR Pundi Kencana Mikro Others
33
Type Of Loan
26
22
93
26
06
47
25
96
58
26
17
30
26
36
14
26
39
07
25
45
01
25
34
43
25
37
33
25
35
85
85
98
96
44
87
30
71
94
96
70
11
5
82
83
64
64
02
91
60
94
88
45
9
51
43
9
86
42
7
49
43
2
81
45
2
44
44
1
49
41
6
35
41
8
61
42
3
00
42
2
37
1H14 9M14 FY14 3M15 1H15 9M15 FY15 3M16 1H16 7M16
Total Customer
Consumer Commercial SME
5947 6225 6436 652 6667 6797 7146 7271 7439 7406
58231 58311 5933
702662292
56868
68119
83319
63196 62194
9147 9637 10069 1028 10366 10669 10877 10767 10903 10916
1H14 9M14 FY14 3M15 1H15 9M15 FY15 3M16 1H16 7M16
Ticket Size
Consumer Commercial SME
34
STRENGTH
35
Strength Of Funding
517
460 477426
403435
463 480431 407 435
384 385 394 421
246
254 288
362358
241
250284 359
354368
384 363 372284
237 285 235212
239 237287
237 210 239197
232 252 234294
2002 2003 2004 2005 2006 2007 2008 2009 2010 2011 2012 2013 2014 2015 7M16
Time deposit Saving deposit Current account
448 453
300 253 302 318 321261
316 354 348268 301
368256 301 284 283
492 500
275239
310 328 331
258326
381 371
267345
395
250277 297 296
3M12 1H12 9M12 FY12 3M13 1H13 9M13 FY13 3M14 1H14 9M14 FY14 3M15 1H15 FY15 3M16 1H16 7M16
Cost of Fund(+) Local Government (-) Local Government
Description Details
Civil Servants (per December 2014) 426545
Multipurpose Customer (Civil Servants) 238965
5602
NPL 039 as of Julyrsquo 2016
36
Strength of Loan (Multipurpose Loan)
567 593 612 619 631 640
666 675 690 686
1H14 9M14 FY14 3M15 1H15 9M15 FY15 3M16 1H16 7M16
Multiguna Ticket Size (million) Rp
13864
14408
14849
15152
1560915794
1592416117
1649916394
1H14 9M14 FY14 3M15 1H15 9M15 FY15 3M16 1H16 7M16
Multiguna Loan Balance
( Billion Rp )
Foreign Institution Investor
7260 from public shares
Foreign Institution Investor
6581 from public shares
Public shares 20
from paid capital Domestic Investor
3419 from public shares
Domestic Investor
2740 from public shares
37
No Country Share
1 INDONESIA 3419402 LUKSEMBURG 161267
3 AMERIKA 1341304 NORWEGIA 1111345 SIPRUS 838626 FINLANDIA 577797 VIRGIN ISLAND 41059
8 INGGRIS 223339 IRLANDIA 17073
10 AUSTRALIA 0964611 JEPANG 0839812 KANADA 05512
No Country Share
14 SWEDIA 0248915 SINGAPURA 0201816 CAYMAN ISLAND 0060317 GREENLAND 0033118 CINA 0019319 SWITSERLAND 0011320 KOREA SELATAN 0007421 FILIPINA 0002222 MALAYSIA 0001523 HONGKONG 0000824 JERMAN 00001
Total 100
STRENGTH OF INSTITUTIONS INVESTOR
38
Awards amp Achievements
The Most Trusted Banking in
Microfinance Services of The
Year 2015
Very Good Predicate for 2014
Financial Performance
Infobank Awards 2015
Bank Jatim Regional Banks with
excellent service of the year
2016
Excellence in Building and
Managing Corporate Image
Corporate Image Award 2015
The 1st Champion of Indonesia
Original Brand 2015
Top BPD HRampIT Management
2016
39
Investor Relations (IR)
Corporate Secretary
(031) 5310090 ext 469
Email irubankjatimcoid
Contact

27
Competitive Product
CONSUMER
COMMERCIAL
SME
CONSUMER LOAN Julyrsquo15 Julyrsquo16
Multipurpose 5447 5597
Mortgage 481 514
Others 236 301
Total 6164 6411
COMMERCIAL LOAN Julyrsquo15 Julyrsquo16
Standby Loan 374 224
Keppres 370 354
Overdraft 963 986
Syndicate 458 452
Total 2165 2015
Small Medium Ent Julyrsquo15 Julyrsquo16
KUR 241 082
Pundi Kencana 392 428
Jatim Mikro 160 188
Others 879 877
Total 1671 1574
28
Loan Proportion
In Billion Rp
YoY
Consumer
632
Commercial
(489)
SME
(369)
29
Type Of Loan
15599 16224 16711 17064 17575 17663 17939 18186 18427 18875 18779
5019 5624 5180 5054
6024 6204 6586 5697 5334 5789 5901
4203 4239 4304 4450 4689 4787 4710 4528 4507 4612 4611
1H14 9M14 FY14 3M15 1H15 7M15 9M15 FY15 3M16 1H16 7M16
Consumer Commercial SME
In Billion Rp
YoY
Multi
purpose
503
Mortgage
919
Others
3012
30
Type Of Loan
13864 14408
14849 15152 15609 15608 15794 15924 16117
16499 16394
1177 1233 1299 1340 1369 1379 1399 1434 1465 1502 1505
559 583 563 572 597 677 746 827 845 875 880
1H14 9M14 FY14 3M15 1H15 7M15 9M15 FY15 3M16 1H16 7M16
CONSUMER LOAN
Multipurpose Mortgage Others
In Billion Rp
YoY
Standby
Loan
(3877)
Keppres
(235)
Overdraft
462
Syndicate
071
31
Type Of Loan1
0
75
12
86
10
13
81
2
10
23
10
71
12
44
84
7
59
4
65
6
65
6
82
4 11
57
68
7
44
9
97
8
10
60
13
37
74
8
55
9
96
4
10
35
22
17
22
59
23
08
25
75
27
41
27
59
26
92
27
66
28
22
28
67
28
87
90
3
92
2
11
71
12
18
12
81
13
14
13
14
13
36
13
60
13
01
13
23
1H14 9M14 FY14 3M15 1H15 7M15 9M15 FY15 3M16 1H16 7M16
Commercial Loan
Standby Loan Keppres Overdraft Syndicate
In Billion Rp
YoY
KUR
(6532)
Pundi
Kencana
1163
Mikro
2031
Others
200
32
Type Of Loan1218
1128
1058
893
735
689
601
451
347
258
239
693
747
796
950
1108
1123
1157
1178
1223
1273
1254
78
165
264
345
452
457
491
520
530
557
550
2214
2199
2186
2262
2395
2517
2461
2380
2407
2523
2568
1H14 9M14 FY14 3M15 1H15 7M15 9M15 FY15 3M16 1H16 7M16
SME Loan
KUR Pundi Kencana Mikro Others
33
Type Of Loan
26
22
93
26
06
47
25
96
58
26
17
30
26
36
14
26
39
07
25
45
01
25
34
43
25
37
33
25
35
85
85
98
96
44
87
30
71
94
96
70
11
5
82
83
64
64
02
91
60
94
88
45
9
51
43
9
86
42
7
49
43
2
81
45
2
44
44
1
49
41
6
35
41
8
61
42
3
00
42
2
37
1H14 9M14 FY14 3M15 1H15 9M15 FY15 3M16 1H16 7M16
Total Customer
Consumer Commercial SME
5947 6225 6436 652 6667 6797 7146 7271 7439 7406
58231 58311 5933
702662292
56868
68119
83319
63196 62194
9147 9637 10069 1028 10366 10669 10877 10767 10903 10916
1H14 9M14 FY14 3M15 1H15 9M15 FY15 3M16 1H16 7M16
Ticket Size
Consumer Commercial SME
34
STRENGTH
35
Strength Of Funding
517
460 477426
403435
463 480431 407 435
384 385 394 421
246
254 288
362358
241
250284 359
354368
384 363 372284
237 285 235212
239 237287
237 210 239197
232 252 234294
2002 2003 2004 2005 2006 2007 2008 2009 2010 2011 2012 2013 2014 2015 7M16
Time deposit Saving deposit Current account
448 453
300 253 302 318 321261
316 354 348268 301
368256 301 284 283
492 500
275239
310 328 331
258326
381 371
267345
395
250277 297 296
3M12 1H12 9M12 FY12 3M13 1H13 9M13 FY13 3M14 1H14 9M14 FY14 3M15 1H15 FY15 3M16 1H16 7M16
Cost of Fund(+) Local Government (-) Local Government
Description Details
Civil Servants (per December 2014) 426545
Multipurpose Customer (Civil Servants) 238965
5602
NPL 039 as of Julyrsquo 2016
36
Strength of Loan (Multipurpose Loan)
567 593 612 619 631 640
666 675 690 686
1H14 9M14 FY14 3M15 1H15 9M15 FY15 3M16 1H16 7M16
Multiguna Ticket Size (million) Rp
13864
14408
14849
15152
1560915794
1592416117
1649916394
1H14 9M14 FY14 3M15 1H15 9M15 FY15 3M16 1H16 7M16
Multiguna Loan Balance
( Billion Rp )
Foreign Institution Investor
7260 from public shares
Foreign Institution Investor
6581 from public shares
Public shares 20
from paid capital Domestic Investor
3419 from public shares
Domestic Investor
2740 from public shares
37
No Country Share
1 INDONESIA 3419402 LUKSEMBURG 161267
3 AMERIKA 1341304 NORWEGIA 1111345 SIPRUS 838626 FINLANDIA 577797 VIRGIN ISLAND 41059
8 INGGRIS 223339 IRLANDIA 17073
10 AUSTRALIA 0964611 JEPANG 0839812 KANADA 05512
No Country Share
14 SWEDIA 0248915 SINGAPURA 0201816 CAYMAN ISLAND 0060317 GREENLAND 0033118 CINA 0019319 SWITSERLAND 0011320 KOREA SELATAN 0007421 FILIPINA 0002222 MALAYSIA 0001523 HONGKONG 0000824 JERMAN 00001
Total 100
STRENGTH OF INSTITUTIONS INVESTOR
38
Awards amp Achievements
The Most Trusted Banking in
Microfinance Services of The
Year 2015
Very Good Predicate for 2014
Financial Performance
Infobank Awards 2015
Bank Jatim Regional Banks with
excellent service of the year
2016
Excellence in Building and
Managing Corporate Image
Corporate Image Award 2015
The 1st Champion of Indonesia
Original Brand 2015
Top BPD HRampIT Management
2016
39
Investor Relations (IR)
Corporate Secretary
(031) 5310090 ext 469
Email irubankjatimcoid
Contact
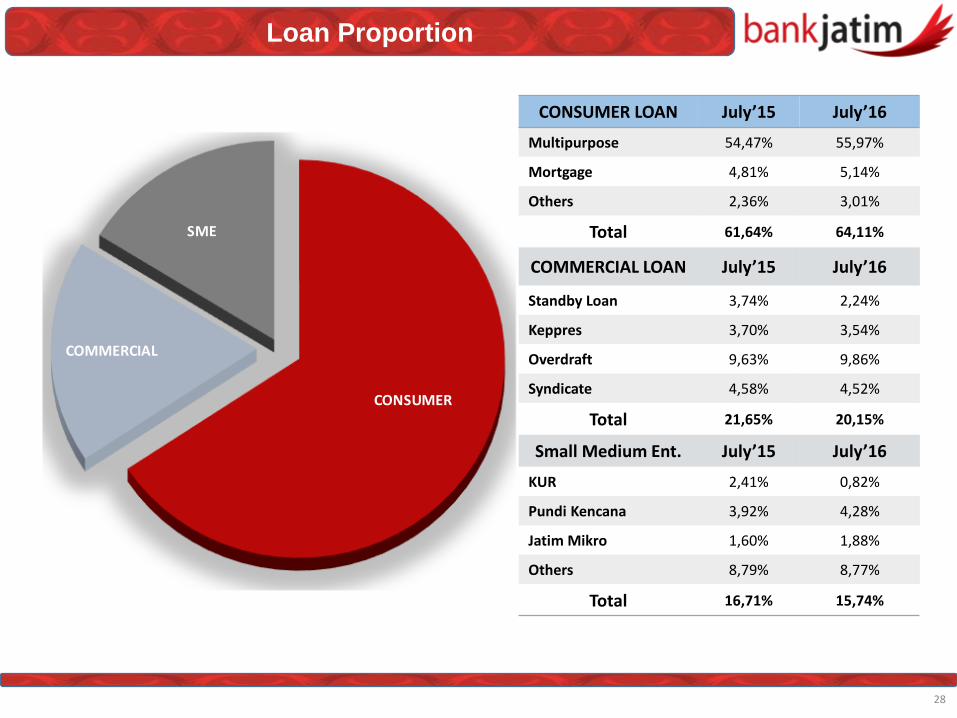

In Billion Rp
YoY
KUR
(6532)
Pundi
Kencana
1163
Mikro
2031
Others
200
32
Type Of Loan1218
1128
1058
893
735
689
601
451
347
258
239
693
747
796
950
1108
1123
1157
1178
1223
1273
1254
78
165
264
345
452
457
491
520
530
557
550
2214
2199
2186
2262
2395
2517
2461
2380
2407
2523
2568
1H14 9M14 FY14 3M15 1H15 7M15 9M15 FY15 3M16 1H16 7M16
SME Loan
KUR Pundi Kencana Mikro Others
33
Type Of Loan
26
22
93
26
06
47
25
96
58
26
17
30
26
36
14
26
39
07
25
45
01
25
34
43
25
37
33
25
35
85
85
98
96
44
87
30
71
94
96
70
11
5
82
83
64
64
02
91
60
94
88
45
9
51
43
9
86
42
7
49
43
2
81
45
2
44
44
1
49
41
6
35
41
8
61
42
3
00
42
2
37
1H14 9M14 FY14 3M15 1H15 9M15 FY15 3M16 1H16 7M16
Total Customer
Consumer Commercial SME
5947 6225 6436 652 6667 6797 7146 7271 7439 7406
58231 58311 5933
702662292
56868
68119
83319
63196 62194
9147 9637 10069 1028 10366 10669 10877 10767 10903 10916
1H14 9M14 FY14 3M15 1H15 9M15 FY15 3M16 1H16 7M16
Ticket Size
Consumer Commercial SME
34
STRENGTH
35
Strength Of Funding
517
460 477426
403435
463 480431 407 435
384 385 394 421
246
254 288
362358
241
250284 359
354368
384 363 372284
237 285 235212
239 237287
237 210 239197
232 252 234294
2002 2003 2004 2005 2006 2007 2008 2009 2010 2011 2012 2013 2014 2015 7M16
Time deposit Saving deposit Current account
448 453
300 253 302 318 321261
316 354 348268 301
368256 301 284 283
492 500
275239
310 328 331
258326
381 371
267345
395
250277 297 296
3M12 1H12 9M12 FY12 3M13 1H13 9M13 FY13 3M14 1H14 9M14 FY14 3M15 1H15 FY15 3M16 1H16 7M16
Cost of Fund(+) Local Government (-) Local Government
Description Details
Civil Servants (per December 2014) 426545
Multipurpose Customer (Civil Servants) 238965
5602
NPL 039 as of Julyrsquo 2016
36
Strength of Loan (Multipurpose Loan)
567 593 612 619 631 640
666 675 690 686
1H14 9M14 FY14 3M15 1H15 9M15 FY15 3M16 1H16 7M16
Multiguna Ticket Size (million) Rp
13864
14408
14849
15152
1560915794
1592416117
1649916394
1H14 9M14 FY14 3M15 1H15 9M15 FY15 3M16 1H16 7M16
Multiguna Loan Balance
( Billion Rp )
Foreign Institution Investor
7260 from public shares
Foreign Institution Investor
6581 from public shares
Public shares 20
from paid capital Domestic Investor
3419 from public shares
Domestic Investor
2740 from public shares
37
No Country Share
1 INDONESIA 3419402 LUKSEMBURG 161267
3 AMERIKA 1341304 NORWEGIA 1111345 SIPRUS 838626 FINLANDIA 577797 VIRGIN ISLAND 41059
8 INGGRIS 223339 IRLANDIA 17073
10 AUSTRALIA 0964611 JEPANG 0839812 KANADA 05512
No Country Share
14 SWEDIA 0248915 SINGAPURA 0201816 CAYMAN ISLAND 0060317 GREENLAND 0033118 CINA 0019319 SWITSERLAND 0011320 KOREA SELATAN 0007421 FILIPINA 0002222 MALAYSIA 0001523 HONGKONG 0000824 JERMAN 00001
Total 100
STRENGTH OF INSTITUTIONS INVESTOR
38
Awards amp Achievements
The Most Trusted Banking in
Microfinance Services of The
Year 2015
Very Good Predicate for 2014
Financial Performance
Infobank Awards 2015
Bank Jatim Regional Banks with
excellent service of the year
2016
Excellence in Building and
Managing Corporate Image
Corporate Image Award 2015
The 1st Champion of Indonesia
Original Brand 2015
Top BPD HRampIT Management
2016
39
Investor Relations (IR)
Corporate Secretary
(031) 5310090 ext 469
Email irubankjatimcoid
Contact

33
Type Of Loan
26
22
93
26
06
47
25
96
58
26
17
30
26
36
14
26
39
07
25
45
01
25
34
43
25
37
33
25
35
85
85
98
96
44
87
30
71
94
96
70
11
5
82
83
64
64
02
91
60
94
88
45
9
51
43
9
86
42
7
49
43
2
81
45
2
44
44
1
49
41
6
35
41
8
61
42
3
00
42
2
37
1H14 9M14 FY14 3M15 1H15 9M15 FY15 3M16 1H16 7M16
Total Customer
Consumer Commercial SME
5947 6225 6436 652 6667 6797 7146 7271 7439 7406
58231 58311 5933
702662292
56868
68119
83319
63196 62194
9147 9637 10069 1028 10366 10669 10877 10767 10903 10916
1H14 9M14 FY14 3M15 1H15 9M15 FY15 3M16 1H16 7M16
Ticket Size
Consumer Commercial SME
34
STRENGTH
35
Strength Of Funding
517
460 477426
403435
463 480431 407 435
384 385 394 421
246
254 288
362358
241
250284 359
354368
384 363 372284
237 285 235212
239 237287
237 210 239197
232 252 234294
2002 2003 2004 2005 2006 2007 2008 2009 2010 2011 2012 2013 2014 2015 7M16
Time deposit Saving deposit Current account
448 453
300 253 302 318 321261
316 354 348268 301
368256 301 284 283
492 500
275239
310 328 331
258326
381 371
267345
395
250277 297 296
3M12 1H12 9M12 FY12 3M13 1H13 9M13 FY13 3M14 1H14 9M14 FY14 3M15 1H15 FY15 3M16 1H16 7M16
Cost of Fund(+) Local Government (-) Local Government
Description Details
Civil Servants (per December 2014) 426545
Multipurpose Customer (Civil Servants) 238965
5602
NPL 039 as of Julyrsquo 2016
36
Strength of Loan (Multipurpose Loan)
567 593 612 619 631 640
666 675 690 686
1H14 9M14 FY14 3M15 1H15 9M15 FY15 3M16 1H16 7M16
Multiguna Ticket Size (million) Rp
13864
14408
14849
15152
1560915794
1592416117
1649916394
1H14 9M14 FY14 3M15 1H15 9M15 FY15 3M16 1H16 7M16
Multiguna Loan Balance
( Billion Rp )
Foreign Institution Investor
7260 from public shares
Foreign Institution Investor
6581 from public shares
Public shares 20
from paid capital Domestic Investor
3419 from public shares
Domestic Investor
2740 from public shares
37
No Country Share
1 INDONESIA 3419402 LUKSEMBURG 161267
3 AMERIKA 1341304 NORWEGIA 1111345 SIPRUS 838626 FINLANDIA 577797 VIRGIN ISLAND 41059
8 INGGRIS 223339 IRLANDIA 17073
10 AUSTRALIA 0964611 JEPANG 0839812 KANADA 05512
No Country Share
14 SWEDIA 0248915 SINGAPURA 0201816 CAYMAN ISLAND 0060317 GREENLAND 0033118 CINA 0019319 SWITSERLAND 0011320 KOREA SELATAN 0007421 FILIPINA 0002222 MALAYSIA 0001523 HONGKONG 0000824 JERMAN 00001
Total 100
STRENGTH OF INSTITUTIONS INVESTOR
38
Awards amp Achievements
The Most Trusted Banking in
Microfinance Services of The
Year 2015
Very Good Predicate for 2014
Financial Performance
Infobank Awards 2015
Bank Jatim Regional Banks with
excellent service of the year
2016
Excellence in Building and
Managing Corporate Image
Corporate Image Award 2015
The 1st Champion of Indonesia
Original Brand 2015
Top BPD HRampIT Management
2016
39
Investor Relations (IR)
Corporate Secretary
(031) 5310090 ext 469
Email irubankjatimcoid
Contact

Foreign Institution Investor
7260 from public shares
Foreign Institution Investor
6581 from public shares
Public shares 20
from paid capital Domestic Investor
3419 from public shares
Domestic Investor
2740 from public shares
37
No Country Share
1 INDONESIA 3419402 LUKSEMBURG 161267
3 AMERIKA 1341304 NORWEGIA 1111345 SIPRUS 838626 FINLANDIA 577797 VIRGIN ISLAND 41059
8 INGGRIS 223339 IRLANDIA 17073
10 AUSTRALIA 0964611 JEPANG 0839812 KANADA 05512
No Country Share
14 SWEDIA 0248915 SINGAPURA 0201816 CAYMAN ISLAND 0060317 GREENLAND 0033118 CINA 0019319 SWITSERLAND 0011320 KOREA SELATAN 0007421 FILIPINA 0002222 MALAYSIA 0001523 HONGKONG 0000824 JERMAN 00001
Total 100
STRENGTH OF INSTITUTIONS INVESTOR
38
Awards amp Achievements
The Most Trusted Banking in
Microfinance Services of The
Year 2015
Very Good Predicate for 2014
Financial Performance
Infobank Awards 2015
Bank Jatim Regional Banks with
excellent service of the year
2016
Excellence in Building and
Managing Corporate Image
Corporate Image Award 2015
The 1st Champion of Indonesia
Original Brand 2015
Top BPD HRampIT Management
2016
39
Investor Relations (IR)
Corporate Secretary
(031) 5310090 ext 469
Email irubankjatimcoid
Contact

39
Investor Relations (IR)
Corporate Secretary
(031) 5310090 ext 469
Email irubankjatimcoid
Contact