Embed Size (px)
Citation preview

Overview and Status of the National Ignition
Campaign on the NIF
Presentation to
Ignition Science Workshop
May 23-24, 2012
John Lindl NIF Programs Chief Scientist
LLNL-PRES-558211

Moses_Rutherford_Labs_09_09_2011 2
Map

This work performed under the auspices of the U.S. Department of Energy by Lawrence Livermore National Laboratory under Contract DE-AC52-07NA27344
The National Ignition Facility
The capabilities of the laser, targets,
diagnostics, and experimental platforms
are now in place for the push to ignition

One of two laser bays
– looking toward the
switchyard and target
chamber
The NIF project was completed in March 2009 and initial
subscale experiments with 500 kJ to 1 MJ carried out with
minimal diagnostics in Aug-Nov 2009 demonstrated LPI
and radiation drive consistent with ignition in near
ignition scale hohlraums
NIF can now deliver 1.45 – 1.65 MJ, 420 TW of 3w light to
the target chamber in an ignition pulse meeting ignition
power balance requirements
We will be able to deliver its full design energy and
power of 1.8 MJ and 500 TW beginning in June 4
06/15
/11 Canadian Association of Physicists

Cryogenic fuel layers will be formed in a new target
positioner (cryo-tarpos) recently installed on NIF
December 2009 to September 2010 was
devoted to installing major infrastructure
and nuclear diagnostics: The CryoTarpos
supports formation of cryogenic fuel layers
outside the chamber prior to insertion into
target chamber center at shot time
5 5 06/15/11 Canadian Association of Physicists

THD fuel layers are formed with the target mounted
in a dedicated cryogenic target positioner thermally
isolated by a removable shroud
27850001 target in layering shroud
6
06/15
/11 Canadian Association of Physicists

Dante indicates that storm window is successfully
delivering the required drive in the foot
Foot of 110212 THD is significantly
lower than 101102 symcap
THD target with LEH storm window to
eliminate condensate
Need to compare foot with 100929
A multi-laboratory effort in fabrication has given NIF the
production capability for targets with unprecedented precision
7
“Storm windows” were
developed to cover the LEH in
order to prevent condensation
of residual chamber gas – one
of the challenges in early cryo-
layered targets

Thirty types of diagnostic
systems are planned for
the National Ignition
Campaign
Developing, installing, calibrating, and
performance testing NIF’s 50+ diagnostic
systems has been a major forcus of the
National Ignition Campaign (NIC)
One of two Dante soft
X-ray Spectrometers

There are multiple time scales for the use and
evolution of numerical models within the NIC
9
Experiments
Data
Specifications,
Playbooks
Scenario Development
Campaign Strategy – Sudoku
Preshot using ab initio model
prior to initial data
Data informed playbooks,
Preshot – Expected
performance informed by
data
Scenario development with
models modified to match
existing data
Specifications modified by
data
Data Modified Models
Equations
Algorithms
Databases
Computers
Models
Postshot using as-shot
conditions
Longer Term – Improvements to models
• DCA for hohlraum and non-local thermal
conduction now part of standard model
• Improvements to EOS, and NLTE for
ablator now under development
Updates to point design based on new data
• Revisions to CH point design
• Updated ignition designs using alternate
ablators (Be,HDC, B4C, Al) and modified
hohlraum geometry
Near Term – Shot-to-shot
during the Campaign

Summary of Ignition Campaign Status
10
Slower rise to peak power and longer ―no-coast‖
pulses result in lower hot spot adiabat and main
fuel rr at about 85% of the ignition goal
We are one year into the campaign to
carry out precision optimization of
ignition scale implosions
We have achieved hohlraum temperatures in
excess of the 300 eV ignition goal with hot spot
symmetry and shock timing near ignition specs
Mix performance boundary with more
mass remaining than the point design will
require thicker shells (+20-30%) to reach
ignition velocity without mix
Nuclear data indicates that long wavelength
variation in the main fuel density may be
contributing to performance degradation

Ignition Target designs have a number of
general features
Pure Au or U hohlraum with
Au surface layer
Laser Beams: 24 quads
through each LEH arranged
control symmetry
Laser Entrance Hole
sized to balance LPI and
radiative losses –
56–60% of LEH diameter He fill to control symmetry and
minimize LPI
5.44 mm
Capsule fill tube ~10 μm
Capsule with low-z
ablator (CH, Be, or
HDC*) and cryo fuel
layer
*High Density Carbon
11
06/15
/11 Canadian Association of Physicists

The initial ignition campaign is using a CH capsule
12
Silicon doped layers reduce X-ray preheat at
ablator-DT interface to make favorable Atwood
number during acceleration to control mix
Ablator thickness is adjusted to vary sensitivity to
mix of fuel and ablator resulting from ablation front
instability growth
~1110
µm
~70 µm
THD
~195 µm
Edwards, IFSA, Bordeaux, September 14th, 2011 NIF-xxx-xxxxx.ppt
CH
Si-doped
layers (2-
4% peak)
• Amorphous material with no
crystal structure issues
• Large data base from the Nova
and Omega (LLE) lasers
• Reduced Facility impact relative
to Be
• All of the diagnostics and
infrastructure needed for
optimizing ignition implosions
are essentially independent of
capsule ablator

THS
1D quantities, e.g:
Peak Laser Power
Foot Laser Power
Shock timing
3D quantities, e.g:
Ice Perturbations
Capsule Roughness
Intrinsic Asymmetry
Laser Power Balance …
>200
actionable
target design
parameters The NIC aggregates the impact
of hundreds of actionable input
variables into their impact on
four key implosion input
variables And assess performance by
measuring improvements to the
key compression variables
With the goal of
alpha heating and
burn
To achieve ignition, the NIC must generate the data
needed to optimize the principal characteristics of
an ICF implosion
Lindl—NNSA Review, January 2011 13
NIf-
0111-
2080
0.ppt
• The key variables for ICF have been known for decades
• Since NIF was first proposed, we have worked to better
quantify the specifications for ignition at the megajoule scale
Velocity (V)
Hot spot Shape (S)
Ignition Hot spot
rR
TotalrR
Mix (M)
Adiabat

From September 2010 to April 2011, the NIC focused
on validating a series of experimental platforms to
optimize the capsule shape, adiabat, velocity, and mix
Velocity
Shape
Adiabat
Mix
a
M S
V
RHS
DT Hot
spot
DT Ice
Ge Spectra
X-ray Backlit
Shell Trajectory
X-ray or
neutron core
image
Ablator
VISAR
interferometry
Soft X-ray
Reemission

The National Ignition Campaign (NIC) is designed to
generate the data needed for an optimal implosion in the
most efficient sequence of experiments
Observables
Adiabat
Picket P2 Reemit
Shock velocity/P2 Keyhole, THD/DT,
CompR, ConAW Shock timing/dsr/rr
Shape
Peak P2 Symmetry
capsule or
THD/DT and
CompR
Peak P4
Peak m4
Velocity Implosion velocity ConA, THDConA
Fuel
Mix
Residual mass
M-band Any implosion
Hot
spot
Mix
Growth factor Mixcap
Ge/Cu emission,
YoC THD
Platform
Experimental
Control
Parameters
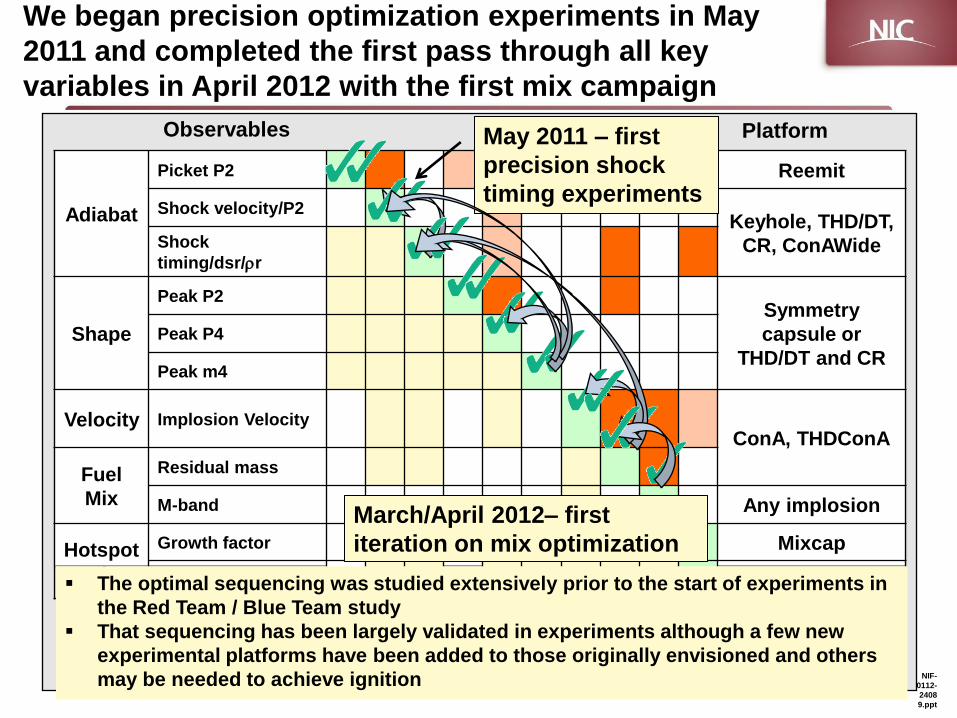
We began precision optimization experiments in May
2011 and completed the first pass through all key
variables in April 2012 with the first mix campaign
NIF-
0112-
2408
9.ppt
Observables
Adiabat
Picket P2 Reemit
Shock velocity/P2 Keyhole, THD/DT,
CR, ConAWide Shock
timing/dsr/rr
Shape
Peak P2 Symmetry
capsule or
THD/DT and CR
Peak P4
Peak m4
Velocity Implosion Velocity ConA, THDConA
Fuel
Mix
Residual mass
M-band Any implosion
Hotspot
Mix
Growth factor Mixcap
Dopant emission THD
Platform May 2011 – first
precision shock
timing experiments
The optimal sequencing was studied extensively prior to the start of experiments in
the Red Team / Blue Team study
That sequencing has been largely validated in experiments although a few new
experimental platforms have been added to those originally envisioned and others
may be needed to achieve ignition
March/April 2012– first
iteration on mix optimization

We have achieved the ignition goal of Tr > 300 eV with
coupling of 83 2% nearly independent of laser energy
up to 1.6 MJ
17
9.43 mm by 5.75 mm Hohlraum, 3.1 mm LEH
270
280
290
300
310
320
0.9 1.0 1.1 1.2 1.3 1.4 1.5
PeakTr(eV)
AbsorbedLaserEnergy(MJ)
DU
Au
Peak Tr vs Absorbed Laser Energy
420 TW
330 TW
Absorbed Fraction vs
Incident Laser Energy
0.75
0.80
0.85
0.90
1.1 1.2 1.3 1.4 1.5 1.6 1.7
AbsorbedFrac on
IncidentLaserEnergy(MJ)
17% LPI losses are about twice what was anticipated prior to first
experiments
Increased loss is consistent with improved understanding of the plasma
conditions resulting from the implementation of the DCA NLTE atomic
physics model and non-local electron transport which results in increased
importance of multi-quad overlap effects on LPI

Standard calculations overestimate laser entrance hole
closure by about 20%
18
Recent zoning studies indicate
that much of this
discrepancy could
be numerical
Heating of the
blowoff plasma by
various plasma
processes not
included currently
could help keep
LEH open

When corrected for laser entrance hole size, calculations
with the flux versus time needed to match implosion
trajectories, match the Dante peak flux to about 4%
NIF-1011-23498.ppt Landen - NNSA Ignition Review, Oct. 28, 2011
19
Shot
120205
15,000
7,500
Dan
te F
lux (
GW
/sr)
data
Calculation which
matches measured
implosion trajectory
(LEH corrected)
Standard calculations overestimate the measured
Dante flux by about 8% on average
— much of this difference may be explained by
numerical zoning effects in calculations
Observed shell trajectories are consistent with
about 4% less flux than observed on average
— NLTE effects in the ablator are predicted but
currently estimated to be small
Standard Hydra Calculation
Hydra Calculation modified to
match measured implosion
trajectory
Shot 120205
Dan
te/C
alc
ula
ted
Peak
Flu
x
1.0
0.9
1.1
1.2
0.8

Measured fluxes corrected for the observed LEH closure
provide the best estimate when comparing data to
calculations of the hohlraum drive and capsule response
Measured Dante fluxes are ~8% lower on average
than standard Hydra calculations
— much of this difference may be explained by
numerical zoning effects in calculations
Observed shell trajectories are responding as if the
flux were about 4% less than Dante on average
— NLTE effects in the ablator are predicted but
currently estimated to be small
Shot 120205
Dan
te/C
alc
ula
ted
Peak
Flu
x
1.0
0.9
1.1
1.2
0.8
Hydra Calculation modified to
match measured implosion
trajectory
Standard Hydra Calculation
Shot
120205
15,000
7,500
Dan
te F
lux (
GW
/sr)
Dante data
Calculation which
matches measured
implosion trajectory
(LEH corrected)

Q ~ [(w1- w2) - kA(CS - V) + in]-2
-100
-50
0
50
100
150
200
250
-40 -20 0 20 40
linner-louter [A]
Rela
tive e
nerg
y g
ain
[%
]
inner
cone
outer
cone
Crossed laser beams in the hohlraum
plasmas produce intensity modulations that
drive density modulations
• Density modulation (grating) produced in the plasma allows energy to be transferred between beams
• Adjusting the wavelength shift between beams allows us to control energy transfer between cones
• This process can work in both directions (into and out of the hohlraum).
k1
kA
k2
2 Lasers
k1, w1 , k2, w2
0 20 -
20

Reemit Target sets the cone power ratio for
the first 2 ns to ensure symmetric foot
drive
Observable:
Limb brightness vs angle
Bi sphere ―Reemit‖ replaces layered
capsule
0.7 keV X-ray
images
2 mm
Nov. 2010
Experimental Geometry

P2 Foot Picket Flux Asymmetry vs. Foot Inner Cone Fraction
Pole
hot
Waist
hot
15% P2
Tolerance
May 2011: Re-emit brightness set picket cone fraction to
1% in the Scale 544 hohlraums used before August 2011
May 2011
Experiments showed larger cross-beam transfer than estimated
using saturation parameter from peak power
Experiments are better matched with no saturation
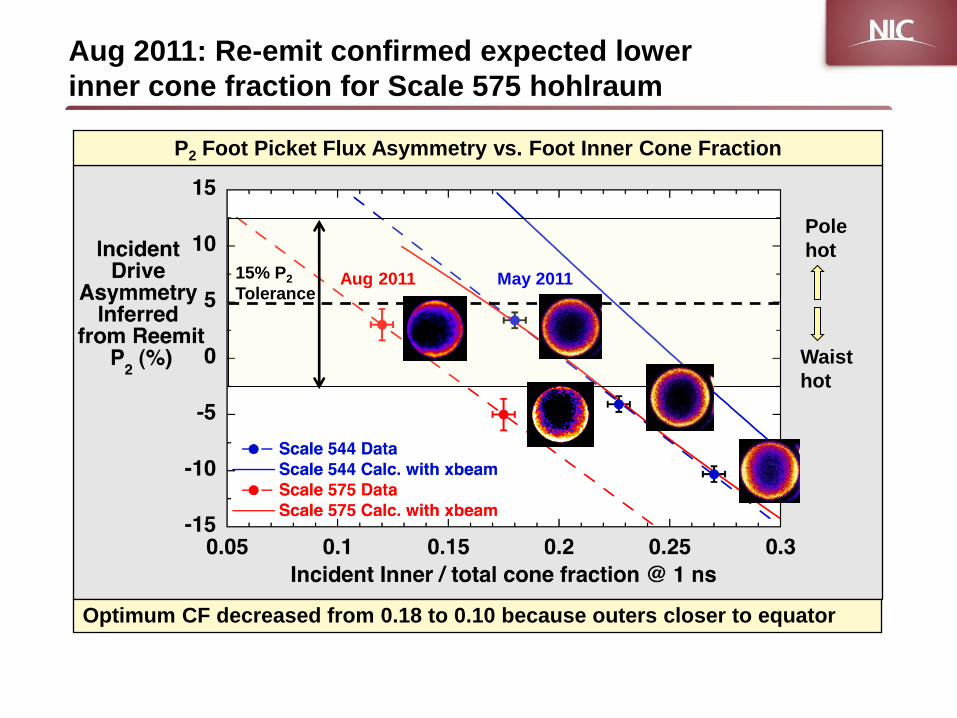
P2 Foot Picket Flux Asymmetry vs. Foot Inner Cone Fraction
Pole
hot
Waist
hot
15% P2
Tolerance
Aug 2011: Re-emit confirmed expected lower
inner cone fraction for Scale 575 hohlraum
Optimum CF decreased from 0.18 to 0.10 because outers closer to equator
May 2011 Aug 2011

Implosion symmetry at the peak of the laser pulse is
achieved by tuning the wavelength of the outer cone
25
First demonstrated in experiments at 500 kJ in 2009, tuning the Dl between inner and outer beams allows us to optimize implosion symmetry without changing the laser cone fraction
l1l2(Å) 0
0 P
2/P
0
-0.5
5
P2/P0 = -0.07, P4/P0 = -0.03
P2/P0 = -0.5, P4/P0 = 0.3
LASNEX scaling
60 mm
60 mm
P2/P0 versus Dl at 500 kJ scale
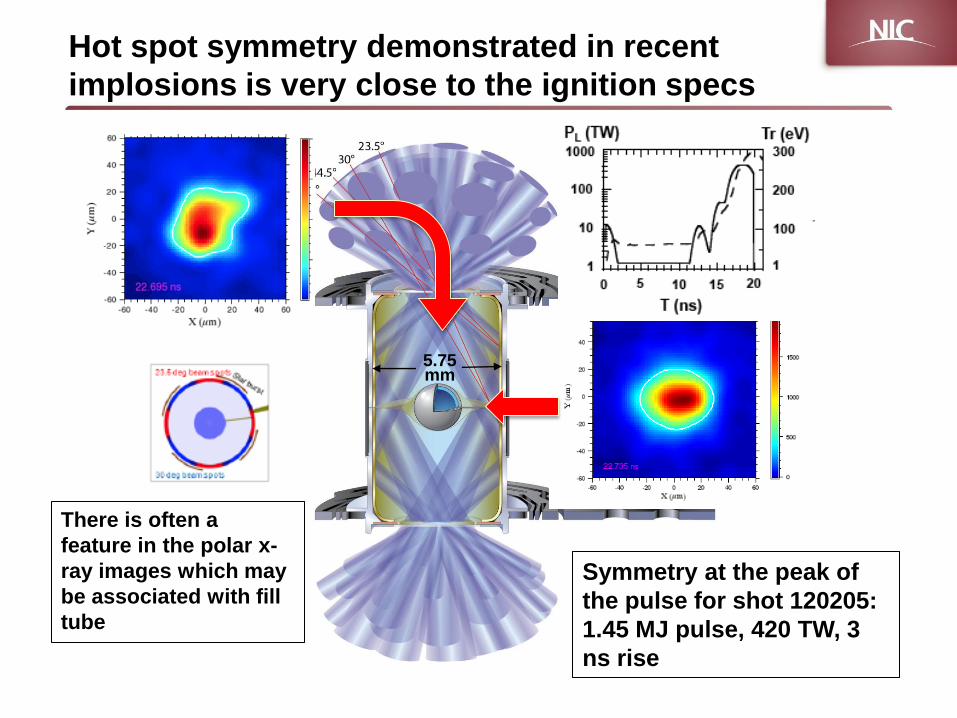
Hot spot symmetry demonstrated in recent
implosions is very close to the ignition specs
5.75 mm
Symmetry at the peak of
the pulse for shot 120205:
1.45 MJ pulse, 420 TW, 3
ns rise
There is often a
feature in the polar x-
ray images which may
be associated with fill
tube

Hot spot symmetry demonstrated in recent implosions is
very close to the ignition specs
5.75 mm
Time history of symmetry
for shot 120205: 1.45 MJ
pulse, 420 TW, 3 ns rise

Nuclear measurements indicate that the main fuel can
have large rR variations even when the hot spot
appears quite symmetric
28
Multiple pucks around chamber Count activation and analyze
(sometimes large asymmetry)
equator
pole
pole
Some shots show significant signal variations (high
rR on poles) – on a typical shot with rR~1 g/cm2 in
DT, about 20% of the neutrons are downscattered,
so a 10% variation in the measured primary yield
corresponds to a 50% rR variation (needs better
calibration for required accuracy)
rR variations also indicated by Neutron Time of
Flight (NTOF) and Magnetic Recoil Spectrometer
(MRS) data
Relative Yield
FNADS (Flange Nuclear Activation Detectors) are Zirconium threshold
detectors which measure the primary neutron yield

We are developing imaging diagnostics which will
give us improved shell-in-flight and compressed
fuel measurements
100
µm
1e16 W/cm2, 3w
Imploded THD fuel
scattering
60-200 keV
8 TW,
0.5 ns
8 TW,
0.5 ns
30 µm
tilted Au
wire
IT_9_THDCR_PQ N120114-005: THD(2%) IT_9_THDCR_PQ
R Tommasini
N120114-005: THD(2%)
Compton Radiography measurement of fuel rhor shape and uniformity using NIF 3w beams as backlighter driver
Campaign RI: Glenzer / Callahan
Platform RI: Tommasini
Shot RI: Tommasini / Doeppner Designer:
Milovich / Hatchett
Objectives:
1) Obtain 2 radiographs of THD implosion
within ± 50 ps of BT+100ps qualifying
technique
2) Measure average fuel rhor to ± 10% and
radius to ± 10%
3) Obtain fuel shape and rhor uniformity
information at 30 ! m resolution
4) Check for left/right asymmetry due to fill
tube
5) Baseline is last DT shot
What would we do with results:
Further constrain fuel assembly + hot spot
model; proceed to higher resolution CR
Primary diagnostic: hGXI
• The 4 strips are co-timed to minimize
crosstalk and maximize radiograph time
overlap
• Expected 2 radiographs separated in
time by ~34ps due to BL parallax
N120114-005 hGXI shows high level
of ungated background.
t
expected 2 frames 40-80 ps
Gated MCP Demonstrated
at OMEGA
Compton radiography – DT fuel at stagnation
2D absorption radiography – shell in-flight
Density
during
implosion
time
Simulated images
Upgrade has 2 strips
400 µm
Fuel density
at
stagnation
Simulated
radiographs
10-15 keV

The mirrored keyhole targets are used to optimize
shock timing and velocity as well as the pole to
waist asymmetry for all 4 shocks in the pulse
CH-D2
N110823 VISAR-B data
Mirror Pole
Equator
1-2 2-3 3-4
Cone tip
Cone tip
blanking
D2 filled
cone
Shock transits from
ablator into D2 ―fuel‖
Shocks catch-
up
in D2 ―fuel‖
time
Calculations show that asymmetric 2nd and 3rd shocks give
rise to symmetry swings in the imploded core

Shock asymmetries can lead to P2 swings in core
shape and fuel rr nonuniformities
Landen - NNSA Ignition Review, Oct. 28, 2011 NIF-1011-23498.ppt
Symcap Shape rr
Future: Check if reduced P2 swings
in final core compression phase
31
THD
0.0
0.5
1.0
-0.50
-0.25
0.00
0.25
0.50
23.3 23.5 23.7 23.9
P2/P0
t (ns)
Example of measured THD core X-ray
P2/P0 evolution near bangtime
Emissivity
BT

Mirrored keyhole experiments were used to improve
the shock symmetry
32
N111027 VISAR data N110823 VISAR data
equator
pole equator
pole
Before 2nd and 3rd cone
fraction tuning
After 2nd and 3rd cone
fraction tuning
NIF-0112-24076s2.ppt Callahan—NIC Status Update, January 31, 2012
2nd and 3rd shocks out of spec 2nd and 3rd shocks in spec

Swings in symmetry are reduced
after 2nd and 3rd cone fraction optimization
N111029 THD
Before 2nd and 3rd cone
fraction tuning
After 2nd and 3rd cone
fraction tuning
33 NIF-0112-24076s2.ppt Callahan—NIC Status Update, January 31, 2012
0.00
0.20
0.40
0.60
0.80
1.00
1.20
-0.70
-0.60
-0.50
-0.40
-0.30
-0.20
-0.10
0.00
0.10
0.20
21.80 22.00 22.20 22.40 22.60 22.80
Rela
tive
Em
iss
ion
P2
/P0
Time (ns)
GaussBlur
Rolling Ball
RB Peak
Low Pass
Emission
N110904 DT
Large swing in P2 vs time Modest swing in P2 vs time

The first tests of the impact of variations in the
temporal shape of the peak power pulse changed
the rate of rise to peak power
Keyhole
target
VISAR streak
time
Slower rise pulses are predicted to be less
sensitive to fluctuations in drive in 4th rise
NIF-0112-24081.ppt Edwards - NNSA Ignition Status Update, Jan. 31, 2012 34
4th pulse rise variation 4th shock velocity
1ns (fast)
2ns (nominal)
3ns (slow)
1ns (fast)
2ns (nominal)
3ns (slow)

0
50
100
150
200
250
0 1 2 3 4
HotSpotAdiabat
4thpulserise me(ns)
Slower rise 4th pulses have produced hot spot
adiabats closer to ignition goals
Too hot
and
tenuous
Colder and
denser
4th pulse shapes with different rise times Hot spot adiabat vs. 4th pulse rise time
1ns 2
3ns
As a result of these tests, we adopted the slower ―3ns rate of rise‖ as
the primary pulse shape through April 2012
Hot
spot
Pt design
(370 km/s)

Backlit Capsule sets peak power and capsule ablator
thickness (trading off velocity vs mix susceptibility)
Technique measures shell radius, velocity,
rR profile, and remaining ablator mass
9 keV gated radiograph Capsule backlit by x-rays from
separate laser plasma
Zn foil
ablator
limb fiducial
wire
time
radius
Edwards—National Ignition Campaign Update, LPC May 2nd, 2012 NIF-0000-00000.ppt
Until March 2012, implosion
kinematics were measured using
gated backlit radiography
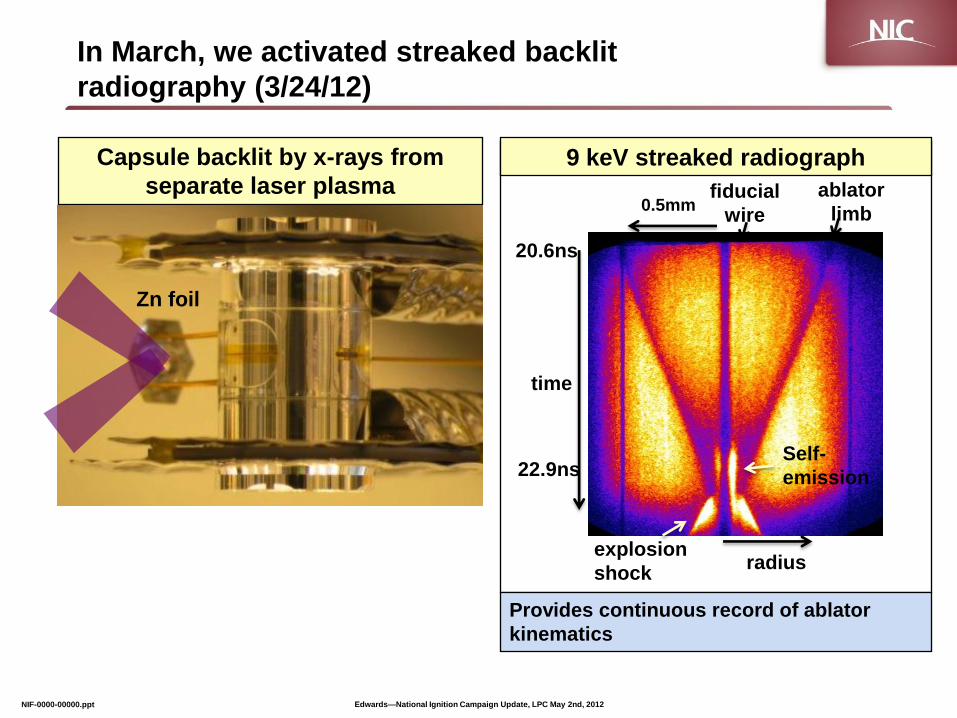
In March, we activated streaked backlit
radiography (3/24/12)
Capsule backlit by x-rays from
separate laser plasma
Zn foil
Provides continuous record of ablator
kinematics
9 keV streaked radiograph
ablator
limb fiducial
wire
time
radius
Self-
emission
explosion
shock
0.5mm
20.6ns
22.9ns
Edwards—National Ignition Campaign Update, LPC May 2nd, 2012 NIF-0000-00000.ppt

0
50
100
150
200
250
300
350
400
450
0
200
400
600
800
1000
1200
15 16 17 18 19 20 21 22 23
LaserP
ower(TW
)CoMRad
ius(um)
Time(ns)
RadiusandlaserpowerforDUat320TW,1.53MJ
DTDU,RadiusCoM(um)
RCM_N120122_wBSXB
Laserpower(TW)
LaserPower(420TW)
In March, experiments moved to longer ―no-coast‖ pulse
to avoid capsule decompression prior to stagnation
38
Previous laser pulse turns off
before capsule fully committed
Edwards, IFSA, Bordeaux, September 14th, 2011 NIF-xxx-xxxxx.ppt
New longer,lower power
prevents decompression, and
maintains velocity
Simulated capsule center of mass radius vs time
Capsule
c.o.m.
radius

“No Coast‖ behavior: Ablator stays compressed by
extending pulse out to r = 300 µm
39 5/24/2012
Coast vs No coast
X-ray cores
No Coast core size is
13% smaller
~50% higher pressure
P0 = 54 µm
P0 = 47 µm
Ablator width vs. time
Extened
pulse
P ~ rv2 R = 200 µm
Maintaining the drive prevents shell from
decompressing -> higher stagnation pressure

0
0.01
0.02
0.03
0.04
0.05
0.06
0.07
0.08
0 5 10 15 20 25 30
Feb-March 2012 Campaigns increased down
scattered neutron ratio (dsr) ~ rR / 20
ds
r
Shot
Pt design goal
adiabat
2XSi
no
coast
Recent improvement attributed to reduction in coasting (longer laser pulse)
and reduction in interface mix (2XSi dopant in ablator reducing preheat)
Downscattered neutron ratio ~ rR/21 g/cm2
N110914 N120205
1.0
1.5
1.25
0.5
N120321
rR
(g
/cm
2)
velocity shape pressure mix comm
Shock
timed
campaign

Edwards - NNSA Ignition Status Update, Jan. 31, 2012 NIF-0112-24081.ppt
December
2011 1.45MJ
Fuel rr is now at about 85% of the ignition point
design but we need to increase yields a factor of 5-10
to get into the strongly self-heated regime
March 2012
1.5MJ

We have developed a standardized approach for
generating 1D capsule drives used in
calculating cryo-layered capsule performance
This approach allows us to explore the incremental
differences between the models and the data as we
move through the implosion process and to correct
for those differences as we move forward
The radiation drive is modified so
that the calculation matches the
visar and Convergent Ablator Data
Tr
(eV
)
100
200
300
0 0 5 10 15 20
Time (ns)
Time (ns)
Time (ns)
Ve
loc
ity (
km
/se
c)
200
100
50
20
10
Ra
diu
s (m
m)
1000
500
0 16 18 20 22
20 18 16 14

When the drive is adjusted to match the keyhole data and
the shell radius versus time, the remaining mass and
shell thickness are also matched within the error bars
Tr
(eV
)
100
200
300
Ma
ss
Avg
Ra
diu
s (m
m)
500
1000
Re
ma
inin
g M
as
s F
rac
tio
n
0.8
0.6
0.4
0.2
0.0
0
Time (ns) Mass Averaged Radius (mm)
Sh
ell T
hic
kn
ess (m
m)
0 500 1000
0 500 1000
N120126
Standard Hydra
Adjusted Drive
16 18 20 22
20 15 10 5 0
0
50
100
0

Calculations of layered implosions with these
modified drives match much of the observed data but
typically over estimate yields by a factor of several
Calculations do not include the known 3D long wavelength
asymmetry in the capsule, hohlraum, and laser power
3D calculations to mode 100 are under development
(To mode 100)
Den
sit
y (
g/c
m3)
Rad
ius (m
m)
-50
+50
800
500
300
100

We have just completed the first iteration on a mix
campaign
NIF-
0112-
2408
9.ppt
Observables
Adiabat
Picket P2 Reemit
Shock velocity/P2 Keyhole, THD/DT,
CR, ConAWide Shock
timing/dsr/rr
Shape
Peak P2 Symmetry
capsule or
THD/DT and CR
Peak P4
Peak m4
Velocity Implosion Velocity ConA, THDConA
Fuel
Mix
Residual mass
M-band Any implosion
Hotspot
Mix
Growth factor Mixcap
Dopant emission THD
Platform May 2011 – first
precision shock
timing experiments
DT
CHCu0.1
CHSi(x%)Ge0.1
CH
March/April
2012

CH Ablation driven implosions follow a rocket curve
which allows us to explore mix versus velocity
NIF-1111-23708.ppt
Peak center of mass Fuel Velocity vs Ablator Mass
Remaining in convergent ablator symcaps
Capsule drive in the
simulations are adjusted
to match the keyhole
shock timing data and the
convergent ablator radius
versus time
Data is estimated to have
1% less mass remaining
at a given velocity than
the 1D simulations
We are exploring whether
hydro instability in the
imploding shell
contributes to this
difference Fraction of shell mass remaining at 300 mm
Cen
ter
of
Mass V
elo
cit
y a
t 300 m
m

Calculations of the convergent ablator
experiments are used to assess the velocity and
remaining mass in cryo layered implosions
NIF-1111-23708.ppt
We find a mix performance
boundary at 20-40% more
mass remaining than that
calculated for the point
design
Peak Fuel Velocity vs Ablator Mass
Remaining for cryo-layered implosions
Pt design
Remaining ablator mass fraction at 300 mm
Remaining ablator mass (mg) at 300 mm
0.25 0.30 0.35 0.40 0.20
Simulation

We find a fairly sharp performance boundary with ~20-
40% more ablator mass remaining than that for the point
design
DT Yield vs. ablator velocity or ablator mass left
195µm ablator (no-coast slow rise pulse)
320 340 260 360 300 280 Velocity (km/s)
Typical 1D
simulation
NIF-0000-00000.ppt Edwards—National Ignition Campaign Update, May 4th, 2012
Point Design
Mass Remaining
0.25 0.30 0.35 0.40 0.45 0.20 0.15

Implosions with coasting decompress and appear to have
a mix performance threshold at lower mass remaining,
but get much lower rR and a lower fraction of 1D yield
320 340 260 360 300 280 Velocity (km/s)
Typical 1D
simulation
DT Yield vs. ablator velocity or ablator mass left
195µm ablator
Low rR
―coasters‖
Edwards—National Ignition Campaign Update, LPC May 2nd, 2012 NIF-0000-00000.ppt
0.25 0.30 0.35 0.40 0.45 0.20 0.15
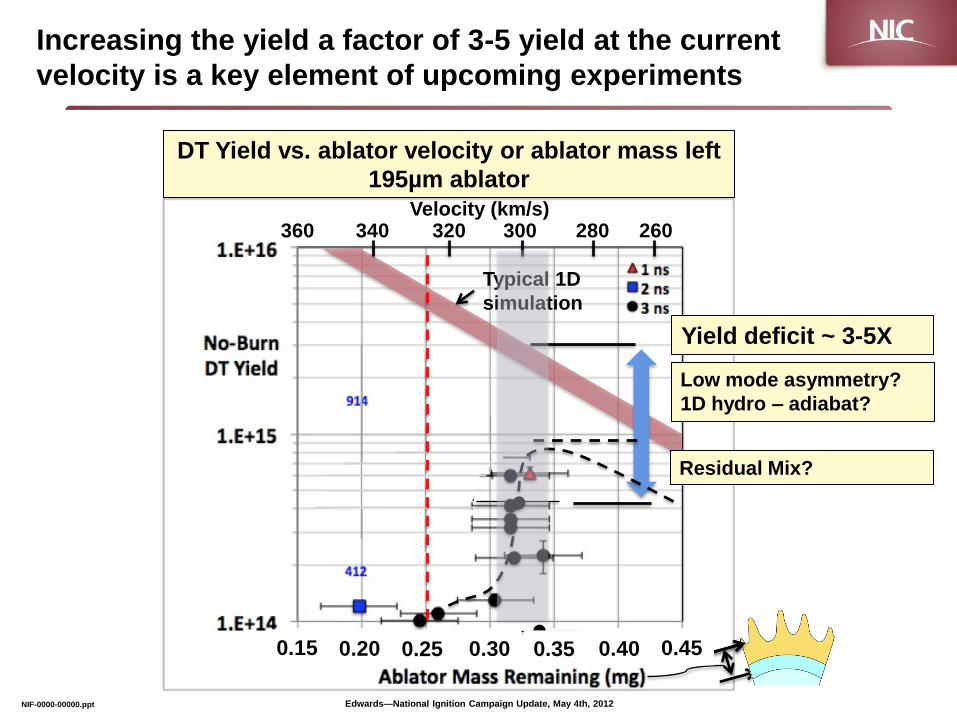
Increasing the yield a factor of 3-5 yield at the current
velocity is a key element of upcoming experiments
DT Yield vs. ablator velocity or ablator mass left
195µm ablator
320 340 260 360 300 280 Velocity (km/s)
Typical 1D
simulation
Low mode asymmetry?
1D hydro – adiabat?
Residual Mix?
Yield deficit ~ 3-5X
NIF-0000-00000.ppt Edwards—National Ignition Campaign Update, May 4th, 2012
0.25 0.30 0.35 0.40 0.45 0.20 0.15

To get to the point design velocity, we need to increase
velocity while keeping mass remaining ―mix safe‖
51
Vimp ~ √(ZTr/A)ln(M0/Mr)
Per Rocket Model:
+20% Vimp, same Mr:
+20-30% M0 (+40 to 60 µm)
+10% Tr (290 to 320 eV)
Same DU hohlraum:
+40-50% Peak Power
(320 to 450-500 TW)
+0.4-0.5 MJ (1.9 to 2 MJ)
Peak Fuel Velocity vs Ablator Mass
Remaining for cryo-layered implosions
Pt design
Remaining ablator mass fraction at 300 mm
Remaining ablator mass (mg) at 300 mm
0.25 0.30 0.35 0.40 0.20
Simulation Mix
Safe (?)
Improve capsules to
reduce seeds
Measure RT and RM
growth to identify ways
to reduce growth
Reduce low mode
asymmetry to minimize
―thin spots‖ in fuel

Summary of Ignition Campaign Status
52
Slower rise to peak power and longer ―no-coast‖
pulses result in lower hot spot adiabat and main
fuel rr at about 85% of the ignition goal
We are one year into the campaign to
carry out precision optimization of
ignition scale implosions
We have achieved hohlraum temperatures in
excess of the 300 eV ignition goal with hot spot
symmetry and shock timing near ignition specs
Mix performance boundary with more
mass remaining than the point design will
require thicker shells (+20-30%) to reach
ignition velocity without mix
Nuclear data indicates that long wavelength
variation in the main fuel density may be
contributing to performance degradation
These areas plus
the temporal history
of the main pulse
will be the focus of
ignition experiments
moving forward


Streaked X-ray Detector
with pinhole snout
Static X-ray
Imager
Target Positioner
Near Backscatter
Imager Scatter
Plate
Optics Inspection Camera
Inside of the NIF chamber: NIF is taking advantage of decades of
ICF research to field a sophisticated array of diagnostics - 50+
systems currently collecting more than 300 channels of Optical,
X-ray, and Nuclear data
54 06/15/11 Canadian Association of Physicists