Embed Size (px)
Citation preview
at SciVerse ScienceDirect
Energy 42 (2012) 68e80
Contents lists available
Energy
journal homepage: www.elsevier .com/locate/energy
Overview and performance assessment of the clustering methods for electricalload pattern grouping
Gianfranco Chicco*
Dipartimento di Ingegneria Elettrica, Politecnico di Torino, Corso Duca degli Abruzzi 24, I-10129 Torino, Italy
a r t i c l e i n f o
Article history:Received 4 September 2011Received in revised form18 December 2011Accepted 22 December 2011Available online 24 January 2012
Keywords:ClusteringCustomer categorisationElectrical consumerLoad patternDemand profileClustering validity indicator
* Tel.: þ39 011 090 7141; fax: þ39 011 090 7199.E-mail address: [email protected].
0360-5442/$ e see front matter � 2011 Elsevier Ltd.doi:10.1016/j.energy.2011.12.031
a b s t r a c t
In the current structure of the electricity business, distribution and supply services have been unbundledin many jurisdictions. As a consequence of unbundling, electricity supply to customers is now providedon a competitive basis. In this context, the electricity suppliers need to get accurate information on theactual behaviour of their customers for setting up dedicated commercial offers. Customer grouping onthe basis of consumption pattern similarity is likely to provide effective results. This paper provides anoverview of the clustering techniques used to establish suitable customer grouping, included in a generalscheme for analysing electrical load pattern data. The characteristics of the various stages of thecustomer grouping procedure are illustrated and discussed, providing links to relevant literature refer-ences. The specific aspect of assessing the performance of the clustering algorithms for load patterngrouping is then addressed, showing how the parameters used to formulate different clustering methodsimpact on the clustering validity indicators. It emerges that the clustering methods able to isolate theoutliers exhibit the best performance. The implications of this result on the use of the clustering methodsfor electrical load pattern grouping from the operator’s point of view are discussed.
� 2011 Elsevier Ltd. All rights reserved.
1. Introduction
Enhanced knowledge on the shape of the electricity consump-tion can be decidedly useful to deal with effective management oflocal generation and loads for energy system planning and opera-tion [1e6]. The attention towards the nature of the electricityconsumption is becoming increasingly high, also owing to avail-ability of advanced technology for load control and to emergingopportunities for flexible demand management, producing incen-tives and rewards to the participating customers [7e10].
In most restructured electricity markets, the distribution andsupply services have been unbundled. The electricity suppliers arenow operating within a competitive environment, with somedegrees of freedom in formulating the tariff offers, provided thattheir offers meet the requirements set by the regulatory authoritiesin the form of price or revenue caps [11,12]. Each tariff is formulatedwith reference to a specific customer category, defined by a series oftechnical and economic attributes.
Conceptually, electricity customer categorisation could followthe rules of segmentation referring to the commercial types ofactivity, as established for instance by the national institutes of
All rights reserved.
statistics. However, the load patterns of the customers belonging tothe same type of activity or associated to the same commercial codemay exhibit large differences [13,14]. As such, categorisations basedon the type of activity and on commercial codes are generally notefficient for representing the specific aspects of the electricityconsumption. The distinction can then be limited to a few macro-categories (e.g., residential, industrial, commercial, or other specificcategories such as electric lighting and traction). Further identifi-cation of some “external” features can be useful to obtain a morerefined customer partitioning into macro-categories. Possibleexternal features are the rated values of electrical quantities (e.g.,the contract power and the supply voltage level), and other infor-mation such as the annual active and reactive energy (maximum,minimum, average value and standard deviation), the utilisationlevel (defined as the energy consumption to rated power ratio), andthe power factor. Moreover, it is possible to build separate modelsfor weather-dependent loads. Using macro-categories, the numberof load patterns to be handled together within eachmacro-categoryby the categorisation methods is reduced with respect to the wholeset of electricity customers, making the calculation proceduresmore affordable.
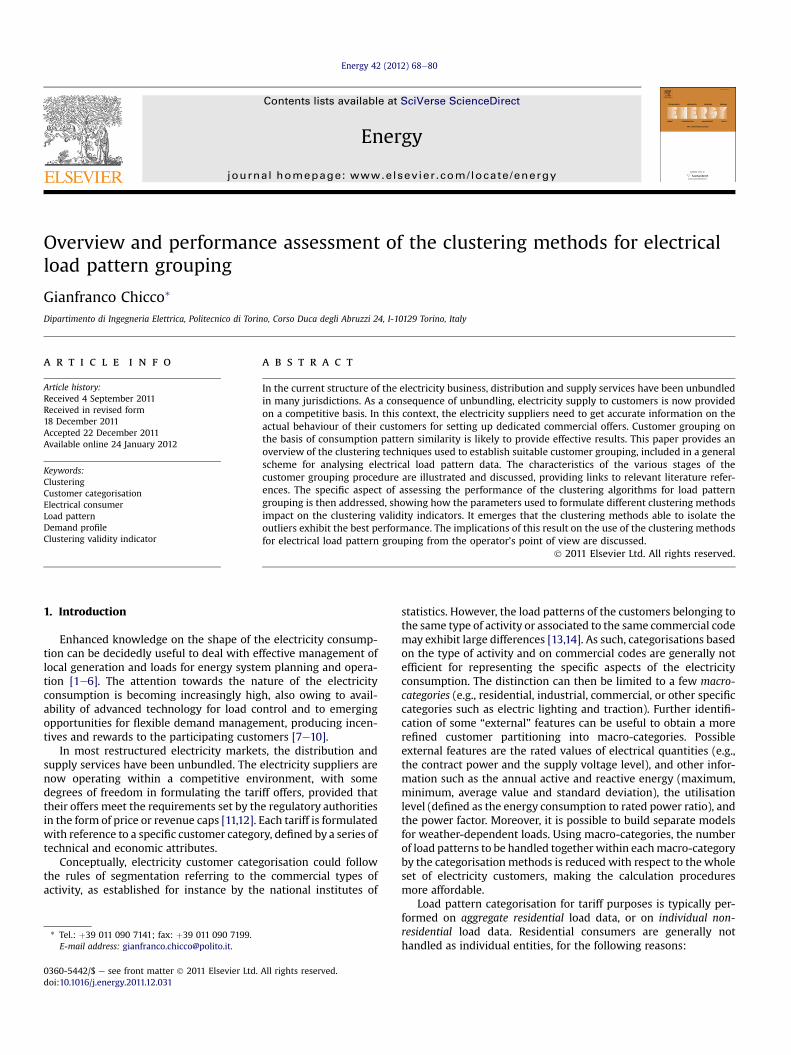
Load pattern categorisation for tariff purposes is typically per-formed on aggregate residential load data, or on individual non-residential load data. Residential consumers are generally nothandled as individual entities, for the following reasons:
PRE-CLUSTERING PHASE- selection of the H representative features- load pattern data processing to build the M×H input
data set for the specified loading condition
CLUSTERING PHASE- formation of the RLP clusters by using the selected
algorithm- centroid formation by using the customer class
composition and the time-domain data - computation of the clustering validity indicators to
assess clustering effectiveness
DATA GATHERING AND PROCESSING- load pattern data measurement of the M customers in
a specified loading condition- bad data detection and elimination
POST-CLUSTERING PHASE- formation of the customer classes on the basis of the
attributes of the customers grouped in the clusters- determination of the final load profiles for each
customer class in the specified loading condition- calculation of the global power and energy
information for the customer classes for tariff setting purposes
Fig. 1. The electrical load pattern categorisation procedure.
G. Chicco / Energy 42 (2012) 68e80 69
� the consumption pattern of individual residential loads variesin function of the number of persons composing the family, aswell as their activity, age and lifestyle [15e17]; the character-isation of residential customers by taking into account theexpected load pattern of each single customer would requireperforming a detailed statistical analysis based on the severalfactors affecting the energy use in a family [18e20]; however,the variation of the individual residential customer load at eachhour of the day, mainly conditioned by the occasional use ofa few facilities with relatively large power consumption (e.g.,washing machine, electrical oven, and so forth) [21], is so largeto make it impractical to perform statistics of the load powerreferring to the same moment in time;
� the electrical distribution system lines starting from the MV/LVsubstation do not feed the residential loads directly, but eachdistribution system feeder supplies an aggregated load; in thepresence of a significant number (e.g., a few dozens or more) ofresidential customers, the diversity of energy use for eachcustomer makes the aggregate load pattern much smootherthan the pattern of the individual residential load; hence, whilethe load pattern of the individual residential load is ratherunpredictable, the time evolution of the aggregated loadpatterns can be predicted to a relatively good extent [20].
For non-residential customers, electrical load pattern groupingis carried out with the main objective of identifying a suitablepartitioning of the load patterns into subsets of customersdepending on the load pattern shape. Dedicated research has beendeveloped in the last decade to study grouping procedures andalgorithms. Starting from an initial pre-defined number of non-residential macro-categories, for each macro-category it ispossible to consider the load pattern data gathered for a set ofcustomers for a long time period (one year, or more). Two types ofgrouping emerge:
1. longitudinal grouping, aimed at establishing which periods ofthe year are consistent with each other in terms of load patternshape; the outcomes of this kind of analysis are useful toidentify the time periods with similar consumption character-istics (e.g., weekdays and weekend days, defined for differentperiods of the year in order to take into account seasonalityissues, also considering appropriate treatment for the anoma-lous days [22]);
2. transversal grouping, aimed at grouping the load patterns ofa number of customers whose data have been gathered insimilar conditions.
This paper addresses some key aspects referring to transversalgrouping. For this purpose, research on load pattern categorisationhas been carried out to formulate suitable algorithms able to makeappropriate grouping of the customers belonging to the samemacro-category in a given time period, using load pattern shapeinformation gathered from data measured on the field. On-sitemeasurement has to be performed for a time period long enoughto get a sufficient amount of data. With the present diffusion ofadvanced metering facilities, even though the installation of smartmeters is in progress in many countries, generally it is still notpossible to perform measurement on every customer in everyjurisdiction. In fact, the amount of information gathered frommassive customer monitoring would be overwhelming, requiringextensive use of the communication channels and of memorystorage, and calling for the use of hardware and software providinghuge computational capability. As such, load pattern categorisationcan be performed by creating the customer classes by monitoringa limited number of customers. The minimum number of
customers to be subject to load pattern measurement for thevarious macro-categories can be determined by using statisticaltechniques such as the stratified sampling approach [23]. Then, thevarious steps of the electrical load pattern categorisation process[24,25] can be developed according to the general scheme outlinedin Fig. 1, up to the identification of a number of customer classes.Once identified, each customer class can be represented for tariffpurposes through its synthetic load profile, on the basis of whichthe supplier can make its evaluations and the authorities can set upappropriate regulation. For the customers with no measured dataavailable, their associationwith one of the customer classes formedcan be identified a posteriori on the basis of available informationand attributes of that customer and of the customer classesobtained.
The core of the categorisation process is the use of appropriateclustering techniques to perform load pattern grouping. Someliterature papers have shown examples of application of differentclustering techniques on load pattern data sets. Comparisonsamong these techniques have been carried out by resorting tovarious clustering validity indicators. Generally, these comparisonsare based on individual executions of the various algorithms, forinstance with the same number of clusters to be formed. Eachclustering technique can be run by setting up the requiredparameters. The effect of parameter setting for load pattern clus-tering techniques has been rarely investigated in the existingliterature. In particular, in some clustering techniques the resultsdepend on centroid initialisation. In other cases, the performance ofthe clustering methods depend on random number extraction, sothat it has to be evaluated by resorting to a statistical approach. Thispaper provides specific insights on assessing the clustering methodperformance through the evaluation of the cumulative distributionfunctions of the clustering validity indicators when the methodparameters are changed.

G. Chicco / Energy 42 (2012) 68e8070
The remainder of this paper is organised as follows. Section2 recalls the basic aspects concerning data gathering and process-ing, and introduces the association of each customer with itsrepresentative load pattern to be considered for categorisationpurposes. Section 3 addresses the definition of the features used asinputs to the customer grouping algorithms. Section 4 deals withthe clustering procedures, illustrating the types of algorithms andclustering validity indicators used. Section 5 recalls the conceptsused to form the customer classes on the basis of the clusteringresults. Section 6 addresses various aspects of clustering perfor-mance assessment, including the effects of centroid initialisationand of random number extractions to drive the evolution of theclustering procedures on the result of load pattern grouping.The last section contains the concluding remarks.
2. Data gathering and processing
Let us consider a set of M customers belonging to the samemacro-category, to be partitioned into a specified number ofcustomer classes. Relevant data refer to comparable periods in termsof type of day (weekday/weekend) and season [24,26]. Let us denotethe context characterising each of these periods as loading condition.
Typically, data are organised to represent the customer’sconsumption by means of a daily load pattern. The duration of thedata monitoring period has to be long enough to guarantee avail-ability of a sufficient amount of data. For instance, the duration ofthe monitoring period should be at least two-three weeks in thesame loading condition.
The sampling rate depends on the characteristics of the moni-toring equipment used to collect data (for a given monitoringperiod the rate limit can depend on data storage capability). Thetime intervals of interest for data representation are typically 1 min,15 min or 1 h. The corresponding number of samples characterisingeach daily load pattern is H ¼ 1440, H ¼ 96, and H ¼ 24,respectively.
In many cases, the stored data refer to 15-min time intervals[14,27e29]. Faster measurements can be performed to improve thedata representation accuracy, which depends on the characteristicsof themonitoring equipment. In case of relatively large discretisationstep to represent the measured quantity due to low number of digitsused to store the information, the accuracy may be limited. Forinstance, considering a time interval of interest of 15 min, 1-minsampling can be adopted to gather a sufficient number of points,then the representative data point related to the 15min time intervalcan be determined by averaging the values monitored at eachminute, in order to preserve the total energy represented. Thiswouldlead to smoothing the effect of the discretisation step [30], as thevalue of the representative data is not limited to one of the discretepositions in which the 1-min data can be found.
Bad data detection and elimination is performed in such a wayto ensure that the load patterns used for customer categorisationcorrespond to normal operating conditions. For this purpose, loaddata corresponding to uncommon situations are detected andeliminated. Practically, uncommon situations may occur dependingon anomalous days (e.g., bank holidays occurring at weekdays),expected events (e.g., maintenance) or unexpected events (e.g.,failures, strikes, .). The effects of failures or abnormal conditionsmay be detected by identifying the time intervals at which theaverage RMS voltage is outside the acceptable range (90%O110% ofthe rated voltage). A dedicated procedure for de-noising by waveletmultiresolution analysis is presented in [31]. The bad data detectedare eliminated from the analysis and the number of useful data fora given time interval is correspondingly reduced. Alternatively, theload pattern can be “cleaned” by finding out appropriate correc-tions of the original data [32].
The above operations lead to the formation, for each customer,of a number of available daily load patterns for a given loadingcondition. It is then needed to identify a single typical daily loadpattern representing that customer in the specified loadingcondition. For this purpose, the typical daily load pattern isobtained by combining the available load patterns according toa statistical criterion (e.g., mean or median). For instance, ifmeasurements have been performed for two weeks in the loadingcondition corresponding to the spring season, measuring 10weekend days, assuming there is no anomalous day the typicaldaily load pattern for the representative weekday is calculated bycombining instant-by-instant the 10 weekday load patterns. In caseof calculating the mean or median value, if a bad data appears, forinstance at hour 9 am for one of the days, the bad data is eliminated,and the remaining 9 points are used to determine the value at hour9 am to be included in the typical daily load pattern. If the numberof available daily load patterns is relatively high, an alternative tocombine the data could be the determination of the mode. Theprocess of combining the available daily load patterns allows forsmoothing the resulting typical daily load pattern curve withrespect to occasional variations that could occur in a specified day.In this way, the typical load pattern becomes a useful representa-tive of the customer’s behaviour in normal operating conditions.
Starting from the typical load patterns for a given loadingcondition, the information concerning each customer, to be usedfor categorisation purposes, is thus given in such a way to get loadpatterns comparable in terms of their shape. The informationstored contains:
- the reference power [kW], defined as the peak value of thetypical daily load pattern;
- the normalised representative load pattern (RLP), computed bydividing the typical daily load pattern by its reference power.
The effect of this definition is that the reference power does notcorrespond to the true peak power reached by the load pattern inthe period of observation, because of combining multiple points atcorresponding time instants of the different measured days.However, this fact can be seen in a positive way, since non-regularpeaks that could occur during the measurements come out to havea limited impact on the RLP. The normalisation aspect is extendedin [33] to include also the minimum value of the load pattern, insuch a way that all RLPs formed have a null minimum value anda unity maximum value.
3. Pre-clustering phase
3.1. Definition of the features
Feature selection concerns the identification of the type of datato be used for performing load pattern grouping. The initial data arethe RLPs built from the measured time-domain data. The time-domain RLPs can be used directly, or can be processed to obtainother features representing the customers.
Using time-domain data, the load patterns are defined with anarbitrary number of average power values, depending on the meterresolution. For a given loading condition, a simpleway to define thefeatures of themth representative load pattern, form¼ 1,.,M, is toconsider all or a part of the normalised power values obtained fromthe measurements in the time domain. In this way, a set of Hdirectly determined shape features is readily available, withoutperforming any load pattern post-processing. Let us denote the setof RLPs as X ¼ {x(m), m ¼ 1,., M}, whose mth component is rep-resented by the vector x(m) ¼ {xh(m), h ¼ 1,., H}.
Table 1Methods for electrical load pattern grouping.
Method References
Adaptive vector quantization (AVQ) [33] (2007)Entropy-based (Renyi) [45] (2010)Follow-the-leader (FDL) [12] (2003), [61] (2004), [24] (2005),
[29] (2005), [35] (2006), [38] (2006)Fuzzy logic (FL) [31] (2004)Fuzzy and ARIMA [57] (2005)Fuzzy k-means (FKM) [50] (2004), [24] (2005), [38] (2006),
[33] (2007)Hierarchical clustering (HC) [24] (2005), [38] (2006), [33] (2007),
[34] (2007)Iterative refinement clustering (IRC) [59] (2005)k-means (KM) [50] (2004), [14] (2005), [24] (2005),
[38] (2006), [33] (2007)Minemax neuro-fuzzy (MMNF) [53] (2000)Multivariate statistics (MANOVA) [36] (2006)Probabilistic neural network (PNN) [31] (2004), [65] (2005)Self organizing map (SOM) [50] (2004), [61] (2004), [14] (2005),
[24] (2005), [36] (2005), [38] (2006),[62] (2007), [74] (2008), [75] (2010)
Support vector clustering (SVC) [64] (2009)Weighted evidence accumulation
clustering (WEACS)[34] (2007)
G. Chicco / Energy 42 (2012) 68e80 71
In the time domain, further analysis could lead to groupingtogether a number of successive time intervals. For instance, theRLP data corresponding to each 15 min could be grouped togetherin such a way to identify a reduced number of time intervals,composed of night hours (from 0 am to 6 am), sunrise hours (from 6am to 8 am), morning hours (from 8 am to 12 am), lunchtime hours(from 12 am to 2 pm), and so forth [12].
An alternative to the use of time-domain data is the definition ofsuitable indirectly determined shape features. This requires post-processing the available time-domain data. While determining theshape features, an interesting possibility refers to reducing thenumber of data to be stored for each customer and to be sent to theclustering tools. For instance, it is possible to define a set of shapefactors, modelling specific aspects of the customer consumption“signature”. The shape factors are defined for each customer on thebasis of the RLP in a given loading condition. Examples are thedimensionless ratios used in [12,14,24,34], related to average tomaximumpower ratios, or ratios between average power at differentportions of the day (daylight period, night period, or the entire day).Other types of indirectly determined shape features are those iden-tified in the frequency domain, such as the harmonics-based coeffi-cients presented in [24,35], the Fourier series coefficients [36], andthe coefficients derived from the wavelet transform [37].
Further data size reduction can be performed by using projectionmethods, such as the Principal Component Analysis (PCA), Curvi-linear Component Analysis (CCA) and Sammon Map exploited in[38], or the Canonical Variate Analysis (CVA) used in [39].
3.2. Load pattern data processing to build the input data set
The input data for a given loading condition can be convenientlyset up in the form of a matrix, for instance with M rows (for the Mcustomers) and H columns (for the H features), with an additionalcolumn vector of M components containing the reference powervalues for every customer.
The reference powers can be either ignored during the groupformation (thus giving the same conceptual importance to all loadpatterns regardless of the corresponding actual power), or can beexploited as weighting factors in the clustering process, calculatingthe centroids as weighted sums of the load patterns contained inthe group. After creating the centroids, it is important to associateto each centroid its appropriate reference power. If the referencepower of the centroid is given by the sum of the reference powersof the load patterns belonging to the group represented by thecentroid, the centroid will have a maximumvalue lower than unity.
4. Clustering phase
4.1. Clustering techniques
On the basis of the features defined, clustering techniques[40e42] are generally used to perform load pattern grouping. Inparticular, it is possible to identify [36] unsupervised learning-based techniques, such as the Kohonen’s self organising map(SOM), supervised learning-based techniques (such as the onesadopting multilayer perceptron or Elman neural networks), orvector quantization, fuzzy logic-based techniques, statistical tech-niques such as k-means (KM) and multivariate analysis, and hybridtechniques such as probability neural networks (PNN) and fuzzy k-means (FKM). Further techniques have been recently defined byfollowing the concept of entropy borrowed by the informationtheory, or adapting techniques used in other domains, such asfollow the leader (FDL) and support vector clustering (SVC).A summary of the techniques used in various literature papers, withindication of relevant references, is shown in Table 1.
On the application side, the clustering techniques differaccording to the principle used in their definition, but can be dis-cussed on the basis of the requirements for their usage. A firstaspect is the possibility of setting up the final number of clustersthe user intends to obtain. This possibility can be of interest for thesupplier or for the regulating authority. In this perspective, thenumber of final consumer classes cannot be too high, in order tomake the differences among the customer sets associated todifferent tariff options readily understandable by the consumers. Inthis respect, the behaviour of the different methods can be dis-cussed as follows:
(a) Agglomerative techniques such as hierarchical clustering[33,34,40,43] can be easily adopted to produce a given numberof clusters. In fact, the hierarchical clustering procedure startswith a number of classes equal to the number of RLPs andproceeds by adding one load pattern at a time to the “closest”existing class (according to specific linkage criteria, Section 6.4)up to reaching the desired number of clusters. However, hier-archical clustering includes no mechanism for improving thecluster formation by reassigning the load patterns to the clus-ters already formed, and relatively different performance canbe obtained from its variants (with different linkage criteria[44]), evaluated by using appropriate clustering validity indi-cators (see Section 4.2). The agglomeration principle is alsoused in the approach illustrated in [45], based on informationtheory principles [46] and adopting an effective non-linearmetric exploiting Renyi entropy concepts [47,48] in the devel-opment of the clustering algorithm.
(b) Other techniques such as k-means (KM) and fuzzy k-means(FKM) [40,49], accepting the final number of clusters as input,in a few cases resulted in forming a lower number of clusterswith respect to what required, due to the presence of emptyclusters in the final grouping. However, since the procedure ofthe method is not deterministic, with internal steps dependingon random number extractions, it is possible to find a suitablesolution with the desired number of clusters by running themethod again. Basic k-means and fuzzy concepts have beenexploited to set up clustering algorithms applied to loadpattern categorisation [31,33,50,51]. The Adaptive VectorQuantization (AVQ) method used in [33] is an unsupervised
G. Chicco / Energy 42 (2012) 68e8072
one-layer neural network that uses a competitive layer witha constant number of neurons. Customised versions usingfuzzy principles [52] have been proposed, as in [53,54] byexploiting Min-Max neuro-fuzzy network [55] concepts.Moreover, a fuzzy inference model using fuzzy rules to identifythe input data, as well as to create local regression models, isillustrated in [56], and a study showing the possibility ofcombining fuzzy clustering and Auto-Regressive IntegratedMoving Average (ARIMA) statistical models is reported in [57].
(c) Conversely, the follow the leader (FDL) algorithm [12,58] doesnot require the definition of the number of clusters as input,but uses an internal distance threshold among the clustercentroids, whose variation produces different numbers ofclusters in a deterministic way (that is, the number of clustersobtained with a given distance threshold is always the same forthe same set of initial data). Since the follow the leader algo-rithm is relatively fast, it is possible to run the algorithm moretimes successively, with different distance thresholds, until thespecified number of clusters is reached. Furthermore, the IRCmethod illustrated in [59] has been defined to exploit the mostinteresting properties of the follow-the-leader (the presence ofan iterative mechanism for reassigning the load patterns to theclusters already formed) working with a specified number ofclusters, and includes an explicit mechanism to avoid theformation of empty clusters.
(d) The SOM [26,60e62] modifies the search space to represent theresults on a bi-dimensional map, but does not generate the finalclusters directly. Hence, a post-processing stage is needed toform the clusters, with arbitrary assumptions, so that differentnumbers of clusters can be formed starting from the same SOMoutcomes, by using a specific technique to identify the finalclusters (for instance, post-processing based on k-means is usedin [14,61]). Likewise, SVC [63,64] requires a first stage in whichthe support vectors are formed, followed by a second stage inwhich the groups are formed for the desired number of clusters.Furthermore, the statistical multivariate technique MANOVA ispresented in [36], by highlighting its graphical representationcapability, similar to the one of the SOM, that allows for simpleand effective visualisation of the clustering results.
(e) Further applications have been performed in [65] by usingProbabilistic Neural Networks (PNN), based on finding for eachload pattern the class with maximum probability of being theright one, and in [34] by using a Weighted Evidence Accumu-lation Clustering (WEACS) approach. The ISODATA method isused in [66].
An important aspect is that the clustering algorithm can beexecuted on the basis of different features. However, for the sake ofcomparison among the final results, the RLPs have to be grouped onthe basis of the time-domain data.More specifically, regardless of thespecific details of the clustering method, the only output neededfrom the clustering algorithm is the allocation of the initial RLPs tothe clusters. This can be done by constructing a two-dimensional list,in which the first dimension contains the number of clusters 1,., K,while the second dimension contains for each cluster the list of RLPsbelonging to that cluster. Alternatively, it is possible to build a uniquevector ofM components, progressively updated during the clusteringprocess, in which the mth component contains the number of thecluster to which the mth RLP is assigned.
4.2. Clustering validity indicators
Different clustering validity indicators have been defined inorder to assess the effectiveness of the clustering methods. Most ofthese indicators are based on Euclidean distance metrics. For this
purpose, different types of distance are needed, as defined in[24,25]. Assuming that the clustering results originate the set ofcentroids C ¼ {c(k), k ¼ 1,., K} and the corresponding groups of theRLPs, denoted as L(k), each of which contains n(k) RLPs, for k ¼ 1,.,K, it is possible to consider various distances. Applying theEuclidean distance metric, the set of distances used includes thepattern-to-pattern distance, for instance dðxðiÞ; xðjÞÞ between the ithand jth RLPs, the pattern-to-set distance, for instance dðxðiÞ; LðkÞÞfrom the ith RLP and the kth clustered group, the average set-to-setdistance, for instance dðLðiÞ; LðjÞÞ between the ith and jth clusteredgroups, and the infra-set distance, for instance dðLðkÞÞ related to thekth clustered group [12].
Starting from these definitions, some clustering validity indi-cators have been defined under the common rationale according towhich, for each indicator, lower values represent better clusteringvalidity. For this purpose, the original definitions of some indicatorshave been modified. The set of clustering validity indicators used invarious publications, with reference to the formation of K clusters,is indicated in Table 2, also showing the literature references inwhich these indicators have been used. Two indicators use the
pooled scatter p[1M
XMm¼1
xðmÞ as the global average RLP.
Each clustering indicator can be applied to a data set formed byusing either time-domain data or data defined in other vectorspaces [24]. Comparison among the clustering results is clearlymeaningful only when the same type of feature is considered.
Among the clustering validity indicators, the SMI has the inter-esting property of requiring only the information on the centroids.As such, this indicator can be useful for clustering proceduresinvolving a large number of patterns. By definition, the SMI valueslie in the range [0,1]. In order to further highlight the differencesamong the numerical values obtained, it is possible to take thesquare root of each value. Hence, a simple extension of the SMI isintroduced here by defining the new version of the indicator
SMI2ðKÞ ¼ffiffiffiffiffiffiffiffiffiffiffiffiffiffiffiffiSMIðKÞ
p(1)
5. Post-clustering phase
The clustering results are used to set up the representative loadpatterns of the customer classes, called load profiles. In order toform the customer classes, in a shape-orientated categorisationeach cluster can be directly associated to a customer class. Thisapproach is appropriate when each customer can be measured andassociated to an RLP. However, there are further aspects to beconsidered. For instance, the clustering results could provideclusters formed by outliers. The user has to check the characteris-tics of the customers represented in these clusters to decidewhether or not a cluster containing one or a few outliers should beconsidered as an independent customer class. If not, the outliershave to be reallocated to the other customer classes.
From a general standpoint, the user could intend to use theclustering results as a basis to find out customer classes repre-senting specific technical or economic attributes. In this case, theclustering results have to be post-processed in order to synthesisethe characteristics of the customer classes through their suitableattributes. Then, the RLPs can be assigned to the customer classeson the basis of these attributes.
Generally, the load profiles are expressed in absolute terms, thatis, with the vertical axis expressed in power units. This is done tomake the interpretation of the load profile simpler to the reader.Alternatively, if load profiles are shown in relative terms, thereference power associated with each load profile has to beprovided.
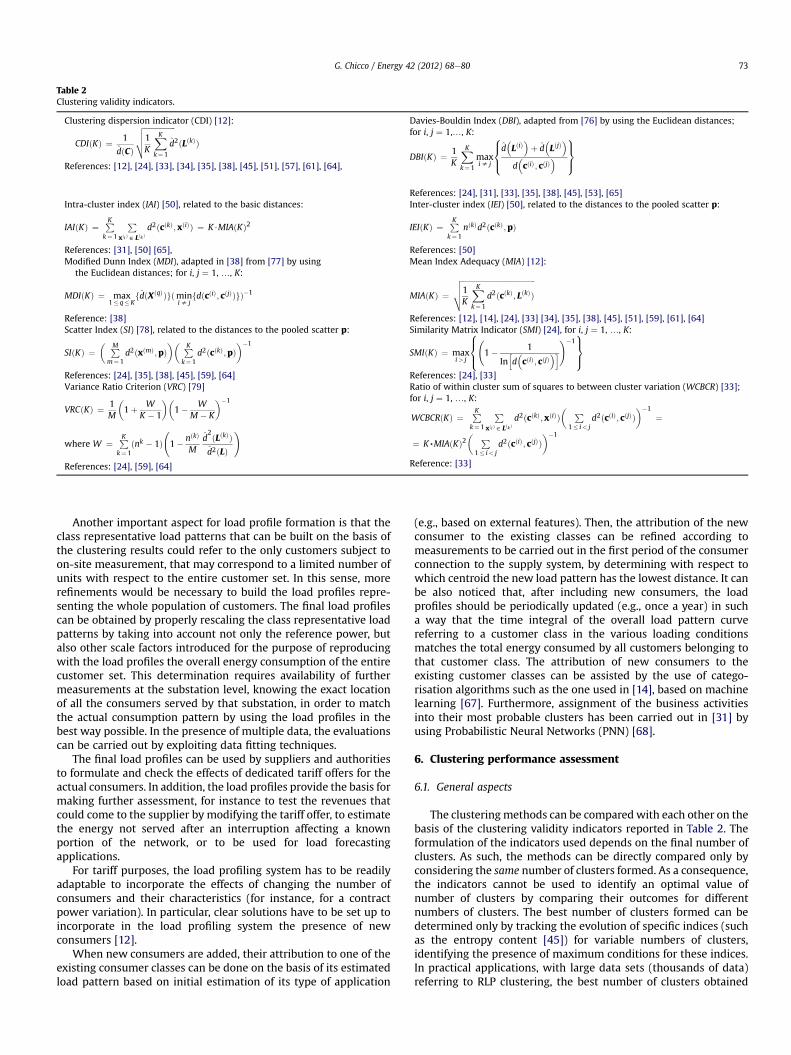
Table 2Clustering validity indicators.
Clustering dispersion indicator (CDI) [12]:
CDIðKÞ ¼ 1
dðCÞ
ffiffiffiffiffiffiffiffiffiffiffiffiffiffiffiffiffi1K
XKk¼1
d
vuut 2ðLðkÞÞ
References: [12], [24], [33], [34], [35], [38], [45], [51], [57], [61], [64],
Davies-Bouldin Index (DBI), adapted from [76] by using the Euclidean distances;for i, j ¼ 1,., K:
DBIðKÞ ¼ 1K
XKk¼1
maxis j
8><>:d�LðiÞ�þ d�LðjÞ�
d�cðiÞ; cðjÞ
�9>=>;
References: [24], [31], [33], [35], [38], [45], [53], [65]Intra-cluster index (IAI) [50], related to the basic distances:
IAIðKÞ ¼ PKk¼1
Pxði Þ ˛ Lðk Þ
d2ðcðkÞ; xðiÞÞ ¼ K$MIAðKÞ2
References: [31], [50] [65],
Inter-cluster index (IEI) [50], related to the distances to the pooled scatter p:
IEIðKÞ ¼ PKk¼1
nðkÞd2ðcðkÞ;pÞ
References: [50]Modified Dunn Index (MDI), adapted in [38] from [77] by using
the Euclidean distances; for i, j ¼ 1, ., K:
MDIðKÞ ¼ max1� q�K
fdðXðqÞÞgðminis j
fdðcðiÞ; cðjÞÞgÞ�1
Reference: [38]
Mean Index Adequacy (MIA) [12]:
MIAðKÞ ¼ffiffiffiffiffiffiffiffiffiffiffiffiffiffiffiffiffiffiffiffiffiffiffiffiffiffiffiffiffiffiffiffiffiffiffiffiffiffiffiffi1K
XKk¼1
d2ðcðkÞ; LðkÞÞvuut
References: [12], [14], [24], [33] [34], [35], [38], [45], [51], [59], [61], [64]Scatter Index (SI) [78], related to the distances to the pooled scatter p:
SIðKÞ ¼� PM
m¼1d2ðxðmÞ;pÞ
�� PKk¼1
d2ðcðkÞ;pÞ��1
References: [24], [35], [38], [45], [59], [64]
Similarity Matrix Indicator (SMI) [24], for i, j ¼ 1, ., K:
SMIðKÞ ¼ maxi> j
8><>: 1� 1
Inhd�cðiÞ; cðjÞ
�i!�1
9>=>;
References: [24], [33]Variance Ratio Criterion (VRC) [79]
VRCðKÞ ¼ 1M
�1þ W
K � 1
��1� W
M � K
��1
where W ¼ PKk¼1
ðnk � 1Þ 1� nðkÞ
Md2ðLðkÞÞd2ðLÞ
!
References: [24], [59], [64]
Ratio of within cluster sum of squares to between cluster variation (WCBCR) [33];for i, j ¼ 1, ., K:
WCBCRðKÞ ¼ PKk¼1
Pxði Þ ˛ Lðk Þ
d2ðcðkÞ; xðiÞÞ� P
1� i< jd2ðcðiÞ; cðjÞÞ
��1
¼
¼ K,MIAðKÞ2� P
1� i< jd2ðcðiÞ; cðjÞÞ
��1
Reference: [33]
G. Chicco / Energy 42 (2012) 68e80 73
Another important aspect for load profile formation is that theclass representative load patterns that can be built on the basis ofthe clustering results could refer to the only customers subject toon-site measurement, that may correspond to a limited number ofunits with respect to the entire customer set. In this sense, morerefinements would be necessary to build the load profiles repre-senting the whole population of customers. The final load profilescan be obtained by properly rescaling the class representative loadpatterns by taking into account not only the reference power, butalso other scale factors introduced for the purpose of reproducingwith the load profiles the overall energy consumption of the entirecustomer set. This determination requires availability of furthermeasurements at the substation level, knowing the exact locationof all the consumers served by that substation, in order to matchthe actual consumption pattern by using the load profiles in thebest way possible. In the presence of multiple data, the evaluationscan be carried out by exploiting data fitting techniques.
The final load profiles can be used by suppliers and authoritiesto formulate and check the effects of dedicated tariff offers for theactual consumers. In addition, the load profiles provide the basis formaking further assessment, for instance to test the revenues thatcould come to the supplier by modifying the tariff offer, to estimatethe energy not served after an interruption affecting a knownportion of the network, or to be used for load forecastingapplications.
For tariff purposes, the load profiling system has to be readilyadaptable to incorporate the effects of changing the number ofconsumers and their characteristics (for instance, for a contractpower variation). In particular, clear solutions have to be set up toincorporate in the load profiling system the presence of newconsumers [12].
When new consumers are added, their attribution to one of theexisting consumer classes can be done on the basis of its estimatedload pattern based on initial estimation of its type of application
(e.g., based on external features). Then, the attribution of the newconsumer to the existing classes can be refined according tomeasurements to be carried out in the first period of the consumerconnection to the supply system, by determining with respect towhich centroid the new load pattern has the lowest distance. It canbe also noticed that, after including new consumers, the loadprofiles should be periodically updated (e.g., once a year) in sucha way that the time integral of the overall load pattern curvereferring to a customer class in the various loading conditionsmatches the total energy consumed by all customers belonging tothat customer class. The attribution of new consumers to theexisting customer classes can be assisted by the use of catego-risation algorithms such as the one used in [14], based on machinelearning [67]. Furthermore, assignment of the business activitiesinto their most probable clusters has been carried out in [31] byusing Probabilistic Neural Networks (PNN) [68].
6. Clustering performance assessment
6.1. General aspects
The clustering methods can be compared with each other on thebasis of the clustering validity indicators reported in Table 2. Theformulation of the indicators used depends on the final number ofclusters. As such, the methods can be directly compared only byconsidering the same number of clusters formed. As a consequence,the indicators cannot be used to identify an optimal value ofnumber of clusters by comparing their outcomes for differentnumbers of clusters. The best number of clusters formed can bedetermined only by tracking the evolution of specific indices (suchas the entropy content [45]) for variable numbers of clusters,identifying the presence of maximum conditions for these indices.In practical applications, with large data sets (thousands of data)referring to RLP clustering, the best number of clusters obtained
G. Chicco / Energy 42 (2012) 68e8074
could be of the order of several dozens or even some hundreds.Such a number of clusters may be excessively high with respect tothe needs of the electricity suppliers, as the final number ofcustomer classes corresponding to different tariff offers has to berelatively low (indicatively, up to 10-15). Hence, the number ofclusters is generally not found by optimising the value of an indi-cator, but it can be set up by the user directly.
Performance comparisons have been carried out in the litera-ture on the above bases. Among the classical methods, goodperformance has been remarked in [12,24,33,34,38] for the hier-archical clustering with average linkage criterion and for the FDLalgorithm. The results shown in the literature generally reportindividual occurrences of the clustering validity indicators for themethods addressed, without providing insights on how the clus-tering results could depend on the method parameters. In order tocarry out more detailed analyses, a meaningful way to report theclustering validity indicators is to resort to a statistical approach forassessing the variability of the indicators. The following subsectionspresent a detailed view on the clustering performance dependenceon themethod parameters and variants for some classical methods,carried out on a dedicated set of load pattern data. The methodsaddressed are the ones directly leading to cluster formationthrough a single procedure (e.g., KM, FKM, FDL, and the hierarchicalclustering variants). Other methods such as SOM and SVC, thatconstruct an initial mapping on a dedicated plane or vector spaceand need post-processing to select the desired number of clusters,are not addressed here.
6.2. Initial load pattern data for a case study application
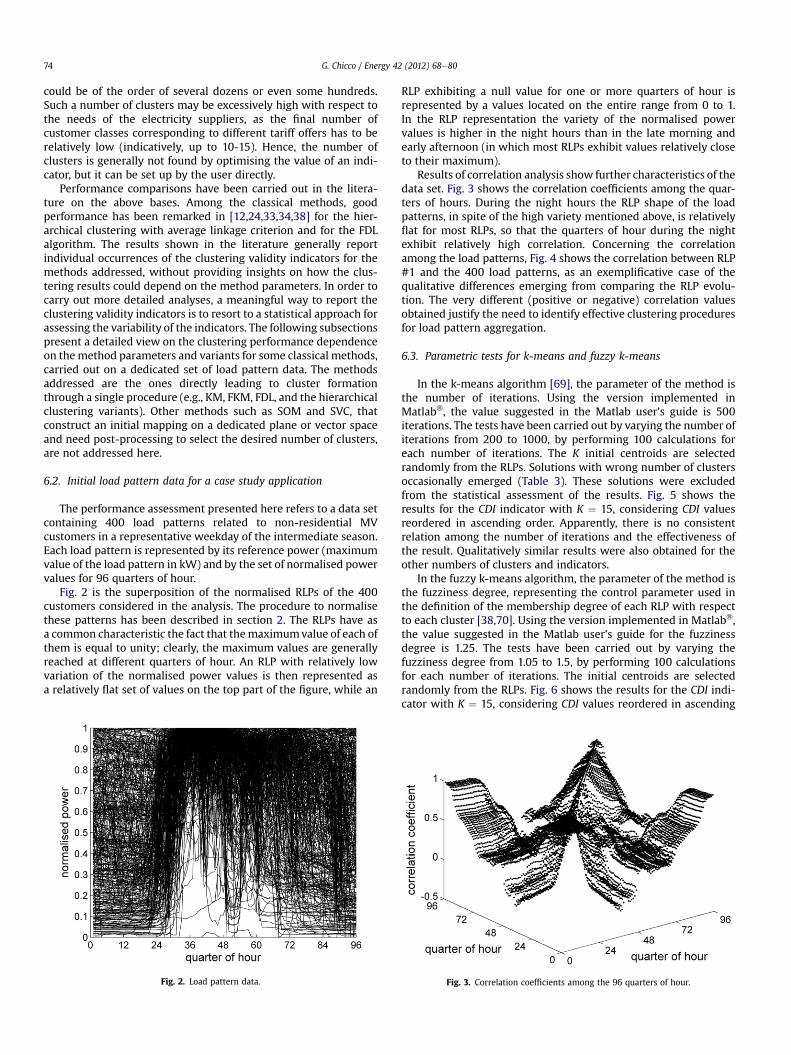
The performance assessment presented here refers to a data setcontaining 400 load patterns related to non-residential MVcustomers in a representative weekday of the intermediate season.Each load pattern is represented by its reference power (maximumvalue of the load pattern in kW) and by the set of normalised powervalues for 96 quarters of hour.
Fig. 2 is the superposition of the normalised RLPs of the 400customers considered in the analysis. The procedure to normalisethese patterns has been described in section 2. The RLPs have asa common characteristic the fact that themaximumvalue of each ofthem is equal to unity; clearly, the maximum values are generallyreached at different quarters of hour. An RLP with relatively lowvariation of the normalised power values is then represented asa relatively flat set of values on the top part of the figure, while an
Fig. 2. Load pattern data.
RLP exhibiting a null value for one or more quarters of hour isrepresented by a values located on the entire range from 0 to 1.In the RLP representation the variety of the normalised powervalues is higher in the night hours than in the late morning andearly afternoon (in which most RLPs exhibit values relatively closeto their maximum).
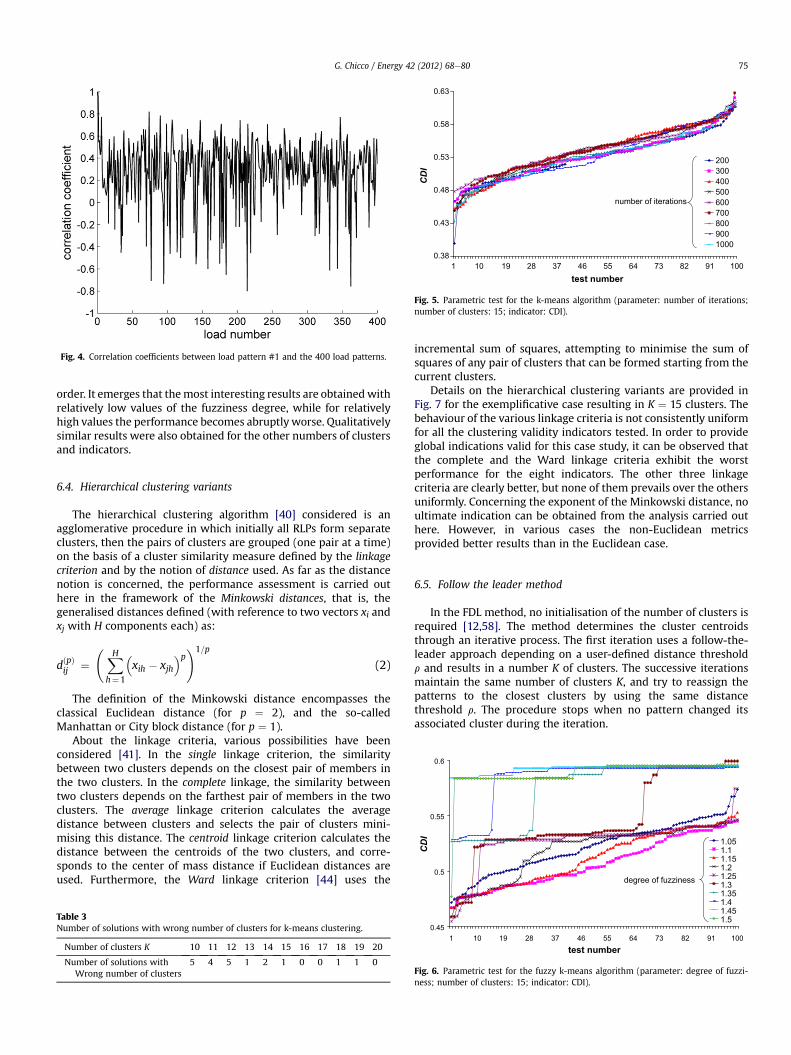
Results of correlation analysis show further characteristics of thedata set. Fig. 3 shows the correlation coefficients among the quar-ters of hours. During the night hours the RLP shape of the loadpatterns, in spite of the high variety mentioned above, is relativelyflat for most RLPs, so that the quarters of hour during the nightexhibit relatively high correlation. Concerning the correlationamong the load patterns, Fig. 4 shows the correlation between RLP#1 and the 400 load patterns, as an exemplificative case of thequalitative differences emerging from comparing the RLP evolu-tion. The very different (positive or negative) correlation valuesobtained justify the need to identify effective clustering proceduresfor load pattern aggregation.
6.3. Parametric tests for k-means and fuzzy k-means
In the k-means algorithm [69], the parameter of the method isthe number of iterations. Using the version implemented inMatlab�, the value suggested in the Matlab user’s guide is 500iterations. The tests have been carried out by varying the number ofiterations from 200 to 1000, by performing 100 calculations foreach number of iterations. The K initial centroids are selectedrandomly from the RLPs. Solutions with wrong number of clustersoccasionally emerged (Table 3). These solutions were excludedfrom the statistical assessment of the results. Fig. 5 shows theresults for the CDI indicator with K ¼ 15, considering CDI valuesreordered in ascending order. Apparently, there is no consistentrelation among the number of iterations and the effectiveness ofthe result. Qualitatively similar results were also obtained for theother numbers of clusters and indicators.
In the fuzzy k-means algorithm, the parameter of the method isthe fuzziness degree, representing the control parameter used inthe definition of the membership degree of each RLP with respectto each cluster [38,70]. Using the version implemented in Matlab�,the value suggested in the Matlab user’s guide for the fuzzinessdegree is 1.25. The tests have been carried out by varying thefuzziness degree from 1.05 to 1.5, by performing 100 calculationsfor each number of iterations. The initial centroids are selectedrandomly from the RLPs. Fig. 6 shows the results for the CDI indi-cator with K ¼ 15, considering CDI values reordered in ascending
Fig. 3. Correlation coefficients among the 96 quarters of hour.
0.38
0.43
0.48
0.53
0.58
0.63
1 10 19 28 37 46 55 64 73 82 91 100test number
CDI
2003004005006007008009001000
number of iterations
Fig. 5. Parametric test for the k-means algorithm (parameter: number of iterations;number of clusters: 15; indicator: CDI).
Fig. 4. Correlation coefficients between load pattern #1 and the 400 load patterns.
G. Chicco / Energy 42 (2012) 68e80 75
order. It emerges that themost interesting results are obtainedwithrelatively low values of the fuzziness degree, while for relativelyhigh values the performance becomes abruptly worse. Qualitativelysimilar results were also obtained for the other numbers of clustersand indicators.
0.5
0.55
0.6
CDI 1.05
1.11.151.21.251.3degree of fuzziness
6.4. Hierarchical clustering variants
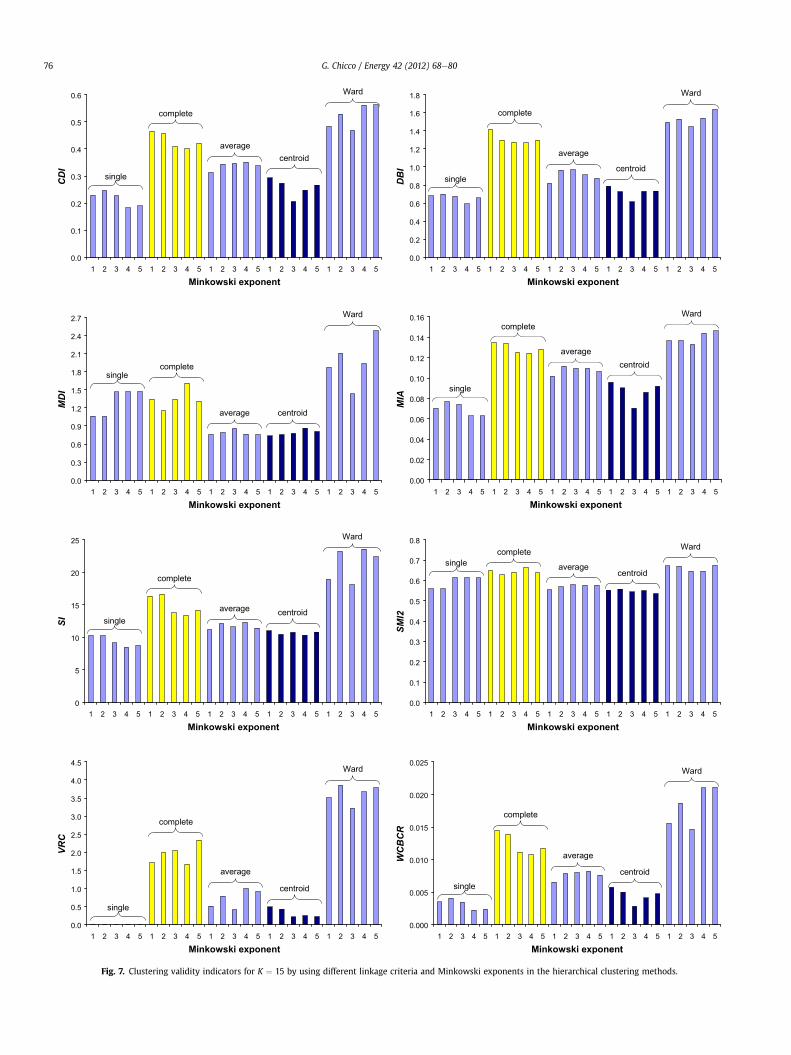
The hierarchical clustering algorithm [40] considered is anagglomerative procedure in which initially all RLPs form separateclusters, then the pairs of clusters are grouped (one pair at a time)on the basis of a cluster similarity measure defined by the linkagecriterion and by the notion of distance used. As far as the distancenotion is concerned, the performance assessment is carried outhere in the framework of the Minkowski distances, that is, thegeneralised distances defined (with reference to two vectors xi andxj with H components each) as:
dðpÞij ¼ XH
h¼1
�xih � xjh
�p!1=p
(2)
The definition of the Minkowski distance encompasses theclassical Euclidean distance (for p ¼ 2), and the so-calledManhattan or City block distance (for p ¼ 1).
About the linkage criteria, various possibilities have beenconsidered [41]. In the single linkage criterion, the similaritybetween two clusters depends on the closest pair of members inthe two clusters. In the complete linkage, the similarity betweentwo clusters depends on the farthest pair of members in the twoclusters. The average linkage criterion calculates the averagedistance between clusters and selects the pair of clusters mini-mising this distance. The centroid linkage criterion calculates thedistance between the centroids of the two clusters, and corre-sponds to the center of mass distance if Euclidean distances areused. Furthermore, the Ward linkage criterion [44] uses the
Table 3Number of solutions with wrong number of clusters for k-means clustering.
Number of clusters K 10 11 12 13 14 15 16 17 18 19 20
Number of solutions withWrong number of clusters
5 4 5 1 2 1 0 0 1 1 0
incremental sum of squares, attempting to minimise the sum ofsquares of any pair of clusters that can be formed starting from thecurrent clusters.
Details on the hierarchical clustering variants are provided inFig. 7 for the exemplificative case resulting in K ¼ 15 clusters. Thebehaviour of the various linkage criteria is not consistently uniformfor all the clustering validity indicators tested. In order to provideglobal indications valid for this case study, it can be observed thatthe complete and the Ward linkage criteria exhibit the worstperformance for the eight indicators. The other three linkagecriteria are clearly better, but none of them prevails over the othersuniformly. Concerning the exponent of the Minkowski distance, noultimate indication can be obtained from the analysis carried outhere. However, in various cases the non-Euclidean metricsprovided better results than in the Euclidean case.
6.5. Follow the leader method
In the FDL method, no initialisation of the number of clusters isrequired [12,58]. The method determines the cluster centroidsthrough an iterative process. The first iteration uses a follow-the-leader approach depending on a user-defined distance thresholdr and results in a number K of clusters. The successive iterationsmaintain the same number of clusters K, and try to reassign thepatterns to the closest clusters by using the same distancethreshold r. The procedure stops when no pattern changed itsassociated cluster during the iteration.
0.451 10 19 28 37 46 55 64 73 82 91 100
test number
1.351.41.451.5
Fig. 6. Parametric test for the fuzzy k-means algorithm (parameter: degree of fuzzi-ness; number of clusters: 15; indicator: CDI).
0.0
0.1
0.2
0.3
0.4
0.5
0.6
1 2 3 4 5 1 2 3 4 5 1 2 3 4 5 1 2 3 4 5 1 2 3 4 5
Minkowski exponent
CDI
single
complete
averagecentroid
Ward
0.0
0.2
0.4
0.6
0.8
1.0
1.2
1.4
1.6
1.8
1 2 3 4 5 1 2 3 4 5 1 2 3 4 5 1 2 3 4 5 1 2 3 4 5
Minkowski exponent
DBI
single
complete
average
centroid
Ward
0.0
0.3
0.6
0.9
1.2
1.5
1.8
2.1
2.4
2.7
1 2 3 4 5 1 2 3 4 5 1 2 3 4 5 1 2 3 4 5 1 2 3 4 5
Minkowski exponent
MDI
singlecomplete
average centroid
Ward
0.00
0.02
0.04
0.06
0.08
0.10
0.12
0.14
0.16
1 2 3 4 5 1 2 3 4 5 1 2 3 4 5 1 2 3 4 5 1 2 3 4 5
Minkowski exponent
MIA
single
complete
averagecentroid
Ward
0
5
10
15
20
25
1 2 3 4 5 1 2 3 4 5 1 2 3 4 5 1 2 3 4 5 1 2 3 4 5
Minkowski exponent
SI single
complete
average centroid
Ward
0.0
0.1
0.2
0.3
0.4
0.5
0.6
0.7
0.8
1 2 3 4 5 1 2 3 4 5 1 2 3 4 5 1 2 3 4 5 1 2 3 4 5
Minkowski exponent
SMI2
singlecomplete
averagecentroid
Ward
0.0
0.5
1.0
1.5
2.0
2.5
3.0
3.5
4.0
4.5
1 2 3 4 5 1 2 3 4 5 1 2 3 4 5 1 2 3 4 5 1 2 3 4 5
Minkowski exponent
VRC
single
complete
average
centroid
Ward
0.000
0.005
0.010
0.015
0.020
0.025
1 2 3 4 5 1 2 3 4 5 1 2 3 4 5 1 2 3 4 5 1 2 3 4 5
Minkowski exponent
WCBCR
single
complete
average
centroid
Ward
Fig. 7. Clustering validity indicators for K ¼ 15 by using different linkage criteria and Minkowski exponents in the hierarchical clustering methods.
G. Chicco / Energy 42 (2012) 68e8076
G. Chicco / Energy 42 (2012) 68e80 77
The method is deterministic, that is, each threshold valuecorresponds to the same clustering result. Practically, differentvalues of the threshold could lead to the same number of clusters(but with different cluster compositions). A further relevant aspectis that the order of presentation of the RLPs during the execution ofthe algorithm could affect the clustering results. These aspects havebeen investigated by running the FDL algorithm multiple timeswith different values of the threshold and with different orders inwhich the RLPs are processed by the algorithm. In most cases, thesame cluster composition was obtained from multiple runs. Theconsistent convergence to the same solution or to a limited numberof solutions depends on the iterative nature of the FDL algorithm, inwhich the clusters are formed in the first iteration but are succes-sively refined in the successive iterations until clusteringstabilisation. However, in some cases different cluster compositionshave been found (namely, two different solutions for K ¼ 12, 13, 14and 16).
6.6. Method comparisons with variable number of clusters
The comparison presented in this section refers to the clusteringresults obtained from different methods with numbers of clusters Kvariable from 10 to 20. The hierarchical method variants consideredare indicated as HS2 (hierarchical with single linkage criterion andMinkowski exponent p ¼ 2), HS5 (hierarchical with single linkagecriterion and Minkowski exponent p ¼ 5), and HA2 (hierarchicalwith average linkage criterion and Minkowski exponent p¼ 2). Thenumerical tests have been performed on a laptop computer withPentium� 1.86 GHz processor.
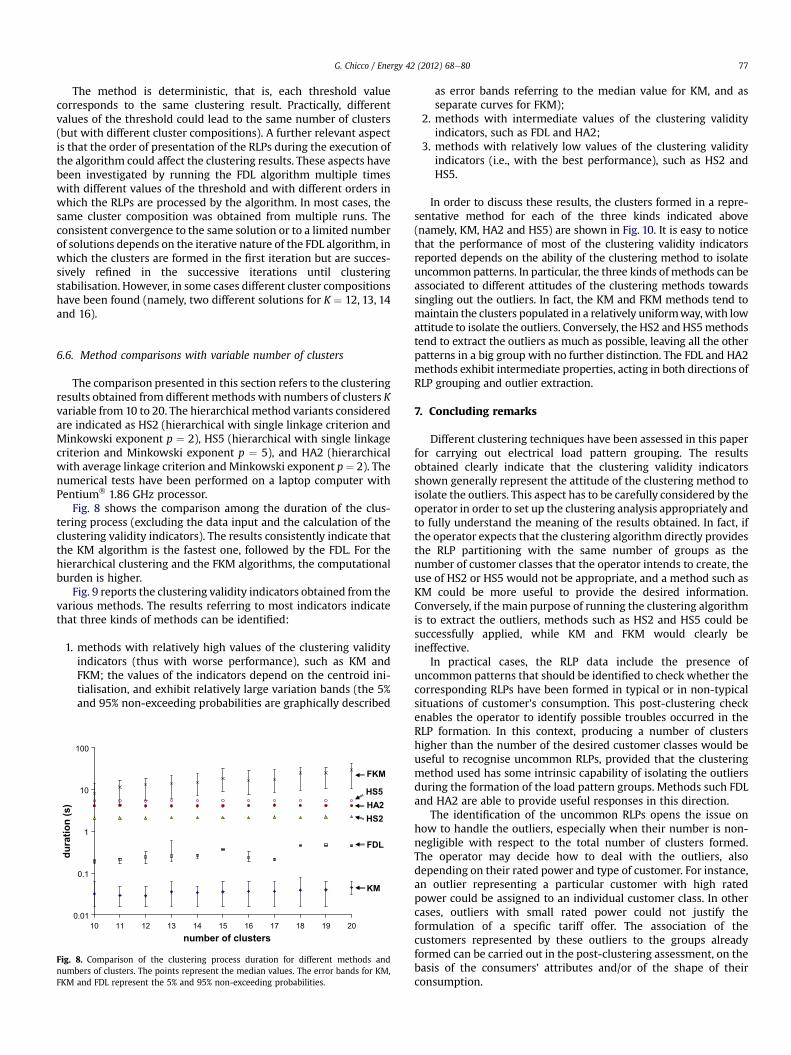
Fig. 8 shows the comparison among the duration of the clus-tering process (excluding the data input and the calculation of theclustering validity indicators). The results consistently indicate thatthe KM algorithm is the fastest one, followed by the FDL. For thehierarchical clustering and the FKM algorithms, the computationalburden is higher.
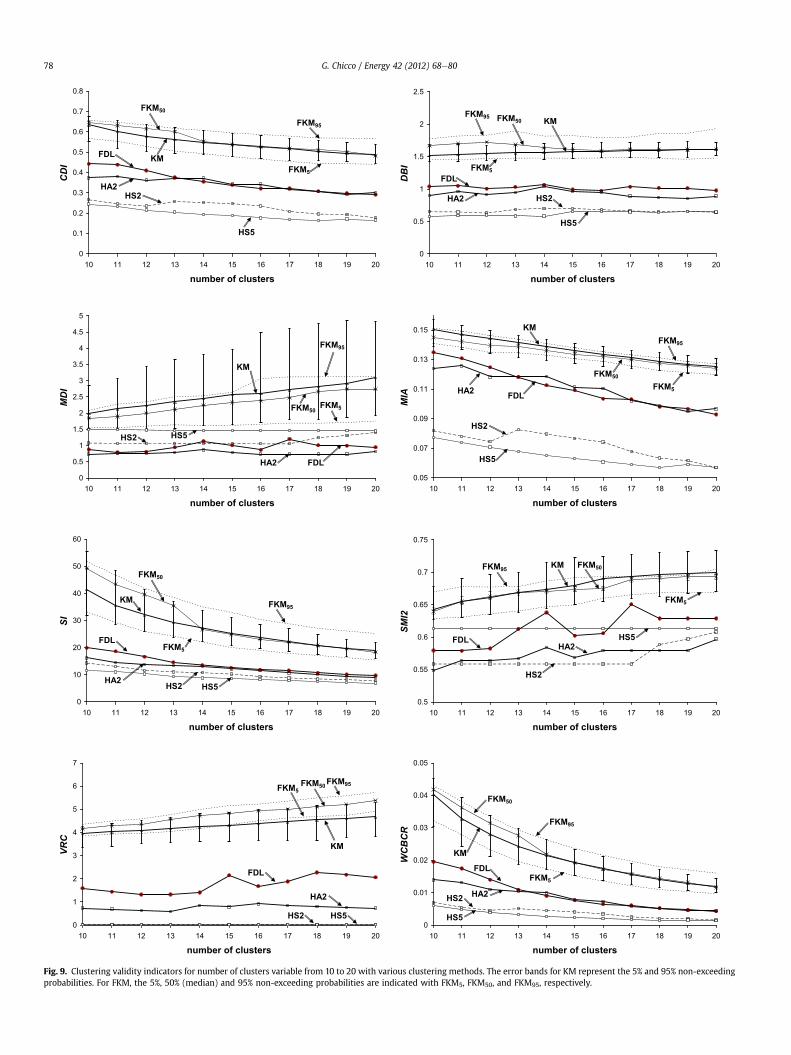
Fig. 9 reports the clustering validity indicators obtained from thevarious methods. The results referring to most indicators indicatethat three kinds of methods can be identified:
1. methods with relatively high values of the clustering validityindicators (thus with worse performance), such as KM andFKM; the values of the indicators depend on the centroid ini-tialisation, and exhibit relatively large variation bands (the 5%and 95% non-exceeding probabilities are graphically described
0.01
0.1
1
10
100
10 11 12 13 14 15 16 17 18 19 20number of clusters
du
ra
tio
n (s
)
FDL
HS2
HA2
HS5
FKM
KM
Fig. 8. Comparison of the clustering process duration for different methods andnumbers of clusters. The points represent the median values. The error bands for KM,FKM and FDL represent the 5% and 95% non-exceeding probabilities.
as error bands referring to the median value for KM, and asseparate curves for FKM);
2. methods with intermediate values of the clustering validityindicators, such as FDL and HA2;
3. methods with relatively low values of the clustering validityindicators (i.e., with the best performance), such as HS2 andHS5.
In order to discuss these results, the clusters formed in a repre-sentative method for each of the three kinds indicated above(namely, KM, HA2 and HS5) are shown in Fig. 10. It is easy to noticethat the performance of most of the clustering validity indicatorsreported depends on the ability of the clustering method to isolateuncommon patterns. In particular, the three kinds of methods can beassociated to different attitudes of the clustering methods towardssingling out the outliers. In fact, the KM and FKM methods tend tomaintain the clusters populated in a relatively uniformway, with lowattitude to isolate the outliers. Conversely, the HS2 and HS5methodstend to extract the outliers as much as possible, leaving all the otherpatterns in a big group with no further distinction. The FDL and HA2methods exhibit intermediate properties, acting in both directions ofRLP grouping and outlier extraction.
7. Concluding remarks
Different clustering techniques have been assessed in this paperfor carrying out electrical load pattern grouping. The resultsobtained clearly indicate that the clustering validity indicatorsshown generally represent the attitude of the clustering method toisolate the outliers. This aspect has to be carefully considered by theoperator in order to set up the clustering analysis appropriately andto fully understand the meaning of the results obtained. In fact, ifthe operator expects that the clustering algorithm directly providesthe RLP partitioning with the same number of groups as thenumber of customer classes that the operator intends to create, theuse of HS2 or HS5 would not be appropriate, and a method such asKM could be more useful to provide the desired information.Conversely, if the main purpose of running the clustering algorithmis to extract the outliers, methods such as HS2 and HS5 could besuccessfully applied, while KM and FKM would clearly beineffective.
In practical cases, the RLP data include the presence ofuncommon patterns that should be identified to check whether thecorresponding RLPs have been formed in typical or in non-typicalsituations of customer’s consumption. This post-clustering checkenables the operator to identify possible troubles occurred in theRLP formation. In this context, producing a number of clustershigher than the number of the desired customer classes would beuseful to recognise uncommon RLPs, provided that the clusteringmethod used has some intrinsic capability of isolating the outliersduring the formation of the load pattern groups. Methods such FDLand HA2 are able to provide useful responses in this direction.
The identification of the uncommon RLPs opens the issue onhow to handle the outliers, especially when their number is non-negligible with respect to the total number of clusters formed.The operator may decide how to deal with the outliers, alsodepending on their rated power and type of customer. For instance,an outlier representing a particular customer with high ratedpower could be assigned to an individual customer class. In othercases, outliers with small rated power could not justify theformulation of a specific tariff offer. The association of thecustomers represented by these outliers to the groups alreadyformed can be carried out in the post-clustering assessment, on thebasis of the consumers’ attributes and/or of the shape of theirconsumption.
0
0.1
0.2
0.3
0.4
0.5
0.6
0.7
0.8
10 11 12 13 14 15 16 17 18 19 20
number of clusters
CDI
FDL
HS2
HA2
HS5
KM
FKM50
FKM95
FKM5
0
0.5
1
1.5
2
2.5
10 11 12 13 14 15 16 17 18 19 20
number of clusters
DBI
FDL
HS2HA2
HS5
KMFKM
50
FKM95
FKM5
0
0.5
1
1.5
2
2.5
3
3.5
4
4.5
5
10 11 12 13 14 15 16 17 18 19 20
number of clusters
MDI
FDL
HS2
HA2
HS5
KM
FKM50
FKM95
FKM5
0.05
0.07
0.09
0.11
0.13
0.15
10 11 12 13 14 15 16 17 18 19 20
number of clusters
MIA
FDL
HS5
HA2
HS2
KM
FKM50
FKM95
FKM5
0
10
20
30
40
50
60
10 11 12 13 14 15 16 17 18 19 20
number of clusters
SI
FDL
HS5
HA2
HS2
KM
FKM50
FKM95
FKM5
0.5
0.55
0.6
0.65
0.7
0.75
10 11 12 13 14 15 16 17 18 19 20
number of clusters
SMI2
FDL
HS2
HA2
HS5
KM FKM50FKM
95
FKM5
0
1
2
3
4
5
6
7
10 11 12 13 14 15 16 17 18 19 20
number of clusters
VRC
FDL
HS2
HA2
HS5
KM
FKM50
FKM95
FKM5
0
0.01
0.02
0.03
0.04
0.05
10 11 12 13 14 15 16 17 18 19 20
number of clusters
WCBCR
FDL
HS2HA2
HS5
FKM50
KM
FKM95
FKM5
Fig. 9. Clustering validity indicators for number of clusters variable from 10 to 20 with various clustering methods. The error bands for KM represent the 5% and 95% non-exceedingprobabilities. For FKM, the 5%, 50% (median) and 95% non-exceeding probabilities are indicated with FKM5, FKM50, and FKM95, respectively.
G. Chicco / Energy 42 (2012) 68e8078
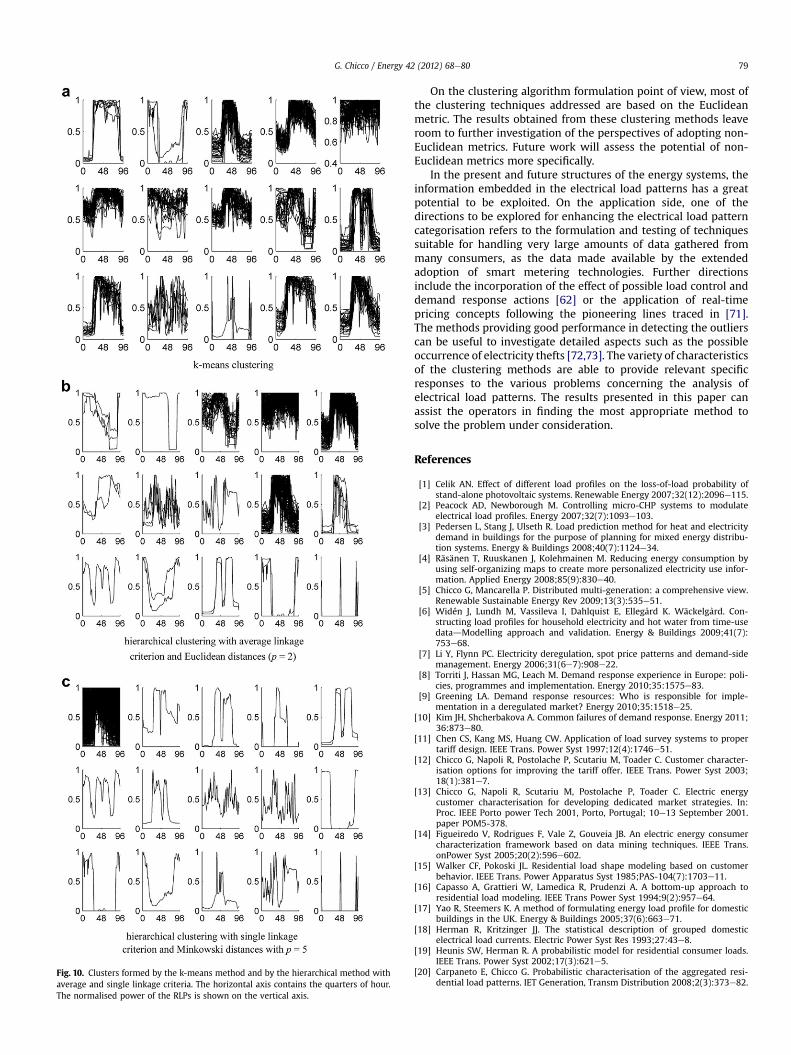
Fig. 10. Clusters formed by the k-means method and by the hierarchical method withaverage and single linkage criteria. The horizontal axis contains the quarters of hour.The normalised power of the RLPs is shown on the vertical axis.
G. Chicco / Energy 42 (2012) 68e80 79
On the clustering algorithm formulation point of view, most ofthe clustering techniques addressed are based on the Euclideanmetric. The results obtained from these clustering methods leaveroom to further investigation of the perspectives of adopting non-Euclidean metrics. Future work will assess the potential of non-Euclidean metrics more specifically.
In the present and future structures of the energy systems, theinformation embedded in the electrical load patterns has a greatpotential to be exploited. On the application side, one of thedirections to be explored for enhancing the electrical load patterncategorisation refers to the formulation and testing of techniquessuitable for handling very large amounts of data gathered frommany consumers, as the data made available by the extendedadoption of smart metering technologies. Further directionsinclude the incorporation of the effect of possible load control anddemand response actions [62] or the application of real-timepricing concepts following the pioneering lines traced in [71].The methods providing good performance in detecting the outlierscan be useful to investigate detailed aspects such as the possibleoccurrence of electricity thefts [72,73]. The variety of characteristicsof the clustering methods are able to provide relevant specificresponses to the various problems concerning the analysis ofelectrical load patterns. The results presented in this paper canassist the operators in finding the most appropriate method tosolve the problem under consideration.
References
[1] Celik AN. Effect of different load profiles on the loss-of-load probability ofstand-alone photovoltaic systems. Renewable Energy 2007;32(12):2096e115.
[2] Peacock AD, Newborough M. Controlling micro-CHP systems to modulateelectrical load profiles. Energy 2007;32(7):1093e103.
[3] Pedersen L, Stang J, Ulseth R. Load prediction method for heat and electricitydemand in buildings for the purpose of planning for mixed energy distribu-tion systems. Energy & Buildings 2008;40(7):1124e34.
[4] Räsänen T, Ruuskanen J, Kolehmainen M. Reducing energy consumption byusing self-organizing maps to create more personalized electricity use infor-mation. Applied Energy 2008;85(9):830e40.
[5] Chicco G, Mancarella P. Distributed multi-generation: a comprehensive view.Renewable Sustainable Energy Rev 2009;13(3):535e51.
[6] Widén J, Lundh M, Vassileva I, Dahlquist E, Ellegård K. Wäckelgård. Con-structing load profiles for household electricity and hot water from time-usedatadModelling approach and validation. Energy & Buildings 2009;41(7):753e68.
[7] Li Y, Flynn PC. Electricity deregulation, spot price patterns and demand-sidemanagement. Energy 2006;31(6e7):908e22.
[8] Torriti J, Hassan MG, Leach M. Demand response experience in Europe: poli-cies, programmes and implementation. Energy 2010;35:1575e83.
[9] Greening LA. Demand response resources: Who is responsible for imple-mentation in a deregulated market? Energy 2010;35:1518e25.
[10] Kim JH, Shcherbakova A. Common failures of demand response. Energy 2011;36:873e80.
[11] Chen CS, Kang MS, Huang CW. Application of load survey systems to propertariff design. IEEE Trans. Power Syst 1997;12(4):1746e51.
[12] Chicco G, Napoli R, Postolache P, Scutariu M, Toader C. Customer character-isation options for improving the tariff offer. IEEE Trans. Power Syst 2003;18(1):381e7.
[13] Chicco G, Napoli R, Scutariu M, Postolache P, Toader C. Electric energycustomer characterisation for developing dedicated market strategies. In:Proc. IEEE Porto power Tech 2001, Porto, Portugal; 10e13 September 2001.paper POM5-378.
[14] Figueiredo V, Rodrigues F, Vale Z, Gouveia JB. An electric energy consumercharacterization framework based on data mining techniques. IEEE Trans.onPower Syst 2005;20(2):596e602.
[15] Walker CF, Pokoski JL. Residential load shape modeling based on customerbehavior. IEEE Trans. Power Apparatus Syst 1985;PAS-104(7):1703e11.
[16] Capasso A, Grattieri W, Lamedica R, Prudenzi A. A bottom-up approach toresidential load modeling. IEEE Trans Power Syst 1994;9(2):957e64.
[17] Yao R, Steemers K. A method of formulating energy load profile for domesticbuildings in the UK. Energy & Buildings 2005;37(6):663e71.
[18] Herman R, Kritzinger JJ. The statistical description of grouped domesticelectrical load currents. Electric Power Syst Res 1993;27:43e8.
[19] Heunis SW, Herman R. A probabilistic model for residential consumer loads.IEEE Trans. Power Syst 2002;17(3):621e5.
[20] Carpaneto E, Chicco G. Probabilistic characterisation of the aggregated resi-dential load patterns. IET Generation, Transm Distribution 2008;2(3):373e82.
G. Chicco / Energy 42 (2012) 68e8080
[21] Herman R, Heunis SW. Load models for mixed domestic and fixed, constantpower loads for use in probabilistic LV feeder analysis. Electric Power Syst Res2003;66:149e53.
[22] Chicco G, Napoli R, Piglione F. Load pattern clustering for short-term loadforecasting of anomalous days. In: Proc. IEEE Porto power Tech 2001, Porto,Portugal; 10e13 September 2001. paper AIT2-377.
[23] Neyman J. On the two different aspects of the representative method: themethod of stratified sampling and the method of purposive selection. J RoyalStat Soc Part IV; 1934:558e606.
[24] Chicco G, Napoli R, Piglione F, Scutariu M, Postolache P, Toader C. Emergentelectricity customer classification. IEE Proc Gener Transm Distrib 2005;152(2):164e72.
[25] Chicco G, Napoli R, Piglione F, Scutariu M, Postolache P, Toader C. Application ofclustering techniques to load pattern-based electricity customer classification.Proc. 18th CIRED, Torino, Italy, 6e9 June 2005, Session 5, paper No. 467.
[26] Nazarko J, Styczynski ZA. Application of statistical and neural approaches tothe daily load profiles modelling in power distribution systems. Proc. IEEETransm. and Distrib. Conference, New Orleans, LA, 11-16 April 1999,1:320e325.
[27] Chen CS, Hwang JC, Tzeng YM, Huang CW, Cho MY. Determination ofcustomer load characteristic by load survey system at Taipower. IEEE TransPower Deliv 1996;11(3):1430e6.
[28] Chen CS, Kang MS, Hwang JC, Huang CW. Synthesis of power system loadprofiles by class load study. Electrical Power Energy Syst 2000;22(5):325e30.
[29] Yu IH, Lee JK, Ko JM, Kim SI. A method for classification of electricity demandsusing load profile data. Proc. Fourth Annual ACIS Intern. Conf Comput Inf Sci;2005:164e8.
[30] Chicco G. Challenges for smart distribution systems: data representation andoptimization objectives. Proc. 12th International Conference on optimizationof Electrical and Electronic Equipment (OPTIM 2010), Brasov, Romania, 20e22May 2010.
[31] Gerbec D, Ga�speri�c S, �Smon I, Gubina F. Determining the load profiles ofconsumers based on fuzzy logic and probability neural networks. IEE ProcGener Transm Distrib 2004;151(3):395e400.
[32] Zhang X, Sun C. Dynamic intelligent cleaning model of dirty electric load data.Energy Conversion Manage 2008;49(4):564e9.
[33] Tsekouras GJ, Hatziargyriou ND, Dialynas EN. Two-stage pattern recognitionof load curves for classification of electricity customers. IEEE Trans. Power Syst2007;22(3):1120e8.
[34] Ramos S, Vale Z, Santana J, Duarte J. Data mining contributions to characterizeMV consumers and to improve the suppliers-consumers settlements. ProcIEEE/PES GenMeeting 2007, 24e28 June 2007.
[35] Carpaneto E, Chicco G, Napoli R, Scutariu M. Electricity customer classificationusing frequency-domain load pattern data. Electrical Power Energy Syst 2006;28(1):13e20.
[36] Verdu SV, Garcia MO, Senabre C, Marin AG, Franco FJG. Classification, filtering,and identification of electrical customer load patterns through the use of self-organizing maps. IEEE Trans. Power Syst 2006;21(4):1672e82.
[37] Petrescu M, Scutariu M. Load diagram characterisation by means of waveletpacket transform. Proc. 2nd Balkan Power Conference, Belgrade, Yugoslavia,19e21 June 2002, 15e19.
[38] Chicco G, Napoli R, Piglione F. Comparisons among clustering techniques forelectricity customer classification. IEEE Trans. Power Syst 2006;21(2):933e40.
[39] Li X, Bowers C, Schnier T. Classification of energy consumption in buildingswith outlier detection. IEEE Trans. Ind Electronics 2010;57(11):3639e44.
[40] Anderberg MR. Cluster analysis for applications. New York: Academic Press;1973.
[41] Everitt BS. Cluster analysis. 3rd ed. London, UK: Edward Arnold and HalstedPress; 1993.
[42] Jain AK, Murty MN, Flynn PJ. Data clustering: a review. ACM Comput Surv1999;31(3):264e323.
[43] (in Romanian). Editur�a Venus Cârtin�a G, Grigoras G, Bobric EC. Clusteringtechniques in fuzzy modeling e Power systems applications. Romania: Iasi;2005.
[44] Ward JH. Hierarchical grouping to optimise an objective function. J Am StatAssoc 1963;58:236e44.
[45] Chicco G, Sumaili Akilimali J. Renyi entropy-based classification of dailyelectrical load patterns. IET Generation Transm Distribution 2010;4(6):736e45.
[46] Gockay E, Principe JC. Information theoretic clustering. IEEE Trans. PatternAnal Machine Intelligence 2002;24(2):158e70.
[47] Renyi A. On measures of entropy and information. Proc. Fourth BerkeleySymp. Math., Stat Probab, 1960, 547e561.
[48] Jenssen R, Hild II KE, Erdogmus D, Principe JC, Eltoft T. Clustering using Renyi’sentropy. IEEE Trans. Pattern Anal Machine Intelligence 2002;24(2):158e71.
[49] Bezdek JC, Harris JD. Fuzzy partitions and relations; an axiomatic basis forclustering. Fuzzy Sets Syst 1978;1:111e27.
[50] Marques DZ, de Almeida KA, de Deus AM, da Silva Paulo ARG, da Silva Lima W.A comparative analysis of neural and fuzzy cluster techniques applied to thecharacterization of electric load in substations. Proc. IEEE/PES Transmissionand Distribution Conference and Exposition: Latin America, 8-11 Nov. 2004,908e913.
[51] Zadeh L. Similarity relations and fuzzy orderings. Inf Sci 1971;3:177e200.[52] Zakaria Z, Lo KL, Sohod MH. Application of fuzzy clustering to determine
electricity consumers’ load profiles. Proc. IEEE Power and Energy ConferencePECon ’06, November 2006, 99e103.
[53] Lamedica R, Fracassi G, Martinelli G, Prudenzi A, Santolamazza L. A novelmethodology based on clustering techniques for automatic processing of MVfeeder daily load patterns. Proc. IEEE PES Summer Meeting 2000, Seattle, WA,16-20 July 2000, 1:96e101.
[54] Özveren CS, Vechakanjana C, Birch AP. Fuzzy classification of electrical loaddemand profiles e A case study. In: Proc. IEE power system management andcontrol; 17e19 April 2002. p. 353e8.
[55] Simpson PK. Fuzzy Min-Max neural networks - Part 2: clustering. IEEE Trans.Fuzzy Syst 1993;1(1):32e45.
[56] Zalewski W. Application of fuzzy inference to electric load clustering. Proc.IEEE Power India Conference, 10e12 April 2006.
[57] Nazarko J, Jurczuk A, Zalewski W. ARIMA models in load modelling withclustering approach. Proc. IEEE power Tech 2005, St. Petersburg, Russia,27e30 June 2005.
[58] Pao YH, Sobajic DJ. Combined use of unsupervised and supervised learning fordynamic security assessment. IEEE Trans. Power Syst 1992;7:878e84.
[59] Batrinu F, Chicco G, Napoli R, Piglione F, Scutariu, M Postolache P, Toader C.Efficient iterative refinement clustering for electricity customer classification.Proc. IEEE power Tech 2005, St. Petersburg, Russia, 27e30 June 2005, paperno.139.
[60] Kohonen T. Springer Series in Information Science. Self-organizing maps, 30.Berlin, Germany: Springer-Verlag; 1995.
[61] Chicco G, Napoli R, Piglione F, Scutariu M, Postolache P, Toader C. Loadpattern-based classification of electricity customers. IEEE Trans. Power Syst2004;19(2):1232e9.
[62] Valero S, Ortiz M, Senabre C, Alvarez C, Franco FJG, Gabaldon A. Methods forcustomer and demand response policies selection in new electricity markets.IET Generation, Transm Distribution 2007;1(1):104e10.
[63] Ben Hur A, Horn D, Siegelmann HT, Vapnik V. Support vector clustering.J Mach Learn Res 2001;2:125e37.
[64] Chicco G, Ilie IS. Support vector clustering of electrical load pattern data. IEEETrans. Power Syst 2009;24(3):1619e28.
[65] Gerbec D, Ga�speri�c S, �Smon I, Gubina F. Allocation of the load profiles toconsumers using probabilistic neural networks. IEEE Trans. Power Syst 2005;20(2):548e55.
[66] Mutanen A, Ruska M, Repo S, Järventausta P. Customer classification and loadprofiling method for distribution systems. IEEE Trans. Power Deliv 2011;26(3):1755e63.
[67] Quinlan R. The Book C4.5: Programs for machine learning. San Mateo, CA:Morgan Kaufmann; 1993.
[68] Specht DF. Probabilistic neural networks. Neural Networks 1990;3(1):109e18.[69] Tou JT, Gonzalez RC. Pattern recognition principles. London, UK: Addison-
Wesley; 1974.[70] Bezdek JC. Pattern recognition with fuzzy objective function algorithms. New
York: Plenum Press; 1981.[71] Schweppe FC, Caramanis MC, Tabors RD, Bohn RE. Spot pricing of electricity.
Boston: Kluwer Academic Publishers; 1988.[72] Smith TB. Electricity theft d comparative analysis. Energy Policy 2003;32:
2067e76.[73] Depuru SS, Wang L, Devabhaktuni V. Electricity theft: overview, issues,
prevention and a smart meter based approach to control theft. Energy Policy2011;39(2):1007e15.
[74] Tsekouras GJ, Kotoulas PB, Tsirekis CD, Dialynas EN, Hatziargyriou ND.A pattern recognition methodology for evaluation of load profiles and typicaldays of large electricity customers. Electric Power Syst Res 2008;78(9):1494e510.
[75] Räsänen T, Voukantsis D, Niska H, Karatzas K, Kolehmainen M. Data-basedmethod for creating electricity use load profiles using large amount ofcustomer-specific hourly measured electricity use data. Appl Energy 2010;87(11):3538e45.
[76] Davies DL, Bouldin DW. A cluster Separation measure. IEEE Trans. Pattern AnalMachine Intelligence 1979;PAM-1(2):224e7.
[77] Dunn JC. Well separated clusters and optimal fuzzy partitions. J Cybernetics1974;4:95e204.
[78] Pitt BD, Kirschen DS. Application of data mining techniques to load profiling.In: Proc. IEEE PICA’99, Santa Clara, CA; 16-21 May 1999. p. 131e6.
[79] Calinski RB, Harabasz J. A dendrite method for cluster analysis. Commun Stat1974;3:1e27.


![Clustering Techniques Eng Abotaleb [Pattern Recognition Summaries ]](https://img.pdfslide.us/doc/110x75/577c789e1a28abe054907f3c/clustering-techniques-eng-abotaleb-pattern-recognition-summaries-.jpg)