Embed Size (px)
DESCRIPTION
Comparative Performance of a 30m Groundbased GSMT and a 6.5m (and 4m) NGST NAS Committee of Astronomy & Astrophysics 9 th April 2001 Matt Mountain Gemini Observatory/AURA NIO. Overview. Science Drivers for a GSMT Performance Assumptions Backgrounds, Adaptive Optics and Detectors Results - PowerPoint PPT Presentation
Citation preview

1
Comparative Performance of a 30m Groundbased GSMT and a 6.5m
(and 4m) NGST
NAS Committee of Astronomy & Astrophysics9th April 2001
Matt MountainGemini Observatory/AURA NIO
2
Overview
• Science Drivers for a GSMT• Performance Assumptions
– Backgrounds, Adaptive Optics and Detectors
• Results– Imaging and Spectroscopy
• compared to a 6.5m & 4m NGST
– A special case, • high S/N, R=100,000 spectroscopy
• Conclusions

3
GSMT Science Case“The Origin of Structure in the Universe”
From the Big Bang… to clusters, galaxies, stars and planets
Najita et al (2000,2001)
4
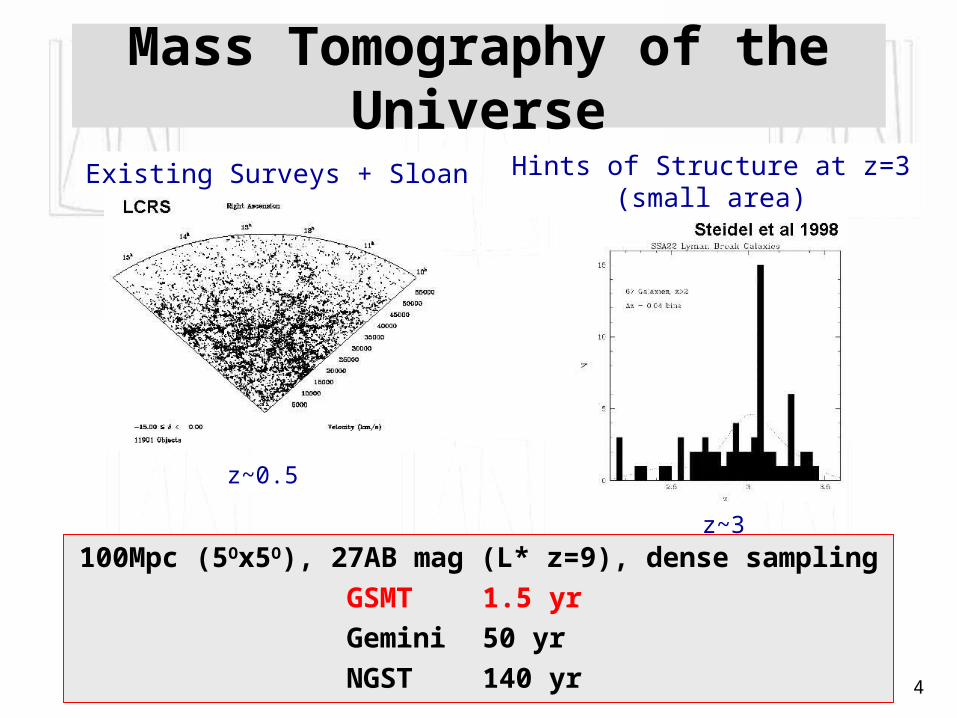
Mass Tomography of the Universe
z~0.5
Existing Surveys + Sloan
z~3
Hints of Structure at z=3(small area)
100Mpc (5Ox5O), 27AB mag (L* z=9), dense sampling
GSMT 1.5 yr
Gemini 50 yr
NGST 140 yr
5
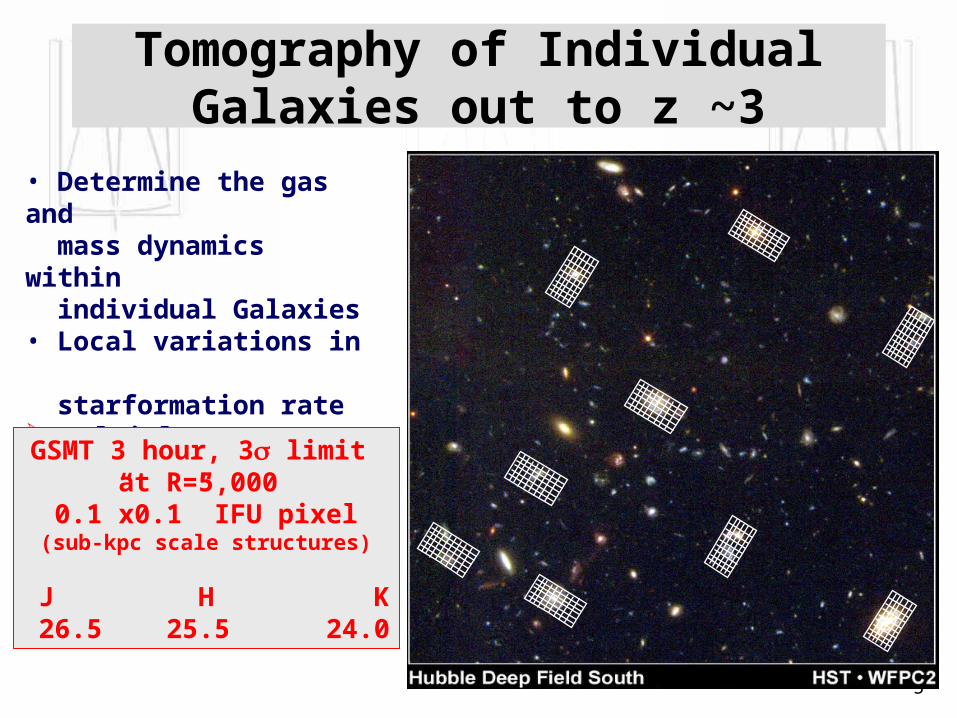
Tomography of Individual Galaxies out to z ~3
• Determine the gas and mass dynamics within individual Galaxies• Local variations in starformation rate Multiple IFU spectroscopy R ~ 5,000 – 10,000
GSMT 3 hour, 3 limit at R=5,000
0.1”x0.1” IFU pixel(sub-kpc scale structures)
J H K 26.5 25.5 24.0
6
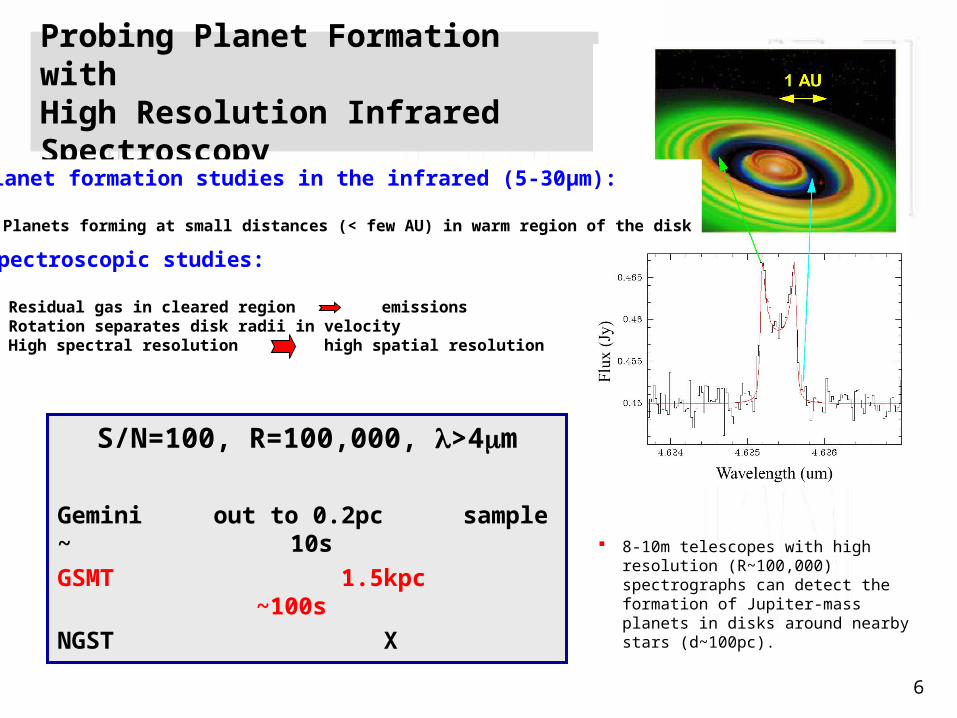
Probing Planet Formation with High Resolution Infrared Spectroscopy
Planet formation studies in the infrared (5-30µm):
Planets forming at small distances (< few AU) in warm region of the disk
Spectroscopic studies:
Residual gas in cleared region emissions Rotation separates disk radii in velocity High spectral resolution high spatial resolution
8-10m telescopes with high resolution (R~100,000) spectrographs can detect the formation of Jupiter-mass planets in disks around nearby stars (d~100pc).
S/N=100, R=100,000, >4m
Gemini out to 0.2pc sample ~ 10s
GSMT 1.5kpc ~100s
NGST X
7
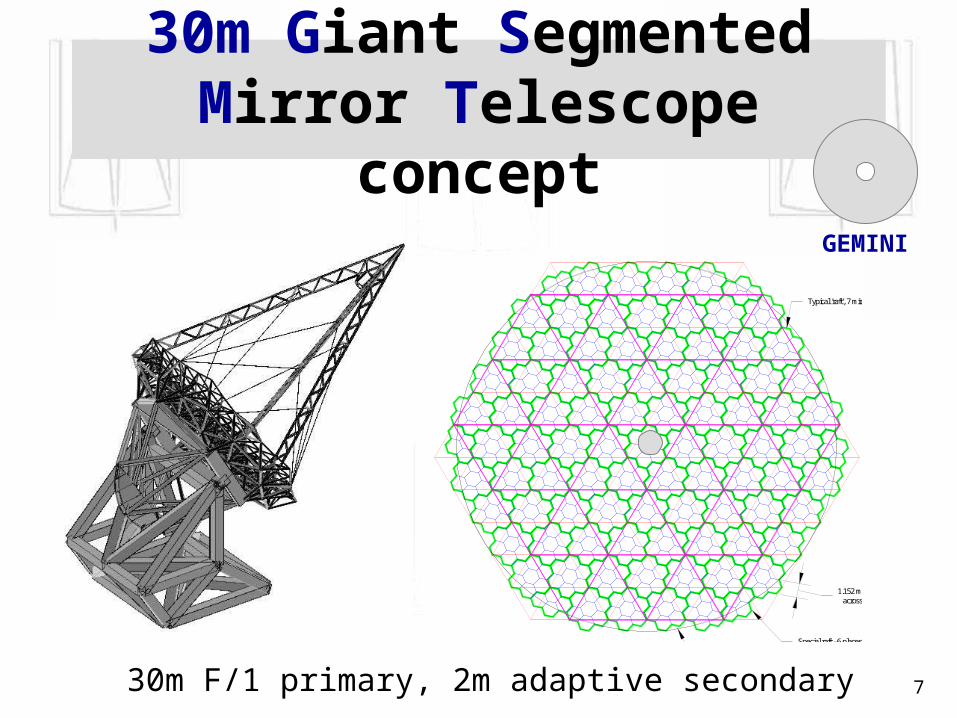
30m Giant Segmented Mirror Telescope concept
Typical 'raft', 7 mirrors per raft
Special raft - 6 places, 4 mirrors per raft
1.152 m mirror across flats
Circle, 30m dia.30m F/1 primary, 2m adaptive secondary
GEMINI

8
GSMT Control ConceptLGSs provide full sky coverage
Deformable M2 : First stage MCAO, wide field seeing improvement and M1 shape control
10-20’ field at 0.2-0.3” seeing
1-2’ field fed to the MCAO module
M2: rather slow, large stroke DM to compensate ground layer and telescope figure,
or to use as single DM at >3 m. (~8000 actuators)
Dedicated, small field (1-2’) MCAO system (~4-6DMs).
Focal plane
Active M1 (0.1 ~ 1Hz)619 segments on 91 rafts
9
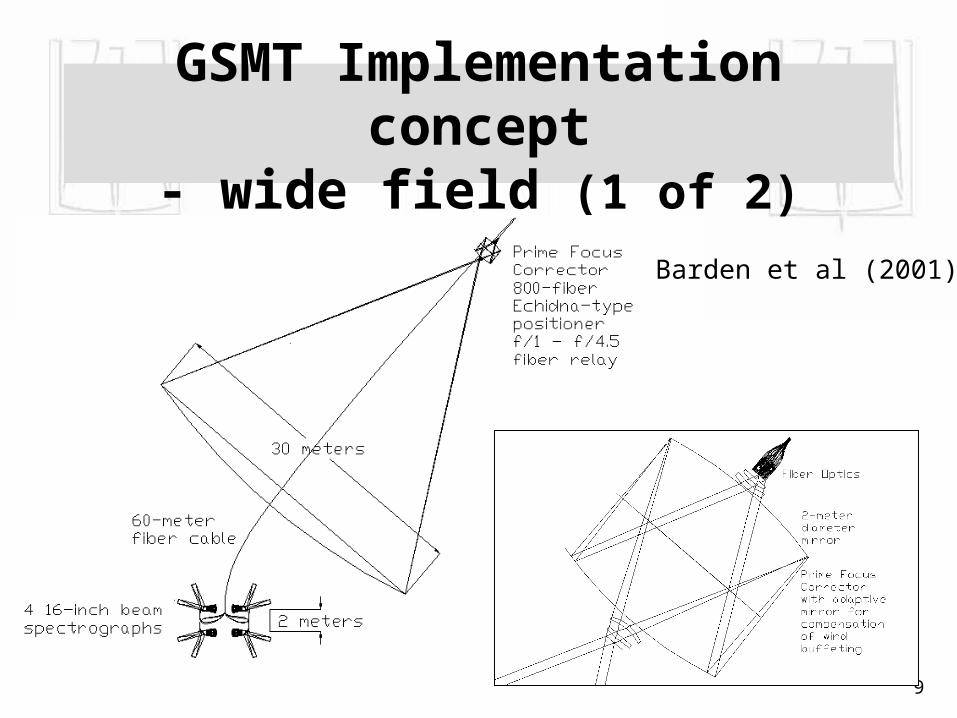
GSMT Implementation concept- wide field (1 of 2)
Barden et al (2001)

12
GSMT Implementation concept- MCAO/AO foci and instruments
MCAO opticsmoves with telescope
Narrow field AO ornarrow field seeing limited port
MCAO Imagerat vertical Nasmyth
elevation axis
4m
Oschmann et al (2001)
14
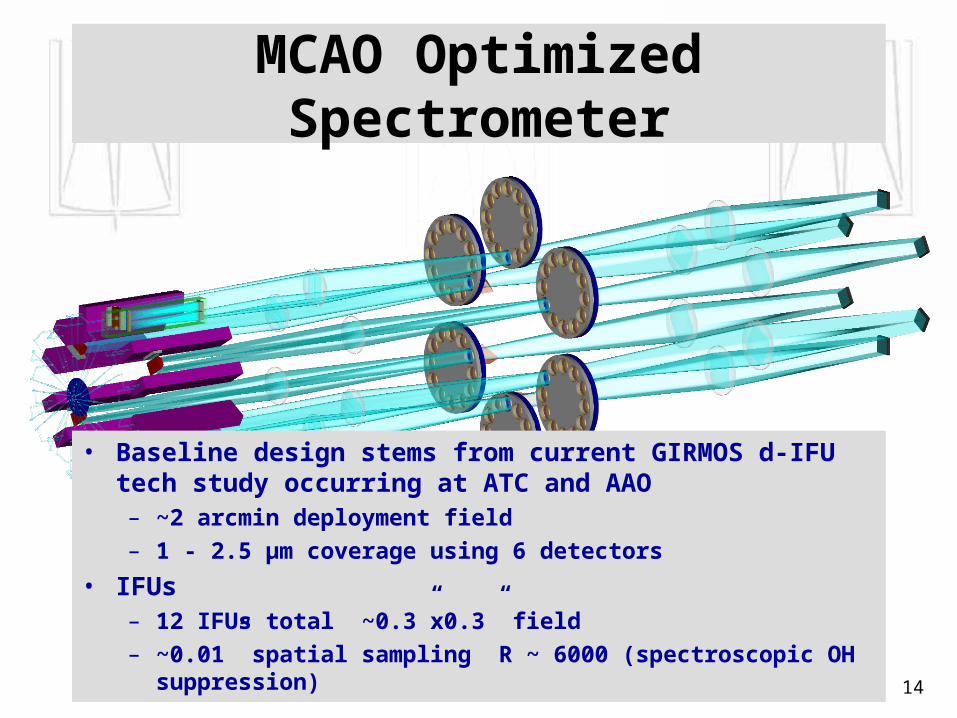
MCAO Optimized Spectrometer
• Baseline design stems from current GIRMOS d-IFU tech study occurring at ATC and AAO– ~2 arcmin deployment field
– 1 - 2.5 µm coverage using 6 detectors
• IFUs– 12 IFUs total ~0.3”x0.3” field
– ~0.01” spatial sampling R ~ 6000 (spectroscopic OH suppression)

15
Quantifying the gains of NGST compared to a groundbased telescope
• Assumptions (Gillett & Mountain 1998)• SNR = Is . t /N(t): t is restricted to 1,000s for NGST
• Assume moderate AO to calculate Is , Ibg
• N(t) = (Is . t + Ibg. t + n . Idc .t + n . Nr
2)1/2
• For spectroscopy in J, H & K assume “spectroscopic OH suppression”
• When R < 5,000 SNR(R) = SNR(5000).(5000/R)1/2
and 10% of the pixels are lost
Source noise background dark-current read-noise

16
Space verses the Ground
Takamiya (2001)
17
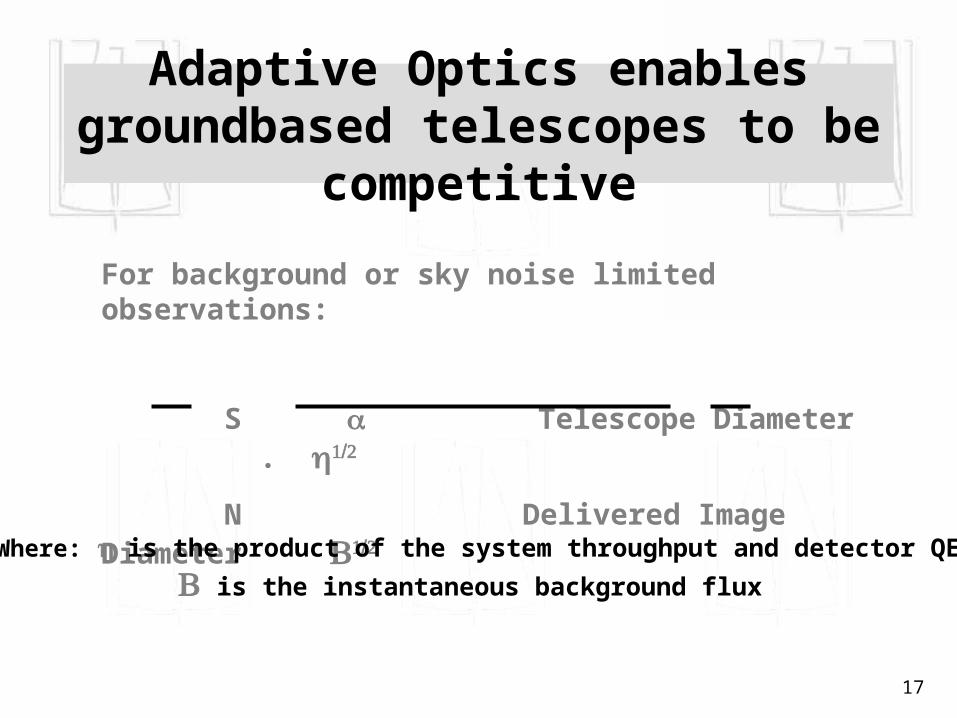
Adaptive Optics enables groundbased telescopes to be competitive
For background or sky noise limited observations:
S Telescope Diameter .
N Delivered Image Diameter
Where: is the product of the system throughput and detector QE
is the instantaneous background flux

18
Adaptive Opticsworks well
19
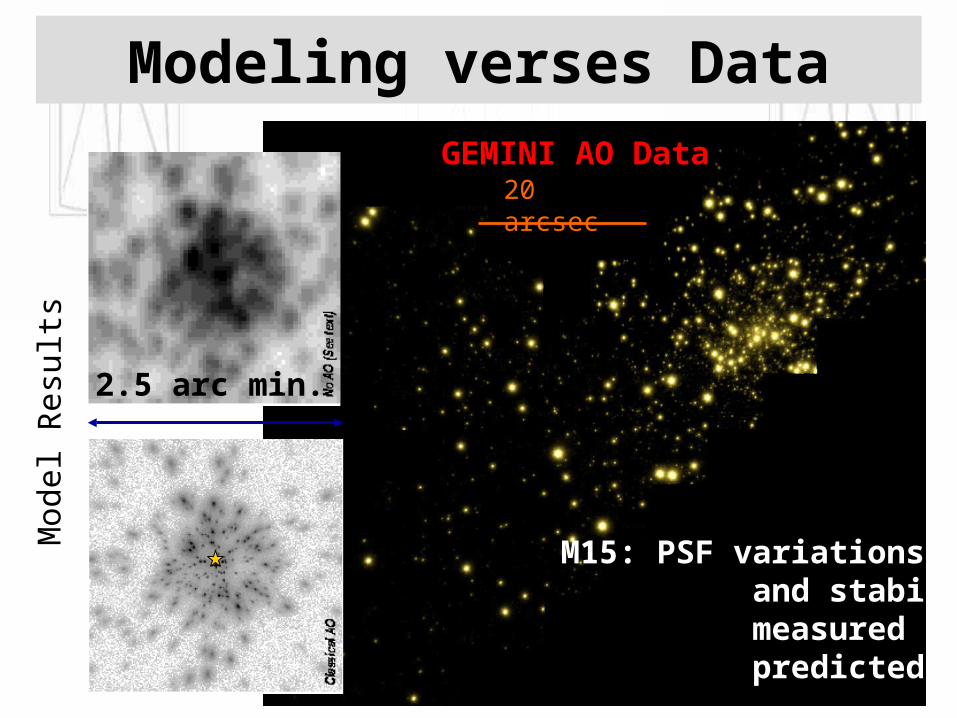
Modeling verses Data
20 arcsec
M15: PSF variations and stability measured as predicted
GEMINI AO Data
Mod
el R
e su l
ts
2.5 arc min.
20
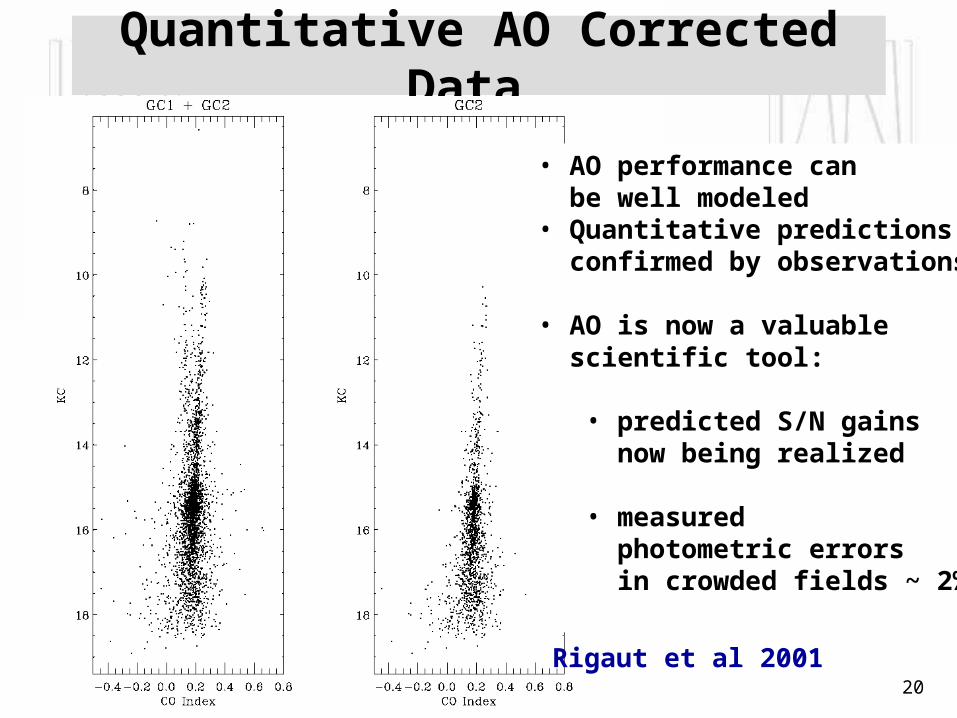
Quantitative AO Corrected Data
• AO performance can be well modeled• Quantitative predictions confirmed by observations
• AO is now a valuable scientific tool:
• predicted S/N gains now being realized
• measured photometric errors in crowded fields ~ 2%
Rigaut et al 2001

21
•Tomographic calculations correctly
estimated the measured atmospheric phase
errors to an accuracy of 92%
–better than classical AO
–MCAO can be made to work
Multi-Conjugate Adaptive Optics
MCAO
2.5 arc min.
Mod
el r
esu
lts

22
AO Technology constraints (50m telescope)
r0(550 nm) = 10cm No. of Computer CCD pixel Actuator pitch S(550nm) S(1.65m) actuators power rate/sensor
(Gflops) (M pixel/s) 10cm 74% 97% 200,000 9 x 10⁵ 800
25cm 25% 86% 30,000 2 x 10⁴ 125
50cm 2% 61% 8,000 1,500 31 SOR (achieved) 789 ~ 2 4 x 4.5
Early 21st Century technology will keep AO confined to > 1.0mfor telescopes with D ~ 30m – 50m

23
MCAO on a 30m: summary
• MCAO on 30m telescopes should be used m• Field of View should be < 3.0 arcminutes,
• Assumes the telescope residual errors ~ 100 nm rms• Assumes instrument residual errors ~ 70 nm rms
– Equivalent Strehl from focal plane to detector/slit/IFU > 0.8 @ 1 micron– Instruments must have:
• very high optical quality• very low internal flexure
(m) Delivered Strehl
1.25 0.2 ~ 0.4 1.65 0.4 ~ 0.6 2.20 0.6 ~ 0.8
9 Sodium laser constellation4 tip/tilt stars (1 x 17, 3 x 20 Rmag)
PSF variations < 1% across FOV
Rigaut & Ellerbroek (2000)

24
Modeled characteristics of a 30m GSMT with MCAO (AO only, m) and a 6.5m NGST
Assumed detector characteristics
m <m 5.5m <m
Id Nr qe Id Nr qe
0.01 e/s 4e 80% 10 e/s 30e 40%
Assumed encircled-energy diameter (mas) containing energy fraction
30M 1.2m 1.6m 2.2m 3.8m 5.0m 10m 17m 20m(mas) 23 29 41 34 45 90 154 181NGST 1.2m 1.6m 2.2m 3.8m 5.0m 10m 17m 20m (mas) 100 100 82 138 182 363 617 726
25
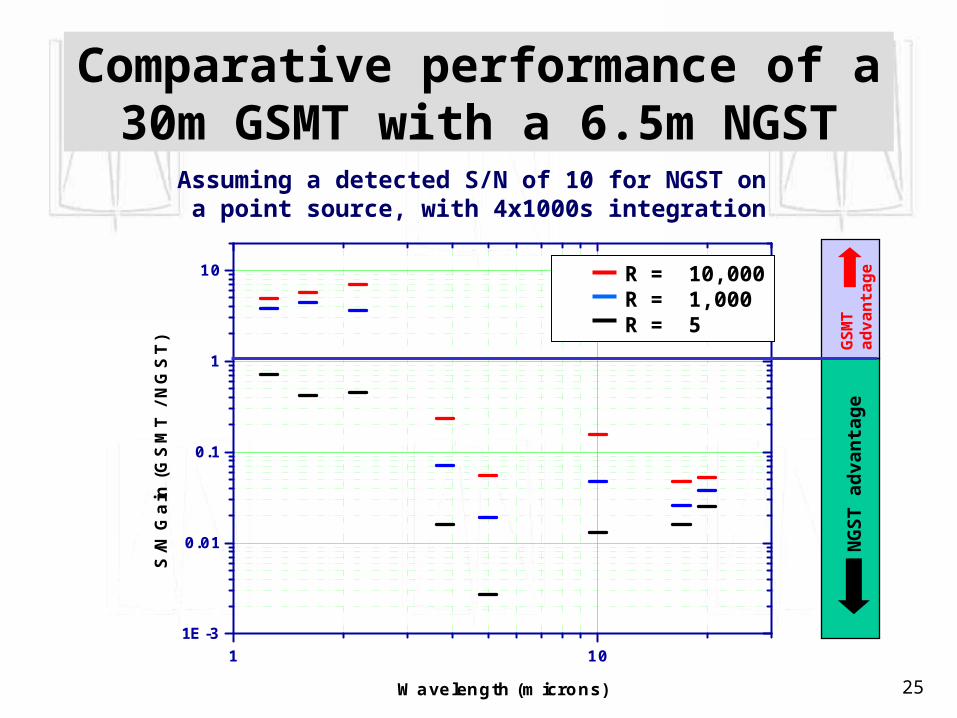
Comparative performance of a 30m GSMT with a 6.5m NGST
1 101E-3
0.01
0.1
1
10
Comparative performance of a 30m GSTM with a 6.5m NGST
S/N
Ga
in (
GS
MT
/ N
GS
T)
Wavelength (microns)
R=5 R=1,000 R=10,000
Assuming a detected S/N of 10 for NGST on a point source, with 4x1000s integration
GS
MT
a
dv
an
tag
eN
GS
T a
dva
nta
ge
R = 10,000 R = 1,000 R = 5
26
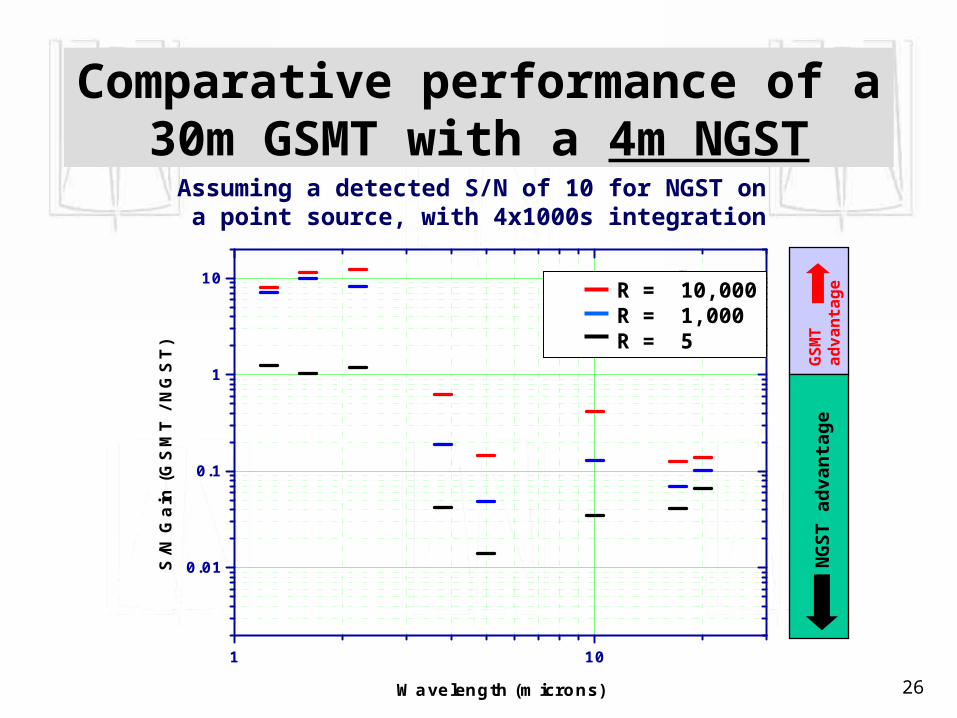
Comparative performance of a 30m GSMT with a 4m NGST
1 10
0.01
0.1
1
10
Comparative performance of a 30m GSTM with a 4.0m NGST
S/N
Ga
in (
GS
MT
/ N
GS
T)
Wavelength (microns)
R=5 R=1,000 R=10,000 R = 10,000 R = 1,000 R = 5
Assuming a detected S/N of 10 for NGST on a point source, with 4x1000s integration
GS
MT
a
dv
an
tag
eN
GS
T a
dva
nta
ge
27
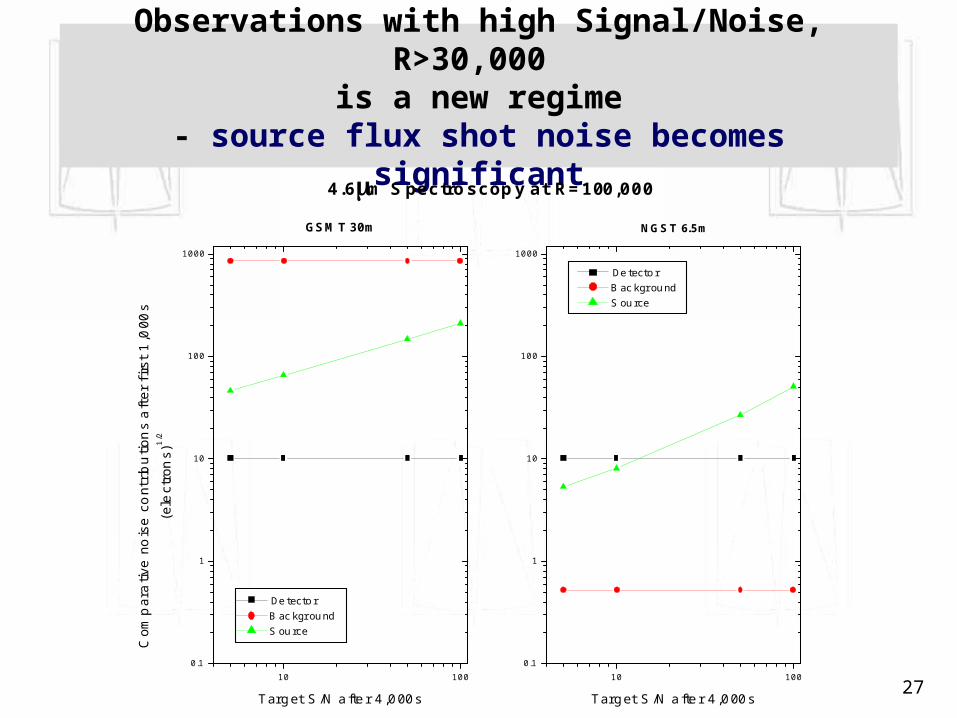
Observations with high Signal/Noise, R>30,000 is a new regime
- source flux shot noise becomes significant
10 1000.1
1
10
100
1000
10 1000.1
1
10
100
1000
GSMT 30m
Com
par
ativ
e n
ois
e c
ont
ribu
tion
s a
fter
firs
t 1
,000
s
(ele
ctro
ns)
1/2
Target S/N after 4,000s
Detector Background Source
4.6m Spectroscopy at R=100,000
NGST 6.5m
Target S/N after 4,000s
Detector Background Source
28
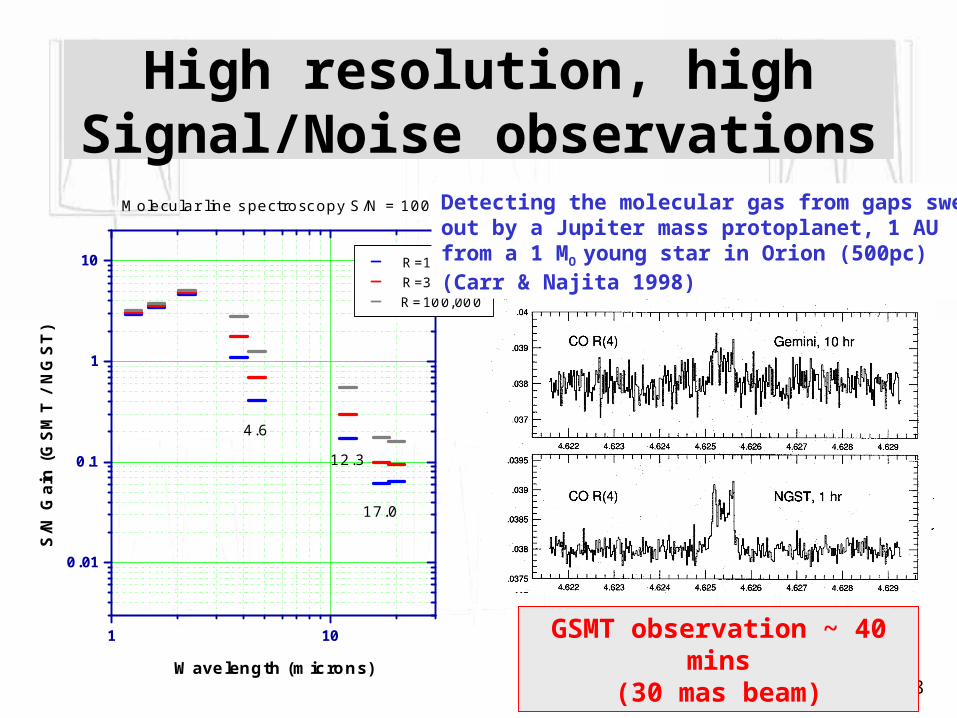
High resolution, high Signal/Noise observations
1 10
0.01
0.1
1
10
17.0
12.3
4.6
Molecular line spectroscopy S/N = 100
S/N
Gai
n (
GS
MT
/ N
GS
T)
Wavelength (microns)
R=10,000 R=30,000 R=100,000
Detecting the molecular gas from gaps sweptout by a Jupiter mass protoplanet, 1 AU from a 1 MO young star in Orion (500pc) (Carr & Najita 1998)
GSMT observation ~ 40 mins (30 mas beam)

29
Conclusions
6.5m 4.0m Comments
1. Camera 0.6 – 5 mDeep imaging from space; consistent image quality, IR background, even for < 2.5m if D>4.0m
2.MOS
R=1,000
1.2 – 2.5m
2.5 – 5.0 m
NGST MOS still competitive for < 2.5m only if D~6.0m (consistent image quality, coverage)
3.Camera
Spec. R=1500
5 – 28 m
5 – 28 m
Clear IR background advantage observing from space, even for D~4m
and R< 30,000
4. IFU
R=5,000
1.2 – 2.5m
2.5 – 5.0 m
Detector noise limited for < 2.5m D2 advantage for groundbased GSMT
For >2.5m, NGST wins even D~4m
D2 advantage for groundbased GSMT
For <12m
A advantage of GSMT,technology challenges from space (fibers)
NGST advantage GSMT advantage X
X
X
X
NGST
NG
ST
In
stru
men
t
High S/N, R~100,000 spectroscopy
WF MOS Spectroscopy m
XX
X X