Embed Size (px)
Citation preview
IZA DP No. 2938
Overskilling, Job Insecurity and Career Mobility
Seamus McGuinnessMark Wooden
DI
SC
US
SI
ON
PA
PE
R S
ER
IE
S
Forschungsinstitutzur Zukunft der ArbeitInstitute for the Studyof Labor
July 2007
Overskilling, Job Insecurity and
Career Mobility
Seamus McGuinness MIAESR, University of Melbourne
Mark Wooden
MIAESR, University of Melbourne and IZA
Discussion Paper No. 2938 July 2007
IZA
P.O. Box 7240 53072 Bonn
Germany
Phone: +49-228-3894-0 Fax: +49-228-3894-180
E-mail: [email protected]
Any opinions expressed here are those of the author(s) and not those of the institute. Research disseminated by IZA may include views on policy, but the institute itself takes no institutional policy positions. The Institute for the Study of Labor (IZA) in Bonn is a local and virtual international research center and a place of communication between science, politics and business. IZA is an independent nonprofit company supported by Deutsche Post World Net. The center is associated with the University of Bonn and offers a stimulating research environment through its research networks, research support, and visitors and doctoral programs. IZA engages in (i) original and internationally competitive research in all fields of labor economics, (ii) development of policy concepts, and (iii) dissemination of research results and concepts to the interested public. IZA Discussion Papers often represent preliminary work and are circulated to encourage discussion. Citation of such a paper should account for its provisional character. A revised version may be available directly from the author.
IZA Discussion Paper No. 2938 July 2007
ABSTRACT
Overskilling, Job Insecurity and Career Mobility*
This paper uses longitudinal data from Australia to examine the extent to which overskilling – the extent to which work-related skills and abilities are utilized in current employment – is a transitory phenomenon. The results suggest that while overskilled workers are much more likely to want to quit their current job, they are also relatively unconfident of finding an improved job match. Furthermore, some of the greater mobility observed among overskilled workers is due to involuntary job separations, and even in instances where job separations are voluntary, the majority of moves do not result in improved skills matches. JEL Classification: J62, J24 Keywords: overskilling, job insecurity, job mobility, HILDA Survey, Australia Corresponding author: Mark Wooden Melbourne Institute of Applied Economic and Social Research Alan Gilbert Building The University of Melbourne Parkville, Victoria 3010 Australia E-mail: [email protected]
* This paper uses unit record data from the Household, Income and Labour Dynamics in Australia (HILDA) Survey. The HILDA Survey Project was initiated and is funded by the Australian Government Department of Families, Community Services and Indigenous Affairs (FaCSIA) and is managed by the Melbourne Institute of Applied Economic and Social Research. The authors also acknowledge the financial support of the Australian Research Council, which funded this research through a Discovery Project Grant (# DP0663362), and the assistance of Diana Warren.
Fuelled by the expansion in education participation rates in most Western economies,
interest in the issue of overeducation has blossomed in recent decades. As a result, there is
now a large body of empirical work reporting estimates of both the incidence of
overeducation, typically derived from some assessment of the difference between educational
qualifications held and that regarded as necessary to perform the job, and the impact of
overeducation on earnings. McGuinness (2006) reviews this literature, concluding that all
studies find overeducated workers earning less than comparably educated workers who have
the appropriate qualification, with the estimated wage penalty averaging 15 per cent.
There are, however, at least two weaknesses with much of this literature. First, most
empirical studies make the assumption, at least implicitly, that qualifications are an accurate
indicator of skills, an assumption that need not necessarily hold. Indeed, what might appear
as overeducation could simply reflect some other unobserved productivity-related attribute on
which the apparently overqualified workers score relatively poorly. It thus would be
preferable if empirical research were able to use more direct measures of skills utilization
instead of the customary qualifications-based proxies.
Second, whether or not overeducation (or overskilling) imposes large costs on individuals
depends not just on the size of the wage penalty at a point in time, but on how long that
penalty persists. This has long been recognised, but reliance on cross-section data means that
this distinction is often ignored, even though there are a variety of theoretical perspectives
that suggest that overeducation will be, at most, a temporary phenomenon (see Sloane et al.,
1999). In matching theories of job search (Jovanovic, 1979), for example, overeducation is an
indication of a poor job match, and overeducated workers will seek, and achieve, better
matches over time through repeated job search activity. Rather differently, theories of career
mobility (Rosen, 1972; Sicherman and Galor, 1990) predict that workers may deliberately
enter their preferred profession at a level lower than would seem commensurate with their
1
qualifications in order to acquire the necessary skills, through on-the-job training and
learning, that will enable them to achieve more rapid career progression in the future.
There are, however, competing frameworks, including the job competition model
(Thurow, 1975) and signalling models (Spence, 1973) that predict essentially the opposite
conclusion. Ultimately, the extent to which overeducation and overskilling are permanent or
temporary states is an empirical question, and it is this question which is at the centre of this
paper. We do not pretend to be able to directly test each of the competing explanations.
Rather we test, using longitudinal data from Australia, a range of predictions from matching
and career mobility theories. Furthermore, the present study is, to the best of our knowledge,
the first to use a direct measure of skills mismatch, as opposed to the more routinely used
education-based proxies, to test these predictions. More specifically, we use longitudinal data
from Australia to test the following three hypotheses:
(i) at any point in time overskilled workers will, relative to well matched workers,
express both a greater desire to quit their current job and greater confidence with
respect to their future employment prospects;
(ii) these intentions will translate into higher rates of voluntary quits among overskilled
workers; and
(iii) job search activities and the subsequent job separations should commonly result in an
improved match and hence a reduction in the level of overskilling.
Previous Literature
As already noted, the phenomenon of overeducation and its consequences for success in
the labor market has been the subject of considerable research effort. Most of that research,
however, has focused on either the incidence of, or financial returns to, overeducation (Groot
2
and van den Brink, 2000; McGuinness, 2006). Nevertheless, a number of studies have
examined aspects of the relationship between overeducation and subsequent job mobility.
The first serious empirical treatment of the issue is provided by Sicherman (1991), who
analysed US data, collected in the 1970s, from four waves of the Panel Study of Income
Dynamics (PSID). He estimated regression models of both firm and occupational mobility,
finding positive and significant relationships with a crude measure of overeducation.
Moreover, occupational mobility was found to predominantly involve movements in an
upward direction (when using a crude ranking of the level of human capital required by broad
occupation groups). He also found that overeducated workers report receiving significantly
greater amounts of on-the-job training.
Subsequent research, however, has produced far more mixed results. On the supportive
side, some studies have reported evidence of higher rates of job mobility (e.g., Alba-Ramirez,
1993; Sloan et al., 1999; Alba-Ramirez and Blázquez, 2003), higher rates of within-firm
promotion (Hersch, 1995; Dekker et al., 2002; Alba-Ramirez and Blázquez, 2003;
Groeneveld and Hartog, 2004), or greater levels of quit intentions (Hersch, 1995; Robst,
1995) among overeducated workers. In contrast, those studies that have examined the
relationship between training and overeducation, have generally concluded that, contrary to
the predictions of the career mobility theory, on-the-job training effort is typically less among
overeducated workers (Hersch, 1995; Robst, 1995; Büchel and Mertens, 2004).
Robst (1995), who re-examined the Sicherman (1991) analysis using the same PSID data,
also found that the higher mobility of overeducated workers was simply a function of the
greater average mobility of workers in jobs that require less schooling. That said, Robst also
reported evidence that overeducated workers were more likely to move to jobs requiring
more skills, a result that is consistent with career mobility theories.
3
Sloane et al. (1999) also reported evidence that was mixed. While overeducated workers
in their UK sample were more likely to have short job tenure with their current employer,
they were also more likely to experience involuntary job separations to exit employment into
unemployment, leading the authors to conclude that the overeducated do not reap the benefits
of their increased mobility.
Rather differently, Groot and van den Brink (2003) examined job transitions over a two-
year window using data from a sample of Dutch workers and while they concluded that
relatively few workers could be classified as persistently overeducated, they also reported, in
contrast to the predictions of career mobility theories, that overeducation was not
significantly associated with either job-to-job mobility or within-firm mobility. Similarly,
Büchel and Mertens (2004) found no evidence in their West German panel dataset to support
the career mobility model. Not only were overeducated workers found to have less access to
on-the-job training, but they also experienced markedly lower levels of subsequent wages
growth than workers who were ‘adequately educated’.
Possibly the most contradictory evidence comes from studies of graduate labor markets.
Dolton and Vignoles (2000), for example, reported that 38 per cent of a large sample of UK
graduates in 1980 was overqualified in their first job, and six years later this proportion still
stood at 30 per cent. Similarly, McGuinness (2003) reported that among a sample of
graduates in Northern Ireland, 31 per cent indicated that a university degree was not a
requirement for their first job after education, and after 2 to 4 years this proportion was still at
24 per cent. Even more striking, Frenette (2004) reported on longitudinal data for Canadian
graduates which showed little evidence of any decline in the incidence of overeducation over
a three-year window (between two and five years after graduation).
All of the evidence reviewed so far is concerned with overeducation, defined by some
observable mismatch between qualifications obtained and that required to fulfil the
4
requirements of the job. These studies, therefore, do not provide direct evidence about the
consequences of skills mismatch, and there are at least three reasons to believe that measures
of education mismatch may not be well correlated with measures of skills mismatch. First,
and as argued by Green and McIntosh (2007), measures of overeducation ignore human
capital accumulated through on- and off-the-job training and work experience as well as other
abilities that are correlated with productivity. It has, for example, been well established that
overeducation is much more common among recent school leavers, and thus can be explained
by their relative lack of work experience. Second, the measures of overeducation most
commonly used in the literature simply compare some indicator of the level of education
obtained (e.g., years of schooling) with the level of education required, and as such make no
accounting for the degree of fit between the type of education obtained and that required.
Third, given some employers are using educational qualifications as a mechanism to screen
potential workers, then in some jobs the formal job entry requirements may greatly exceed
that required to successfully perform the work. Workers taking such jobs would thus typically
be overskilled but would not usually be measured as overqualified.
For these reasons it would be preferable to measure overskilling more directly by asking
workers to assess the extent of their accumulated knowledge and skills, irrespective of
whether they were accumulated in formal education or in the workplace, and to benchmark
these against the actual skill requirements of their job. Furthermore, the limited empirical
research that has been undertaken suggests that this distinction between overeducation and
overskilling is not trivial. Allen and van der Velden (2001), for example, drew on survey data
collected from a cohort of Dutch tertiary education graduates and reported that while there
was a clear relation between responses to a subjective question on skills utilization and
educational mismatch, the relationship was ‘relatively weak’ (Allen and van der Velden,
2001: 440). Similarly, McIntosh and Green (2007) reported a relatively low correlation, of
5
just 0.2, between measures of overskilling and overeducation in their UK cross-section data.
We are, however, unaware of any previous research that has examined persistence in
overskilling.
Data
The data for this study comes from the first four waves of the Household, Income and
Labour Dynamics in Australia (HILDA) Survey. Discussed in more detail in Wooden and
Watson (2007), it began in 2001 with a national probability sample of Australian households.
Interviews were completed at 7,682 of the11,693 households identified as in scope for wave
1. The members of these participating households form the basis of the panel pursued in the
subsequent waves of interviews, which are conducted approximately one year apart.
Interviews are conducted with all adults (defined as persons aged 15 years or older on the
30th June preceding the interview date) who are members of the original sample as well as
any other adults who, in later waves, are residing with an original sample member. Re-
interview rates are reasonably high, rising from 87 per cent in wave 2 to over 94 per cent in
wave 4. When pooled over the first four waves of data collection, the dataset comprises a
total of 52,146 observations from 16,556 people.
The sample used here begins with the unbalanced panel of working-age (15 to 64 years)
employees not undertaking full-time study, which provides a dataset comprising 23,851
observations spread over 9013 individuals. The data used to construct the overskilling
variable, however, come from the self-administered component of the survey, which is only
completed by a subset of persons interviewed; on average about 92 per cent of interview
respondents complete and return the self-administered questionnaire. This reduces the sample
6
size to 21,649, but missing data on variables of interest reduces the number of observations
used in the estimations to as few as 14,664, depending on the model specification.
Central to this study is the measure of overskilling, which is derived from responses,
scored on a 7-point scale, to the question “I use many of my skills and abilities in my current
job”. A response of 1 corresponds with strongly disagree and 7 with strongly agree. The
question is similar to that used in both the work of Allen and van der Velden (2001) and
Green and McIntosh (2007).1 All respondents in the sample were then classified into one of
three groups for each yearly observation: (i) the severely overskilled (individuals selecting 1,
2 or 3 on this scale); (ii) the moderately overskilled (those selecting 4 or 5); and (iii) the well
matched (individuals selecting 6 or 7).
As reported in Table 1, this classification suggests that, over the period 2001 to 2004,
between 13 and 15 per cent of Australian employees were severely overskilled, 26 to 29 per
cent were moderately overskilled, and approximately 55 to 60 per cent of employees had jobs
that were a reasonably good match with their skills. At first glance, the rates of severe
overskilling measured here are similar to the rates of overeducation reported previously using
other Australian data by Voon and Miller (2005). However, once we employ a similar sample
to that used by Voon and Miller (all full-time employed persons aged 20 to 64) we find the
incidence of severely overskilled workers to be lower, ranging between 9 and 12 per cent.
Turning to our measures of mobility and expected mobility, we first assess the extent to
which overskilling is associated with perceived probabilities of quitting, job loss and
regaining similar quality employment in the event of job loss. These three outcome variables
1 In the data employed by Allen and van der Velden (2001), a measure of skills underutilization is constructed from responses, scored on a 5-point scale, to the statement: “My current job offers me sufficient scope to use my knowledge and skills”. In contrast, Green and McIntosh (2007) combine responses to two items, both of which have four possible response options. These items are: “In my current job I have enough opportunity to use the knowledge and skills that I have” and “How much of your past experience, skills and abilities can you make use of in your present job?”
7
are derived from questions that are close to identical to those used in the US study of job
insecurity by Manski and Straub (2000). They are all probabilistic in nature with responses
ranging between 0 and 100, but with many observations grouped at the lower (in the case of
the quit and job loss variables) and upper (in the case of the re-employment variable) limits.
The three questions elicit expectations about the likelihood of future involuntary job loss, the
likelihood of finding another comparable job in the event of job loss, and the likelihood of
future voluntary job separation. The precise wording of the three questions, as implemented
in the HILDA Survey, is as follows:
Involuntary job loss: What do you think is the per cent chance that you will lose your
job within the next 12 months? (That is, get retrenched or fired or not have your
contract renewed.)
Re-employment prospects: If you were to lose your job during the next 12 months,
what is the per cent chance that the job you eventually find and accept would be at
least as good as your current job, in terms of wages and benefits?
Voluntary separation (or quits): What do you think is the per cent chance that you
will leave your job voluntarily (that is, quit or retire) during the next 12 months?
These probabilistic measures contrast with the more conventional approaches that abound
in most surveys that collect information on job characteristics. In these approaches it is
customary to pose some statement about the security of the job and then ask respondents how
much they agree or disagree with the statement using an ordinal response scale. As Manski
and Straub (2000: 449-450) observe, these sorts of measures provide data that may not be
interpersonally comparable (since different people will interpret response options such as
“strongly agree” or “very likely” in different ways). Further, the data provided are only
ordinal in nature and so tell us relatively little about the magnitude of different responses.
8
Summary statistics describing these three measures are provided in Table 2. Specifically
this table reports, for each wave and for each variable, the mean and a summary measure of
the distribution of each. Similar to the figures reported by Manski and Straub (2000) for the
US in the late 1990s, the distribution of responses to both the involuntary job loss and
voluntary quits questions are highly skewed, with at least 50 per cent of Australian
employees believing they face a zero chance of losing their jobs or voluntarily quitting (in the
next 12 months). In contrast, responses to the question on re-employment prospects are much
more dispersed. Note also that these means and distributions are fairly stable over the four
waves. The notable exception is the mean probability of involuntary job loss which, not
surprisingly given the strengthening of the Australian labor market over this period, has been
falling. Nevertheless, we suspect the marked drop between wave 1 and wave 2 also reflects
the modification in the wording of the question on which this variable is based.2
The key feature of the HILDA Survey is that it is a panel survey and hence we can
observe job separations that occur in the years following the initial interview. Moreover, the
data collected enable us to distinguish between voluntary and involuntary separations.
Individuals who had changed jobs or ceased working since the previous wave are asked to
provide information on why they left their previous employer. Those individuals who were
laid off, made redundant or dismissed were classified as having been subject to an
involuntary job separation. Respondents who left their previous job for career or lifestyle
reasons were deemed to have left voluntarily3, with remaining explanations grouped into a
2 The wording of this question was slightly longer in wave 1, making specific reference to being “laid off” and “made redundant”. 3 Individuals were classified as having voluntarily separated if they gave any of the following as their main reason for leaving their previous employer: (i) not satisfied with job; (ii) to obtain a better job / just wanted a change / to start a new business; (iii) retired / did not want to work any longer; (iv) to stay at home to look after children, house or someone else; (v) travel / have a holiday; (vi) returned to study / started study / needed more time for study; (vii) too much travel time / too far from public transport; (viii) change of lifestyle; or (ix) immigration.
9
miscellaneous ‘other’ category.4 Summary statistics describing the (approximately annual)
rate of job separations in our data are presented in Table 3. These estimates are in line with
the rates of job separation that can be calculated from national cross-section surveys.5
Methods
Three main types of analyses are reported on in this paper. First, we pool data from the
first four survey waves and estimate models explaining the variation across individual
employees in their perceived probabilities of job loss, quitting and regaining employment in
the event of job loss. With dependent variables of this nature (i.e., probabilistic), Wagner
(2001) demonstrates that the fractional logit model, developed by Papke and Wooldridge
(1996), is the most suitable approach as it overcomes many of the flaws associated with the
more widely used Tobit and least squares estimators, and consequently is applied here.
Papke and Wooldridge (1996) propose a non-linear function for estimating the expected
values of dependent variables yi conditional on a vector of covariates xi
( ) (|i i iE y x G x )β= (1)
where G is any cumulative distribution function and the betas are the true population
parameters. They chose a logistic distribution
( ) ( )( )
exp|
1 expi i
i
ixE y x
xββ
=+
(2)
and suggest the use of the Bernoulli log-likelihood function
4 These reasons include temporary or seasonal work, spouse transferred, pregnancy, sickness or disability, and any reason that could not be classified. 5 Data from the Australian Bureau of Statistics Labour Mobility Survey for the 12 months ended February 2004 (ABS 2004), for example, give a job mobility rate among all employed persons in Australia of 17.8 per cent.
10
( ) ( ) ( ) ( )log 1 log 1i i i i il y G x y G xβ β= + − −⎡ ⎤ ⎡⎣ ⎦ ⎣ β ⎤⎦ (3)
to obtain the quasi-maximum likelihood estimator, β̂ . The covariates selected for this
analysis include controls for the usual array of demographic characteristics (such as sex, age
and marital status) as well as controls for various job characteristics, including job
complexity and upskilling. Both of these latter variables are based on subjective responses to
questions similar to those used in the construction of the overskilling variable. Brief
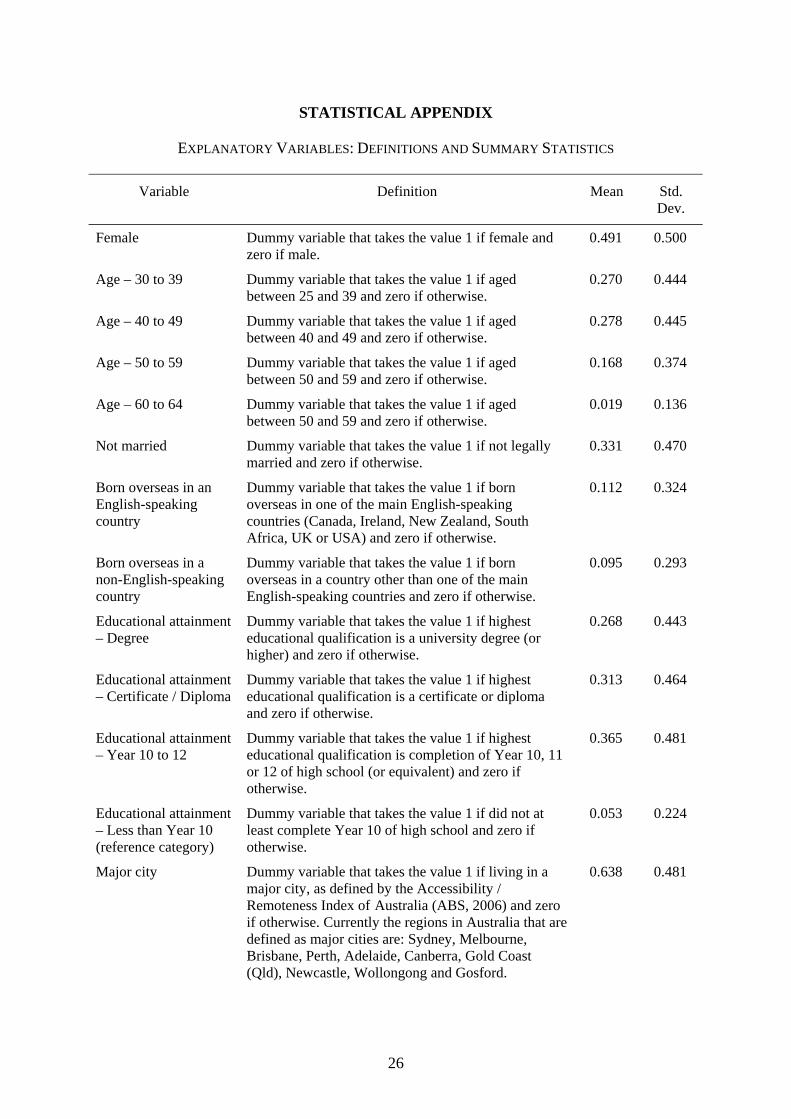
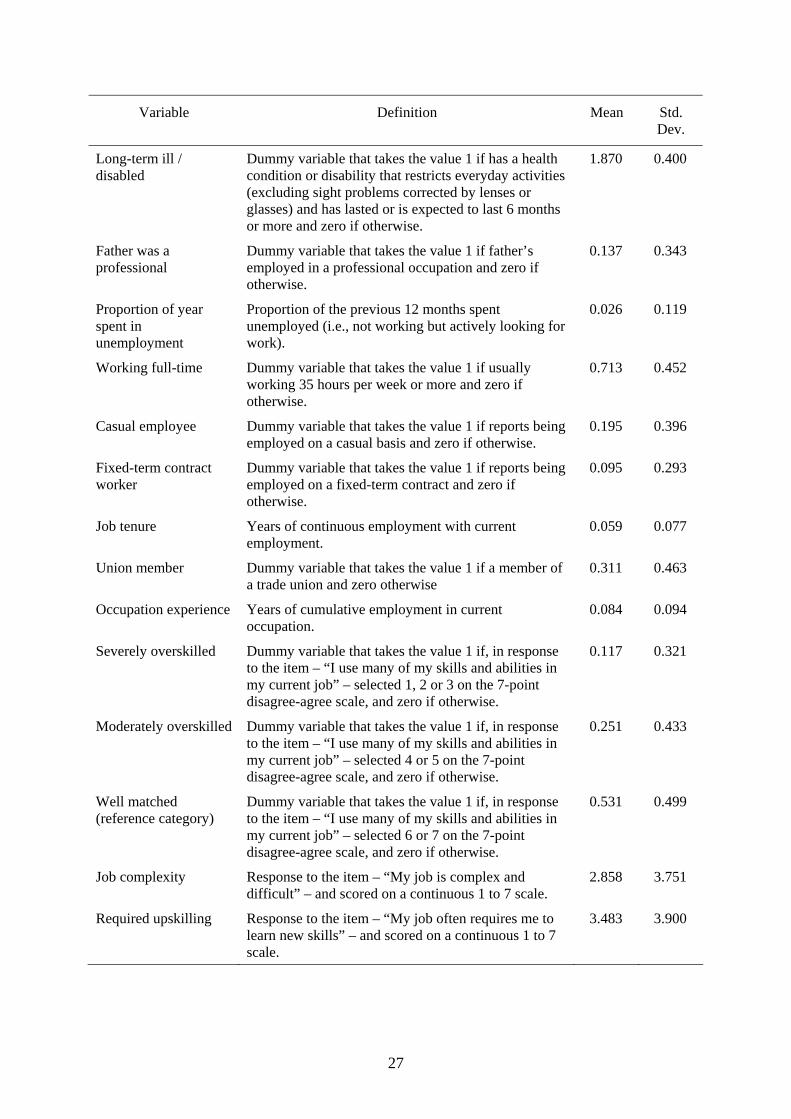
definitions for all of the explanatory variables used in the analysis, along with summary
sample statistics, are provided in a Statistical Appendix.
We next make use of the panel nature of the data to test whether or not overskilled
workers are more likely to experience voluntary and involuntary job separations in the
following period. We construct two binary variables which distinguish those employees who
voluntarily separate from their jobs in the year ahead from those who remain with their
current employer, and those employees who involuntarily separate from their job. The binary
nature of these outcome variables suggests the estimation of probit models.6 Furthermore, we
attempt to control for unobserved heterogeneity across individuals by estimating a probit
model with a random error component (the random effects specification). The sample used
for estimation is an unbalanced panel with all explanatory variables measured at time t and
the outcomes measured at t+1. In effect, we use data drawn from three waves.
Finally, having established the relationship between overskilling and job separation, we
report simple descriptive statistics on the extent to which voluntary job separations are
associated with subsequent reductions in the incidence of overskilling.
6 This specification effectively assumes the two separation outcomes are independent, which is not the case. A superior specification would be to define one single variable that distinguishes between four different outcomes at t+1: no change in employer; voluntary separation; involuntary separation; and other type of job change. The usual estimator for such models is the multinomial probit (or logit). Estimation of such models with random effects, however, is computationally difficult and convergence problems are common.
11
Results
Perceptions of Job Security
The results of the fractional logits explaining variations in perceptions of probabilities of
voluntary job separation, involuntary job loss and re-employment prospects are reported in
Table 4. As previously noted, each model is estimated on a pooled sample (waves 1 to 4)
with cross-sectional weights applied. Although no pseudo R-squared is available with this
estimator, we suspect that, due to the highly dispersed nature of the probability distributions,
our models would only explain a very small proportion of the overall variation in the data.
Nevertheless, the regression is highly statistically significant and in any case, it is only the
reported marginal effects that are of interest here.
If workers are either accidentally mismatched or choose a low career entry point as a
means of gaining experience essential for later progression, then we would expect
mismatched workers, on average, to be relatively confident with respect to their ability to
gain similar (presumably mismatched) employment. Similarly, workers accidentally
mismatched or engaging in strategic mismatching for career purposes will be more likely to
seek an improved match through job mobility and should, therefore, tend to have higher quit
probabilities. Conversely, mobility type theories give us no reason to believe that mismatched
workers will be more likely to fear job loss; if anything, the opposite should hold.
In line with these predictions, the results indicate that, relative to the well matched base
case, severely overskilled workers believe themselves, on average, to be 10 per cent more
likely to quit within 12 months, while moderately overskilled workers are 2 per cent more
likely to quit. However, there are no indications that overskilled workers believe that it would
be relatively easy to secure similar quality employment in the event of job loss. The intention
to quit is thus not necessarily accompanied by an anticipated improvement in skills match.
Indeed, moderately matched workers believe that they would have relatively greater difficulty
12
in finding similar, presumably equally underutilized, employment in the event of a job loss.
Also counter to expectations, overskilled workers were found to be more likely to fear job
loss relative to their well matched counterparts, though the size of this effect is much smaller
in absolute size than the relationship with quit probabilities. Taken together, these results
provide only mixed support for the career mobility theory. While overskilled workers have
much higher quit probabilities, they are no more confident than other workers of securing a
better job where their skills would presumably be better matched.
While not central to this paper, the results on the other covariates are largely consistent
with expectations. Thus we find expectations of involuntary job loss greatest among persons
with a recent history of unemployment, immigrants from a non-English-speaking
background, and among persons employed on a casual or fixed-term contract, and decline
with job tenure and occupational experience. Voluntary quit probabilities, on the other hand,
are highest among young single people, the university educated, and casual employees, and
decline with job tenure. They also tend to be relatively low among immigrants from a non-
English-speaking background, the long-term ill and disabled, union members, and people
living outside the major cities. Finally, re-employment prospects decline precipitously with
age and the amount of time in the past year spent in unemployment. They are also strongly
correlated with educational attainment, ethnicity, place of residence, ill-health and disability,
union membership, hours of work, job tenure, and occupational experience.
Also of note, the measures of job complexity and upskilling required by the job are also
significantly associated with quit probabilities, but not the probability of involuntary job loss.
Workers who reported their job to be complex or difficult are more likely to want to quit and
are also slightly less confident of regaining similar quality employment, suggesting the
variable may be a proxy for underskilling. On the other hand, workers who report that their
job requires upgrading of their skills were found to have lower subjective quit probabilities.
13
Job Mobility
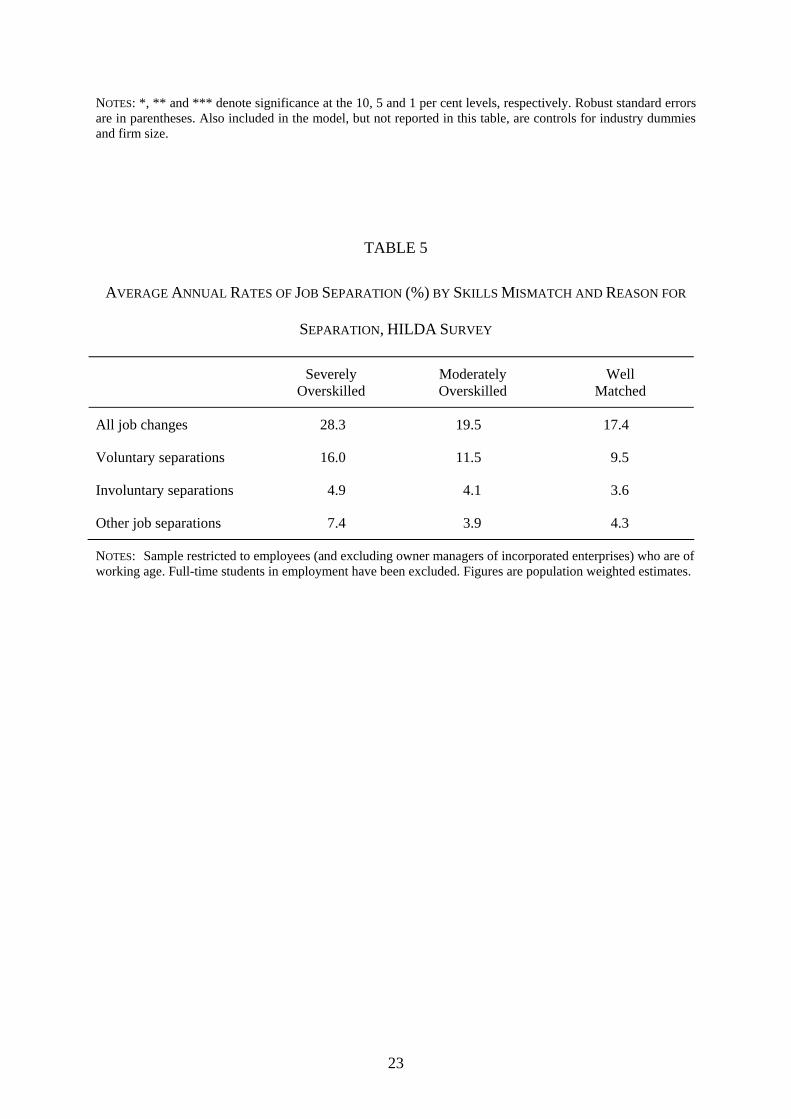
Turning now to our analysis of actual job mobility, and consistent with previous research
in other countries, cross-tabulated data reveal that the overall rate of job mobility is much
higher among overskilled workers (Table 5). Furthermore, when job separations are
reclassified according to whether they were voluntary or involuntary we observe, consistent
with the view that mismatches tend to be transitory, that overskilled workers have much
higher rates of voluntary job separation than well matched workers.
Table 5 also reveals that the severely overskilled are more likely to be job mobile for
other reasons, including involuntary job losses. While we made no predictions about the
relationship between involuntary job loss and overskilling, such findings are not inconsistent
with matching theories, and may simply indicate that in some cases it is the employer who is
first to identify and act on a poor match.
But do these conclusions continue to hold once we take account of other factors, both
observed and unobserved, that influence job separations? Table 6 reports the estimated
marginal effects from random effects probit models predicting the likelihood of both
involuntary and voluntary job separations that include the overskilling variable along with a
small number of individual-level covariates (sex, age, marital status, immigrant status,
education and fathers’ occupational status). These results confirm that overskilling is
associated with an elevated probability of voluntary job separation, with severe overskilling
associated with a 5.6 per cent higher probability of having voluntarily left their job one year
later. For moderately overskilled workers the estimated marginal effect is 2.1 per cent. These
results also confirm that severely overskilled workers are more likely to be laid off, though
the size of the effect, while statistically significant, is, at less than one per cent, quite small.
Of course it needs to borne in mind that many of the overskilled workers previously under
threat of job loss will have left voluntarily prior to the lay off actually occurring. The results
14
presented here thus understate the extent to which overskilling enhances the probability of
layoff.
Job Mobility and Changes in Skills Mismatch
We have established that overskilled workers are much more likely to separate from their
current employer, but do these separations necessarily lead to improved job matches? To get
at this we focus on the sub-population of employees who voluntarily left their job between
wave 1 and wave 2 and compare their employment situation prior to leaving their current
employment with their employment situation at both the next survey wave and three years
later. Results are summarised in Table 7. This table reveals that among the severely
overskilled who left their job voluntarily, around one half were in jobs at the next survey
wave where their skills were still not well utilized, and less than one in five were in a job
where their skills were adequately utilized. By contrast, among those voluntary job leavers
who were not overskilled in their previous job, less than one in four were re-employed in jobs
that did not make adequate use of their skills.
As would be expected, Table 7 also shows that many job leavers (close to one quarter)
will not be re-employed by the time of the next survey wave. But what is slightly more
surprising is that exits into non-employment are also more common among the severely
overskilled. Thus not only do many of the overskilled job leavers find alternative
employment that is little or no better than their previous job in terms of skills utilization, a
sizeable proportion will not re-enter the workforce, at least not quickly. It is possible,
however, that the figures in Table 7 might be misleading due to the inclusion of retirement
among the reasons for voluntary job departure. We thus reconstructed the cross-tabulation
reported in Table 7 after excluding exits into retirement.7 These revised results suggest the
7 Retirement should be interpreted very broadly here, and includes not just persons who respond that they have retired, but also persons who indicate that they do not wish to work any longer.
15
difference between the overskilled and the well matched is, if anything, slightly greater than
suggested by Table 7. Once we exclude retirees we find that 22 per cent of the severely
overskilled are still out of work one year later compared with less than 15 per cent of the well
matched.
Finally, and perhaps, most importantly, Table 7 suggests that any improvement in skills
match over time is sluggish at best. Of those severely overskilled workers who left their jobs
voluntarily in wave 1, less than one in four (23.4%) were in jobs three years later which made
adequate use of their skills and abilities.
Summary and Conclusions
As has been previously found with respect to overeducated workers, the longitudinal data
analysis undertaken in this paper confirms that the overskilled are much more job mobile than
other workers who are in jobs that provide a better skills match. Such findings are usually
taken as evidence in support of either matching or career mobility theories (or both). The
results presented here, however, suggest that such strong conclusions are not warranted.
While the overskilled are indeed highly mobile, they are not any more confident than other
workers about their prospects of securing equivalent, let alone better, jobs. Most importantly
of all, the majority of overskilled workers who quit their jobs are not re-employed in jobs
where their skills are well used. Instead, most remain either in jobs where their skills are not
adequately utilised or exit the workforce entirely.
16
REFERENCES
Alba-Ramirez, Alfonso. 1993. “Mismatch in the Spanish Labor Market.” Journal of Human
Resources 28(2): 259-78.
Alba-Ramirez, Alfonso, and Maite Blázquez. 2003. “Types of Job Match, Overeducation and
Labour Mobility in Spain.” In Overeducation in Europe, edited by Felix Büchel,
Andries de Grip and Antje Mertens, pp. 65-92. Cheltenham (UK): Edward Elgar.
Allen, Jim, and Rolf van der Velden. 2001. “Educational Mismatches versus Skill
Mismatches: Effects on Wages, Job Satisfaction, and On-the-job Search.” Oxford
Economic Papers 53(3): 434-52.
Australian Bureau of Statistics (ABS). 2004. Labour Mobility, Australia: February 2004.
ABS cat. No. 6209.0. Canberra: ABS.
Australian Bureau of Statistics (ABS). 2006. Statistical Geography Volume 1 – Australian
Standard Geographical Classification (ASGC). ABS cat. no. 1216.0. Canberra: ABS.
Büchel, Felix, and Antje Mertens. 2004. “Overeducation, Undereducation, and the Theory of
Career Mobility.” Applied Economics 35(8): 803-16.
Dekker, Ron, Andries de Grip and Hans Heijke 2002. “The Effects of Training and
Overeducation on Career Mobility in a Segmented Labor Market.” International
Journal of Manpower 23(2): 106-25.
Dolton, Peter, and Anna Vignoles. 2000. “The Incidence and Effects of Overeducation in the
U.K. Graduate Labour Market.” Economics of Education Review 19(2): 179-98.
Frenette, Marc. 2004. “The Overqualified Canadian Graduate: The Role of the Academic
Program in the Incidence, Persistence, and Economic Returns to Overqualification.”
Economics of Education Review 23(1): 29-45.
17
Green, Francis, and Steven McIntosh. 2007. “Is There a Genuine Under-utilization of Skills
Amongst the Over-qualified?” Applied Economics 39(4): 427-39.
Groeneveld, Sandra, and Joop Hartog. 2004. “Overeducation, Wages and Promotions within
the Firm.” Labour Economics 11(6): 701-14.
Groot, Wim, and Henriëtte Maassen van den Brink. 2000. “Overeducation in the Labor
Market: A Meta-analysis?” Economics of Education Review 19(2): 149-58.
Groot, Wim, and Henriëtte Maassen van den Brink. 2003. “The Dynamics of Skills
Mismatches in the Dutch Labour Market.” In Overeducation in Europe, edited by Felix
Büchel, Andries de Grip and Antje Mertens, pp. 49-64. Cheltenham: Edward Elgar.
Hersch, Joni. 1995. “Optimal ‘Mismatch’ and Promotions.” Economic Inquiry 33(4): 611-24.
Jovanovic, Boyan. 1970. “Job Matching and the Theory of Turnover.” Journal of Political
Economy 87(5): 972-90.
Manski, Charles F., and John D. Straub. 2000. “Worker Perceptions of Job Insecurity in the
Mid-1990s: Evidence from the Survey of Economic Expectations.” Journal of Human
Resources 35(3): 447-79.
McGuinness, Seamus. 2003. “University Quality and Labour Market Outcomes.” Applied
Economics 35(18): 1943-55.
McGuinness, Seamus. 2006. “Overeducation in the Labour Market.” Journal of Economic
Surveys 20(3): 387-418.
Robst, John. 1995. “Career Mobility, Job Match, and Overeducation.” Eastern Economic
Journal 21(4): 539-50.
Rosen, Sherwin. 1972. “Learning and Experience in the Labour Market.” Journal of Human
Resources 7(3): 326-42.
18
Sicherman, Nachum. 1991. “Overeducation in the Labor Market.” Journal of Labor
Economics 9(2): 101-22.
Sicherman, Nachum, and Oded Galor. 1991. “A Theory of Career Mobility.” Journal of
Political Economy 9(2): 101-22.
Sloane, P.J., H. Battu, and P.T. Seaman. 1999. “Overeducation, Undereducation and the
British Labour Market.” Applied Economics 31(11): 1437-53.
Spence, Michael A. 1973. “Job Market Signalling”. Quarterly Journal of Economics 87(3):
353-74.
Thurow, Lester. 1975. Generating Inequality. New York: Basic Books.
Papke, Leslie E., and Jeffrey M. Wooldridge. 1996. “Econometric Methods for Fractional
Response Variables with an Application to 401(k) Plan Participation Rates.” Journal of
Applied Econometrics 11(6): 619-32.
Voon, Derby and Paul W. Miller. 2005. “Undereducation and Overeducation in the
Australian Labour Market.” The Economic Record 81(Special Issue): S22-S33.
Wagner, Joachim. 2001. “A Note on the Firm Size – Export Relationship.” Small Business
Economics 17(4): 229–37.
Wooden, Mark, and Nicole Watson. 2007. “The HILDA Survey and its Contribution to
Economic and Social Research (So Far).” The Economic Record 83(261): 208-31.
19
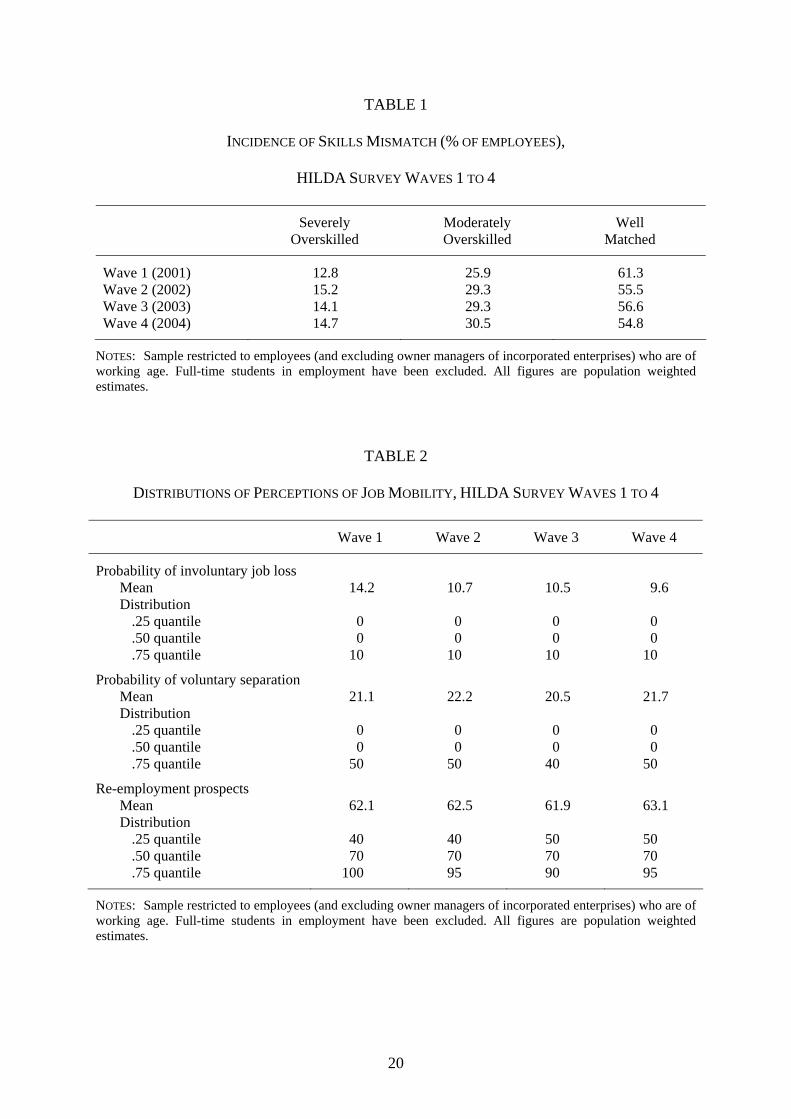
TABLE 1
INCIDENCE OF SKILLS MISMATCH (% OF EMPLOYEES),
HILDA SURVEY WAVES 1 TO 4
Severely Overskilled
Moderately Overskilled
Well Matched
Wave 1 (2001) 12.8 25.9 61.3 Wave 2 (2002) 15.2 29.3 55.5 Wave 3 (2003) 14.1 29.3 56.6 Wave 4 (2004) 14.7 30.5 54.8
NOTES: Sample restricted to employees (and excluding owner managers of incorporated enterprises) who are of working age. Full-time students in employment have been excluded. All figures are population weighted estimates.
TABLE 2
DISTRIBUTIONS OF PERCEPTIONS OF JOB MOBILITY, HILDA SURVEY WAVES 1 TO 4
Wave 1 Wave 2 Wave 3 Wave 4
Probability of involuntary job loss
Mean 14.2 10.7 10.5 9.6 Distribution .25 quantile 0 0 0 0 .50 quantile 0 0 0 0 .75 quantile 10 10 10 10
Probability of voluntary separation
Mean 21.1 22.2 20.5 21.7 Distribution .25 quantile 0 0 0 0 .50 quantile 0 0 0 0 .75 quantile 50 50 40 50
Re-employment prospects
Mean 62.1 62.5 61.9 63.1 Distribution .25 quantile 40 40 50 50 .50 quantile 70 70 70 70 .75 quantile 100 95 90 95
NOTES: Sample restricted to employees (and excluding owner managers of incorporated enterprises) who are of working age. Full-time students in employment have been excluded. All figures are population weighted estimates.
20
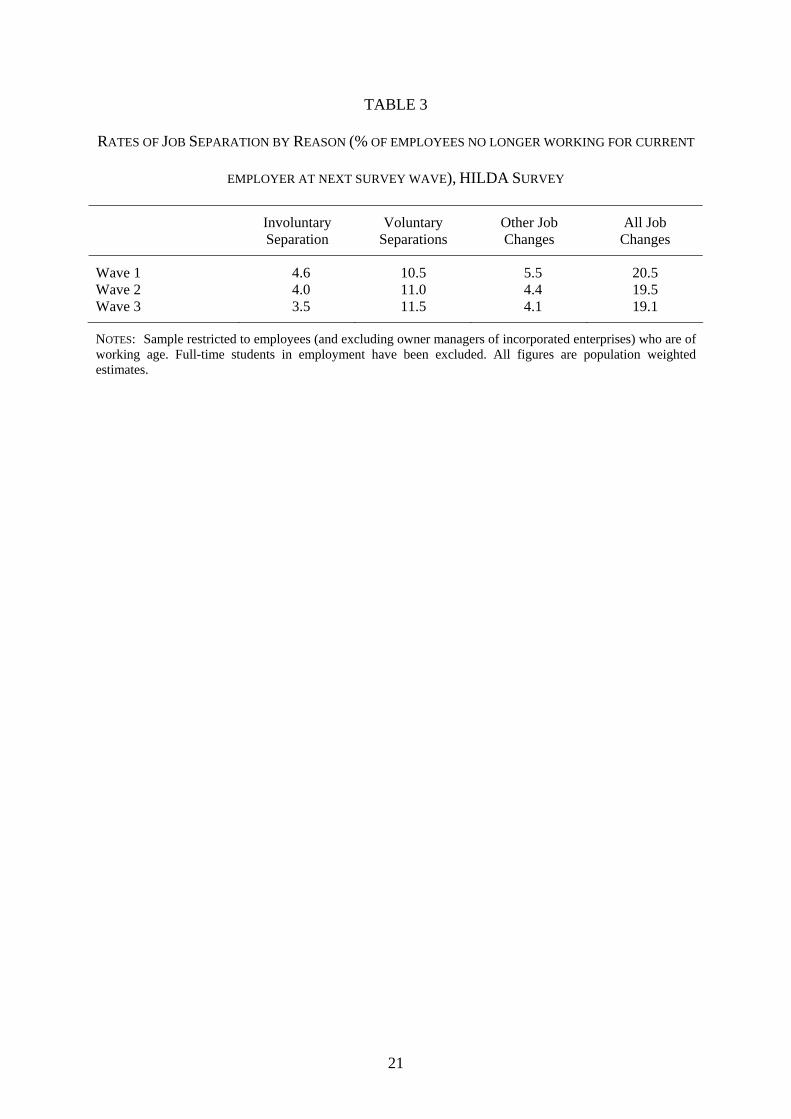
TABLE 3
RATES OF JOB SEPARATION BY REASON (% OF EMPLOYEES NO LONGER WORKING FOR CURRENT
EMPLOYER AT NEXT SURVEY WAVE), HILDA SURVEY
Involuntary Separation
Voluntary Separations
Other Job Changes
All Job Changes
Wave 1 4.6 10.5 5.5 20.5 Wave 2 4.0 11.0 4.4 19.5 Wave 3 3.5 11.5 4.1 19.1
NOTES: Sample restricted to employees (and excluding owner managers of incorporated enterprises) who are of working age. Full-time students in employment have been excluded. All figures are population weighted estimates.
21
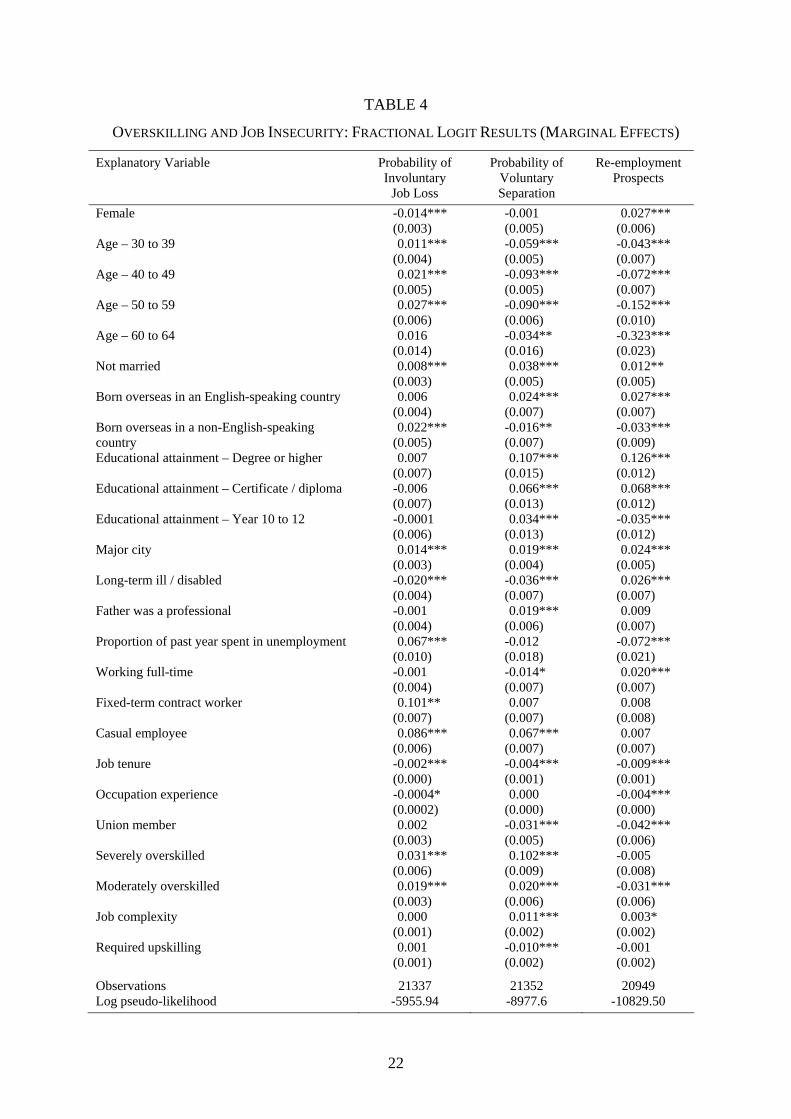
TABLE 4
OVERSKILLING AND JOB INSECURITY: FRACTIONAL LOGIT RESULTS (MARGINAL EFFECTS)
Explanatory Variable Probability of Involuntary
Job Loss
Probability of Voluntary Separation
Re-employment Prospects
Female -0.014*** (0.003)
-0.001 (0.005)
0.027*** (0.006)
Age – 30 to 39 0.011*** (0.004)
-0.059*** (0.005)
-0.043*** (0.007)
Age – 40 to 49 0.021*** (0.005)
-0.093*** (0.005)
-0.072*** (0.007)
Age – 50 to 59 0.027*** (0.006)
-0.090*** (0.006)
-0.152*** (0.010)
Age – 60 to 64 0.016 (0.014)
-0.034** (0.016)
-0.323*** (0.023)
Not married 0.008*** (0.003)
0.038*** (0.005)
0.012** (0.005)
Born overseas in an English-speaking country 0.006 (0.004)
0.024*** (0.007)
0.027*** (0.007)
Born overseas in a non-English-speaking country
0.022*** (0.005)
-0.016** (0.007)
-0.033*** (0.009)
Educational attainment – Degree or higher 0.007 (0.007)
0.107*** (0.015)
0.126*** (0.012)
Educational attainment – Certificate / diploma -0.006 (0.007)
0.066*** (0.013)
0.068*** (0.012)
Educational attainment – Year 10 to 12 -0.0001 (0.006)
0.034*** (0.013)
-0.035*** (0.012)
Major city 0.014*** (0.003)
0.019*** (0.004)
0.024*** (0.005)
Long-term ill / disabled -0.020*** (0.004)
-0.036*** (0.007)
0.026*** (0.007)
Father was a professional -0.001 (0.004)
0.019*** (0.006)
0.009 (0.007)
Proportion of past year spent in unemployment 0.067*** (0.010)
-0.012 (0.018)
-0.072*** (0.021)
Working full-time -0.001 (0.004)
-0.014* (0.007)
0.020*** (0.007)
Fixed-term contract worker 0.101** (0.007)
0.007 (0.007)
0.008 (0.008)
Casual employee 0.086*** (0.006)
0.067*** (0.007)
0.007 (0.007)
Job tenure -0.002*** (0.000)
-0.004*** (0.001)
-0.009*** (0.001)
Occupation experience -0.0004* (0.0002)
0.000 (0.000)
-0.004*** (0.000)
Union member 0.002 (0.003)
-0.031*** (0.005)
-0.042*** (0.006)
Severely overskilled 0.031*** (0.006)
0.102*** (0.009)
-0.005 (0.008)
Moderately overskilled 0.019*** (0.003)
0.020*** (0.006)
-0.031*** (0.006)
Job complexity 0.000 (0.001)
0.011*** (0.002)
0.003* (0.002)
Required upskilling 0.001 (0.001)
-0.010*** (0.002)
-0.001 (0.002)
Observations 21337 21352 20949 Log pseudo-likelihood -5955.94 -8977.6 -10829.50
22
NOTES: *, ** and *** denote significance at the 10, 5 and 1 per cent levels, respectively. Robust standard errors are in parentheses. Also included in the model, but not reported in this table, are controls for industry dummies and firm size.
TABLE 5
AVERAGE ANNUAL RATES OF JOB SEPARATION (%) BY SKILLS MISMATCH AND REASON FOR
SEPARATION, HILDA SURVEY
Severely Overskilled
Moderately Overskilled
Well Matched
All job changes 28.3 19.5 17.4
Voluntary separations 16.0 11.5 9.5
Involuntary separations 4.9 4.1 3.6
Other job separations 7.4 3.9 4.3
NOTES: Sample restricted to employees (and excluding owner managers of incorporated enterprises) who are of working age. Full-time students in employment have been excluded. Figures are population weighted estimates.
23
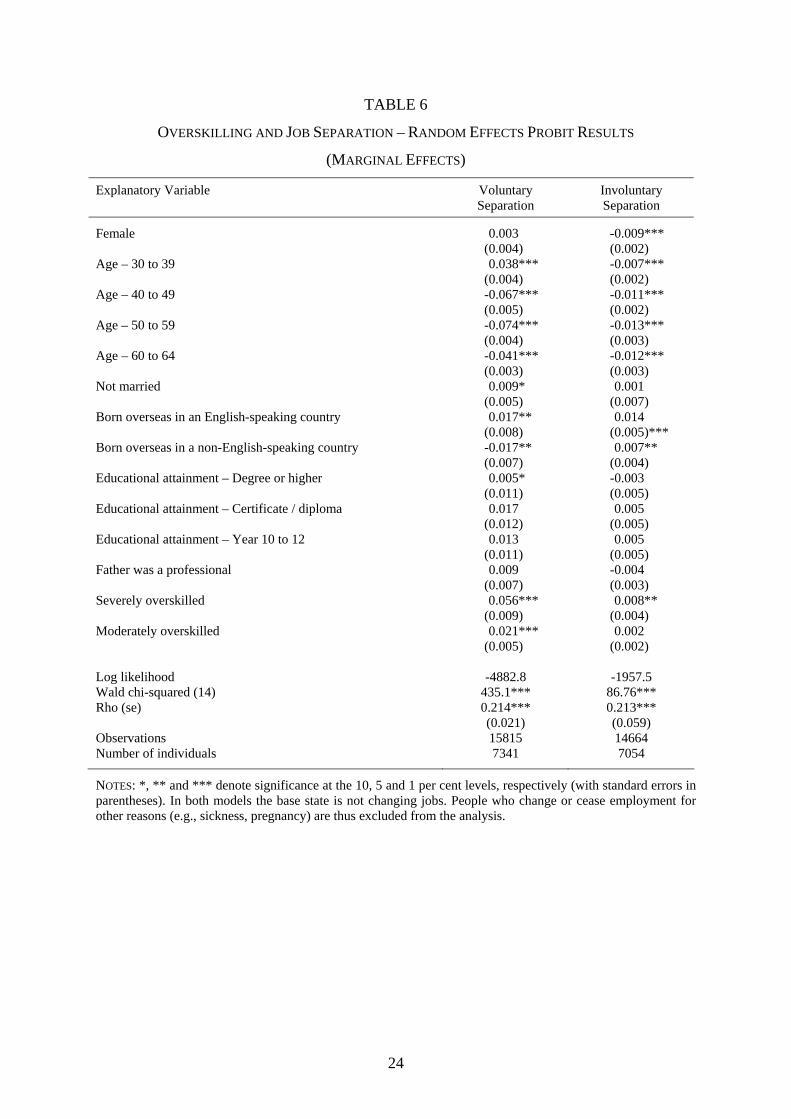
TABLE 6
OVERSKILLING AND JOB SEPARATION – RANDOM EFFECTS PROBIT RESULTS
(MARGINAL EFFECTS)
Explanatory Variable Voluntary Separation
Involuntary Separation
Female 0.003 (0.004)
-0.009*** (0.002)
Age – 30 to 39 0.038*** (0.004)
-0.007*** (0.002)
Age – 40 to 49 -0.067*** (0.005)
-0.011*** (0.002)
Age – 50 to 59 -0.074*** (0.004)
-0.013*** (0.003)
Age – 60 to 64 -0.041*** (0.003)
-0.012*** (0.003)
Not married 0.009* (0.005)
0.001 (0.007)
Born overseas in an English-speaking country 0.017** (0.008)
0.014 (0.005)***
Born overseas in a non-English-speaking country -0.017** (0.007)
0.007** (0.004)
Educational attainment – Degree or higher 0.005* (0.011)
-0.003 (0.005)
Educational attainment – Certificate / diploma 0.017 (0.012)
0.005 (0.005)
Educational attainment – Year 10 to 12 0.013 (0.011)
0.005 (0.005)
Father was a professional 0.009 (0.007)
-0.004 (0.003)
Severely overskilled 0.056*** (0.009)
0.008** (0.004)
Moderately overskilled 0.021*** (0.005)
0.002 (0.002)
Log likelihood -4882.8 -1957.5 Wald chi-squared (14) 435.1*** 86.76*** Rho (se) 0.214***
(0.021) 0.213*** (0.059)
Observations 15815 14664 Number of individuals 7341 7054
NOTES: *, ** and *** denote significance at the 10, 5 and 1 per cent levels, respectively (with standard errors in parentheses). In both models the base state is not changing jobs. People who change or cease employment for other reasons (e.g., sickness, pregnancy) are thus excluded from the analysis.
24
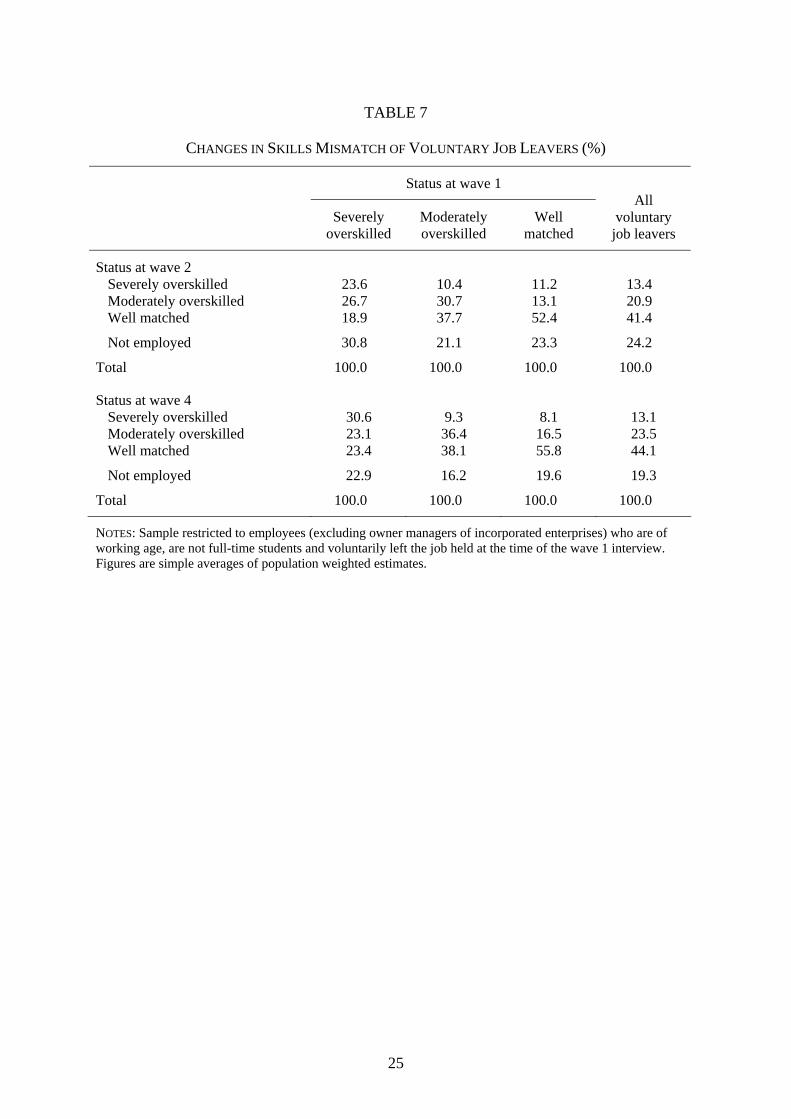
TABLE 7
CHANGES IN SKILLS MISMATCH OF VOLUNTARY JOB LEAVERS (%)
Status at wave 1
Severely overskilled
Moderately overskilled
Well matched
All
voluntary job leavers
Status at wave 2 Severely overskilled 23.6 10.4 11.2 13.4 Moderately overskilled 26.7 30.7 13.1 20.9 Well matched 18.9 37.7 52.4 41.4
Not employed 30.8 21.1 23.3 24.2
Total 100.0 100.0 100.0 100.0
Status at wave 4 Severely overskilled 30.6 9.3 8.1 13.1 Moderately overskilled 23.1 36.4 16.5 23.5 Well matched 23.4 38.1 55.8 44.1
Not employed 22.9 16.2 19.6 19.3
Total 100.0 100.0 100.0 100.0
NOTES: Sample restricted to employees (excluding owner managers of incorporated enterprises) who are of working age, are not full-time students and voluntarily left the job held at the time of the wave 1 interview. Figures are simple averages of population weighted estimates.
25
STATISTICAL APPENDIX
EXPLANATORY VARIABLES: DEFINITIONS AND SUMMARY STATISTICS
Variable Definition Mean Std. Dev.
Female Dummy variable that takes the value 1 if female and zero if male.
0.491 0.500
Age – 30 to 39 Dummy variable that takes the value 1 if aged between 25 and 39 and zero if otherwise.
0.270 0.444
Age – 40 to 49 Dummy variable that takes the value 1 if aged between 40 and 49 and zero if otherwise.
0.278 0.445
Age – 50 to 59 Dummy variable that takes the value 1 if aged between 50 and 59 and zero if otherwise.
0.168 0.374
Age – 60 to 64 Dummy variable that takes the value 1 if aged between 50 and 59 and zero if otherwise.
0.019 0.136
Not married Dummy variable that takes the value 1 if not legally married and zero if otherwise.
0.331 0.470
Born overseas in an English-speaking country
Dummy variable that takes the value 1 if born overseas in one of the main English-speaking countries (Canada, Ireland, New Zealand, South Africa, UK or USA) and zero if otherwise.
0.112 0.324
Born overseas in a non-English-speaking country
Dummy variable that takes the value 1 if born overseas in a country other than one of the main English-speaking countries and zero if otherwise.
0.095 0.293
Educational attainment – Degree
Dummy variable that takes the value 1 if highest educational qualification is a university degree (or higher) and zero if otherwise.
0.268 0.443
Educational attainment – Certificate / Diploma
Dummy variable that takes the value 1 if highest educational qualification is a certificate or diploma and zero if otherwise.
0.313 0.464
Educational attainment – Year 10 to 12
Dummy variable that takes the value 1 if highest educational qualification is completion of Year 10, 11 or 12 of high school (or equivalent) and zero if otherwise.
0.365 0.481
Educational attainment – Less than Year 10 (reference category)
Dummy variable that takes the value 1 if did not at least complete Year 10 of high school and zero if otherwise.
0.053 0.224
Major city Dummy variable that takes the value 1 if living in a major city, as defined by the Accessibility / Remoteness Index of Australia (ABS, 2006) and zero if otherwise. Currently the regions in Australia that are defined as major cities are: Sydney, Melbourne, Brisbane, Perth, Adelaide, Canberra, Gold Coast (Qld), Newcastle, Wollongong and Gosford.
0.638 0.481
26
Variable Definition Mean Std. Dev.
Long-term ill / disabled
Dummy variable that takes the value 1 if has a health condition or disability that restricts everyday activities (excluding sight problems corrected by lenses or glasses) and has lasted or is expected to last 6 months or more and zero if otherwise.
1.870 0.400
Father was a professional
Dummy variable that takes the value 1 if father’s employed in a professional occupation and zero if otherwise.
0.137 0.343
Proportion of year spent in unemployment
Proportion of the previous 12 months spent unemployed (i.e., not working but actively looking for work).
0.026 0.119
Working full-time Dummy variable that takes the value 1 if usually working 35 hours per week or more and zero if otherwise.
0.713 0.452
Casual employee Dummy variable that takes the value 1 if reports being employed on a casual basis and zero if otherwise.
0.195 0.396
Fixed-term contract worker
Dummy variable that takes the value 1 if reports being employed on a fixed-term contract and zero if otherwise.
0.095 0.293
Job tenure Years of continuous employment with current employment.
0.059 0.077
Union member Dummy variable that takes the value 1 if a member of a trade union and zero otherwise
0.311 0.463
Occupation experience Years of cumulative employment in current occupation.
0.084 0.094
Severely overskilled Dummy variable that takes the value 1 if, in response to the item – “I use many of my skills and abilities in my current job” – selected 1, 2 or 3 on the 7-point disagree-agree scale, and zero if otherwise.
0.117 0.321
Moderately overskilled Dummy variable that takes the value 1 if, in response to the item – “I use many of my skills and abilities in my current job” – selected 4 or 5 on the 7-point disagree-agree scale, and zero if otherwise.
0.251 0.433
Well matched (reference category)
Dummy variable that takes the value 1 if, in response to the item – “I use many of my skills and abilities in my current job” – selected 6 or 7 on the 7-point disagree-agree scale, and zero if otherwise.
0.531 0.499
Job complexity Response to the item – “My job is complex and difficult” – and scored on a continuous 1 to 7 scale.
2.858 3.751
Required upskilling Response to the item – “My job often requires me to learn new skills” – and scored on a continuous 1 to 7 scale.
3.483 3.900
27