Embed Size (px)
Citation preview
Copyright (C) 2014 Panasonic Corporation All Rights Reserved.
Overseas Business Strategy
May 21, 2014
Panasonic Corporation
Yoshihiko Yamada
Panasonic IR Day 2014
Notes: 1. This is an English translation from the original presentation in Japanese.2. In this presentation, “fiscal year 2015” or “FY15” refers to the year ended March 31, 2015.
1. Strategic regions
2. Challenges and targets
3. Towards FY2019
4. Organizational structure
1
Contents
Copyright (C) 2014 Panasonic Corporation All Rights Reserved.
2
1. Strategic regions
2. Challenges and targets
3. Towards FY2019
4. Organizational structure
Contents
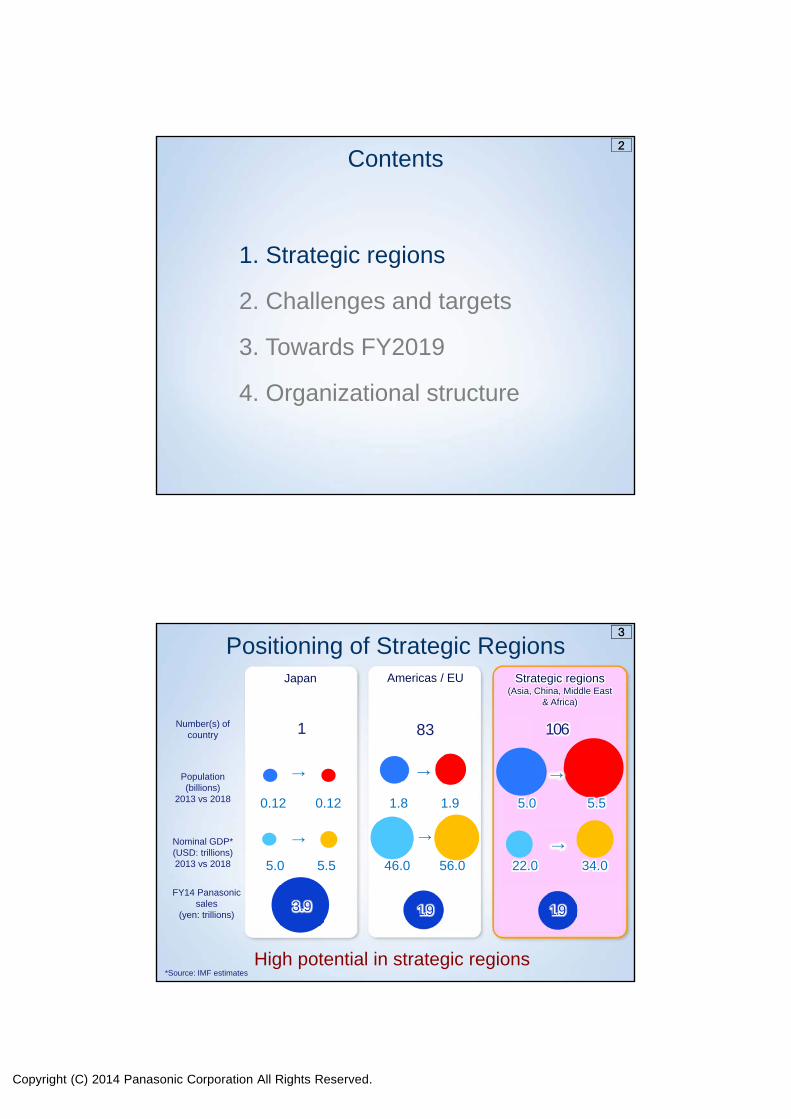
1.91.93.9
22.0 34.05.0 5.5 46.0 56.0
1 83 106
3
High potential in strategic regions
0.12 0.12
→
1.8 1.9
→ →
5.0 5.5
→→→
Positioning of Strategic Regions
FY14 Panasonic sales
(yen: trillions)
Population (billions)
2013 vs 2018
Nominal GDP*(USD: trillions)2013 vs 2018
Strategic regions(Asia, China, Middle East
& Africa)
Japan Americas / EU
Number(s) of country
*Source: IMF estimates
Copyright (C) 2014 Panasonic Corporation All Rights Reserved.
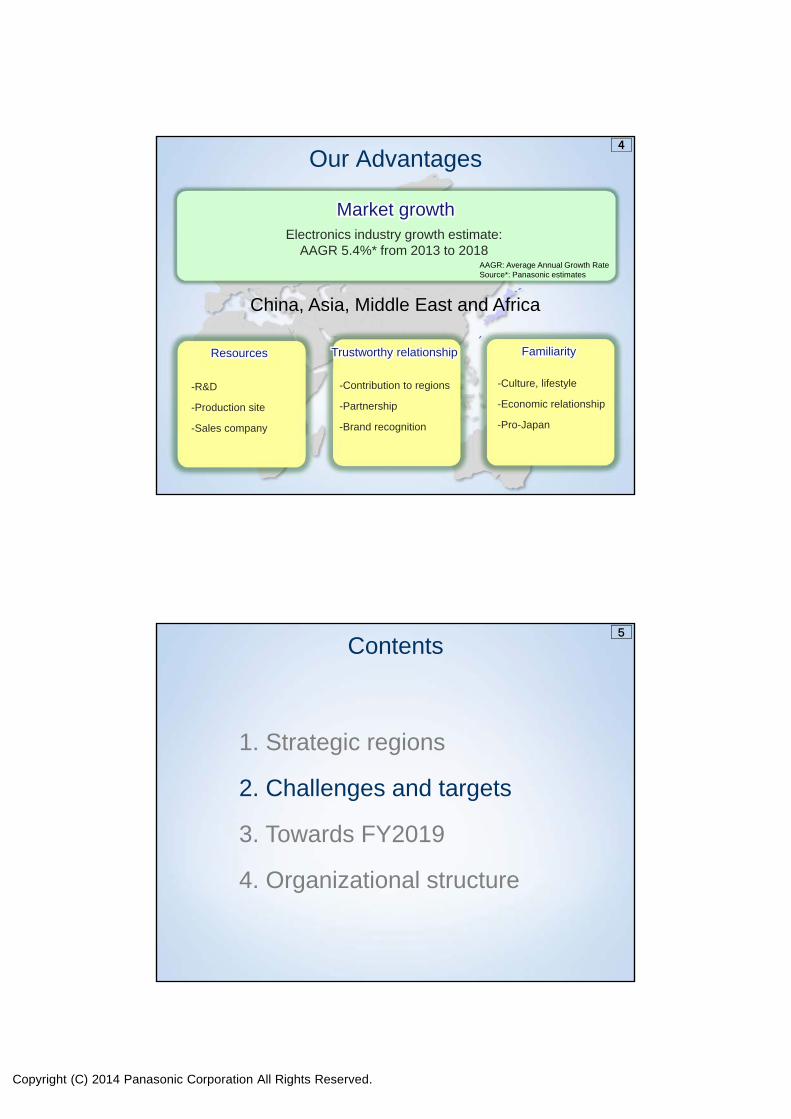
Market growth
Resources
China, Asia, Middle East and Africa
Electronics industry growth estimate:AAGR 5.4%* from 2013 to 2018
AAGR: Average Annual Growth RateSource*: Panasonic estimates
-R&D
-Production site
-Sales company
4
Familiarity
-Culture, lifestyle
-Economic relationship
-Pro-Japan
Trustworthy relationship
-Contribution to regions
-Partnership
-Brand recognition
Our Advantages
5
1. Strategic regions
2. Challenges and targets
3. Towards FY2019
4. Organizational structure
Contents
Copyright (C) 2014 Panasonic Corporation All Rights Reserved.
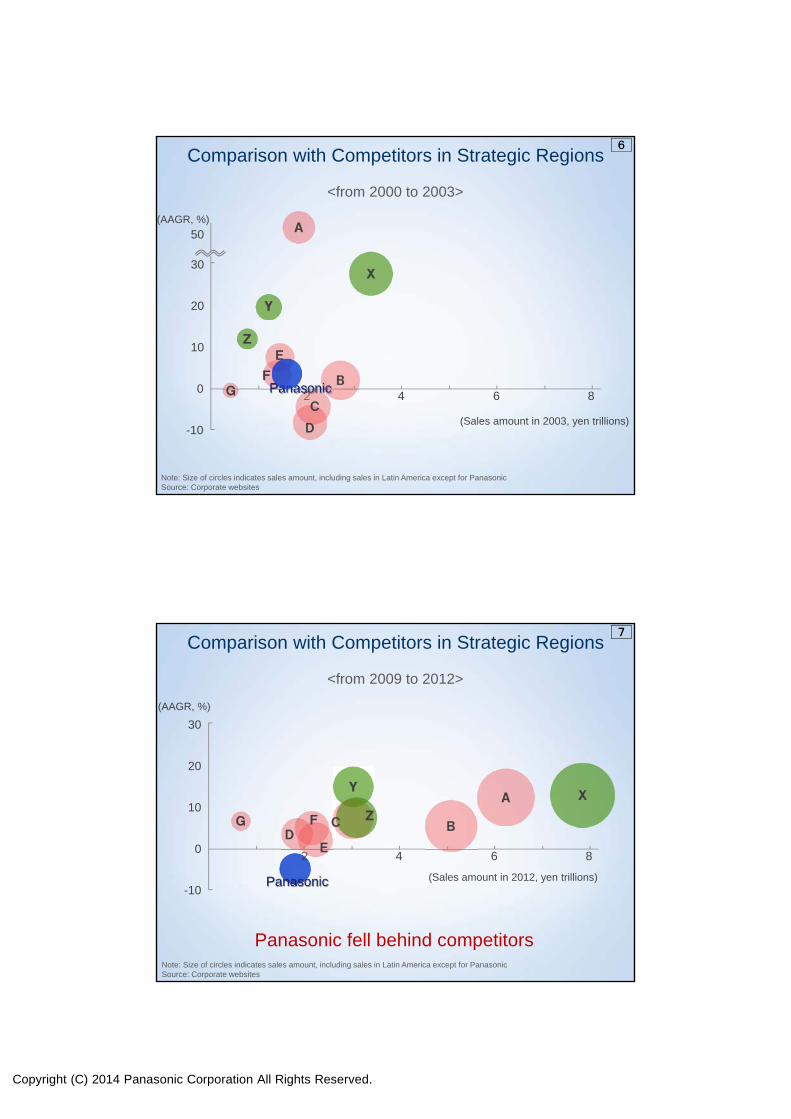
-10
0
10
30
2 4 6 8
<from 2000 to 2003>
20
X
B
A
Z
Y
Panasonic
D
C(Sales amount in 2003, yen trillions)
50
F
E
Note: Size of circles indicates sales amount, including sales in Latin America except for PanasonicSource: Corporate websites
6
G
Comparison with Competitors in Strategic Regions
(AAGR, %)
-10
0
10
30
2 4 6 8
20
XY
B
A
CZ
E
FD
Panasonic
G
Panasonic fell behind competitors
7
<from 2009 to 2012>
(Sales amount in 2012, yen trillions)
Note: Size of circles indicates sales amount, including sales in Latin America except for PanasonicSource: Corporate websites
(AAGR, %)
Comparison with Competitors in Strategic Regions
Copyright (C) 2014 Panasonic Corporation All Rights Reserved.
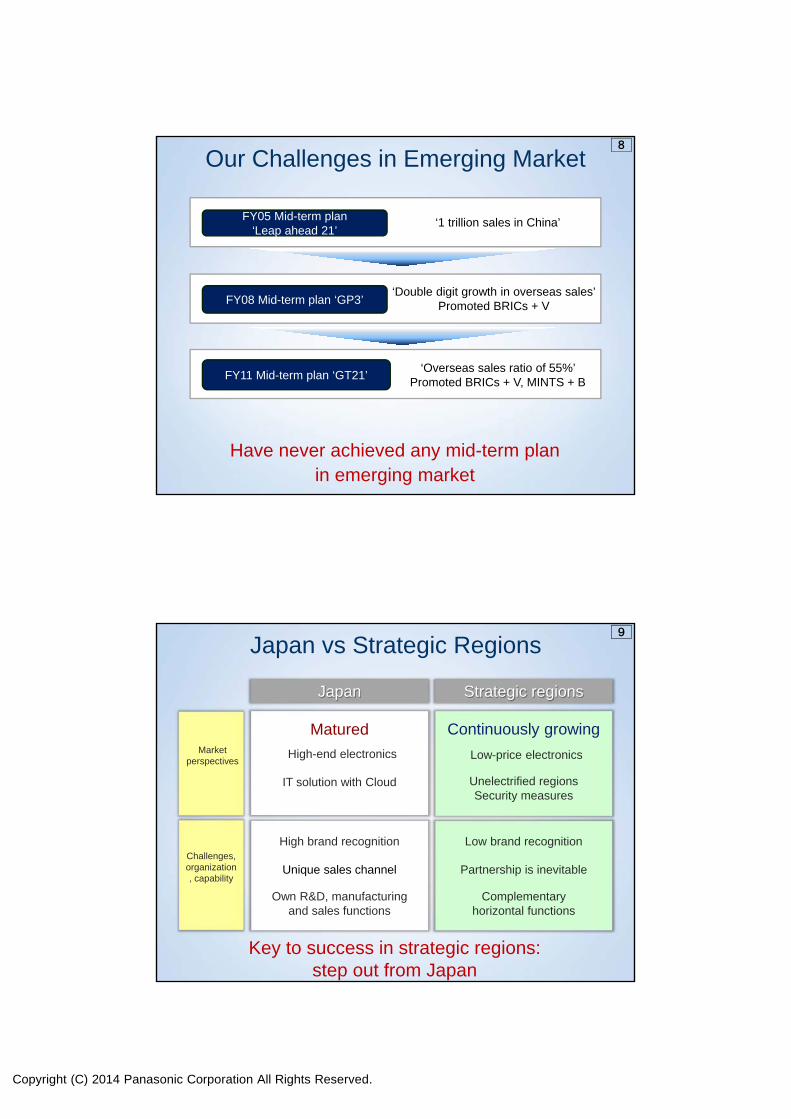
FY05 Mid-term plan ‘Leap ahead 21’
‘1 trillion sales in China’
FY08 Mid-term plan ‘GP3’‘Double digit growth in overseas sales’
Promoted BRICs + V
FY11 Mid-term plan ‘GT21’‘Overseas sales ratio of 55%’
Promoted BRICs + V, MINTS + B
Have never achieved any mid-term plan in emerging market
8
Our Challenges in Emerging Market
Japan vs Strategic Regions
Key to success in strategic regions: step out from Japan
Market perspectives
Challenges, organization, capability
Japan Strategic regions
Matured
High-end electronics
IT solution with Cloud
High brand recognition
Unique sales channel
Own R&D, manufacturing and sales functions
Low-price electronics
Complementary horizontal functions
Continuously growing
Partnership is inevitable
Low brand recognition
9
Unelectrified regionsSecurity measures
Copyright (C) 2014 Panasonic Corporation All Rights Reserved.
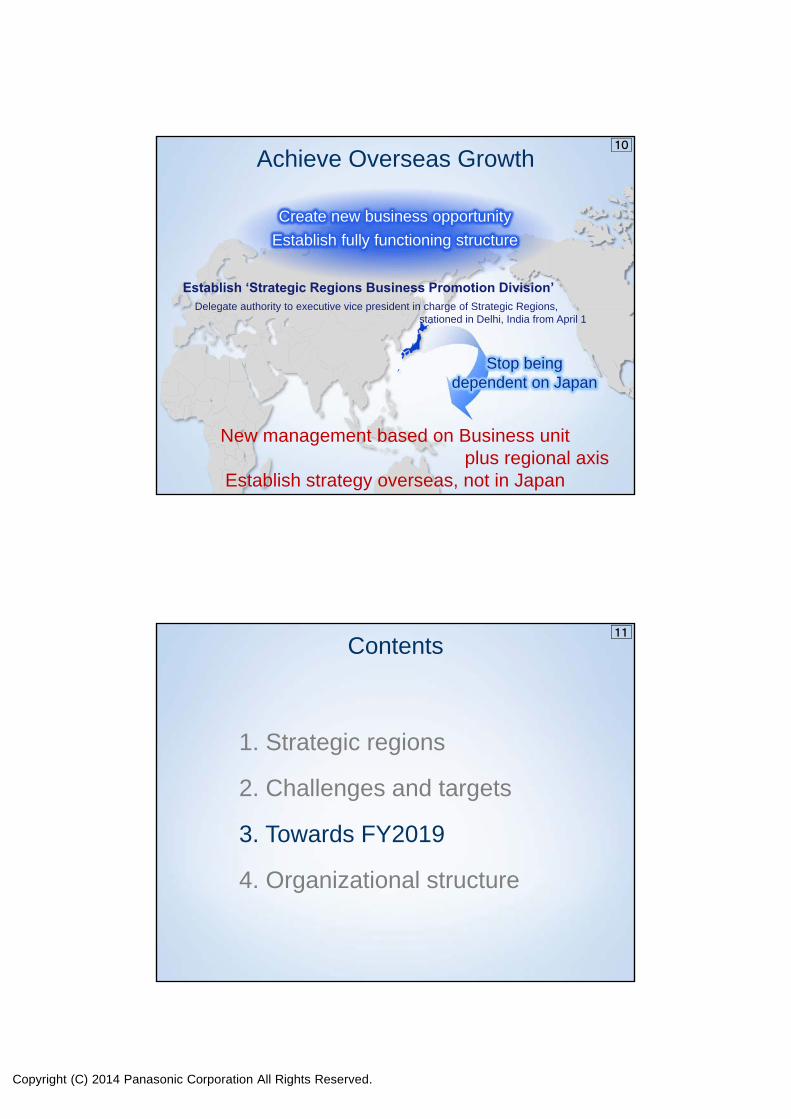
Stop beingdependent on Japan
Create new business opportunity
Establish fully functioning structure
New management based on Business unit plus regional axis
Establish strategy overseas, not in Japan
10
Achieve Overseas Growth
Establish ‘Strategic Regions Business Promotion Division’ Delegate authority to executive vice president in charge of Strategic Regions,
stationed in Delhi, India from April 1
11
1. Strategic regions
2. Challenges and targets
3. Towards FY2019
4. Organizational structure
Contents
Copyright (C) 2014 Panasonic Corporation All Rights Reserved.
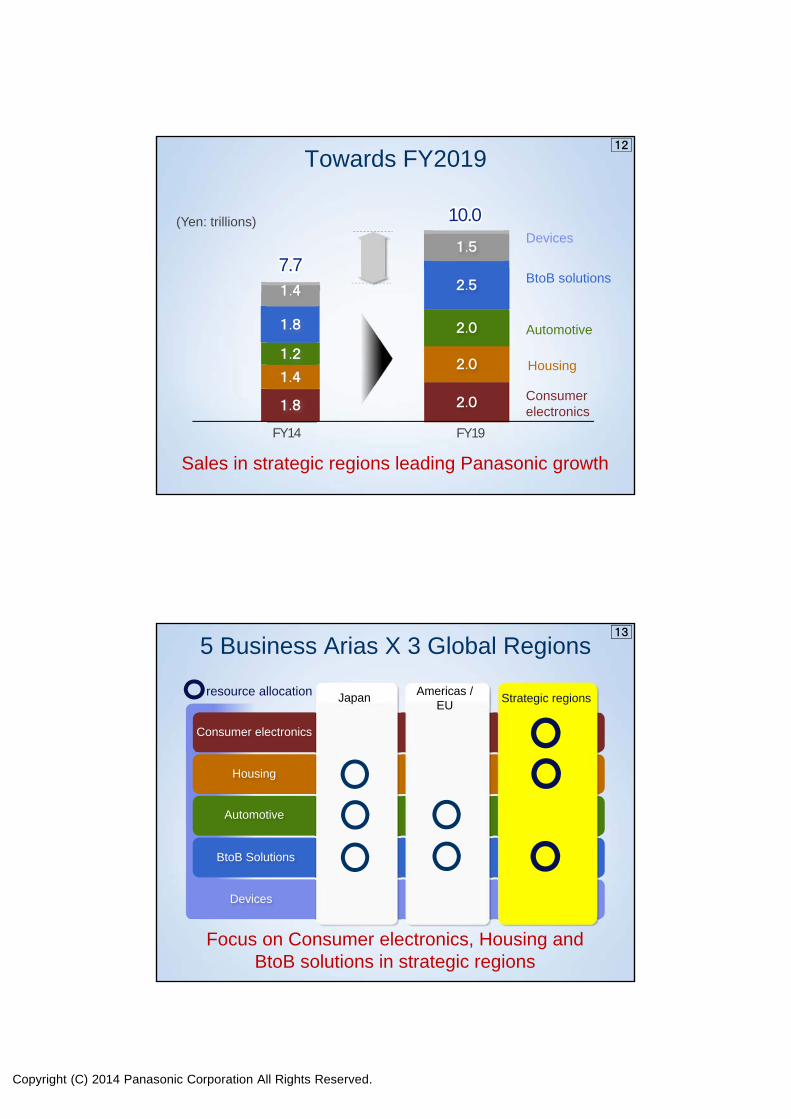
FY14
10.0
FY19
2.0
2.0
2.0 Consumer electronics
Housing
Automotive
BtoB solutions
Devices
2.5
1.5
7.7
1.4
1.2
1.8
1.4
1.8
12
Towards FY2019
Sales in strategic regions leading Panasonic growth
(Yen: trillions)
Focus on Consumer electronics, Housing and BtoB solutions in strategic regions
Consumer electronics
Housing
Automotive
BtoB Solutions
Devices
ああああJapanAmericas /
EUStrategic regions
resource allocation
13
5 Business Arias X 3 Global Regions
Copyright (C) 2014 Panasonic Corporation All Rights Reserved.
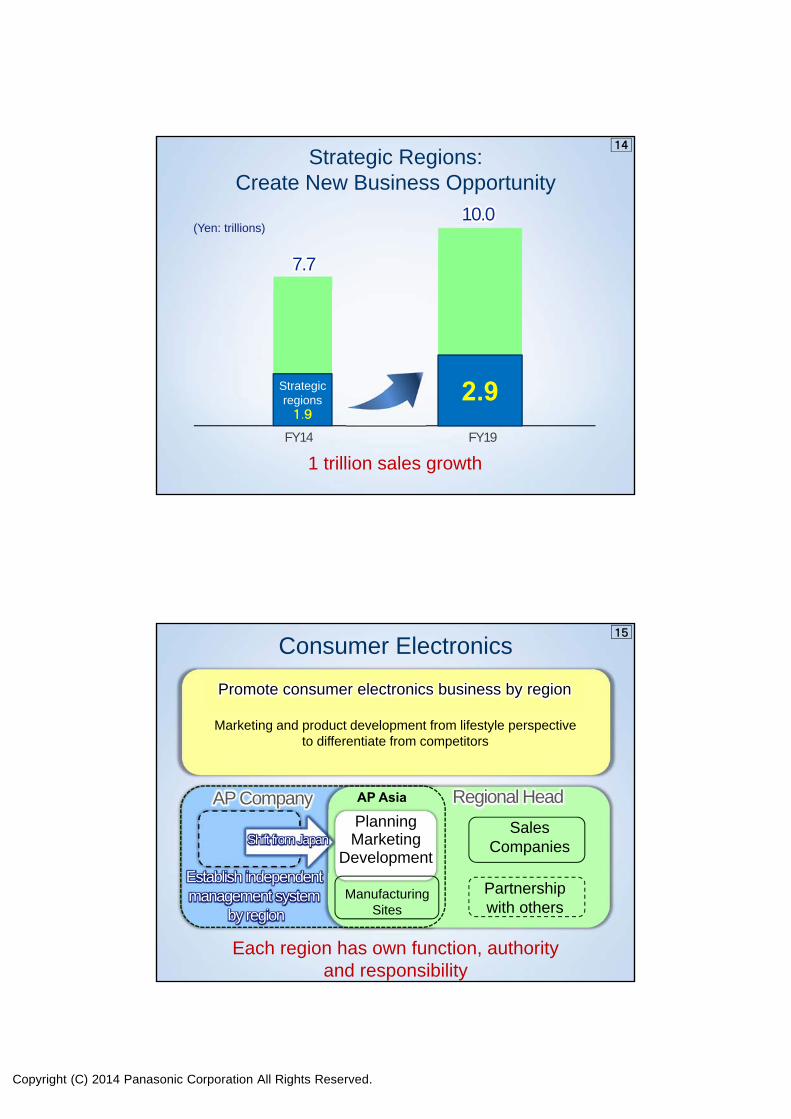
FY14 FY19
14
Strategic regions1.9
2.9
Strategic Regions: Create New Business Opportunity
1 trillion sales growth
10.0
7.7
(Yen: trillions)
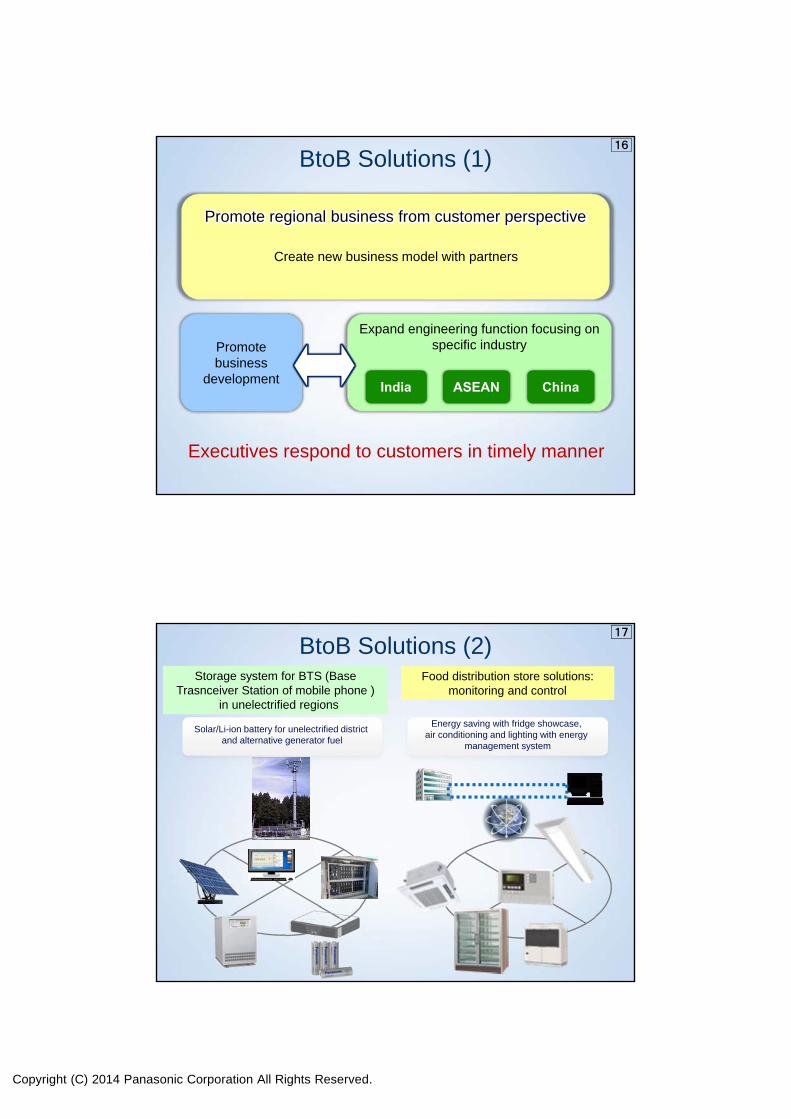
15
PlanningMarketing
Development
Partnershipwith others
AP Company Regional Head
Establish independentmanagement system
by regionManufacturing
Sites
Sales CompaniesShift from Japan
AP Asia
Consumer Electronics
Marketing and product development from lifestyle perspective to differentiate from competitors
Promote consumer electronics business by region
Each region has own function, authority and responsibility
Copyright (C) 2014 Panasonic Corporation All Rights Reserved.
Executives respond to customers in timely manner
16
Create new business model with partners
Expand engineering function focusing on specific industry
India ASEAN China
Promote business
development
BtoB Solutions (1)
Promote regional business from customer perspective
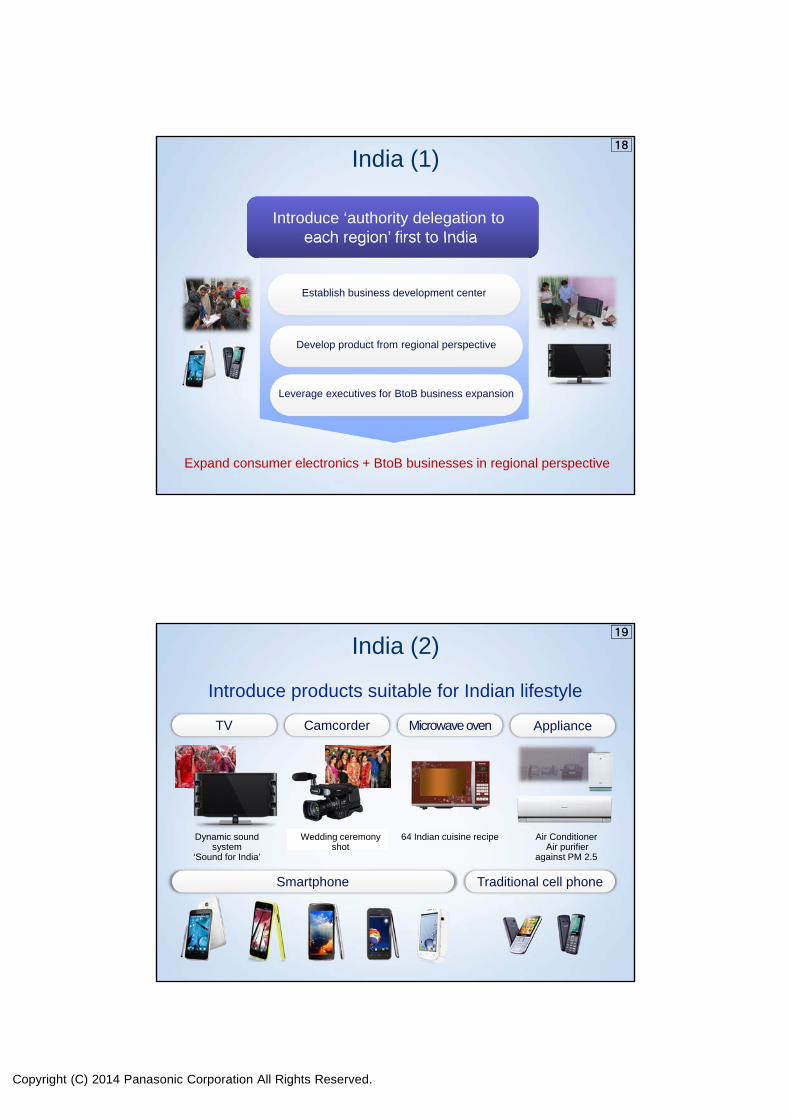
Solar/Li-ion battery for unelectrified district and alternative generator fuel
Storage system for BTS (Base Trasnceiver Station of mobile phone )
in unelectrified regions
Food distribution store solutions: monitoring and control
17
Energy saving with fridge showcase, air conditioning and lighting with energy
management system
BtoB Solutions (2)
Copyright (C) 2014 Panasonic Corporation All Rights Reserved.
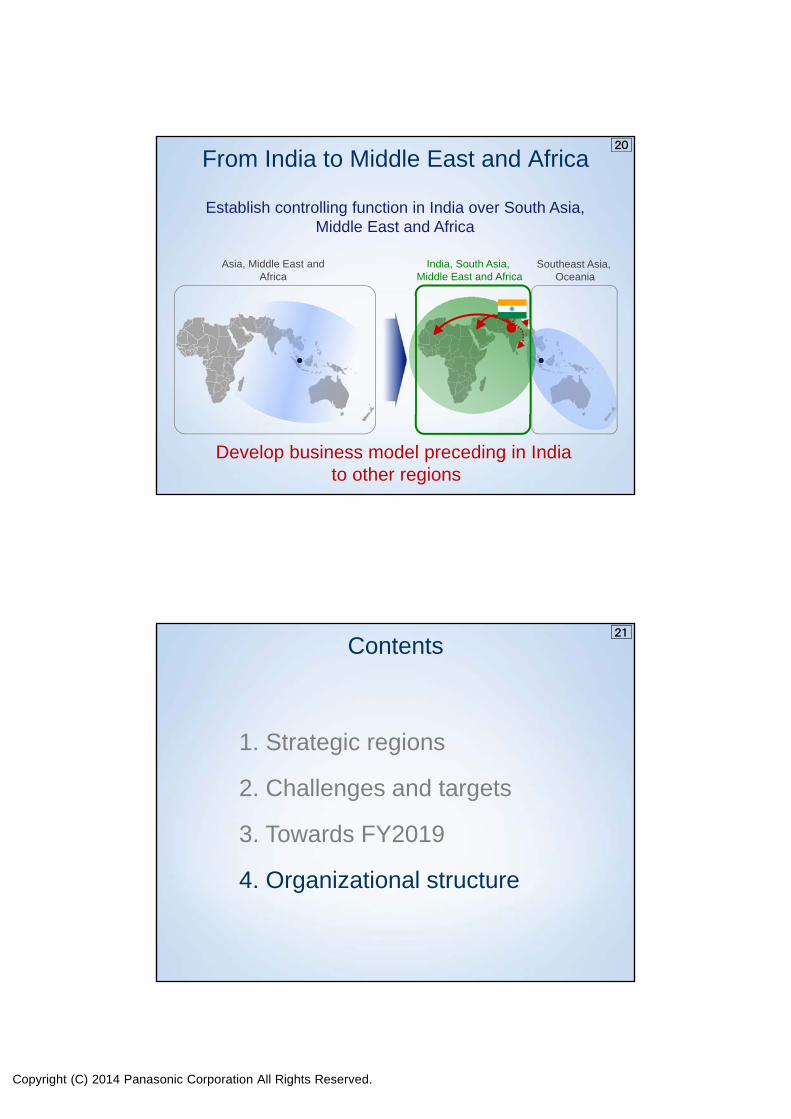
18
Introduce ‘authority delegation to each region’ first to India
Develop product from regional perspective
Leverage executives for BtoB business expansion
Expand consumer electronics + BtoB businesses in regional perspective
India (1)
Establish business development center
Wedding ceremony shot
Dynamic sound system
‘Sound for India’
64 Indian cuisine recipe Air ConditionerAir purifier
against PM 2.5
TV Camcorder Microwave oven Appliance
Smartphone Traditional cell phone
19
India (2)
Introduce products suitable for Indian lifestyle
Copyright (C) 2014 Panasonic Corporation All Rights Reserved.
Establish controlling function in India over South Asia, Middle East and Africa
Asia, Middle East and Africa
India, South Asia, Middle East and Africa
Southeast Asia, Oceania
●
Develop business model preceding in India to other regions
20
From India to Middle East and Africa
21
1. Strategic regions
2. Challenges and targets
3. Towards FY2019
4. Organizational structure
Contents
Copyright (C) 2014 Panasonic Corporation All Rights Reserved.
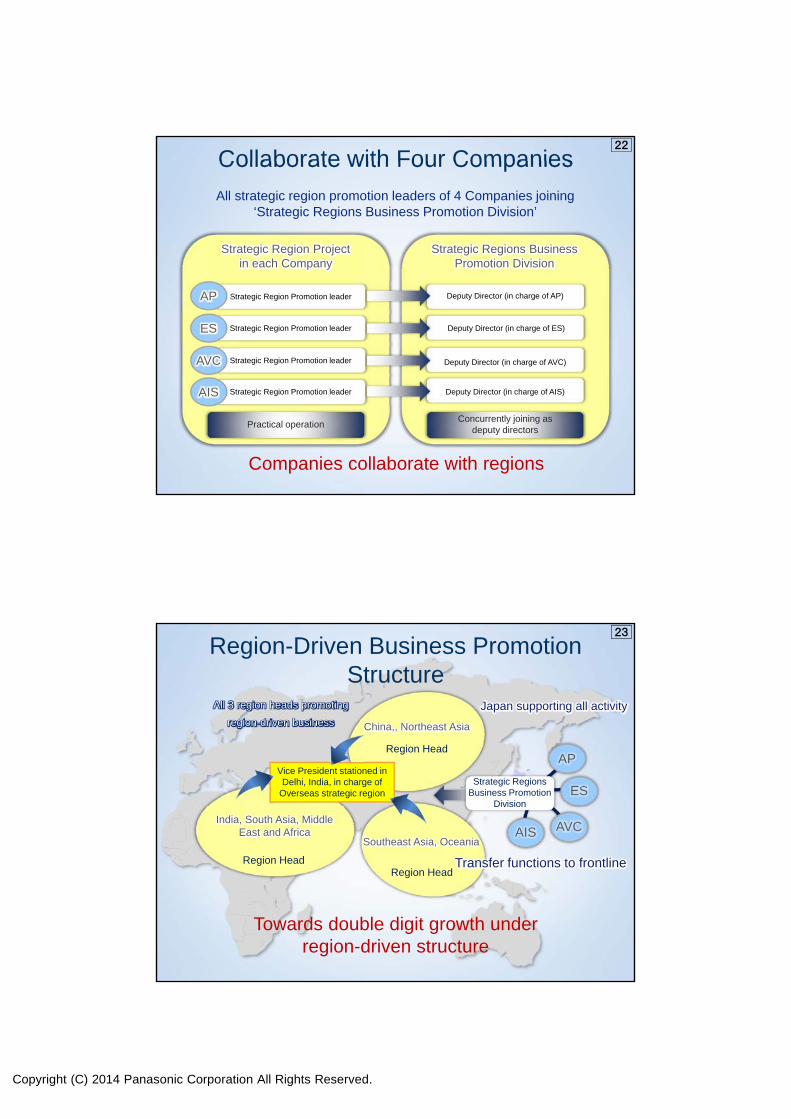
Strategic Region Promotion leader Deputy Director (in charge of AP)AP
ES
AVC
AIS
Practical operationConcurrently joining as
deputy directors
22
Companies collaborate with regions
Collaborate with Four Companies
All strategic region promotion leaders of 4 Companies joining ‘Strategic Regions Business Promotion Division’
Strategic Regions Business Promotion Division
Strategic Region Project in each Company
Strategic Region Promotion leader
Strategic Region Promotion leader
Strategic Region Promotion leader
Deputy Director (in charge of ES)
Deputy Director (in charge of AVC)
Deputy Director (in charge of AIS)
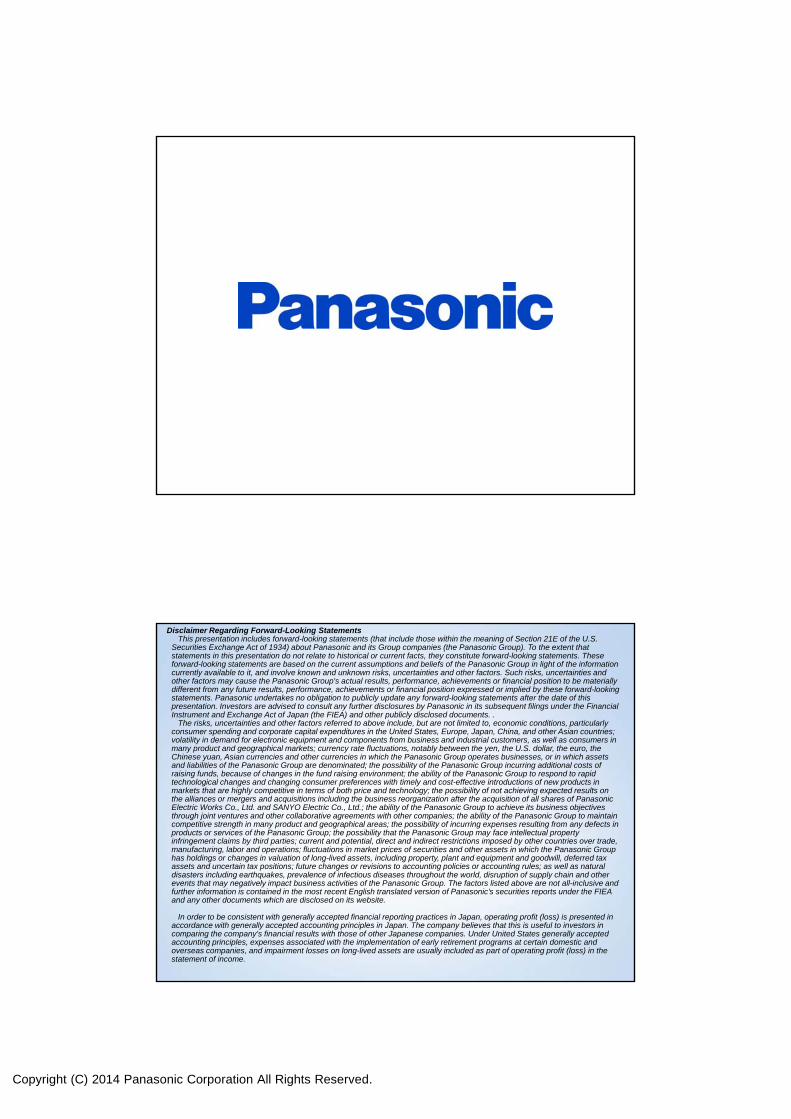
Vice President stationed in Delhi, India, in charge of
Overseas strategic region
Towards double digit growth under region-driven structure
23
Region-Driven Business Promotion Structure
India, South Asia, Middle East and Africa
Southeast Asia, Oceania
Region Head
China,, Northeast Asia
All 3 region heads promoting
region-driven business
ES
AP
AVCAIS
Japan supporting all activity
Transfer functions to frontline
Strategic Regions Business Promotion
Division
Region HeadRegion Head
Copyright (C) 2014 Panasonic Corporation All Rights Reserved.
Disclaimer Regarding Forward-Looking StatementsThis presentation includes forward-looking statements (that include those within the meaning of Section 21E of the U.S.
Securities Exchange Act of 1934) about Panasonic and its Group companies (the Panasonic Group). To the extent that statements in this presentation do not relate to historical or current facts, they constitute forward-looking statements. These forward-looking statements are based on the current assumptions and beliefs of the Panasonic Group in light of the information currently available to it, and involve known and unknown risks, uncertainties and other factors. Such risks, uncertainties and other factors may cause the Panasonic Group's actual results, performance, achievements or financial position to be materially different from any future results, performance, achievements or financial position expressed or implied by these forward-lookingstatements. Panasonic undertakes no obligation to publicly update any forward-looking statements after the date of this presentation. Investors are advised to consult any further disclosures by Panasonic in its subsequent filings under the Financial Instrument and Exchange Act of Japan (the FIEA) and other publicly disclosed documents. .
The risks, uncertainties and other factors referred to above include, but are not limited to, economic conditions, particularly consumer spending and corporate capital expenditures in the United States, Europe, Japan, China, and other Asian countries; volatility in demand for electronic equipment and components from business and industrial customers, as well as consumers in many product and geographical markets; currency rate fluctuations, notably between the yen, the U.S. dollar, the euro, the Chinese yuan, Asian currencies and other currencies in which the Panasonic Group operates businesses, or in which assets and liabilities of the Panasonic Group are denominated; the possibility of the Panasonic Group incurring additional costs of raising funds, because of changes in the fund raising environment; the ability of the Panasonic Group to respond to rapid technological changes and changing consumer preferences with timely and cost-effective introductions of new products in markets that are highly competitive in terms of both price and technology; the possibility of not achieving expected results on the alliances or mergers and acquisitions including the business reorganization after the acquisition of all shares of Panasonic Electric Works Co., Ltd. and SANYO Electric Co., Ltd.; the ability of the Panasonic Group to achieve its business objectives through joint ventures and other collaborative agreements with other companies; the ability of the Panasonic Group to maintain competitive strength in many product and geographical areas; the possibility of incurring expenses resulting from any defects inproducts or services of the Panasonic Group; the possibility that the Panasonic Group may face intellectual property infringement claims by third parties; current and potential, direct and indirect restrictions imposed by other countries over trade, manufacturing, labor and operations; fluctuations in market prices of securities and other assets in which the Panasonic Group has holdings or changes in valuation of long-lived assets, including property, plant and equipment and goodwill, deferred tax assets and uncertain tax positions; future changes or revisions to accounting policies or accounting rules; as well as natural disasters including earthquakes, prevalence of infectious diseases throughout the world, disruption of supply chain and otherevents that may negatively impact business activities of the Panasonic Group. The factors listed above are not all-inclusive andfurther information is contained in the most recent English translated version of Panasonic’s securities reports under the FIEA and any other documents which are disclosed on its website.
In order to be consistent with generally accepted financial reporting practices in Japan, operating profit (loss) is presented in accordance with generally accepted accounting principles in Japan. The company believes that this is useful to investors in comparing the company's financial results with those of other Japanese companies. Under United States generally accepted accounting principles, expenses associated with the implementation of early retirement programs at certain domestic and overseas companies, and impairment losses on long-lived assets are usually included as part of operating profit (loss) in the statement of income.