Embed Size (px)
Citation preview

OVERCOMING VULNERABILITY TO RISING OIL PRICES
Options for Asia and the Pacific
Regional Energy Programme for Poverty Reduction
UNDP Regional Centre in Bangkok
Design and layout: Keen Media (Thailand) Co., Ltd.
The analysis and policy recommendations of this Report do not necessarily reflect the views of the United NationsDevelopment Programme, its Executive Board or its Member States. The Report is an independent publication commissioned by UNDP. It is the fruit of a collaborative effort by a team of eminent experts, stakeholders and the RegionalEnergy Programme for Poverty Reduction (REP-PoR) team of the Regional Centre in Bangkok.
Copyright © 2007 UNDP
United Nations Development ProgrammeRegional Centre in BangkokRegional Energy Programme for Poverty Reduction (REP-PoR)UN Service BuildingRajdamnern Nok AvenueBangkok 10200 Thailandhttp://regionalcentrebangkok.undp.or.thhttp://regionalcentrebangkok.undp.or.th/practices/energy_env/rep-por
ISBN: 978-92-1-126213-1Sales No.: E.08.III.B.5
iii
TEAM FOR PREPARATION OF THE REPORT
Team Leader:Nandita Mongia
Core Team:K.V. Ramani, Thiyagarajan Velumail, Bhava Dhungana, P. Balachandra, Sooksiri Chamsuk andThomas Jensen
Editors:Peter Stalker and Kay Kirby Dorji
Data Team:Energy Focal Points – UNDP Country Offices in Asia and the Pacific, Sanna Salmela-Eckstein andRebecca Roberts
Cover Design:Keen Media (Thailand) Co., Ltd.
Production Design:Nandita Mongia, Thiyagarajan Velumail, Bhava Dhungana, Sooksiri Chamsuk and Panida Charotok
Regional Energy Programme for Poverty Reduction (REP-PoR), UNDP Regional Centre inBangkok (RCB) This Report would not have been possible without a truly collaborative and cross-regionaleffort. Manuel Soriano, from the UNDP RCB, Anuradha K. Rajivan, from the Regional Centre inColombo (RCC), and Kamal Rijal, from the Bureau for Development Policy (BDP) in New York,provided substantial advice on technical aspects of the Report. Cherie Hart from the UNDP RCB provided invaluable support with regards to advocacy and media outreach.


Global oil prices have been rising steadily and now have hit an all-time high of US$84 per barrel. UNDP commissioned this Report because there is evidence that these rising oil prices are starting to bite, mostseverely at the incomes and lives of the region’s poor. Governments have been trying to protect the vulnerable – either by providing subsidies, or by obliging public oil companies not to pass on the full international price increases to local consumers. However, these policies are becoming difficult to sustain.The political and social consequences are severe. Over the past few years, people across the region havetaken to the streets in various Asian countries in reaction to significant fuel price hikes.
This Report examines how oil price rises are affecting the region’s poorest people. To capture this, it startswith a survey of day-to-day realities on the ground. The results are deeply disturbing. Over the last threeyears, households in the region are paying, on average, 171 percent more for cooking fuels, 120 percent morefor transportation, 67 percent more for electricity and 55 percent more for lighting fuels.
This Report also develops an Oil Price Vulnerability Index (OPVI). This is a composite of selected indicatorsthat reflects not just a country’s economic performance and the resilience of its economy, but also the extentto which it depends on imported oil. For 24 countries for which the index has been calculated, 13 have beenflagged as relatively vulnerable, with high OPVIs. However, macroeconomic consequences have not yetbecome fully visible in many countries, although rates of inflation have shown a tendency to rise.
The current price rises should, however, not be viewed simply as the source of an impending crisis. They alsooffer an opportunity to seek new and promising directions. Indeed, many countries have the chance toredesign policy to achieve not just national energy security, but also security at the household level.
The Report proposes the establishment of an Asia-Pacific Compensatory Oil Finance Facility for least developed countries and small island developing states with a two-fold purpose: first, to help tide poorer countries over the immediate balance of payments or fiscal deficits provoked by the oil price hike; second,to enable countries to invest in alternative forms of energy so that they become less dependent on imported oil.
Hafiz A. PashaUNDP Assistant Administrator and Regional DirectorRegional Bureau for Asia and the Pacific
v
Foreword


Overcoming Vulnerability to Rising Oil Prices: Options for Asia and the Pacific is the result of more than twoyears of evidence-based research and extensive consultations with experts to recommend strategies foraddressing impacts of changing oil prices, particularly on the poor. Many people have contributed directlyand indirectly to this collaborative effort.We sincerely appreciate the technical guidance, background papers,reports and detailed peer reviews provided by all those involved. Hafiz Pasha inspired and guided the work,and provided numerous substantive inputs, all the while challenging the team to think ‘outside the box’. Hisguidance is acknowledged and highly appreciated. We are truly grateful to Elizabeth Fong and Marcia V.J.Kran for their overall supervision. Colleagues at the UNDP Regional Centre in Colombo and Regional Centrein Bangkok provided insightful inputs and support throughout the entire process.
Contributors
The Report benefited from numerous background studies, papers, discussions and dialogues. The technicalaspects were skilfully guided by Nandita Mongia and K.V. Ramani. Their extensive experience in the area ofenergy for poverty reduction enriched this Report. Selva Ramachandran, Kamal Rijal and ThiyagarajanVelumail conceived the study, which expanded over time to address new and emerging challenges. Weacknowledge, in particular, P. Balachandra, Mark Davis, Conrado Heruela, Rekha Krishnan, BrahmanandMohanty, Bikash Pandey, K.V. Ramani and Jerome Weingart for their rich professional experience as authors of background papers. Sooksiri Chamsuk, Panida Charotok, Bhava Dhungana, ThomasJensen and Sanna Salmela-Eckstein provided invaluable research support, especially in compiling referencesand detailed data sets.
This Report builds upon prior work undertaken for the policy study: Oil Price Rise and Its Impact on the Poor,commissioned under the Regional Energy Programme for Poverty Reduction (REP-PoR ) at the UNDPRegional Centre in Bangkok. The Report was professionally prepared by The Energy Research Institute (TERI)in New Delhi, India, led by Rekha Krishnan, with support from Souvik Bhattacharjya, Sangeeta Nandi andShilpa Nischal. We sincerely recognize their intellectual inputs and efforts.
We also appreciate TERI’s in-country teams, which undertook on-the-ground research in four countries: China,India, Indonesia and Lao PDR. The country teams who carried out the field studies and facilitated the collection of secondary data included the following persons:
China: Li Bin,Ying Chen, Li Di, Xiaoming Ke, Meng Li, Liao Maoling, Li Meng, Jiahua Pan, Peng Peiran, Feng San,Peng Wuyuan, Laihui Xie, Zhang Xingping, Lu Yuting, Xingzhu Zhao and Guiyang Zhuang.
India: Souvik Bhattachariya, Rashmi Gopal, Rekha Krishnan, Adrian Anthony Lopes, Sangeeta Nandi, ShilpaNischal and Shubha Pandey.
Indonesia: Retno G. Dewi, Krisna Permana, Saswinadi Sasmojo, Ucok W.R. Siagian, Muhammad Tasrif andAkhmad Taufik.
Lao PDR: Chasamouth Keosoutha, Sengratry Kithavone, Khamphone Nanthavong and PhouthavanhNanthavong.
vii
Acknowledgements
Technical Consultations
The draft manuscript underwent a thorough review that included three sessions of technical committeereview with external partners (UNESCAP, SANDEE and AIT), as well as several UNDP in-house consultationsand brainstorming sessions. Candid and intense exchanges, and a constructive spirit, helped to significantlyimprove the Report. In particular, we would like to thank Gernot Brodnig, Elizabeth Clemens, RameshGampat, Enamul Haque, Cherie Hart, Santosh Mehrotra, Omar Noman, Thangavel Palanivel, Minh Pham, JemPorcaro, Anuradha K. Rajivan, Selva Ramachandran, Kamal Rijal, Pranesh Chandra Saha, Hiren Sarkar, RamShrestha, Shamika Sirimanne, Manuel Soriano, Minoru Takada and Peter Warr for their important contributions.
Data Team
Energy focal points in UNDP Country Offices in Asia and the Pacific were essential in bringing the Report tofruition. In particular, they provided in-country socio-economic and energy data. Without these detaileddata, the analytical parts would not have materialized. We express our genuine appreciation to LukasAdhyakso, Hudha Ahmed, Shakil Ahmed, Arif Alauddin, Rogelio Aldover, Alvin Chandra, Darshani de Silva,Massoom Farhad, Easter Galuvao, Seeta Giri, Juan Gollan, Tek Gurung, Le Van Hung, Mehdi Kamyab, AsfaazamKasbani, Lay Khim, Hyun-Shin Lee, Imee Manal, Rogier van Mansvelt, Emma Mario, Filipe Mesquita, JonathanMitchell, K.S. Murali,Tun Naing, Sirixai Phanthavongs, He Ping, Sonam Rabgye, Asenaca Ravuvu, Shireen KamalSayeed, Leylanaz Shajii, Vijaya Singh, Shirish Sinha, Preeti Soni, Josha Stillner, Amelia Supetran,Tony Torea, Doley Tshering, Tungalag Ulambayar, Lisa Vaai, Kati Veijonen and Phansiri Winichagoon.
The Report was prepared under the leadership and direction of Nandita Mongia, whose unwavering commitment and dedication through many challenges were critical for its production.
Finally, we would like to thank Peter Stalker and Kay Kirby Dorji for their diligent editing.
In taking on the subject of oil prices and the poor, we were humbled by the fact that no single mind or bookcan comprehensively address the issues under consideration. We hope that the analyses of ground-level realities and possible policy responses will prove useful to decision makers and other stakeholders in devising strategies aimed at mitigating the impacts of rising oil prices on poor people. We are hopeful thatthe Report will catalyze a constructive dialogue with development partners, and that the impacts on poorpeople will become an important consideration in the development of future policy responses.
Marcia V.J. KranHead of Policy and ProgrammesUNDP Regional Centre in Bangkok
viii Overcoming Vulnerability to Rising Oil Prices: Options for Asia and the Pacific

Foreword v
Acknowledgements vii
Abbreviations xv
Executive summary 1
Chapter 1. How oil price rises have hit the poor 7The energy connection to poverty 7Who are the poor, and how important is oil to them? 8Exposing the poor to the oil price shock 13The poor pay the price 20Implications for the MDGs 22Energy security and human security: two sides of the same coin 24
Chapter 2. The macroeconomic impact 25Causes of oil price increases 27The macroeconomic impact 30Impact by subregion 32Changes in consumption of oil, natural gas and coal, by subregion 35A closer look at the impact in 10 countries 38Why have the effects been so small? 38
Chapter 3. National vulnerability to oil price rises 41Oil intensity 41Oil consumption and economic growth 42Oil and human development 44Oil price vulnerability of the Asia-Pacific region 45An Oil Price Vulnerability Index 47Influence of HDI on country vulnerability rankings 50
Chapter 4. Options for reducing oil price vulnerability 53Managing oil price risk 53Enhancing oil supply 56Restraining oil demand 58Diversifying fuels 62Preparing for emergencies 66
Chapter 5. Options in renewable energy 69The rise of renewables 69Renewables for grid systems 70Off-grid and mini-grid systems 72Heating 78Biofuels 81Financing experiences in making renewable energy affordable 86Switching to renewable energy to benefit the poor 89A policy framework for renewable energy favourable to the poor 93The benefits of renewable energy services for the poor 94
Contents

Chapter 6. Policies for an era of uncertain oil prices 97Baseline (BL) 97Supply Shock (SS) 97Peak Oil Price (POP) 99Energy Security (ES) 99China 102India 103Indonesia 104Lao PDR 106Recommendations for other countries, based on their OPVI scores 107Safeguarding the interests of the poor 108Recommendations for international action 110Proposal for a regional compensatory oil finance facility 111Where do we go from here? 115
Appendices 117
Appendix A: Socioeconomic and energy profiles 117Appendix B: Macroeconomic indices 124Appendix C: Methodology for Oil Price Vulnerability Index calculation 125Appendix D: Oil Price Vulnerability Index: country grouping 140Appendix E: Assumptions used in the comparative analysis of 141
the generation costs of renewable energy technologies vs oil-based power generation
Appendix F: Methodology of sub-strategy priorities 143Appendix G: Energy units, conversion factors and abbreviations 144
References 145
Overcoming Vulnerability to Rising Oil Prices: Options for Asia and the Pacific
List of Tables, Figures and Boxes
TablesTable 1 Priority of strategies during each oil price scenario 5Table 1-1 Pass-through coefficients for gasoline and diesel in local currency 14
(January 2004-April 2006)Table 2-1 Uses of major petroleum products 26Table 2-2 Price trends for other commodities, 2003-2005 32Table 2-3 Electricity production and proportion produced from oil and natural gas 37Table 2-4 Pass-through coefficients, gasoline and diesel 39Table 3-1 Ranking of countries based on weighted dimension scores and composite OPVI 49Table 3-2 Ranking of countries based on the three dimensions 50Table 3-3 Categorization of countries based on OPVI 50Table 3-4 OPVI ranking of countries with and without the influence of HDI 51Table 4-1 Price-based responses in selected countries 54Table 4-2 Priority policy actions towards managing oil price risk 55Table 4-3 Priority policy actions towards enhancing oil supplies 58Table 4-4 Measures to reduce oil intensity 61Table 4-5 Priority actions for fuel diversification 65Table 4-6 Priority policy actions for preparedness for oil-related emergencies 67Table 5-1 Range of investment and generating costs, 2002 and 2010 70Table 5-2 Global capacities for renewable energy in power generation, 2005 71Table 5-3 Forecast decreases in capital costs for various technologies, 2004 to 2015 72Table 5-4 Price projections for gasoline and diesel in various scenarios, US$ per barrel,
2007, 2009 and 2011 73Table 5-5 Four off-grid renewable energy systems 74Table 5-6 Seven mini-grid renewable energy systems 77Table 5-7 Global use of renewable energy for heating, 2005 78Table 5-8 Small, medium and micro enterprises in South Asia using biomass heating 80Table 5-9 World biofuels production by country, 2005 82Table 5-10 Minimum production costs of biofuels 83Table 5 -11 Fiscal implications of biofuels programmes 85Table 5-12 Scaling-up biofuels development for transport 87Table 5-13 Switching to renewables, matching tasks to technologies 89Table 5-14 Stages in the introduction of renewable energy technologies 90Table 5-15 Renewable energy and the Millennium Development Goals 92Table 6-1 Ranking of strategies and sub-strategies for addressing oil price rises 98Table 6-2 Potential prioritization of various sub-strategies 99Table 6-3 Oil price levels in different scenarios, US$ per barrel 100Table 6-4 Projections of prices of selected petroleum products in 100
various scenarios, US$ per barrelTable 6-5 Priority of strategies during each oil price scenario 101Table 6-6 Relevance of strategies for each of the case study countries 101Table 6-7 China – sequence of priority strategies in different oil price scenarios 102Table 6-8 India – sequence of priority strategies in different oil price scenarios 103Table 6-9 Indonesia – sequence of priority strategies in different oil price scenarios 105Table 6-10 Lao PDR – priority strategies in different oil price scenarios 107Table 6-11 Categorization of countries based on the OPVI 107Table 6-12 Sectoral strategies to safeguard the poor from higher oil prices 108
711aisA tsaE-htroN fo eliforp ytrevop ygrenE 1-A elbaT811aisA tseW dna htuoS ni seliforp ytrevop ygrenE2-A elbaT911aisA tsaE-htuoS ni seliforp ytrevop ygrenE3-A elbaT021seirtnuoc dnalsI cificaP ni seliforp ytrevop ygrenE4-A elbaT
Table A-5 Sectoral oil consumption, percentage of total sectoral energy consumption, 2002 121221anihC6-A elbaT221aidnI7-A elbaT321aisenodnI8-A elbaT321RDP oaL9-A elbaT421yticitsale htiw,ytisnetni lio dna noitalfni,PDG fo seulav naeM1-B elbaT
Table B-2 Percentage changes in macroeconomic variables before and 124after oil price increases
621xednI ytilibarenluV ecirP liO fo noitcurtsnoc rof desu ataD1-C elbaT721sisylana noitalerroc fo stluseR2-C elbaT
Table C-3 Principal components and explained variance (with eight variables) 131Table C-4 Factor loadings on the principal components (with eight variables) Table C-5 Significant and dominant factor loadings on the principal components 132
(with eight variables)431)selbairav thgie htiw( serocs rotcaF6-C elbaT
Table C-7 Ranking of countries based on factor scores for different principal components 135(with eight variables)
Table C-8 Weighted factor scores, OPVI and ranking based on OPVI (with eight variables) 136Table C-9 Indicators, formulas and sources in data compilation for OPVI 137Table E-1 Forecast rate of decrease in power generation technology, 2004 to 2015 142
441snoisrevnoc ygrenE1-G elbaT441 noitaiverbba tinU2-G elbaT441xiferp tinU 3-G elbaT
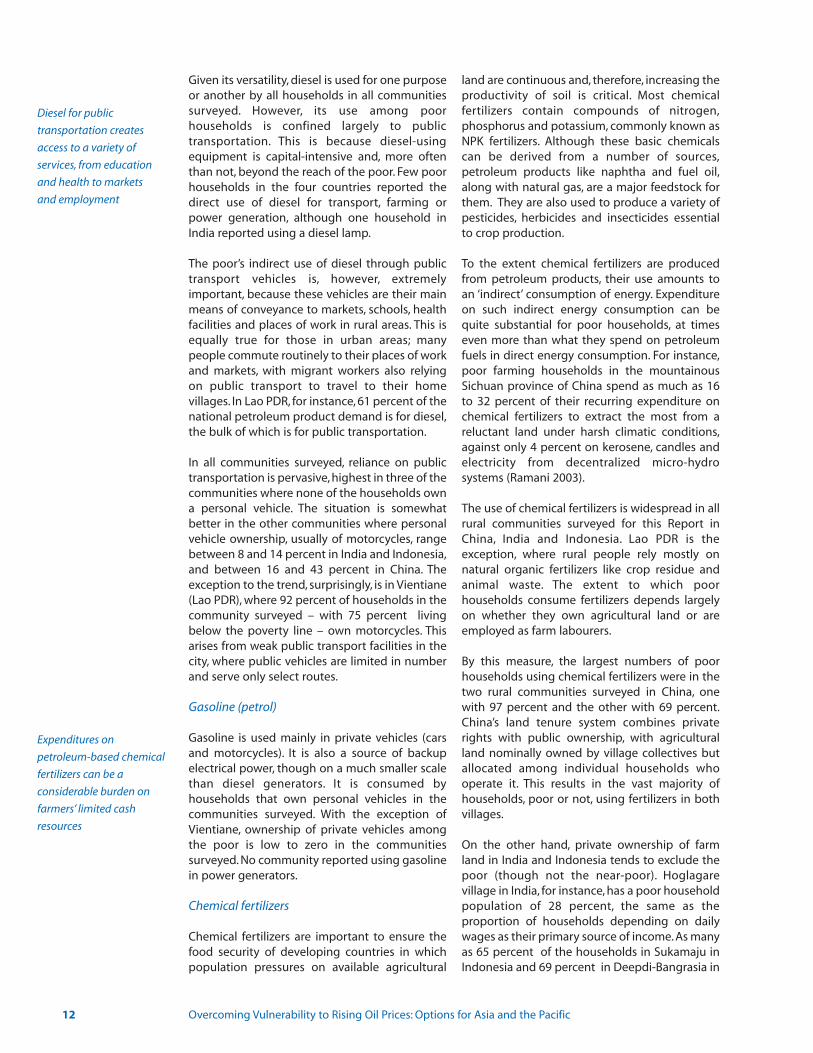
Figures Figure 1-1 Electricity access and biomass dependence in developing countries 8Figure 1-2 China – changes in prices of petroleum products and other fuels 15Figure 1-3 China – energy expenditure changes experienced by poor communities 16
61stcudorp muelortep fo secirp ni segnahc – aidnI4-1 erugiFFigure 1-5 India – energy expenditure changes experienced by poor communities 17
71 stcudorp muelortep fo secirp ni segnahc – aisenodnI6-1 erugiFFigure 1-7 Indonesia – energy expenditure changes experienced by poor communities 18Figure 1-8 Lao PDR – changes in prices of petroleum products and other fuels 18Figure 1-9 Lao PDR – energy expenditure changes experienced by poor communities 19
02 seirtnuoc ruof eht ssorca erutidnepxe leuf s’roop ni esaercnI01-1 erugiFbetween 2002 and 2005
32sGDM eht ot syawhtap ecirp liO11-1 erugiF526002-0891,secirp lio edurc egareva lanimon dna laeR1-2 erugiF626002-0002,secirp ylretrauq,stcudorp muelorteP2-2 erugiF726002-0991,noitcudorp dna dnamed,sedurc lanoitanretnI3-2 erugiF826002-6991,setallitsid elddim dna thgil rof dnameD4-2 erugiF03 6002-0991,secirp lio gnisir dna htworg PDG laeR5-2 erugiF
036002-0991,xedni ecirp remusnoc eht dna secirp tcudorp liO6-2 erugiFFigure 2-7 Oil intensity of GDP for the world and developing Asia, 1990-2005 31
13– sag larutan dna laoc,lio edurc fo secirp fo stnemevoM8-2 erugiFindexed to 2002, 1990-2006
23 6002-0991,noigerbus yb etar htworg PDG9-2 erugiF336002-0991,noigerbus yb etar noitalfni egarevA01-2 erugiF
Figure 2-11 Growth rate of foreign exchange reserves, by subregion, 1990-2005 34536002-5991,noigerbus yb,secnalab tnuocca tnerruC21-2 erugiF
Figure 2-13 Growth in consumption of coal, oil and natural gas in North-East Asia 35and the Mekong, 1990-2006
Overcoming Vulnerability to Rising Oil Prices: Options for Asia and the Pacific
132
Figure 2-14 Growth in consumption of coal, oil and natural gas in South and 36West Asia, 1990-2006
Figure 2-15 Growth in consumption of coal, oil and natural gas in 36South-East Asia, 1990-2006
Figure 3-1 Oil intensity index and oil supply gap for some major oil importers, 2004 41Figure 3-2 Changes in the share of oil in total primary energy supply, 1995-2005 42Figure 3-3 Evolution of per capita oil consumption and per capita GDP, 1995-2005 43Figure 3-4 Evolution of per capita energy use and oil intensity, 1995-2005 43Figure 3-5 Evolution of oil intensity and per capita GDP, 1995-2005 44Figure 3-6 Human Development Index and per capita energy use, 1995 and 2004 44Figure 3-7 Correlation between per capita oil consumption and 45
the Human Development IndexFigure 3-8 Schematic process for developing the Oil Price Vulnerability Index 48Figure 5-1 Wind power, world capacity, 1990-2005 70Figure 5-2 Solar PV systems, world capacity, 1990-2005 71Figure 5-3 Leading countries in using renewable energy for power generation, 2005 72Figure 5-4 Oil price levels in different scenarios, 2003-2020 73Figure 5-5 Cost comparison of off-grid renewable systems versus gasoline gensets, 74
lower cost trends, 2004-2015Figure 5-6 Cost comparison of off-grid renewable systems versus gasoline gensets, 75
most probable cost trends, 2004-2015Figure 5-7 Cost comparison of off-grid renewable systems versus gasoline gensets, 75
higher cost trends, 2004-2015Figure 5-8 Cost comparison of off-grid renewable systems versus diesel gensets, 75
lower cost trends, 2004-2015Figure 5-9 Cost comparison of off-grid renewable systems versus diesel gensets, 76
most probable cost trends, 2004-2015Figure 5-10 Cost comparison of off-grid renewable systems versus diesel gensets, 76
higher cost trends, 2004-2015Figure 5-11 Cost comparison of mini-grid renewable systems versus diesel gensets, 77
lower cost trends, 2004-2015Figure 5-12 Cost comparison of mini-grid renewable systems versus diesel gensets, 77
most probable cost trends, 2004-2015Figure 5-13 Cost comparison of mini-grid renewable systems versus diesel gensets, 78
higher cost trends, 2004-2015Figure 5-14 Biomass heating in developing countries of Asia 79Figure 5-15 Producer gas compared with other fuels for heating, India, 2004 80Figure 5-16 Global bioethanol production, 2000 and 2005 81Figure 5-17 World biodiesel production, 2000-2005 82Figure 5-18 Comparison of diesel and biodiesel prices, 2007-2020 84Figure 5-19 Weekly prices for vegetable oils at Rotterdam, January 2006 - May 2007 85Figure 6-1 Process for prioritizing sub-strategies under different oil price scenarios 98
for case study countriesFigure 6-2 Oil price levels in different scenarios 100Figure 6-3 Connecting oil price policy measures with the Millennium Development Goals 109Figure 6-4 Average current account balances of Asia-Pacific developing countries, 111
2003-2007Figure 6-5 Structure of the proposed Asia-Pacific Compensatory Oil Finance 114
(AP-COIL) facility
BoxesBox 1-1 The view from the ground: Four countries 9Box 1-2 Public protests over fuel price increases 14Box 1-3 Poor in India suffer from both high prices and shortages of fuels 21Box 2-1 Rising oil prices and the sliding dollar 27Box 2-2 Has world oil production peaked? 29Box 4-1 Energy cooperation: Examples from gas and electricity 57Box 4-2 Dual-fuel hybrid cogeneration for an industrial estate in Thailand 63Box 4-3 Fuel diversification in Cambodia via cross-border trade and domestic resources 66Box 5-1 Grameen Shakti: Financing solar home systems 95

ACU Asian Currency Unit AP-COIL Asia-Pacific Compensatory Oil Finance Facility APERC Asia Pacific Energy Research Centre APL Above Poverty LineAPSA ASEAN Petroleum Security Agreement APSP Average Petroleum Spot Price ASEAN Association of Southeast Asian Nations ATF Aviation Turbine Fuel BPL Below Poverty Line BRAC Bangladesh Rural Advancement CommitteeCDM Clean Development Mechanism CFB Circulating Fluidized Bed CFF Compensatory Financing Facility COCO Cogeneration Public Company LimitedDFCC Development Finance Corporation of CeylonESMAP Energy Sector Management Assistance Programme ESF Exogenous Shock Facility EU European Union HIPC Heavily Indebted Poor Countries HSD High Speed DieselGDP Gross Domestic Product GHG Greenhouse gasHDI Human Development IndexIGCC Integrated Gasification Combined Cycle IMF International Monetary FundIREDA Indian Renewable Energy Development AgencyLDCs Least Developed CountriesLICs Low-Income CountriesLPG Liquefied petroleum gasMDRI Multilateral Debt Relief Initiative MDG Millennium Development Goals NGCC Natural Gas Combined Cycle NPR Nepalese Rupees NPK (fertilizer) Nitrogen, phosphorus and potassiumOECD Organisation for Economic Co-operation and DevelopmentOPEC Organization of Petroleum Exporting CountriesOPVI Oil Price Vulnerability IndexPanchayat Local self-governance unitPCA Principal Component AnalysisPDS Public Distribution System PPP Purchasing Power ParityPRGF Poverty Reduction and Growth FacilityPV PhotovoltaicR&D Research and Development REP-PoR Regional Energy Programme for Poverty ReductionRETs Renewable Energy Technologies SMEs Small and Medium Enterprises SYSMIN Système de Stabilisation des Recettes d’ExportationSDRs Special Drawing RightsVAT Value added tax WTI West Texas Intermediate
xv
Abbreviations

Executive Summary
Across Asia and the Pacific, soaring oil prices arethreatening the prospects of millions of poorhouseholds – and posing an unforeseen challenge to the Millennium Development Goals.Since 2003, prices have been rising inexorably,from around US$22 to above US$80 a barrel now,and have been showing little sign of easing.Indeed, many developing countries in the regionare likely to become even more exposed to risingprices, as measured in this Report by a new ‘OilPrice Vulnerability Index’ (OPVI). In response, theReport represents a set of policy options and priorities that can help reduce national vulnerability to future price rises and protect theinterests of the poor.
How oil price rises have hit the poor
The Report starts by asking poor communitieshow they have been affected by rising oil prices.For this purpose, field studies were carried out inrural and urban areas of four countries: China,India, Indonesia and Lao PDR, interviewing 500mostly poor households along with local authorities, public service institutions and othercommunity stakeholders. These communitiesused four main petroleum fuels – kerosene,liquefied petroleum gas (LPG), diesel and gasoline. In addition, farming communities usechemical fertilizers for which the feedstocks areoften petroleum products and natural gas.
Kerosene – Rural communities mainly usekerosene for lighting whereas urban householdsuse it for both lighting and cooking.
LPG – Most urban households prefer this for cooking because it is convenient, efficient andclean, though many rural households may opt tocook with traditional fuels.
Diesel – In rural areas diesel can be used as a fuelfor farm machinery and as a source of electricityin power generators. The poorest households,however, tend to use diesel more indirectly,through public transportation.
Gasoline – This is the least significant fuel for poorhouseholds, since it is used mainly in cars andmotorcycles that relatively few can afford.
Chemical fertilizers – Expenditure on petroleum-based fertilizers can be quite substantial for poorhouseholds.
The poor communities interviewed experiencedsteep increases in the retail prices of all these oilproducts. Before 2003, they had been protectedto some extent by government subsidies. Butwhen prices started on their upward spiral, thesepolicies proved difficult to sustain and subsidyshields are steadily being stripped away. In somecountries, the resulting price increases have provoked a public backlash, posing a dilemma forgovernments torn between the conflicting priorities of fiscal prudence and social justice.
Between 2002 and 2005, the households interviewed suffered some dramatic priceincreases, paying as a whole 74 percent more fortheir energy needs. This included:
• 171 percent more for cooking fuels;• 120 percent more for transportation;• 67 percent more for electricity;• 55 percent more for lighting fuels; and• 33 percent more for petroleum-based
fertilizers and other agricultural inputs.
The survey asked how they had coped with theseincreases. Most reported they had, to some extent,been climbing down the ‘energy ladder’ andreverting to inferior fuels. In India and Indonesia,for example, many rural communities have had tocut back on kerosene for cooking, and insteadhave reverted wholly or partly to biomass anddung cakes. Or they are simply going without:if they cannot afford kerosene for lamps duringpower outages, they stay in darkness.
Faced with rising fares, families have also had tocut back on transport. Unable to afford publicbuses, they may now be walking to the nearesthealth centre or school. Or they may simply havecut back on travel: urban migrant workers inIndia, for example, now return less frequently totheir home villages.
Executive Summary

On the whole, rising oil prices have left the poorwith few choices other than to cut back on theirconsumption of oil products or make other cutsin their household budgets. The urban poor tendto be worse off since they do not have the alternative of collecting fuelwood or other biomass. The rural poor, however, are more vulnerable to higher prices for lighting fuels,especially in unelectrified villages.They are also ata greater disadvantage when high transportcosts isolate them from essential services thatthey do not have in their villages. In India, risingtransport costs have compelled a number ofhouseholds in both rural and urban areas tomove their children from better but more distantschools to others closer to their homes, and, as aresult, the quality of children’s education has suffered.
Switching back to biomass fuels has especiallyserious consequences for women and children,who not only suffer from increased pollution athome, but also have to spend more time andeffort gathering fuels. And to meet rising household fuel bills, women have in additionbeen forced to take on extra work outside thehome.
In fact, given the steep price rise it is surprisingthat the effects have not been more severe.This islargely because many of these households mightbe classified as ‘near-poor’ – they have a smallfinancial cushion that can temporarily absorb theadditional expenses. But if oil prices continue ontheir present trajectory, these resources will soonbe exhausted and households will find that theseprice increases are not only undermining theirpresent lifestyles but also their future prospects.Less able to provide a decent education for theirchildren, to work because of an unhealthy homeenvironment, and to use transport to seize opportunities to earn additional income, manypoor families are seeing their futures compromised.
The macroeconomic impact
Millions of poor people have been hit by theserising prices. But the effects do not yet seem tohave been severe on national economies.Certainly the impact has been nothing as severeas might have been expected based on the experience 30 years ago. The current rising pricesare, however, in many respects different fromthose during the oil shock of the 1970s. Althoughthe increases have been substantial and persistent, they are nonetheless not as steep asbefore. Their cause too is slightly different: in the
1970s, the sudden hikes were due primarily todisruptions in supply, but over the past five years,the increases have been due more to strongdemand, as well as to geopolitical and other factors that have kept supplies tight.
Prices have also become more volatile.Previously, fluctuations in supply and demandwere dampened by three main buffers: surplus production capacity among OPEC members,large oil inventories, and surplus refining capacityin consuming countries. All three buffers have,however, been shrinking, and, as a result, theworld oil market has become much less predictable. This uncertain environment couldhave serious long-term implications for the Asia-Pacific region, particularly for the least developedcountries and for the poorest communities, whichhave faced sudden rises in the price of energy.
Rising oil prices do not appear to have stifled economic growth, which has continued to flourish, both at the global level and within Asiandeveloping countries. The price rises might alsohave stoked inflation, but at the global level thisdoes not appear to have happened either;indeed, inflation declined, though in developingcountries in Asia there have been some signs ofrising inflation.
Another possible outcome is that higher pricescould have encouraged countries to become lessoil intensive to use fewer barrels of oil per unit ofGDP. In fact, many countries had already beenreducing their dependence on oil in the 1990s, sothis trend largely continues. Even so, the region’soil intensity remains higher than the global average and is likely to stay quite high. In Indiaand China, for example, growth in demand isexpected to cause oil consumption to rise byabout 3 percent per year.
Why have the macroeconomic effects been sosmall? Partly because this time the price risesoccurred in the midst of a global boom, anddespite the price increases countries have beenable to maintain their economic momentum.Another factor is that governments have oftenshielded consumers from the price increasesthrough subsidies, which has helped to curb inflation. Of course, it is possible too that themacroeconomic effects have simply beendelayed, and could emerge in the future,especially if recent increases represent the startof a long upward trend.
2 Overcoming Vulnerability to Rising Oil Prices: Options for Asia and the Pacific
National vulnerability to oil price rises
Rising oil prices affect every country, but some are more exposed than others: those thatare highly oil dependent perhaps, or those relying heavily on imports. One indicator ofdependence is ‘oil intensity,’ the amount of oilrequired to produce a unit of economic output.On this basis, both large and small countries arevulnerable to high oil prices for different reasons.Larger countries like China, India and Thailandappear to be more vulnerable because they havehigh oil intensities and also depend heavily on oilimports. Some smaller countries are also at risk,including Cambodia, Nepal and the Pacific IslandCountries,as they are heavily oil import dependentfor critical purposes such as transport and powergeneration.
As they have developed, particularly at the outset, most countries have become more oil intensive. But at higher levels of per capitaGDP, their oil intensity can start to drop as theyswitch to cleaner and more efficient forms ofenergy. China and India, for example, have beenable to slow the rate of growth in oil consumptionwithout sacrificing economic growth.
At lower levels of income, the transition to moremodern fuels can trigger a substantial improvement in human development. So while itmight be tempting to encourage countries atearly stages of economic development to reducetheir dependence on oil, this could also denymany people the benefits of modern energy –not just the comfort and convenience it bringsbut also the economic opportunities it creates.Nevertheless, it should be possible to enable poorpeople to switch to some extent to non-oilsources without sacrificing human development.Even if the poor now rely on kerosene and LPG as‘transition fuels,’ they can, as their incomesincrease, switch to natural gas or electricity.
National vulnerability to oil price increasesdepends not just on oil intensity and on howmuch of the oil has to be imported, but also onthe resilience of the economy. To highlight the relative vulnerability of countries, this Report presents an ‘Oil Price Vulnerability Index’.It incorporates variables that represent economicstrength, economic performance and the extentto which countries base their growth on the useof oil. The country occupying first place, that is,the least vulnerable, is Iran, followed by China andMalaysia. At the other end of the scale are countries with low economic strength, lower economic performance and high oil dependency– such as Cambodia, Maldives and Vanuatu.
Based on their OPVIs, countries can be groupedinto one of three categories: high, medium or low:
• Low vulnerable countries (low OPVI) – China,Iran, Malaysia
• Medium vulnerable countries (medium OPVI) – Bhutan, India, Indonesia, Mongolia, Myanmar,Papua New Guinea, Thailand, Viet Nam
• High vulnerable countries (high OPVI) – Afghanistan, Bangladesh, Cambodia, Fiji, Lao PDR, Maldives, Nepal, Pakistan, Philippines,Samoa, Solomon Islands, Sri Lanka, Vanuatu
Reducing oil price vulnerability
What should countries do to reduce their vulnerability? Clearly, they will want to boost supplies and restrain demand. But they will alsoneed to find ways of managing oil price riskswhile at the same time preparing for potential oilshocks. The options can be divided into five categories:
Managing oil price risk – Many governments haveshielded consumers from the effects of oil pricerises through a series of pricing measures thathave regulated the ‘pass-through’ of global pricesto domestic prices. They have often, for example,subsidized petroleum products, smoothed pricesfor consumers by adjusting the rates of taxation,or passed the subsidy burden on to the privatesector by requiring companies to absorb international oil price increases. Governmentscan also try to offset the impact on the poor bycompensating them in various ways, throughcash transfer schemes and other forms of safetynets. To deal with price volatility, they might alsobe able to use sophisticated financial products,including futures and swaps. Other optionsinclude building up oil price stabilization fundsand engaging in long-term supply contracts.
Enhancing oil supply – Though the supply of oil isfinite, governments can take a number of measures to enhance supplies. They can, forexample, strengthen oil exploration and extraction and increase refining capacity. Theycan also diversify their sources of supply, byinvesting in foreign oil fields, perhaps, or importing from a wider range of countries, or tapping the region’s own oil resources byexpanding cross-border trade between producing and consuming countries. Anotheroption is to engage in barter, trading manufactured products, industrial crops or services for oil.
Executive Summary 3
In contrast to the 1970s, recent
increases in oil prices have
been due more to strong
demand than to tight supplies
Restraining oil demand – This does not mean cutting demand at the cost of economic or socialactivity, but rather increasing efficiency and concentrating the use of oil on purposes forwhich cheaper alternatives are unavailable. In thetransport sector, this would include improvingpublic transport and reducing fuel wastage incars through congestion charges in cities, andencouraging industry and households to useenergy-efficient equipment.
Diversifying fuels – Restraining demand for oil willhave to be accompanied by efforts to switch, inthe medium and long term, from oil to alternativesources, including natural gas, coal, large hydroand renewable energy technologies. The consumption of natural gas, for example, isexpected to rise significantly, particularly forpower generation and also to some extent fortransport. Some countries also have the option ofusing more coal, particularly through clean coaltechnologies.
Preparing for emergencies – Each country alsoneeds to prepare for abrupt disruptions in oil supplies, by building strategic reserves,for example, or making plans for rationing.
Options in renewable energy
One of the most promising forms of fuel diversification is to make greater use of renewable energy sources. These include smallhydro, biomass, wind, solar and geothermalsources as well as biofuels for transportation.These options are becoming increasingly viable:the technology is developing fast, and in manysituations small-scale renewable energy is nowthe cheapest option for the poor.
Renewable energy technologies are alreadybeing used to provide power to electrical grids.Most of this is coming from large hydro systems,but increasingly countries are considering smallhydropower installations along with wind energy.The other main source for grid electricity is biomass, using agricultural wastes, such asbagasse, rice husk, wood wastes, and palm oilempty fruit bunches. In many cases, renewablescan generate power competitively with fossil fuel sources.
The national grid does not, however, alwaysextend to the poor in the more remote areas, whotypically have to rely on gasoline- or diesel-powered generator sets for electricity in either
off-grid or mini-grid systems. For these purposes,renewables can be cheaper than gasoline ordiesel – though solar photovoltaic systems usually work out more expensive. These developments have considerable significance forpoor and remote rural communities that use off-grid or mini-grid electricity for heating andlighting as well as for boosting production andhousehold income.
Conventional energy systems tend to have lowcapital costs but significant operating costs. Forrenewable systems, the picture is reversed: capitalcosts are high, but, over time, these are offset bylow operating costs. Added to this are the environmental benefits, the prospect ofincreased employment, reduced import dependence, and reduced burden on foreignexchange.
However, the marketplace does not account forany of this value creation. Nor does it regard therural poor as good credit risks, seeing off-grid systems as high-risk, low-return propositions. Inthe past, some governments have respondedwith large subsidies in the hope that this wouldattract the private sector into the market. But itnow seems unlikely that this on its own will domuch to deliver energy services to the rural poor.Instead of withdrawing to let private marketsdevelop on their own, a better approach is towork alongside local communities and the private sector to remove barriers and reducerisks.
Another important renewable option is the use ofbiofuels – either bioethanol, which comes mainlyfrom corn or sugar cane, or biodiesel from refinedvegetable oils such as rapeseed, soy, palm andcoconut. One of the newer options is Jatropha Curcas, a fast-growing, drought-resistant perennialthat can be planted even in wastelands. In preliminary applications, it has shown a high oilcontent and can be burned in a simple dieselengine without being refined. However, there is awidening and increasing recognition of the needto further assess the economic viability and theecological, environmental and social impacts ofgrowing Jatropha as experience of cultivating thisplant for commercial use has been limited to date.
Even today, some biofuels are competitive withpetroleum-based products. Others can competeonly with the help of subsidies, though withimproved technologies and economies of scale,prices generally are coming down. Nevertheless,even if biofuels are competitive, they may not
4 Overcoming Vulnerability to Rising Oil Prices: Options for Asia and the Pacific
always be a good choice. The rapid recentincrease in biofuels production has triggeredconcerns about the negative impact on food supply and prices. Using food crops such as cornto produce ethanol will push up the prices of cornand corn-derived food items. There is also concern about converting land from food cropsto biofuel feedstock crops, with the danger thatbiofuels development, instead of helping toreduce poverty by providing employment ingrowing the feedstocks, could instead exacerbatefood insecurity.There are also environmental risksin converting forests to monoculture biofuel feedstock plantations, in addition to age-old ruraland agricultural development issues such as landtenure. All these issues need to be dealt withproperly, assuring fair and equitable sharing ofprofit and income with the poor.
Policies for an uncertain oil price future
What can the countries of the region do to protect themselves in an increasingly uncertainenergy environment? To arrive at a more precisesequence, it is useful to consider different possible scenarios. The four proposed in thisReport are: baseline, supply shock, peak oil priceand energy security.
• Baseline – Oil prices remain between US$65 and US$75 per barrel.
• Supply Shock – A supply crisis suddenly pushes prices beyond US$100 per barrel in the short to medium term, but over the long term prices decline to their previous levels.
• Peak Oil Price – This scenario reflects the Hubbert’s Peak theory, according to which,world oil production will start to peak. Prices rise gradually toward US$100 per barrel and increase exponentially thereafter.
• Energy Security – Concerns for both energy and environmental security lead to reduced oil demand, so prices fall back to a lower equilibrium at around US$50 per barrel.
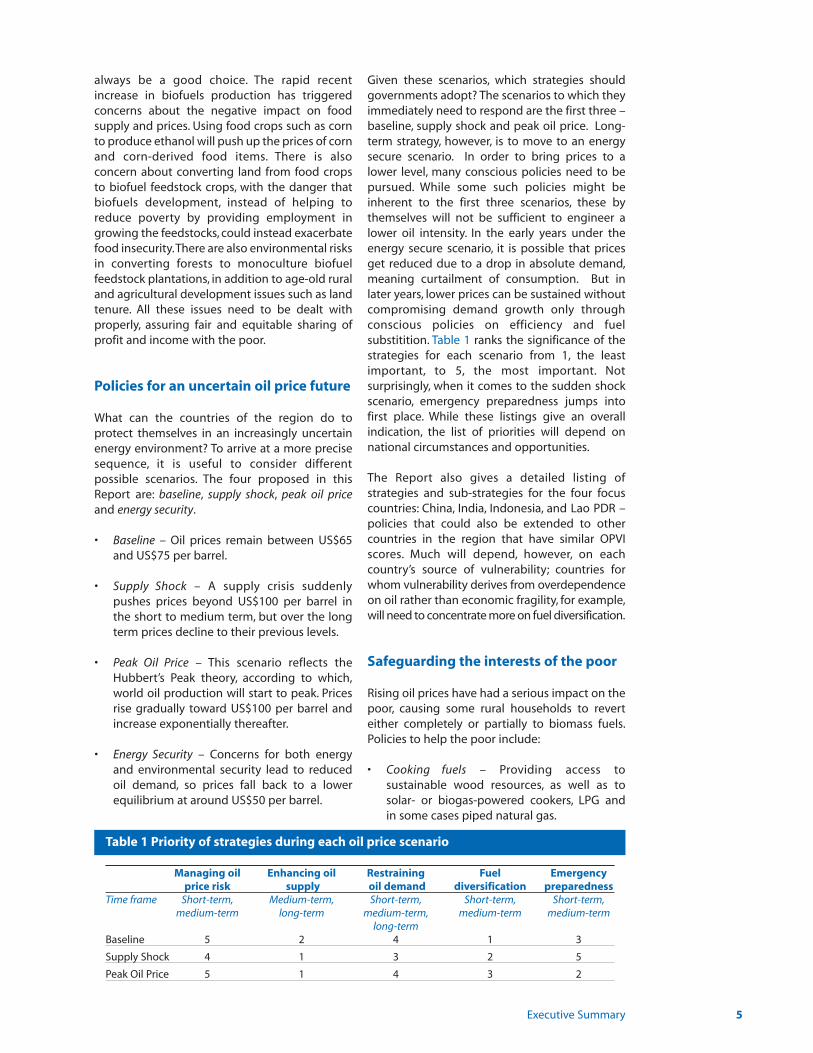
Given these scenarios, which strategies shouldgovernments adopt? The scenarios to which theyimmediately need to respond are the first three –baseline, supply shock and peak oil price. Long-term strategy, however, is to move to an energysecure scenario. In order to bring prices to alower level, many conscious policies need to bepursued. While some such policies might beinherent to the first three scenarios, these bythemselves will not be sufficient to engineer alower oil intensity. In the early years under theenergy secure scenario, it is possible that pricesget reduced due to a drop in absolute demand,meaning curtailment of consumption. But inlater years, lower prices can be sustained without compromising demand growth only throughconscious policies on efficiency and fuel substitition. Table 1 ranks the significance of thestrategies for each scenario from 1, the leastimportant, to 5, the most important. Not surprisingly, when it comes to the sudden shockscenario, emergency preparedness jumps intofirst place. While these listings give an overall indication, the list of priorities will depend onnational circumstances and opportunities.
The Report also gives a detailed listing of strategies and sub-strategies for the four focuscountries: China, India, Indonesia, and Lao PDR –policies that could also be extended to othercountries in the region that have similar OPVIscores. Much will depend, however, on each country’s source of vulnerability; countries forwhom vulnerability derives from overdependenceon oil rather than economic fragility, for example,will need to concentrate more on fuel diversification.
Safeguarding the interests of the poor
Rising oil prices have had a serious impact on thepoor, causing some rural households to reverteither completely or partially to biomass fuels.Policies to help the poor include:
• Cooking fuels – Providing access to sustainable wood resources, as well as to solar- or biogas-powered cookers, LPG and in some cases piped natural gas.
Executive Summary 5
Table 1 Priority of strategies during each oil price scenario
Managing oil Enhancing oil Restraining Fuel Emergencyprice risk supply oil demand diversification preparedness
Time frame Short-term, Medium-term, Short-term, Short-term, Short-term,medium-term long-term medium-term, medium-term medium-term
long-termBaseline 5 2 4 1 3
Supply Shock 4 1 3 2 5
Peak Oil Price 5 1 4 3 2

• Subsidies – Offering cash transfers to eligible beneficiaries through coupons, bank transfers or smart cards.
• Transport – Introducing smart cards or other mechanisms to provide poor households with access to public transport at subsidized rates.
• Liquid biofuels – Developing bioethanol and biodiesel to boost rural agricultural production and employment, particularly for remote mountainous and island communities.
• Income generation – Investing in decentralizedrenewable energy sources to offer new power sources for households and for productive activities.
In pursuing such recommendations, countries inthe region should also be able to rely on supportfrom bilateral and multilateral developmentagencies, which can help build alliances and institutional frameworks, promote research andadvise on some of the necessary mechanisms,such as oil price stabilization funds and innovative compensation and subsidy schemes.
Proposal for a regional compensatory oil financefacility
With small foreign exchange surpluses and low orno trade surpluses, many least developed countries in the region will see their currentaccount deficits widen and could increasinglysink into debt in order to pay for more expensiveoil imports. One solution would be to create anAsia-Pacific Compensatory Oil Finance Facility.This would have two purposes. First, it wouldenhance a country’s liquidity to help it overcomea balance of payments or fiscal deficit. Second, itwould help the country finance essential structural changes to reduce its dependence onoil. A portion of the financial assistance could alsobe earmarked for measures to enhance energyaccess for the poor. The facility could derive thebulk of its funds from bonds issued in regionaland international capital markets, supplementedby donor grants, along with financing from existing international exogenous shocks facilities.
Where do we go from here?
Along with the rest of the world, developingcountries of the Asia-Pacific region face an uncertain oil future. While no one can predicthow oil prices will move in the coming years,more signs seem to indicate an upward movethan not. But in the final analysis, they convergeon a single point, which is that the world’s finiteoil resources will one day or another be exhausted.
Yet for the poor to rise above poverty, they willhave to consume more electricity and modernfuels, including oil. Failure to ensure this meansthe poor will remain poor – indeed millions willslip back to relying on biomass fuels and humanlabour, back to eking out subsistence-levelincomes while the rest of the population movesfarther ahead in social status and economic affluence.
This Report outlines a range of solutions to prevent this from happening. While each countrywill doubtless weigh them in the light of its owncircumstances, the broad direction should beclear. While adopting strategies to secure thefuture of their economies, all developing countries must alleviate the suffering of theirpoor in the immediate present. This means providing the poor with essential relief againstrising fuel prices, by way of focused subsidies,compensation and direct cash transfers.Simultaneously, a concerted effort is needed toshift the future trajectory of energy consumption,not only of the poor but also of whole economies,away from a reliance on oil. Reducing the oilintensity of development is no longer a matter ofchoice; it is the only course. The time to act is now – before affordable oil becomes a distant memory.
6 Overcoming Vulnerability to Rising Oil Prices: Options for Asia and the Pacific

Chapter 1: How oil price rises have hit the poor
1
This Report examines the impact of rising oilprices since 2003 on developing countries of theAsia-Pacific region. Its central aim, captured in thischapter, is to find out how the poor in these countries have fared in the past five years of highoil prices, and what needs to be done to protecttheir interests. The Report is framed by the awareness that even after a persistent five-yearrun from around US$22 to over US$80 a barrel,global oil prices show little indication of easing.With futures markets pricing a barrel of oil atmore than US$100 a year from now1, the impactsobserved so far may presage worse to come.
A key feature of the ongoing oil price ‘shock’ isthat it has arrived in the midst of a global economic boom from which the Asia-Pacificregion may have benefited most. As a result, theregion as a whole has managed to sidestep economic downturns of the kind triggered bypast oil price spikes. Although some signs ofstrain are showing of late, the macroeconomicfundamentals of most countries have, by andlarge, remained intact. However, underneath thisfabric of general well-being, the poor are beinghurt in numerous ways by rising fuel prices. Manyare being forced to surrender hard-won gains intheir lifestyles and livelihoods. If their problemsare not resolved, their distress can escalate into alarger socioeconomic setback.
This introductory chapter revolves around casestudies of 14 rural and urban communities inChina, India, Indonesia and Lao PDR. Though limited in scope, the case studies offer a lensthrough which to view ground-level realitieslargely lost in the glare of aggregated statistics atnational levels. The story they tell is disturbing.
The energy connection to poverty
Energy deprivation is a defining characteristic ofpoverty and a formidable barrier to its resolution.In order to understand the impacts of oil priceson the poor, one must first grasp the role thatenergy plays, or fails to play, in their lives.
The Asia-Pacific region is home to more than halfof the world’s population and two-thirds of itspoor. While the proportion of people surviving on less than US$1 a day fell from 31 to 20 percentbetween 1990 and 2001, the poor population’sabsolute number remained high, at 679 million(UNESCAP 2005). The majority of these peoplelive in rural areas with no, or low, access to electricity and are unable to afford more than amodicum of modern fuels like kerosene foressential lighting. At the same time, relentlessurbanization, projected to increase between 2000and 2030 from 35 percent to 53 percent of thepopulation (UNDESA 2002), has been steadilyshifting poverty from rural communities to urban settlements. Although the urban poor may seemto have better access to fuels and electricity,many continue to rely heavily on inferior biomassfor cooking which, in poor households, is the single largest use for energy, because they cannot afford modern energy alternatives(Appendix A.1 details the socioeconomic andenergy profiles of the region).
Poverty in the region is thus closely linked to highbiomass consumption and low access to electricity (Figure 1-1). As many as 72 percent ofthe world’s people who depend on biomass fuelslive in the region. Nearly a third of the population,
How oil price rises have hit the poor
Will soaring oil prices dash the poor’s hopes of escape from poverty? This is a distinct possibility if alternatives are not found quickly. In a number of countries, rising costs of domesticfuels and public transport have severely affected poor households. In some cases, the ensuing discontent has spilled out onto the streets. Now at record levels, oil prices pose anunforeseen challenge to the Millennium Development Goals – crucially, the overarching goal toeradicate extreme poverty and hunger.
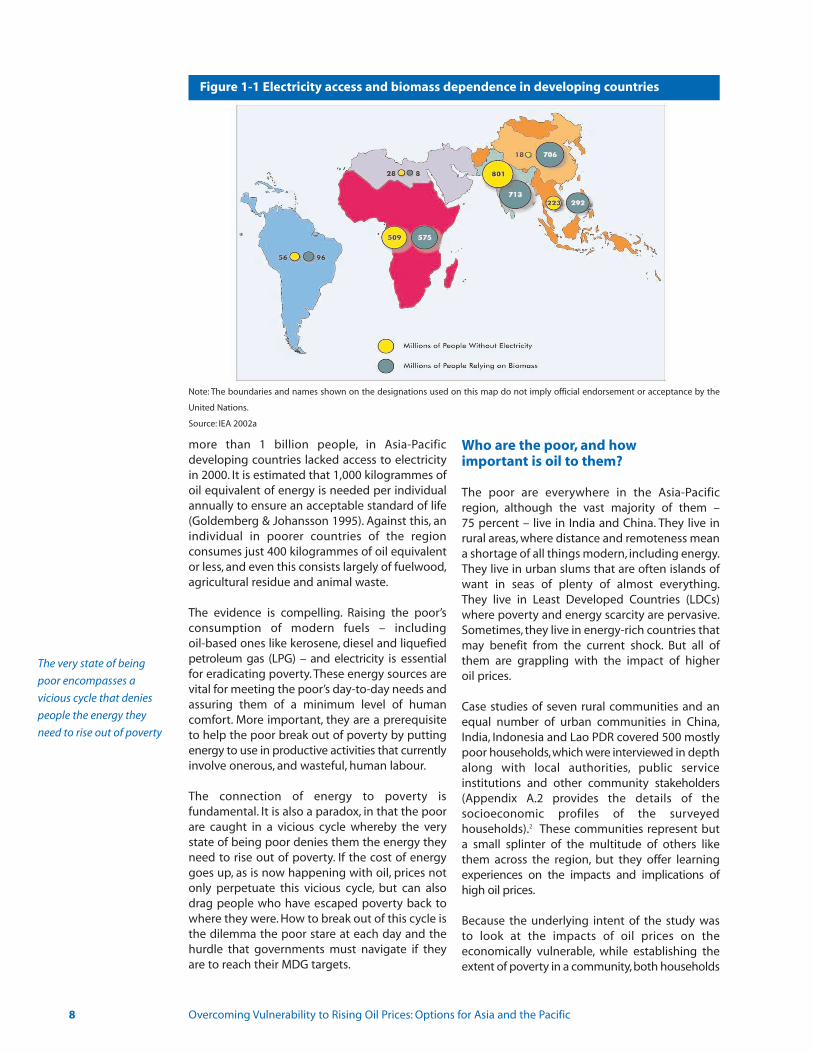
more than 1 billion people, in Asia-Pacific developing countries lacked access to electricityin 2000. It is estimated that 1,000 kilogrammes ofoil equivalent of energy is needed per individualannually to ensure an acceptable standard of life(Goldemberg & Johansson 1995). Against this, anindividual in poorer countries of the region consumes just 400 kilogrammes of oil equivalentor less, and even this consists largely of fuelwood,agricultural residue and animal waste.
The evidence is compelling. Raising the poor’sconsumption of modern fuels – including oil-based ones like kerosene, diesel and liquefiedpetroleum gas (LPG) – and electricity is essentialfor eradicating poverty. These energy sources arevital for meeting the poor’s day-to-day needs andassuring them of a minimum level of humancomfort. More important, they are a prerequisiteto help the poor break out of poverty by puttingenergy to use in productive activities that currentlyinvolve onerous, and wasteful, human labour.
The connection of energy to poverty is fundamental. It is also a paradox, in that the poorare caught in a vicious cycle whereby the verystate of being poor denies them the energy theyneed to rise out of poverty. If the cost of energygoes up, as is now happening with oil, prices notonly perpetuate this vicious cycle, but can alsodrag people who have escaped poverty back towhere they were. How to break out of this cycle isthe dilemma the poor stare at each day and the hurdle that governments must navigate if theyare to reach their MDG targets.
Who are the poor, and howimportant is oil to them?
The poor are everywhere in the Asia-Pacificregion, although the vast majority of them – 75 percent – live in India and China. They live inrural areas, where distance and remoteness meana shortage of all things modern, including energy.They live in urban slums that are often islands ofwant in seas of plenty of almost everything.They live in Least Developed Countries (LDCs)where poverty and energy scarcity are pervasive.Sometimes, they live in energy-rich countries thatmay benefit from the current shock. But all ofthem are grappling with the impact of higher oil prices.
Case studies of seven rural communities and anequal number of urban communities in China,India, Indonesia and Lao PDR covered 500 mostlypoor households,which were interviewed in depthalong with local authorities, public service institutions and other community stakeholders(Appendix A.2 provides the details of the socioeconomic profiles of the surveyed households).2 These communities represent buta small splinter of the multitude of others likethem across the region, but they offer learning experiences on the impacts and implications ofhigh oil prices.
Because the underlying intent of the study was to look at the impacts of oil prices on the economically vulnerable, while establishing theextent of poverty in a community,both households
8 Overcoming Vulnerability to Rising Oil Prices: Options for Asia and the Pacific
Figure 1-1 Electricity access and biomass dependence in developing countries
Note: The boundaries and names shown on the designations used on this map do not imply official endorsement or acceptance by the
United Nations.
Source: IEA 2002a
The very state of being
poor encompasses a
vicious cycle that denies
people the energy they
need to rise out of poverty
IndiaIndia’s total energy consumption was 394 million tonnes of oil equivalent in 2003, with the residential sector being the largest consumer, followed by industry and transport. In the rural areas, 76 percent of households depend on fuelwood and other biomass, while only 5 percent use LPG for cooking. However, 51 percent of households use kerosene which, in unelectrifiedareas, is mainly for lighting.
In urban areas, electricity is the main source of energy for lighting for 89 percent of households, with most of the rest comingfrom kerosene; for cooking, 22 percent of urban households use fuelwood and other biomass, while 44 percent use LPG. Oilaccounts for about 34 percent of total energy consumption. India has some local production, but 72 percent of crude oil mustbe imported.
The surveyed communitiesTwo rural and two urban communities were covered by the survey: the adjoining villages of Deepdi and Bangrasia (Bhopal district, Madhya Pradesh), Hoglagare village (Kolar district, Karnataka), Kalyanpuri slum (Delhi, part of India’s National CapitalTerritory), and Koramangala slum (Ambedkarnagar, Bangalore, capital of Karnataka). Madhya Pradesh, where the villages ofDeepdi and Bangrasia are located, is one of India’s least developed states. Around 25 percent of the working population in thetwo villages are employed as casual labour and in the small services sector. Most houses in the village are electrified, although
living below the poverty line and ‘near-poor’households just above the poverty line were considered. Near-poor households typically hadincomes up to 25 percent above the poverty line3
and are especially vulnerable to shocks since theyfall in and out of poverty in large numbers.
Although absolute numbers of the poor are highin China, the survey found the lowest proportionof poor households there, with the majority inboth rural and urban communities havingincomes above the national poverty line.Not surprisingly, the highest proportion of thepoor was in Lao PDR, where 67 percent of ruralhouseholds and 75 percent of urban householdsfell below the national poverty line in the communities surveyed. In India, the average
incomes of rural and urban households surveyed were slightly above US$1 per day, and inIndonesia they were around US$1.75 per day.The socioeconomic and energy consumption profiles of the communities in the four countriesare outlined in (Box 1-1).
Notable differences exist between the energyconsumption patterns of the rural poor and thoseof the urban poor, with oil products playing agreater role among the latter in all four countriesstudied. Four petroleum fuels – kerosene, LPGdiesel and gasoline – feature in poor people’slives. In addition, inorganic (chemical) fertilizersused in farming depend heavily on petroleumand natural gas.
Chapter 1: How oil price rises have hit the poor 9
Box 1-1 The view from the ground: Four countries
ChinaAround two-thirds of China’s primary energy consumption is derived from coal, of which the country is the world’s largest consumer and producer. Much of the rest comes from oil. Since 2002 China has been the world’s second-largest consumer ofoil products. Chinese households have also been consuming more LPG, some of which is produced locally. Between 2000 and2003 consumption increased from 10 million to 13 million tonnes. In some regions prices have been deregulated, andincreased demand has resulted in LPG shortages in regions that rely on imports.
Most households have access to electricity. In just over 50 years, China has extended supplies to more than 900 million ruralresidents. By 2004 it had achieved an electrification rate of 98 percent. It delivers electricity in some places through a combination of national and local grids, the latter supplied largely by small-scale hydropower in the more remote rural areas.As a result, per capita electricity consumption has been rising rapidly: between 1980 and 2004, it rose nationally by 7 percent and in the rural areas by 11 percent per year.
The surveyed communitiesTwo rural and two urban communities in the northern and southern regions of the country were surveyed: Tanchang village(Miaofengshan town, Mentougou district, Beijing city), Jiuyan village (Dongqiao town, Zhongxiang city, Hubei province),Chunshu street (Xuanwu district, Beijing city) and Wuhan city (Hubei province). Tanchang village is in a mountainous area 45km from Beijing. Jiuyan village is 248 km from Wuhan city. In both villages, households use electricity for lighting, and coal,electricity, fuelwood and crop residues for cooking. Around 70 percent of their income comes from farming.
The urban settlement of Chunshu street is an area populated mostly by civil servants, private sector practitioners and service professionals, along with temporary migrants. It is a fairly well-developed district, with only around 1 percent of the population below the poverty line. The other urban settlement, Wuhan, is a city of 2.5 million households. Its infrastructure isalso well developed. Residents in both communities use electricity, coal and LPG for cooking, and electricity for lighting.Wuhan has extreme climatic conditions – hot in summer, and cold, damp and cloudy in winter. Its residents use air-conditioning and cooling fans in the summer, and coal stoves and electric heating in the winter.
The rural poor and urban
poor use energy differently,
with oil products playing
a greater role among
the latter
10 Overcoming Vulnerability to Rising Oil Prices: Options for Asia and the Pacific
Lao PDRLao PDR’s total energy consumption increased modestly, by about 5 percent, between 1996 and 2002. The most importantsource of energy, accounting for 57 percent of consumption, is fuelwood. Fuel oil is next, at 17 percent. The country has no oilproduction or refining capacity of its own, so it has to import all its needs. Lao PDR has local deposits of coal, however, whichit uses for industrial purposes. In addition, it generates significant quantities of electricity from hydropower, whose share of energy consumption rose between 1996 and 2002 from 5 percent to 12 percent. Very few people use LPG.
The surveyed communitiesOne rural and one urban community were surveyed: Ban Nammadao village (Luangprabang province in the north of the country) and two central districts of Vientiane city (the capital). People in Ban Nammadao are mostly engaged in traditionalfarming, with a minority having small shops. Most people belong to the H’Mong ethnic minority and live in traditional houses– small wooden huts with kitchen and sleeping spaces in different corners of the same room. Fuelwood, which is readily available, is their main source of energy for cooking. For lighting, they use kerosene or candles, and occasionally battery-operated torches. Other than kerosene, the use of petroleum products is very limited.
People in the urban districts of Vientiane municipality live in clusters of semi-concrete or wooden dwellings. Despite havingaccess to both electricity- and petroleum-based fuels, many households continue to use fuelwood and charcoal for cooking –largely because fuelwood supply is still easily available. Vientiane has hot, humid summers and relatively warm winters, soalmost all households use electric fans, while around one-quarter use air conditioners. All houses are electrified, but power outages make the use of candles necessary.
there are seasonal variations in supply and households experience outages of four to eight hours per day. The main cookingfuel used is biomass, followed by LPG. Kerosene is mostly used for lighting. For agricultural activities, farmers use diesel andelectricity, primarily for tractors and pump sets.
Hogalagere village is 25 km from Kolar city in India’s eighth-largest state, Karnataka. It is in a semi-arid, drought-prone region,but is rich in biomass resources. Three-quarters of its working population is involved in agriculture. The village is fully electrified, though power cuts are common throughout the year, especially during the summer months, and can last for 12 hours a day.
Ambedkarnagar colony in Bangalore is a slum settlement with 80 percent of its people below the poverty line. Around halfwork as daily labourers and the rest in private services, mainly housekeeping, courier companies and garment factories. Mostfamilies live in kuchcha houses – temporary structures with thatched or asbestos roofs – or semi-permanent houses madepartly from concrete. Sanitation is poor and living conditions generally unhealthy. For cooking, most people either use LPG orfuelwood. Around 90 percent of the households have access to electricity. The second urban location, Kalyanpuri, is a denselypopulated and overcrowded area with rundown housing. Most households combine two or more cooking fuels – dung cakesor fuelwood, complemented by kerosene and LPG. However, many also use electric heaters by illegally tapping supplies fromneighbouring colonies. They also use such supplies for lighting. Although the electricity is free, households occasionally haveto pay a middleman to reattach disrupted connections.
IndonesiaDuring the 1990s, Indonesia, the only South-East Asian member of OPEC, was one of the largest oil exporters. Between 1990and 1995, annual crude oil production rose from 467 million to 551 million barrels. It started to decline thereafter due to agingoil fields and stagnant investments in new technology. By 2006 production had fallen to 386 million barrels. However,consumption of petroleum products continued to rise, and eventually could no longer be met from national production.
Indonesia is also a major producer of coal and is expected to become the world’s third-largest exporter soon, after Australiaand China. Much of the local consumption is for power generation. In 2004, the country produced over 2 million tonnes.The coal is widely used by industry and by middle- and upper-class households in major cities. In Jakarta alone, LPG consumption averages around 1,500 tonnes per day. In the rural areas, however, the primary fuel for cooking and other thermal energy applications is biomass.
The surveyed communitiesThe rural communities covered were in two sites in the province of West Java: Mekarjaya and Sukamaju, both some 40 km fromthe provincial capital, Bandung. The urban settlements were Cikutra and Cisereuh in Bandung city. Most people in Mekarjayaand Sukamaju work as farm labourers or small farmers.Their other sources of income include household businesses related tolocal industries that often involve woodcraft and carpentry. Their main sources of energy are kerosene and fuelwood for cooking, and electricity for lighting. Some houses in these villages share electricity from a single connection, which they alsouse to operate television sets and music players.
Most people in Cikutra and Cisereuh work as daily labourers, in both the formal and informal sectors, while a few run their own businesses. Households in these urban communities typically use kerosene for cooking, electricity for lighting and gasoline for motorcycles, one of the main means of travelling between home and work. Unlike in the rural areas, urban consumers do nothave the option of switching to traditional fuels.
Chapter 1: How oil price rises have hit the poor 11
Kerosene
Most people without access to electricity live inthe rural areas, where remoteness and high costsprevent electricity supply through the centralizedgrid or the use of decentralized power generatingoptions to any appreciable extent. For ruralhouseholds without electricity, kerosene is thenext best option for lighting because of its relative ease of use and low (subsidized) costcompared to other options like candles or batteries. It is also an essential backup for households that have an electricity connection,but with erratic supply.This happens in both ruraland urban areas, partly due to overall supply constraints and partly because of equipmentbreakdowns. It is used as a cooking fuel whenfamilies upgrade from biomass and inferior fuelslike charcoal, but are either unable to afford or donot have access to other modern energy sourceslike LPG and electricity.
Among the rural communities surveyed, the useof kerosene for lighting is common in Lao PDRand India, but in rather different circumstances.None of the village households in Lao PDR has an electricity connection, so kerosene is their primary lighting fuel. By contrast, all householdsin the two Indian rural communities have an electricity connection, although supply is highlyunreliable. As a result, 100 percent of the households in one village and 73 percent in theother use kerosene as a backup. In both Lao PDR and India, all urban households in the communities surveyed have electricity, but they are less affected by power outages.Consequently, from zero to 25 percent of these households use kerosene for backup, much lowerthan in the rural communities.
In Indonesia, none of the rural and urbancommunities surveyed reported power outages,so no household consumes kerosene for lighting.The situation was similar in the two urban communities in China. Its two rural communities,however, reported some infrequent power outages, which they managed with candles.
The use of kerosene as a cooking fuel, meanwhile,is closely related to the availability of biomassfuels. Where biomass is readily available, it is thepreferred fuel for both convenience and cost reasons among rural and urban households alikein India, Indonesia and Lao PDR. Kerosene forcooking is used mainly by non-poor householdsand sparingly by a minority of poor households.The situation among the communities surveyedin China, both rural and urban, is different.In their case, alternatives to kerosene are wider,
comprising biomass, coal, LPG and electricity.None of the Chinese households reported usingkerosene for cooking.
LPG
Convenience, efficiency and cleanliness makeLPG the preferred choice for cooking for mosturban households, but not necessarily so for ruralhouseholds, which either have concerns over itssafety or feel traditional fuels are more compatible with their cooking habits. The mainbarriers to its use are its availability and cost. LPGis a pressurized mixture – consisting primarily ofpropane or butane, or both – usually sold in cylinders for domestic use. Its retail distributionrequires a transport network more readily available in urban areas and less so in rural areas.More important, its higher cost compared to biomass, charcoal and kerosene limits its use to households that have the necessary income.
LPG use for cooking was observed in only four ofthe 14 communities surveyed. All are urban communities and almost entirely non-poor.These households also often use kerosene as abackup or as a supplement, for example, using itfor certain cooking tasks while limiting LPG use toothers. This has a bearing on poor households:while they have little to do with LPG, they can beaffected if its supply is disrupted, causingkerosene consumption among non-poor LPGusers to rise and creating potential supply problems with the kerosene that poor households do use.
LPG is also very occasionally used as a transportfuel. Among the 14 communities surveyed in all four countries, just one urban (non-poor) household in India reported using it, for a three-wheeled vehicle.
Diesel
Diesel has multiple uses in rural communities:as a transport fuel in public and private vehicles,as a fuel for farm machinery (tractors, threshers,irrigation pump sets), and as a source of electricity in power generators catering for a variety of domestic and commercial applications,such as lighting, grinding and operation of electrical machinery. Urban households use itmainly as a transport fuel, while urban establishments – hospitals, hotels, shopping andapartment complexes – also employ it in powergenerators as an emergency backup against grid outages.
Lacking electricity, the poor
mainly turn to kerosene for
home lighting
Given its versatility, diesel is used for one purposeor another by all households in all communities surveyed. However, its use among poor households is confined largely to public transportation. This is because diesel-usingequipment is capital-intensive and, more oftenthan not, beyond the reach of the poor. Few poorhouseholds in the four countries reported thedirect use of diesel for transport, farming orpower generation, although one household inIndia reported using a diesel lamp.
The poor’s indirect use of diesel through publictransport vehicles is, however, extremely important, because these vehicles are their mainmeans of conveyance to markets, schools, healthfacilities and places of work in rural areas. This isequally true for those in urban areas; many people commute routinely to their places of workand markets, with migrant workers also relyingon public transport to travel to their home villages. In Lao PDR, for instance, 61 percent of thenational petroleum product demand is for diesel,the bulk of which is for public transportation.
In all communities surveyed, reliance on publictransportation is pervasive, highest in three of thecommunities where none of the households owna personal vehicle. The situation is somewhat better in the other communities where personalvehicle ownership, usually of motorcycles, rangebetween 8 and 14 percent in India and Indonesia,and between 16 and 43 percent in China. Theexception to the trend, surprisingly, is in Vientiane(Lao PDR), where 92 percent of households in the community surveyed – with 75 percent livingbelow the poverty line – own motorcycles. Thisarises from weak public transport facilities in thecity, where public vehicles are limited in numberand serve only select routes.
Gasoline (petrol)
Gasoline is used mainly in private vehicles (carsand motorcycles). It is also a source of backup electrical power, though on a much smaller scalethan diesel generators. It is consumed by households that own personal vehicles in thecommunities surveyed. With the exception ofVientiane, ownership of private vehicles amongthe poor is low to zero in the communities surveyed. No community reported using gasolinein power generators.
Chemical fertilizers
Chemical fertilizers are important to ensure thefood security of developing countries in which population pressures on available agricultural
land are continuous and, therefore, increasing the productivity of soil is critical. Most chemical fertilizers contain compounds of nitrogen,phosphorus and potassium, commonly known asNPK fertilizers. Although these basic chemicalscan be derived from a number of sources,petroleum products like naphtha and fuel oil,along with natural gas, are a major feedstock forthem. They are also used to produce a variety ofpesticides, herbicides and insecticides essentialto crop production.
To the extent chemical fertilizers are producedfrom petroleum products, their use amounts toan ‘indirect’ consumption of energy. Expenditureon such indirect energy consumption can bequite substantial for poor households, at timeseven more than what they spend on petroleumfuels in direct energy consumption. For instance,poor farming households in the mountainousSichuan province of China spend as much as 16to 32 percent of their recurring expenditure onchemical fertilizers to extract the most from areluctant land under harsh climatic conditions,against only 4 percent on kerosene, candles andelectricity from decentralized micro-hydro systems (Ramani 2003).
The use of chemical fertilizers is widespread in allrural communities surveyed for this Report inChina, India and Indonesia. Lao PDR is the exception, where rural people rely mostly on natural organic fertilizers like crop residue andanimal waste. The extent to which poor households consume fertilizers depends largelyon whether they own agricultural land or areemployed as farm labourers.
By this measure, the largest numbers of poorhouseholds using chemical fertilizers were in thetwo rural communities surveyed in China, onewith 97 percent and the other with 69 percent.China’s land tenure system combines privaterights with public ownership, with agriculturalland nominally owned by village collectives butallocated among individual households whooperate it. This results in the vast majority ofhouseholds, poor or not, using fertilizers in bothvillages.
On the other hand, private ownership of farmland in India and Indonesia tends to exclude thepoor (though not the near-poor). Hoglagare village in India, for instance, has a poor householdpopulation of 28 percent, the same as the proportion of households depending on dailywages as their primary source of income. As manyas 65 percent of the households in Sukamaju inIndonesia and 69 percent in Deepdi-Bangrasia in
12 Overcoming Vulnerability to Rising Oil Prices: Options for Asia and the Pacific
Diesel for public
transportation creates
access to a variety of
services, from education
and health to markets
and employment
Expenditures on
petroleum-based chemical
fertilizers can be a
considerable burden on
farmers’ limited cash
resources
Chapter 1: How oil price rises have hit the poor 13
India are similarly dependent on daily wages,implying their lack of ownership of agriculturalland and, therefore, the lack of fertilizer use as well.
This picture of consumption patterns in the fourcountries leads to the following conclusions about the extent of the poor’s dependence on oil:
• Kerosene for home lighting and diesel for public transportation are the most critical oil products for the poor. Where the poor own or operate agricultural land for their own benefit, petroleum-based chemical fertilizers are just as important.
• The poor’s modest consumption of kerosene,often just one to two litres a month, does not add up to a significant share of the total petroleum product demand in developing countries. But this can be deceptive: lighting is vital for human life. Its presence or absence affects a wide range of human activities upon which it is hard to place an economic value.
• Because the demand for kerosene arises mainly from the lack of electricity, a reliable electric supply can reduce or eliminate the poor’s dependence on kerosene. It also can lower their consumption of diesel in non-transport activities, such as irrigation and drinking water pumping.
• The diesel consumed indirectly by the poor via public transportation enables them to access a variety of services, from education and health to markets and employment.Reliable data are hard to come by on the proportion that the poor’s diesel consumption occupies in national petroleum demands.However, as with kerosene, its value to the poor is very high because it makes the difference between connecting with the outside world and being isolated.
• Meeting the poor’s cooking energy needs – which account for as much as 80 percent of their total household energy consumption – through petroleum products will be a huge challenge. While it is socially and environmentally desirable to help poor households make the transition from biomass fuels to cleaner ones like kerosene, LPG and electricity, the cost of such a move can be substantial, given the large numbers of poor currently relying on biomass.
• Expenditures on petroleum-based chemical fertilizers can be a considerable burden on the limited cash resources of poor farmers.
This can be reduced by switching to organic fertilizers, such as slurry from biogas digesters, or inorganic fertilizers made from other sources like coal.
Exposing the poor to the oil price shock
Shrinking subsidies and soaring prices
The main outcome of the ongoing high oil pricespell has been a gradual, and in some countriesabrupt, rise in the retail prices of oil products.Before oil prices began their upward spiral in2003, the prices of oil products that matter to thepoor were largely regulated by governments inmost developing countries of the region; in otherwords, governments subsidized the prices of suchproducts to ensure the poor could afford them.
However, as the price of crude oil in world markets has continued to surge, the mostly oil-importing countries of the region have struggled to sustain this policy.The widening gapbetween international costs and domestic pricesof oil products has stretched their capacity tomaintain subsidies at the same levels as in the past.
Juggling between the need to rein in a ballooning subsidy burden on governmentfinances and the imperative to protect the poor’sinterests has not been easy. While the overalltrend has been to move domestic product pricescloser to world market prices, most governmentshave approached the process of price liberalization gingerly, feeling their way throughdepending on their respective economic circumstances. But mounting pressure fromworld markets has forced them to hike domesticprices in larger increments in more recent years.
As a result, the poor find the subsidy shield beingstripped away from them, and they resent it.In some countries where retail prices havejumped sharply, the resentment has erupted into a public backlash, posing a dilemma for governments torn between the conflicting priorities of fiscal prudence and social justice (Box 1-2).
An important indicator of the extent to which oilproduct prices are being deregulated is the ‘pass-through coefficient,’ which has varied fromcountry to country. This is the ratio of change indomestic retail prices over a given period to thechange in corresponding international productprices during the same period. The higher thepass-through coefficient, the closer domesticretail prices will get to international prices.
Governments subsidized
the prices of oil products to
ensure the poor could
afford them, and now that
capacity is overstretched

14 Overcoming Vulnerability to Rising Oil Prices: Options for Asia and the Pacific
Table 1-1 illustrates how the pass-through hasbeen lower for diesel, which has greater relevancefor the poor, compared to that of gasoline, whichis consumed mostly by the non-poor, in the fourcountries surveyed. A value in excess of oneindicates a faster rate of change in domesticprices than that in international prices. It does notmean domestic prices have reached parity withinternational prices by removing subsidies altogether. Rather, it signifies that countries starting from a low price level (high subsidies)have had to reduce them more rapidly to catchup. In all four countries, varying elements of subsidies remain. Also, while reducing subsidies,their governments have adopted other measuresto compensate the poor to some extent.
Differences – at times steep – exist between officialprice increases sanctioned by government policyor national average prices and what the pooractually incur. The reasons behind this are:1) Transport costs – Distance determines the
cost of transporting fuels, over and above the costs of the fuels themselves. Hence,communities in more distant locations may incur higher end-user prices.
2) Intermediary costs – Where people consume fuels indirectly, as with public transport services, additional costs may be hidden in transport tariffs. Such costs could be legitimate– for example, to cover higher wages of employees of transport service providers as a result of inflation – or opportunistic, when service providers piggyback higher profit margins over a government decision to increase fuel prices.
3) Scarcity costs – What are often called ‘black market prices’ are, in fact, prices loaded with a supply shortage premium, often due to unscrupulous practices like hoarding, divertingsubsidized fuels intended for the poor to the open market and so on. Or they may be those governed by market dynamics, such as meeting demand that exceeds rationed quotas or during a real supply crunch.
Bangladesh – Bangladesh’s capital city of Dhaka has ground to a halt, gripped by protests over high fuel prices. Police said thatsome 4,000 riot police were on standby. Shops, offices and schools remained shut, although government offices and state-runbanks opened as usual. Police sprayed water cannons from riot cars to disperse activists, and early reports said roads weremostly deserted.
The Government increased prices of oil products by almost 14 percent earlier this month. Many people are already strugglingto cope with higher bills for water, gas and electricity. The state Minister for Energy has blamed the increase in fuel prices onthe high cost of crude oil in the international market.
Arab News, 19 September 2005
Nepal – Shops are closed and vehicles are off the roads in Nepal's capital, Kathmandu, as angry protests against steep fuelprice rises continue for a second day. Protestors have been out in the streets, and the city is now littered with burning tyres androad barricades. On Saturday, protestors blocked all routes into and out of the city and attacked or burnt dozens of vehiclesand buildings, including petrol stations.
Price hikes of up to 35 percent were announced on Friday but the government Minister concerned has hinted that there maynow be some reductions. These are crippling price rises hitting one of Asia's poorest countries. The basic retail cost of petrolhas gone up by 25 percent at once, and by much more in some rural areas. The price of paraffin, the commonest cooking fuel,has risen by a similar amount, and that of diesel by 11 percent.
BBC News, 20 August 2006
Myanmar – In a major demonstration in recent times, over 500 people spearheaded by prominent pro-democracy activists onSunday took to the streets of Myanmar’s biggest city, Yangon, protesting against the recent unprecedented and massive hikein petroleum prices.
On August 14, the military rulers of Myanmar increased the price of compressed natural gas by 500 percent and petrol anddiesel by more than 100 percent, without any prior announcement. The fuel price hike triggered an increase in bus fares andsent prices of essential commodities soaring.
Mizzima News, 19 August 2007
Box 1-2 Public protests over fuel price increases
Table 1-1 Pass-through coefficients for gasoline and diesel in local currency (January 2004-April 2006)
Gasoline DieselChina 0.71 0.53India 1.25 0.66Indonesia 1.20 1.02Lao PDR 1.86 1.35
Source: ESMAP 2006a
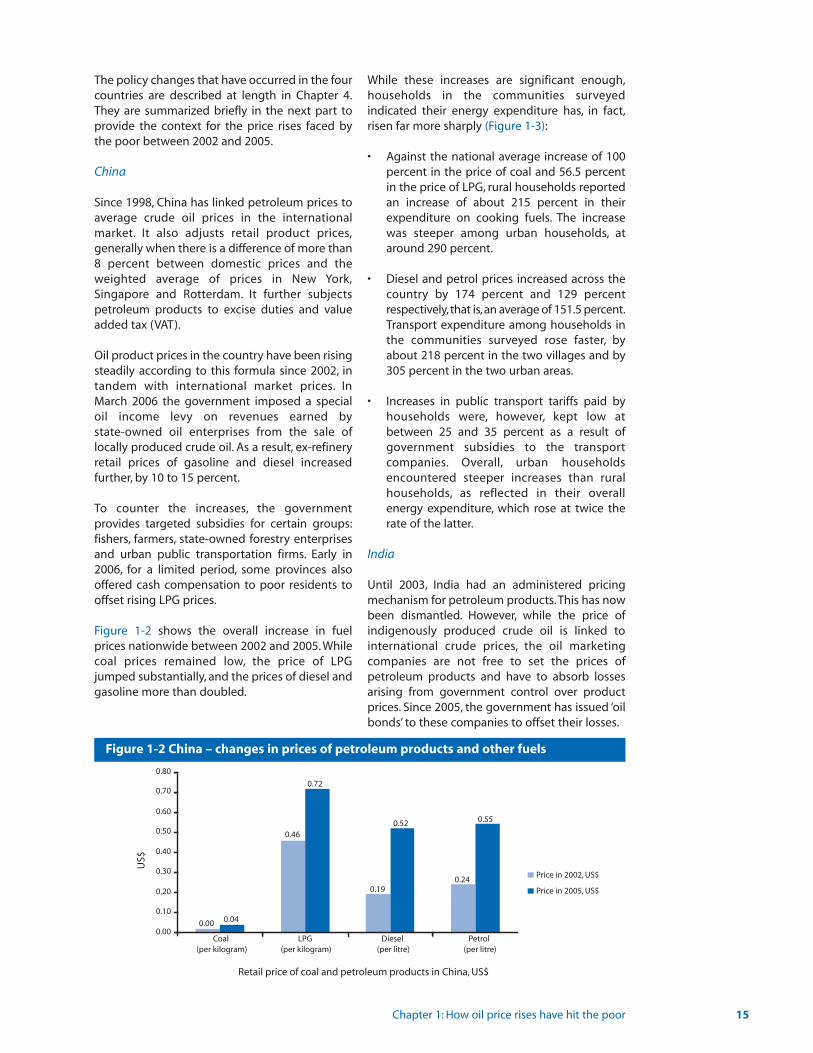
Chapter 1: How oil price rises have hit the poor 15
The policy changes that have occurred in the fourcountries are described at length in Chapter 4.They are summarized briefly in the next part toprovide the context for the price rises faced bythe poor between 2002 and 2005.
China
Since 1998, China has linked petroleum prices toaverage crude oil prices in the international market. It also adjusts retail product prices,generally when there is a difference of more than8 percent between domestic prices and theweighted average of prices in New York,Singapore and Rotterdam. It further subjectspetroleum products to excise duties and valueadded tax (VAT).
Oil product prices in the country have been risingsteadily according to this formula since 2002, intandem with international market prices. InMarch 2006 the government imposed a specialoil income levy on revenues earned by state-owned oil enterprises from the sale of locally produced crude oil. As a result, ex-refineryretail prices of gasoline and diesel increased further, by 10 to 15 percent.
To counter the increases, the government provides targeted subsidies for certain groups:fishers, farmers, state-owned forestry enterprisesand urban public transportation firms. Early in2006, for a limited period, some provinces alsooffered cash compensation to poor residents tooffset rising LPG prices.
Figure 1-2 shows the overall increase in fuelprices nationwide between 2002 and 2005. Whilecoal prices remained low, the price of LPGjumped substantially, and the prices of diesel andgasoline more than doubled.
While these increases are significant enough,households in the communities surveyedindicated their energy expenditure has, in fact,risen far more sharply (Figure 1-3):
• Against the national average increase of 100 percent in the price of coal and 56.5 percent in the price of LPG, rural households reported an increase of about 215 percent in their expenditure on cooking fuels. The increase was steeper among urban households, at around 290 percent.
• Diesel and petrol prices increased across the country by 174 percent and 129 percent respectively,that is,an average of 151.5 percent.Transport expenditure among households in the communities surveyed rose faster, by about 218 percent in the two villages and by 305 percent in the two urban areas.
• Increases in public transport tariffs paid byhouseholds were, however, kept low atbetween 25 and 35 percent as a result of government subsidies to the transport companies. Overall, urban households encountered steeper increases than ruralhouseholds, as reflected in their overall energy expenditure, which rose at twice therate of the latter.
India
Until 2003, India had an administered pricingmechanism for petroleum products.This has nowbeen dismantled. However, while the price ofindigenously produced crude oil is linked tointernational crude prices, the oil marketing companies are not free to set the prices of petroleum products and have to absorb lossesarising from government control over productprices. Since 2005, the government has issued ‘oilbonds’ to these companies to offset their losses.
Figure 1-2 China – changes in prices of petroleum products and other fuels
0.00
0.46
0.190.24
0.04
0.72
0.52 0.55
0.00
0.10
0.20
0.30
0.40
0.50
0.60
0.70
0.80
Coal (per kilogram)
LPG (per kilogram)
Diesel (per litre)
Petrol(per litre)
Retail price of coal and petroleum products in China, US$
US$
Price in 2002, US$
Price in 2005, US$

16 Overcoming Vulnerability to Rising Oil Prices: Options for Asia and the Pacific
In spite of the subsidies, India has South Asia’shighest retail prices for both petrol and diesel.This is due to high levels of taxes and duties –about 50 percent of the retail price consists ofbasic excise and customs duties – and the government applies additional duties to fundcertain activities, such as road construction.
To protect the most vulnerable consumers, thegovernment subsidizes the prices for householdconsumption of LPG and kerosene, on which ithas removed customs and excise duties since2004. Schemes also exist to improve electricityaccess to poor homes, such as the kutir jyoti or‘bright home’ programme, subsidise electricalpower for agriculture, and develop biogas plantsand improved stoves in rural areas.
The average retail price increases in the countryfrom 2002 to 2005 are shown in Figure 1-4 andthe increase in household energy expenditure isshown in Figure 1-5. Increases in the prices ofkerosene and LPG have been quite modest,
largely because of continuing subsidies. In practice,though, these fuels are not always available at the official prices, forcing many households tobuy on the black market.The increases have been larger for transportation fuels, in spite of the government’s attempt to keep prices down byobliging refining companies to bear the losses.
• Households in the communities surveyed reported an increase of about 20 percent in kerosene prices, half the increase in the national average. This reflects the government’s measure to remove customs and excise duties on domestic cooking fuels.
• Household expenditure on transport rose at a rate of 63 percent in rural communities surveyed and 60 percent in urban communities.This was somewhat lower than the average increases of 88.5 percent in the price of diesel and 61 percent in the price of petrol, mainly because of reduced consumption of these fuels.
0%
50%
100%
150%
200%
250%
300%
350%
Energy expenditure Household petroleum products
Transportation fuels Transportation tariffs or expenditure
Tanchang (Rural) Jiuyan (Rural) Beijing (Urban) Wuhan (Urban)
0.15
0.320.35
0.59
0.21
0.47
0.66
0.95
0
0.1
0.2
0.3
0.4
0.5
0.6
0.7
0.8
0.9
1
Kerosene (per litre) LPG (per kilogram) Diesel (per litre) Petrol (per litre)
Retail prices of petroleum products in India, US$
US$
Price in 2002, US$ Price in 2005, US$
Figure 1-3 China – energy expenditure changes experienced by poor communities
Figure 1-4 India – changes in prices of petroleum products
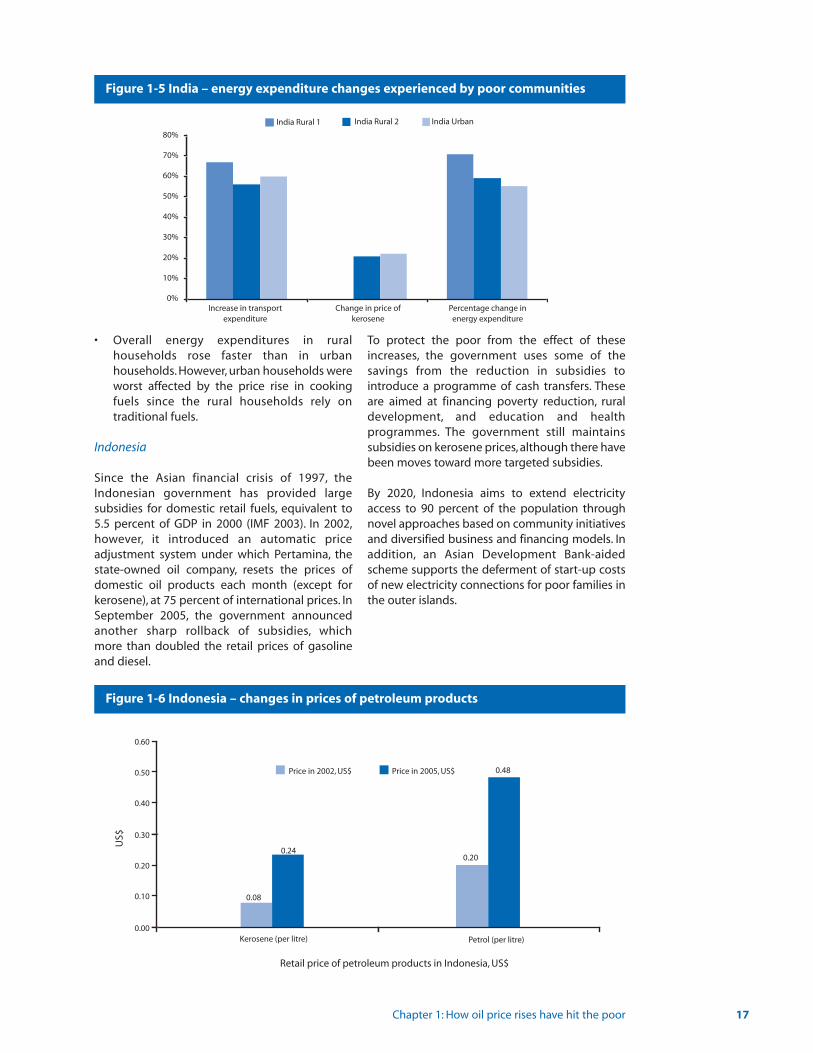
Chapter 1: How oil price rises have hit the poor 17
• Overall energy expenditures in rural households rose faster than in urban households. However, urban households were worst affected by the price rise in cooking fuels since the rural households rely on traditional fuels.
Indonesia
Since the Asian financial crisis of 1997, theIndonesian government has provided large subsidies for domestic retail fuels, equivalent to5.5 percent of GDP in 2000 (IMF 2003). In 2002,however, it introduced an automatic price adjustment system under which Pertamina, thestate-owned oil company, resets the prices ofdomestic oil products each month (except forkerosene), at 75 percent of international prices. InSeptember 2005, the government announcedanother sharp rollback of subsidies, which more than doubled the retail prices of gasoline and diesel.
To protect the poor from the effect of theseincreases, the government uses some of the savings from the reduction in subsidies to introduce a programme of cash transfers. Theseare aimed at financing poverty reduction, ruraldevelopment, and education and health programmes. The government still maintains subsidies on kerosene prices, although there havebeen moves toward more targeted subsidies.
By 2020, Indonesia aims to extend electricityaccess to 90 percent of the population throughnovel approaches based on community initiativesand diversified business and financing models. Inaddition, an Asian Development Bank-aidedscheme supports the deferment of start-up costsof new electricity connections for poor families inthe outer islands.
0.08
0.200.24
0.48
0.00
0.10
0.20
0.30
0.40
0.50
0.60
Kerosene (per litre) Petrol (per litre)
Retail price of petroleum products in Indonesia, US$
US$
Price in 2002, US$ Price in 2005, US$
0%
10%
20%
30%
40%
50%
60%
70%
80%
Increase in transportexpenditure
Change in price ofkerosene
Percentage change inenergy expenditure
India Rural 1 India Rural 2 India Urban
Figure 1-5 India – energy expenditure changes experienced by poor communities
Figure 1-6 Indonesia – changes in prices of petroleum products
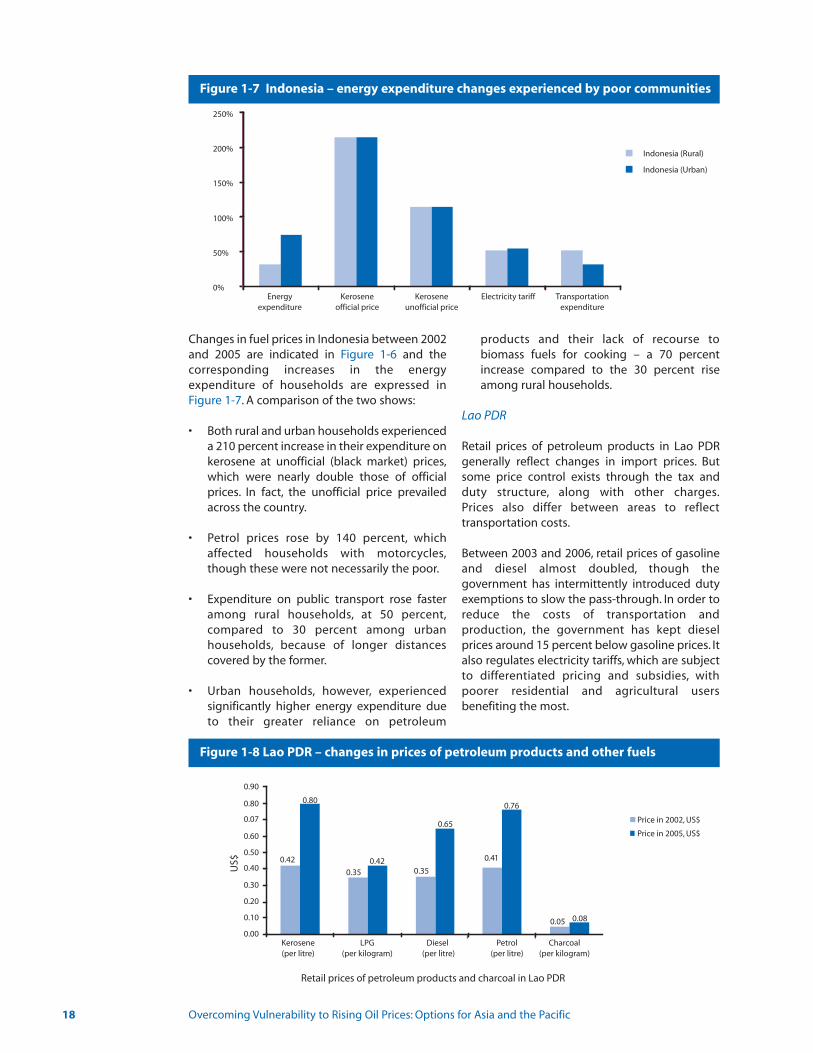
18 Overcoming Vulnerability to Rising Oil Prices: Options for Asia and the Pacific
Changes in fuel prices in Indonesia between 2002and 2005 are indicated in Figure 1-6 and the corresponding increases in the energy expenditure of households are expressed inFigure 1-7. A comparison of the two shows:
• Both rural and urban households experienced a 210 percent increase in their expenditure on kerosene at unofficial (black market) prices,which were nearly double those of official prices. In fact, the unofficial price prevailed across the country.
• Petrol prices rose by 140 percent, whichaffected households with motorcycles,though these were not necessarily the poor.
• Expenditure on public transport rose faster among rural households, at 50 percent,compared to 30 percent among urban households, because of longer distances covered by the former.
• Urban households, however, experienced significantly higher energy expenditure due to their greater reliance on petroleum
products and their lack of recourse to biomass fuels for cooking – a 70 percent increase compared to the 30 percent rise among rural households.
Lao PDR
Retail prices of petroleum products in Lao PDRgenerally reflect changes in import prices. Butsome price control exists through the tax andduty structure, along with other charges.Prices also differ between areas to reflect transportation costs.
Between 2003 and 2006, retail prices of gasolineand diesel almost doubled, though the government has intermittently introduced dutyexemptions to slow the pass-through. In order toreduce the costs of transportation and production, the government has kept dieselprices around 15 percent below gasoline prices. Italso regulates electricity tariffs, which are subjectto differentiated pricing and subsidies, with poorer residential and agricultural users benefiting the most.
0%
50%
100%
150%
200%
250%
Energyexpenditure
Keroseneofficial price
Keroseneunofficial price
Electricity tariff Transportationexpenditure
Indonesia (Rural)
Indonesia (Urban)
0.42
0.35 0.35
0.41
0.05
0.80
0.42
0.65
0.76
0.08
0.00
0.10
0.20
0.30
0.40
0.50
0.60
0.07
0.80
0.90
Kerosene(per litre)
LPG(per kilogram)
Diesel (per litre)
Charcoal(per kilogram)
Petrol(per litre)
Retail prices of petroleum products and charcoal in Lao PDR
US$
Price in 2002, US$
Price in 2005, US$
Figure 1-7 Indonesia – energy expenditure changes experienced by poor communities
Figure 1-8 Lao PDR – changes in prices of petroleum products and other fuels
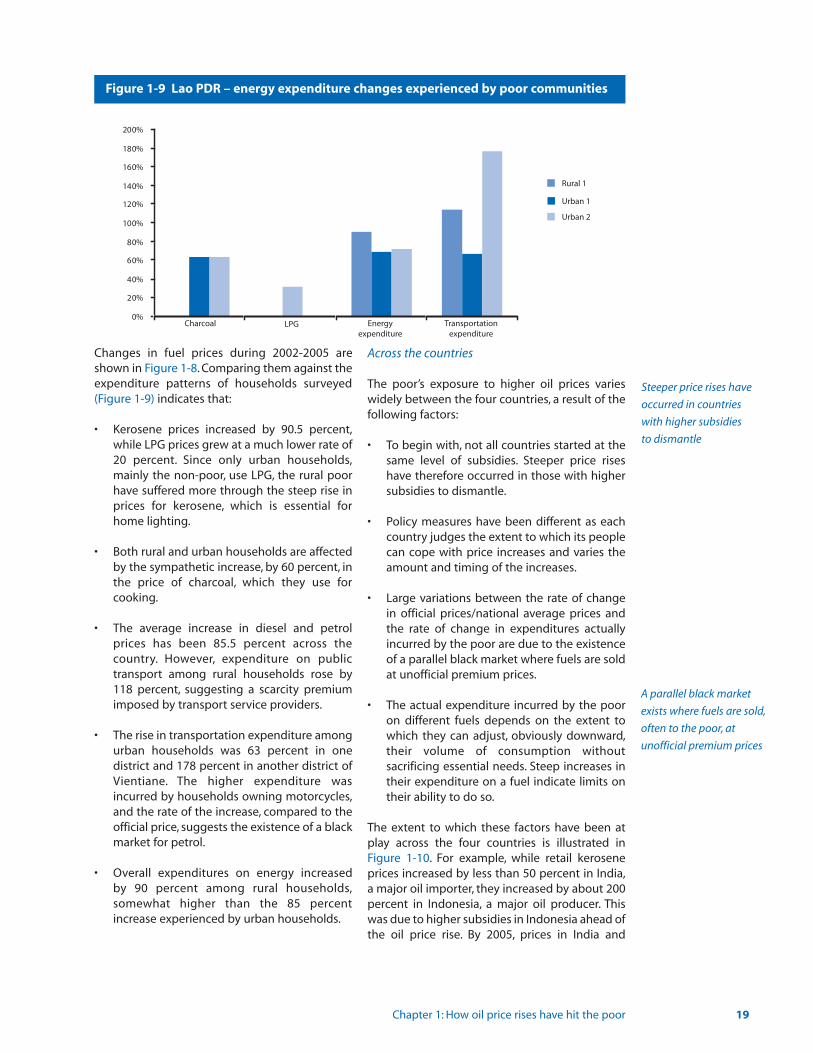
Chapter 1: How oil price rises have hit the poor 19
0%
20%
40%
60%
80%
100%
120%
140%
160%
180%
200%
Charcoal LPG Energyexpenditure
Transportationexpenditure
Rural 1
Urban 1
Urban 2
Changes in fuel prices during 2002-2005 areshown in Figure 1-8. Comparing them against theexpenditure patterns of households surveyed(Figure 1-9) indicates that:
• Kerosene prices increased by 90.5 percent,while LPG prices grew at a much lower rate of 20 percent. Since only urban households,mainly the non-poor, use LPG, the rural poor have suffered more through the steep rise in prices for kerosene, which is essential for home lighting.
• Both rural and urban households are affectedby the sympathetic increase, by 60 percent, in the price of charcoal, which they use for cooking.
• The average increase in diesel and petrol prices has been 85.5 percent across the country. However, expenditure on public transport among rural households rose by 118 percent, suggesting a scarcity premium imposed by transport service providers.
• The rise in transportation expenditure among urban households was 63 percent in one district and 178 percent in another district of Vientiane. The higher expenditure was incurred by households owning motorcycles,and the rate of the increase, compared to the official price, suggests the existence of a black market for petrol.
• Overall expenditures on energy increased by 90 percent among rural households,somewhat higher than the 85 percent increase experienced by urban households.
Across the countries
The poor’s exposure to higher oil prices varieswidely between the four countries, a result of thefollowing factors:
• To begin with, not all countries started at the same level of subsidies. Steeper price rises have therefore occurred in those with higher subsidies to dismantle.
• Policy measures have been different as each country judges the extent to which its people can cope with price increases and varies the amount and timing of the increases.
• Large variations between the rate of change in official prices/national average prices and the rate of change in expenditures actually incurred by the poor are due to the existence of a parallel black market where fuels are sold at unofficial premium prices.
• The actual expenditure incurred by the poor on different fuels depends on the extent to which they can adjust, obviously downward,their volume of consumption without sacrificing essential needs. Steep increases in their expenditure on a fuel indicate limits on their ability to do so.
The extent to which these factors have been atplay across the four countries is illustrated inFigure 1-10. For example, while retail keroseneprices increased by less than 50 percent in India,a major oil importer, they increased by about 200percent in Indonesia, a major oil producer. Thiswas due to higher subsidies in Indonesia ahead ofthe oil price rise. By 2005, prices in India and
Figure 1-9 Lao PDR – energy expenditure changes experienced by poor communities
Steeper price rises have
occurred in countries
with higher subsidies
to dismantle
A parallel black market
exists where fuels are sold,
often to the poor, at
unofficial premium prices
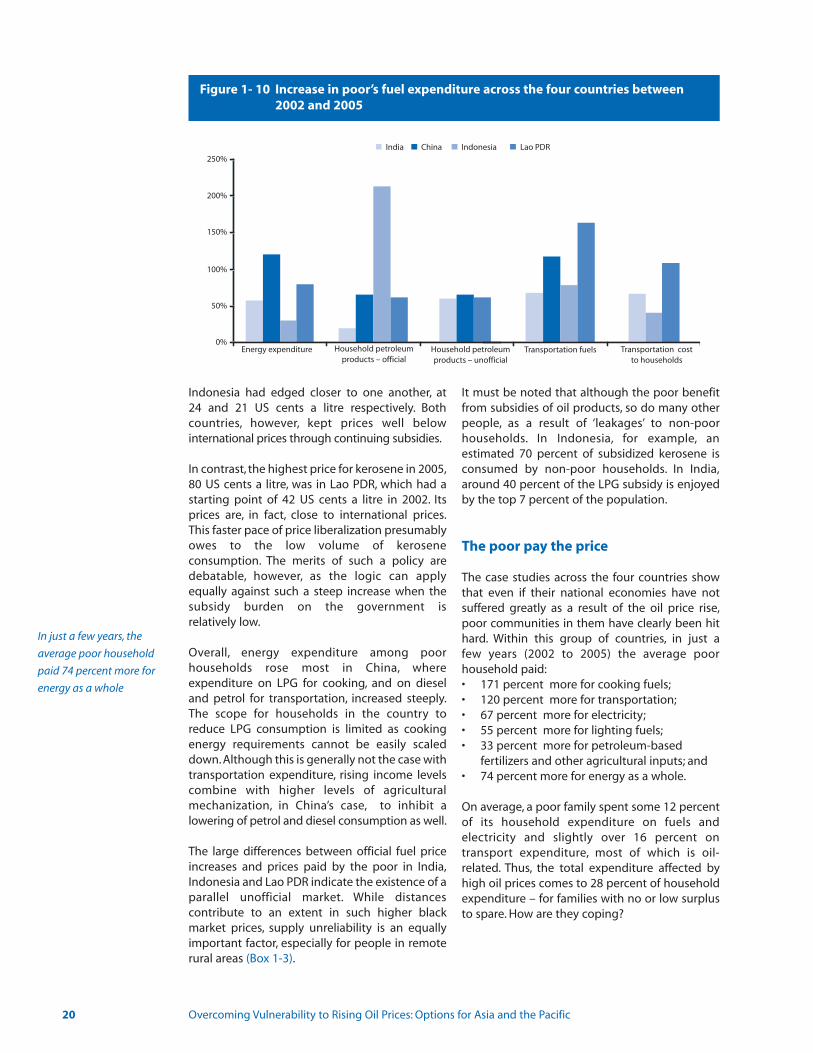
Indonesia had edged closer to one another, at 24 and 21 US cents a litre respectively. Both countries, however, kept prices well below international prices through continuing subsidies.
In contrast, the highest price for kerosene in 2005,80 US cents a litre, was in Lao PDR, which had astarting point of 42 US cents a litre in 2002. Itsprices are, in fact, close to international prices.This faster pace of price liberalization presumablyowes to the low volume of kerosene consumption. The merits of such a policy aredebatable, however, as the logic can apply equally against such a steep increase when thesubsidy burden on the government is relatively low.
Overall, energy expenditure among poor households rose most in China, where expenditure on LPG for cooking, and on dieseland petrol for transportation, increased steeply.The scope for households in the country toreduce LPG consumption is limited as cookingenergy requirements cannot be easily scaleddown. Although this is generally not the case withtransportation expenditure, rising income levelscombine with higher levels of agricultural mechanization, in China’s case, to inhibit a lowering of petrol and diesel consumption as well.
The large differences between official fuel priceincreases and prices paid by the poor in India,Indonesia and Lao PDR indicate the existence of aparallel unofficial market. While distances contribute to an extent in such higher black market prices, supply unreliability is an equallyimportant factor, especially for people in remoterural areas (Box 1-3).
It must be noted that although the poor benefitfrom subsidies of oil products, so do many otherpeople, as a result of ‘leakages’ to non-poorhouseholds. In Indonesia, for example, an estimated 70 percent of subsidized kerosene isconsumed by non-poor households. In India,around 40 percent of the LPG subsidy is enjoyedby the top 7 percent of the population.
The poor pay the price
The case studies across the four countries showthat even if their national economies have notsuffered greatly as a result of the oil price rise,poor communities in them have clearly been hithard. Within this group of countries, in just a few years (2002 to 2005) the average poor household paid:• 171 percent more for cooking fuels;• 120 percent more for transportation;• 67 percent more for electricity;• 55 percent more for lighting fuels;• 33 percent more for petroleum-based
fertilizers and other agricultural inputs; and• 74 percent more for energy as a whole.
On average, a poor family spent some 12 percentof its household expenditure on fuels and electricity and slightly over 16 percent ontransport expenditure, most of which is oil-related. Thus, the total expenditure affected byhigh oil prices comes to 28 percent of householdexpenditure – for families with no or low surplusto spare. How are they coping?
20 Overcoming Vulnerability to Rising Oil Prices: Options for Asia and the Pacific
0%
50%
100%
150%
200%
250%
Energy expenditure Household petroleumproducts – official
Household petroleumproducts – unofficial
Transportation fuels Transportation costto households
India China Indonesia Lao PDR
Figure 1- 10 Increase in poor’s fuel expenditure across the four countries between 2002 and 2005
In just a few years, the
average poor household
paid 74 percent more for
energy as a whole
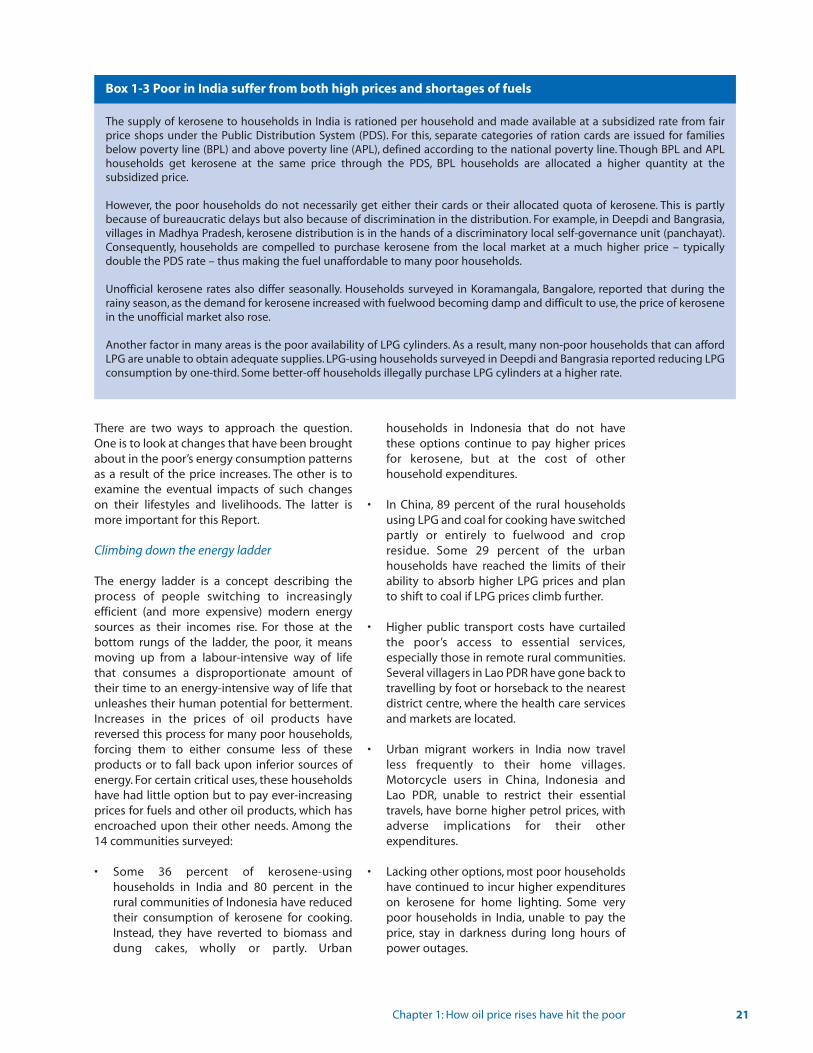
There are two ways to approach the question.One is to look at changes that have been broughtabout in the poor’s energy consumption patternsas a result of the price increases. The other is toexamine the eventual impacts of such changeson their lifestyles and livelihoods. The latter ismore important for this Report.
Climbing down the energy ladder
The energy ladder is a concept describing theprocess of people switching to increasingly efficient (and more expensive) modern energysources as their incomes rise. For those at the bottom rungs of the ladder, the poor, it meansmoving up from a labour-intensive way of lifethat consumes a disproportionate amount oftheir time to an energy-intensive way of life thatunleashes their human potential for betterment.Increases in the prices of oil products havereversed this process for many poor households,forcing them to either consume less of theseproducts or to fall back upon inferior sources ofenergy. For certain critical uses, these householdshave had little option but to pay ever-increasingprices for fuels and other oil products, which hasencroached upon their other needs. Among the14 communities surveyed:
• Some 36 percent of kerosene-using households in India and 80 percent in the rural communities of Indonesia have reduced their consumption of kerosene for cooking.Instead, they have reverted to biomass and dung cakes, wholly or partly. Urban
households in Indonesia that do not have these options continue to pay higher prices for kerosene, but at the cost of other household expenditures.
• In China, 89 percent of the rural households using LPG and coal for cooking have switched partly or entirely to fuelwood and crop residue. Some 29 percent of the urban households have reached the limits of their ability to absorb higher LPG prices and plan to shift to coal if LPG prices climb further.
• Higher public transport costs have curtailed the poor’s access to essential services,especially those in remote rural communities.Several villagers in Lao PDR have gone back to travelling by foot or horseback to the nearest district centre, where the health care services and markets are located.
• Urban migrant workers in India now travel less frequently to their home villages.Motorcycle users in China, Indonesia and Lao PDR, unable to restrict their essentialtravels, have borne higher petrol prices, with adverse implications for their other expenditures.
• Lacking other options, most poor households have continued to incur higher expenditures on kerosene for home lighting. Some very poor households in India, unable to pay the price, stay in darkness during long hours of power outages.
Chapter 1: How oil price rises have hit the poor 21
The supply of kerosene to households in India is rationed per household and made available at a subsidized rate from fairprice shops under the Public Distribution System (PDS). For this, separate categories of ration cards are issued for familiesbelow poverty line (BPL) and above poverty line (APL), defined according to the national poverty line. Though BPL and APLhouseholds get kerosene at the same price through the PDS, BPL households are allocated a higher quantity at the subsidized price.
However, the poor households do not necessarily get either their cards or their allocated quota of kerosene. This is partlybecause of bureaucratic delays but also because of discrimination in the distribution. For example, in Deepdi and Bangrasia,villages in Madhya Pradesh, kerosene distribution is in the hands of a discriminatory local self-governance unit (panchayat).Consequently, households are compelled to purchase kerosene from the local market at a much higher price – typically double the PDS rate – thus making the fuel unaffordable to many poor households.
Unofficial kerosene rates also differ seasonally. Households surveyed in Koramangala, Bangalore, reported that during therainy season, as the demand for kerosene increased with fuelwood becoming damp and difficult to use, the price of kerosenein the unofficial market also rose.
Another factor in many areas is the poor availability of LPG cylinders. As a result, many non-poor households that can affordLPG are unable to obtain adequate supplies. LPG-using households surveyed in Deepdi and Bangrasia reported reducing LPGconsumption by one-third. Some better-off households illegally purchase LPG cylinders at a higher rate.
Box 1-3 Poor in India suffer from both high prices and shortages of fuels
• Farming households have had to absorb higher costs of fertilizers and fuel to operate agricultural machinery, on which their livelihoods depend. Large increases in fuel costs have hit them harder.
On the whole, rising oil prices have left the poorwith few choices other than to cut back on theirconsumption of oil products or, for uses that cannot be avoided, to bear the higher prices andlook elsewhere in their household budgets tofind the additional money. Since the urban poorrely more on oil products like kerosene and LPG,they are worse off than their rural counterparts,who are either biomass users or have the biomassoption to fall back upon. The rural poor, however,are more vulnerable to higher lighting fuel prices,especially in unelectrified villages but also in electrified villages subject to frequent supply disruptions. They also are at a greater disadvantage when it comes to transport fuelcosts, because inability to pay means forgoingessential services not available in the villages.
Impact on lifestyles and livelihoods
Across all countries, wherever families haveswitched to biomass fuels, the worst-affectedhave been women and children, who not onlysuffer from increased pollution at home but alsohave to spend more time and effort gatheringfuels. This has been a particularly critical phenomenon in China and India, where such aswitch has occurred in large numbers.
As a result of rising transport costs, 64 percent ofthe surveyed rural households in Lao PDR reported scaling down their expenditures on children’s education, and 35 percent said they areable to spend less on items other than the mostessential like food, clothing and health care. InIndia, rising transport costs have compelled anumber of households in both rural and urbancontexts to move their children to schools closerto their homes from better ones farther away.The quality of children’s education has suffered asa result.
Rising household expenditures due in part tohigher energy costs have obliged women to takeon extra work. Among urban households surveyed in India, many women have startedworking, mostly as domestic help in other houses,in order to supplement family incomes. They alsoreported rising domestic tensions due to heightened financial pressure. The majority offamilies interviewed are contemplating loans
from moneylenders, self-help groups, banks andfamily members to cope.
The foregoing impacts do not surprise. Whatshould surprise is that they have not been morewidespread than reported so far, consideringhow steep the rise has been in their essentialexpenditures on oil products.
A good part of the reason behind this is thatmany of the households covered by the casestudies are in the ‘near-poor’ category, meaningthey had some financial cushion to absorb theadditional expenses. However, it would be a mistake to presume this can last long if oil pricescontinue on their present trajectory.
Implications for the MDGs
The linkages between high oil prices and theMDGs are complex and not easily quantifiable.However, based on the pathways shown in Figure1-11, a number of commonsense conclusions canbe drawn.
MDG 1: Eradicate extreme poverty and hunger
Higher retail prices of fuels and petroleum products like fertilizers can have economy-wideinflationary and/or recessionary impacts, leadingto higher unemployment. At local levels, drasticreductions in or the complete removal of fuelsubsidies will result in high prices for agriculturalinputs, transport services to workplaces and markets, lower incomes and the elimination ofsavings. These can slow the rate of poverty reduction. To an extent, this can be mitigatedthrough new employment opportunities emerging from the introduction of renewableenergy supplies to remote rural areas and commercial cultivation for biofuel production.The latter can, however, have negative implications for food security and may worsenproblems of malnutrition and hunger.
MDG 2: Achieve universal primary education
Education costs will rise if the rate of inflationclimbs due to higher oil import bills and spillovereffects across the economy. Schools will have topay more for their infrastructure and teachingstaff.The choices for poor children to attend goodeducation facilities will be reduced, potentiallyrelegating them to cheaper, qualitatively inferiorschools. Rising transport costs can play a role inthis for children in rural communities having totravel to schools located in urban centres.
22 Overcoming Vulnerability to Rising Oil Prices: Options for Asia and the Pacific
Rising oil prices have made
some poor people go back
to using biomass fuels,
deepening energy poverty
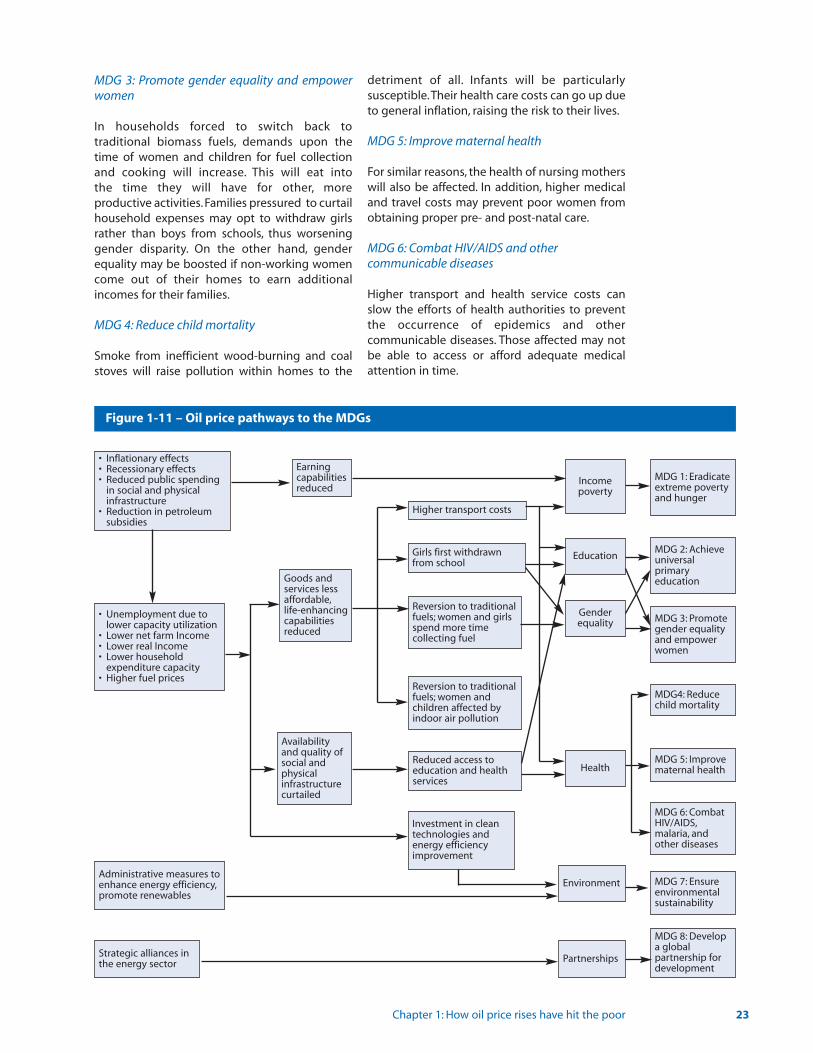
MDG 3: Promote gender equality and empowerwomen
In households forced to switch back to traditional biomass fuels, demands upon the time of women and children for fuel collectionand cooking will increase. This will eat into the time they will have for other, more productive activities.Families pressured to curtail household expenses may opt to withdraw girlsrather than boys from schools, thus worseninggender disparity. On the other hand, genderequality may be boosted if non-working womencome out of their homes to earn additionalincomes for their families.
MDG 4: Reduce child mortality
Smoke from inefficient wood-burning and coalstoves will raise pollution within homes to the
detriment of all. Infants will be particularly susceptible.Their health care costs can go up dueto general inflation, raising the risk to their lives.
MDG 5: Improve maternal health
For similar reasons, the health of nursing motherswill also be affected. In addition, higher medicaland travel costs may prevent poor women fromobtaining proper pre- and post-natal care.
MDG 6: Combat HIV/AIDS and other communicable diseases
Higher transport and health service costs canslow the efforts of health authorities to preventthe occurrence of epidemics and other communicable diseases. Those affected may notbe able to access or afford adequate medicalattention in time.
Chapter 1: How oil price rises have hit the poor 23
Figure 1-11 – Oil price pathways to the MDGs
• Inflationary effects• Recessionary effects• Reduced public spending
in social and physical infrastructure
• Reduction in petroleum subsidies
• Unemployment due to lower capacity utilization
• Lower net farm Income• Lower real Income • Lower household
expenditure capacity • Higher fuel prices
Administrative measures toenhance energy efficiency,promote renewables
Strategic alliances in the energy sector
Earning capabilitiesreduced
Incomepoverty
Education
Genderequality
Health
Environment
Partnerships
Higher transport costs
Girls first withdrawnfrom school
Goods andservices lessaffordable,life-enhancingcapabilitiesreduced
Reversion to traditionalfuels; women and girlsspend more time collecting fuel
MDG 1: Eradicateextreme povertyand hunger
MDG 2: Achieveuniversal primary education
MDG 3: Promotegender equalityand empowerwomen
MDG4: Reducechild mortality
MDG 5: Improvematernal health
MDG 6: CombatHIV/AIDS,malaria, andother diseases
MDG 7: Ensureenvironmentalsustainability
MDG 8: Developa global partnership fordevelopment
Reversion to traditionalfuels; women and children affected byindoor air pollution
Reduced access to education and healthservices
Investment in cleantechnologies and energy efficiencyimprovement
Availabilityand quality ofsocial andphysical infrastructurecurtailed
MDG 7: Ensure environmental sustainability
As is already happening, investment in renewableenergy technologies and energy efficiencyimprovement will increase significantly in orderto reduce the oil dependence of countries. Thiswill carry a range of environmental benefits to all,including the poor, via decentralized rural electricsupply and the use of clean technologies.
MDG 8: Develop a global partnership for development
New opportunities for international cooperationwill emerge as markets for renewable energy andefficient energy equipment expand at an accelerated pace. These can add significantly toexisting opportunities for partnership underglobal environmental treaties and agreements.
Energy security and human security:two sides of the same coin
While their implications for the MDGs are largelynegative, high oil prices carry some potentialbenefits, as noted above. In the short to mediumterm, however, it is the negative implications thatare more likely to materialize. The impacts experienced by poor households indicate that itis not only their present lifestyles that are beingundermined, but their future prospects as well.Reduced ability to provide a decent education totheir children, loss of productivity due to anunhealthy home environment, and missedopportunities to earn additional income becauseof dwindling mobility are all evident in the scattered warning signals appearing now amongthose living below the poverty line. If or whenthey catch up with those perched precariouslyjust above the line, such impacts can multiplyrapidly across whole societies, to devastatingeffects.
The oil price rise has heightened internationalconcern over energy security, a concept associated mostly with the supply security ofnations. This has led to a frenzy of actions tosecure new oil supply sources, look for newreserves, expand and protect supply routes andpipelines, and enhance cooperation in sharingnew technologies and knowledge.The findings ofthis chapter draw attention to the other face ofthe concept, which has to do with the security ofpeople within a country, especially the poor.
Although the poor are insignificant consumers ofoil in the totality of a country’s oil dependence,there are millions of them.The uses to which theyput oil are not just critical to their survival;they are the passage to the poor’s social and economic integration with the rest of the population. Countries that have eliminatedpoverty or reduced it drastically are now benefiting in numerous ways from the enormousboost to their economic capacity by the induction of the erstwhile poor into the mainstream. High oil prices thus not only denythe poor the opportunity they deserve to escapepoverty, but they also rob countries of the addedstrength that an enlarged, skilled labour force will bring.
As noted at the outset and elaborated in the nextchapter, the macroeconomic impacts of the oilprice rise have been subdued in most countries ofthe Asia-Pacific region for a variety of reasons.However, this can result in complacency thatoverlooks the tragedy in the making among thepoor. While high oil prices raise questions fornational energy security, the ultimate objectivemust always be human security.
24 Overcoming Vulnerability to Rising Oil Prices: Options for Asia and the Pacific
The impacts experienced
by poor households
indicate that it is not only
their present lifestyles that
are being undermined, but
their future prospects
as well
Endnotes1 http://www.oil-price.net/ on 12 September 2007.
2 The main factors that determined the selection of communities in each country were two-fold: (a) the presence of a significant number
of poor households and (b) their use of oil products like kerosene, diesel and LPG. National poverty lines at around US$1.5/day were
used to determine the former in all countries except Lao PDR, where the international poverty line of US$1 a day was applied.
3 The importance of including them is underlined by the example of Indonesia, where only 7.5 percent of the population lives below
US$1 a day but as many as 42 percent are between US$1 and US$2 a day, with an extremely high number near the national poverty line of
US$1.5 a day (World Bank 2007a).
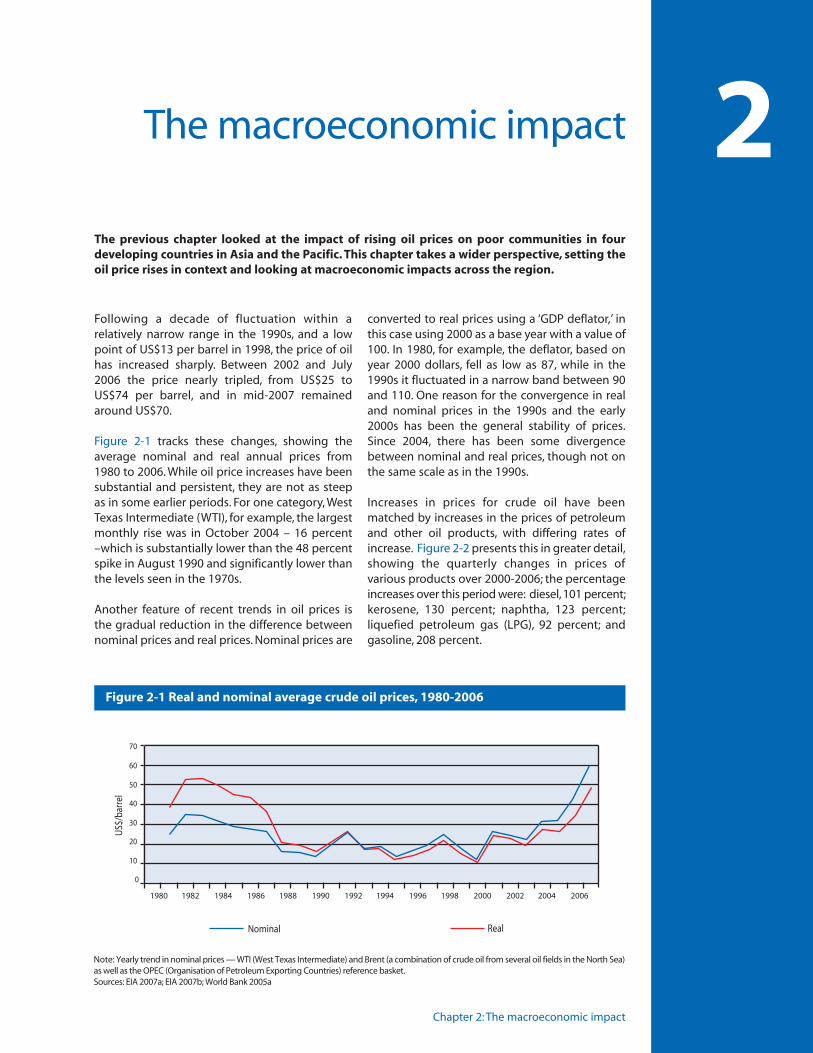
Chapter 2: The macroeconomic impact
2
Following a decade of fluctuation within a relatively narrow range in the 1990s, and a lowpoint of US$13 per barrel in 1998, the price of oilhas increased sharply. Between 2002 and July2006 the price nearly tripled, from US$25 to US$74 per barrel, and in mid-2007 remainedaround US$70.
Figure 2-1 tracks these changes, showing theaverage nominal and real annual prices from1980 to 2006. While oil price increases have beensubstantial and persistent, they are not as steepas in some earlier periods. For one category, WestTexas Intermediate (WTI), for example, the largestmonthly rise was in October 2004 – 16 percent–which is substantially lower than the 48 percentspike in August 1990 and significantly lower thanthe levels seen in the 1970s.
Another feature of recent trends in oil prices isthe gradual reduction in the difference betweennominal prices and real prices. Nominal prices are
converted to real prices using a ‘GDP deflator,’ inthis case using 2000 as a base year with a value of 100. In 1980, for example, the deflator, based onyear 2000 dollars, fell as low as 87, while in the1990s it fluctuated in a narrow band between 90and 110. One reason for the convergence in realand nominal prices in the 1990s and the early2000s has been the general stability of prices.Since 2004, there has been some divergencebetween nominal and real prices, though not onthe same scale as in the 1990s.
Increases in prices for crude oil have beenmatched by increases in the prices of petroleumand other oil products, with differing rates ofincrease. Figure 2-2 presents this in greater detail,showing the quarterly changes in prices of various products over 2000-2006; the percentageincreases over this period were: diesel,101 percent;kerosene, 130 percent; naphtha, 123 percent;liquefied petroleum gas (LPG), 92 percent; andgasoline, 208 percent.
The macroeconomic impact
The previous chapter looked at the impact of rising oil prices on poor communities in fourdeveloping countries in Asia and the Pacific. This chapter takes a wider perspective, setting theoil price rises in context and looking at macroeconomic impacts across the region.
0
10
20
30
40
50
60
70
1980 1982 1984 1986 1988 1990 1992 1994 1996 1998 2000 2002 2004 2006
US$
/bar
rel
Nominal Real
Figure 2-1 Real and nominal average crude oil prices, 1980-2006
Note: Yearly trend in nominal prices — WTI (West Texas Intermediate) and Brent (a combination of crude oil from several oil fields in the North Sea)as well as the OPEC (Organisation of Petroleum Exporting Countries) reference basket. Sources: EIA 2007a; EIA 2007b; World Bank 2005a
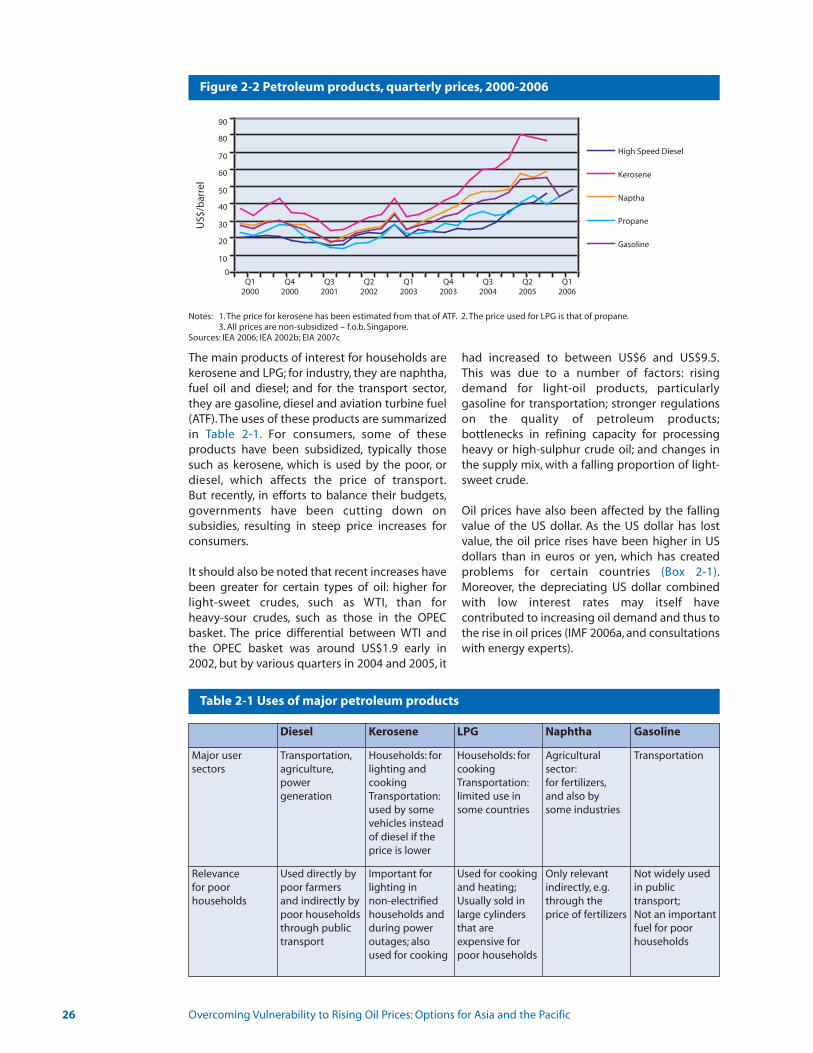
The main products of interest for households arekerosene and LPG; for industry, they are naphtha,fuel oil and diesel; and for the transport sector,they are gasoline, diesel and aviation turbine fuel(ATF).The uses of these products are summarizedin Table 2-1. For consumers, some of these products have been subsidized, typically thosesuch as kerosene, which is used by the poor, ordiesel, which affects the price of transport.But recently, in efforts to balance their budgets,governments have been cutting down on subsidies, resulting in steep price increases forconsumers.
It should also be noted that recent increases havebeen greater for certain types of oil: higher forlight-sweet crudes, such as WTI, than for heavy-sour crudes, such as those in the OPEC basket. The price differential between WTI andthe OPEC basket was around US$1.9 early in2002, but by various quarters in 2004 and 2005, it
had increased to between US$6 and US$9.5.This was due to a number of factors: risingdemand for light-oil products, particularly gasoline for transportation; stronger regulationson the quality of petroleum products;bottlenecks in refining capacity for processingheavy or high-sulphur crude oil; and changes inthe supply mix, with a falling proportion of light-sweet crude.
Oil prices have also been affected by the fallingvalue of the US dollar. As the US dollar has lostvalue, the oil price rises have been higher in USdollars than in euros or yen, which has createdproblems for certain countries (Box 2-1).Moreover, the depreciating US dollar combinedwith low interest rates may itself have contributed to increasing oil demand and thus tothe rise in oil prices (IMF 2006a, and consultationswith energy experts).
26 Overcoming Vulnerability to Rising Oil Prices: Options for Asia and the Pacific
10
20
30
40
50
60
70
80
90
Q12000
Q42000
Q32001
Q22002
Q12003
Q42003
Q32004
Q22005
Q12006
US$
/bar
rel
High Speed Diesel
Kerosene
Naptha
Propane
Gasoline
0
Figure 2-2 Petroleum products, quarterly prices, 2000-2006
Table 2-1 Uses of major petroleum products
Notes: 1. The price for kerosene has been estimated from that of ATF. 2. The price used for LPG is that of propane.3. All prices are non-subsidized – f.o.b. Singapore.
Sources: IEA 2006; IEA 2002b; EIA 2007c
Diesel Kerosene LPG Naphtha Gasoline
Major user sectors
Transportation,agriculture,power generation
Households: forlighting andcookingTransportation:used by somevehicles insteadof diesel if theprice is lower
Households: forcookingTransportation:limited use insome countries
Agricultural sector:for fertilizers,and also by some industries
Transportation
Relevance for poor households
Used directly bypoor farmersand indirectly bypoor householdsthrough publictransport
Important forlighting in non-electrifiedhouseholds andduring poweroutages; alsoused for cooking
Used for cookingand heating;Usually sold inlarge cylindersthat are expensive forpoor households
Only relevantindirectly, e.g.through theprice of fertilizers
Not widely usedin public transport;Not an importantfuel for poorhouseholds
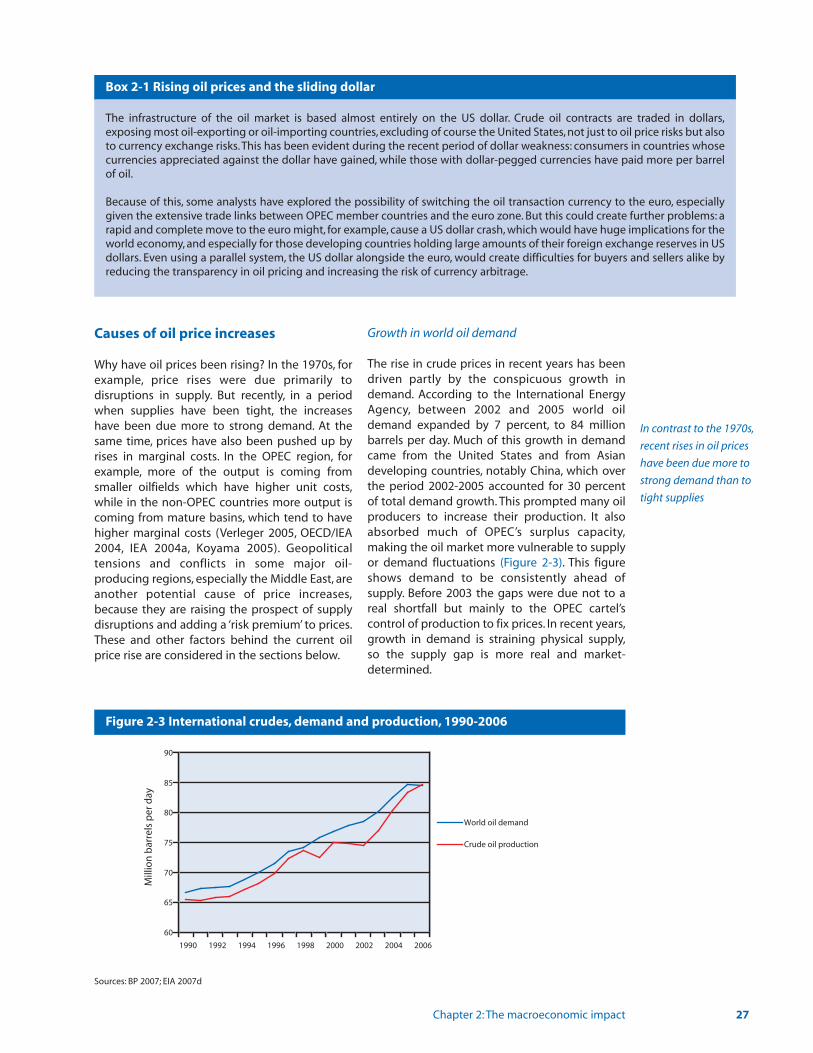
Causes of oil price increases
Why have oil prices been rising? In the 1970s, forexample, price rises were due primarily to disruptions in supply. But recently, in a periodwhen supplies have been tight, the increaseshave been due more to strong demand. At thesame time, prices have also been pushed up byrises in marginal costs. In the OPEC region, forexample, more of the output is coming fromsmaller oilfields which have higher unit costs,while in the non-OPEC countries more output iscoming from mature basins, which tend to havehigher marginal costs (Verleger 2005, OECD/IEA2004, IEA 2004a, Koyama 2005). Geopolitical tensions and conflicts in some major oil-producing regions, especially the Middle East, areanother potential cause of price increases,because they are raising the prospect of supplydisruptions and adding a ‘risk premium’ to prices.These and other factors behind the current oilprice rise are considered in the sections below.
Growth in world oil demand
The rise in crude prices in recent years has beendriven partly by the conspicuous growth indemand. According to the International EnergyAgency, between 2002 and 2005 world oildemand expanded by 7 percent, to 84 millionbarrels per day. Much of this growth in demandcame from the United States and from Asiandeveloping countries, notably China, which overthe period 2002-2005 accounted for 30 percentof total demand growth. This prompted many oilproducers to increase their production. It alsoabsorbed much of OPEC’s surplus capacity,making the oil market more vulnerable to supplyor demand fluctuations (Figure 2-3). This figureshows demand to be consistently ahead of supply. Before 2003 the gaps were due not to areal shortfall but mainly to the OPEC cartel’scontrol of production to fix prices. In recent years,growth in demand is straining physical supply,so the supply gap is more real and market-determined.
Chapter 2: The macroeconomic impact 27
60
65
70
75
80
85
90
1990 1992 1994 1996 1998 2000 2002 2004 2006
Mill
ion
bar
rels
per
day
World oil demand
Crude oil production
Figure 2-3 International crudes, demand and production, 1990-2006
Box 2-1 Rising oil prices and the sliding dollar
The infrastructure of the oil market is based almost entirely on the US dollar. Crude oil contracts are traded in dollars,exposing most oil-exporting or oil-importing countries, excluding of course the United States, not just to oil price risks but alsoto currency exchange risks.This has been evident during the recent period of dollar weakness: consumers in countries whosecurrencies appreciated against the dollar have gained, while those with dollar-pegged currencies have paid more per barrelof oil.
Because of this, some analysts have explored the possibility of switching the oil transaction currency to the euro, especiallygiven the extensive trade links between OPEC member countries and the euro zone. But this could create further problems: arapid and complete move to the euro might, for example, cause a US dollar crash, which would have huge implications for theworld economy, and especially for those developing countries holding large amounts of their foreign exchange reserves in USdollars. Even using a parallel system, the US dollar alongside the euro, would create difficulties for buyers and sellers alike byreducing the transparency in oil pricing and increasing the risk of currency arbitrage.
Sources: BP 2007; EIA 2007d
In contrast to the 1970s,
recent rises in oil prices
have been due more to
strong demand than to
tight supplies

An important feature of this rising demand is thatmuch of it has been for gasoline and diesel. TheUnited States continues to be a major user ofgasoline for cars, but developing countries likeBrazil, China and India are also consuming moregasoline for personal transportation. Europeancountries, on the other hand, have been switching more to diesel for cars (Figure 2-4).Asian developing countries are also using morediesel, though in this case it is used to fuel themany backup generators, as well as to replacecoal in large-scale electricity generating plants inefforts (ICF 2005).
Shrinking buffers
In the past, fluctuations in supply and demandhave been dampened by three main buffers:surplus production capacity among OPEC members, large oil inventories and surplus refining capacity in consuming countries. Allthree buffers have, however, been shrinking.As a result, the world oil market has become morevulnerable to price volatility and supply disruptions.
In the past, much of the surplus productioncapacity was provided by OPEC. This has nowdecreased: between 2000 and 2004, it fell fromaround 7.0 to 0.6 million barrels per day.Subsequently it rose, reaching 2.2 million barrelsper day by May 2005, but is still relatively small.Moreover, this surplus comes from just a fewcountries, notably Saudi Arabia and Iraq, so anyproblems with their exports will have majorrepercussions for the world oil market.
A further cause of tightening oil markets isshrinking oil inventories. To rationalize their production and cut costs, oil companies,particularly in the United States, have been holding lower stocks of both oil and gasoline.Refineries too are working with less slack. Despiterising demand, the oil companies have not beenbuilding many new refineries, preferring insteadto reduce their surplus refining capacity.
The combination of tighter supplies and changing demand – or speculation about suchchanges – has made prices much more volatileand increased vulnerability to disruptions in supply, particularly in oil-importing developingcountries.
Oil supply insecurity
Oil prices have also been affected by securityissues, linked primarily to the unstable situationin the Middle East. In May 2004, for example, oilfacilities in Saudi Arabia, the world’s largest oilproducer, suffered two attacks. These did notreduce Saudi production, but they did have a psychological impact, raising doubts about thecountry’s security and causing price hikes in themarket for crude-oil futures.
Added to this is the uncertainty created by thesituation in Iraq. Around the time of the Iraq War,oil production fluctuated wildly before returningin March 2004 to the pre-war level of 2.4 millionbarrels per day. Since then, deteriorating publicsecurity and attacks by insurgents on oil facilitieshave again undermined production, which hasbeen as low as 1.8 million barrels per day.
28 Overcoming Vulnerability to Rising Oil Prices: Options for Asia and the Pacific
Product consumption by regionMillion barrels daily
Light distillates Middle distillates
Asia PacificAfricaMiddle EastFormer Soviet UnionEuropeS. & Cent. AmericaNorth America
35
30
25
20
15
10
5
35
30
25
20
15
10
5
96 97 98 99 00 01 02 03 04 05 06 0 96 97 98 99 00 01 02 03 04 05 06 0
Figure 2-4 Demand for light and middle distillates, 1996-2006
Source: BP 2007
Surplus production
capacity, oil inventories
and surplus refining
capacity have all been
shrinking, making the
world market much more
volatile
Oil supply problems also have occurred in otherparts of the world. In 2004, legal problems withthe government led to the collapse of Russia’slargest oil company,Yukos; in Mexico, devastatinghurricanes hit the oil-producing Mexican Gulfcoast; and in Nigeria, intermittent militant attackson facilities have made it more difficult to maintain supplies. The situation is further aggravated by the possibility of structuralchanges in countries like Bolivia and Venezuela,which are nationalizing their oil and gas industries. Furthermore, in some parts of theworld, notably Mexico and OECD Europe,production prospects are deteriorating becauseof low levels of investment in exploration.
All these factors are heightening oil supply insecurity. They have also raised questions as towhether world oil production has already peaked(Box 2-2).
Speculation in the world oil market
Oil supply-demand imbalances and uncertaintieshave been exacerbated by a massive influx ofspeculative money into the market for crude oilfutures. Speculators, reacting to vulnerabilities insupply, fluctuations in demand and externalshocks, have expanded their trading, often basingtheir judgments on media reports. In so doing,they have heightened the price volatility.
Speculative activity can push oil prices higher,since this unstable situation adds a larger ‘risk premium.’ Over the short term, futures pricesthus may be subject to excessive hikes that bearno direct relation to current supply or demandfundamentals. However, these prices can themselves trigger further changes in supply ordemand, leading to another round of wildfluctuations.
The oil price hikes also incorporate an element of‘geopolitical risk premium.’ Buyers who fear theprospect of damage to oil facilities in the MiddleEast are prepared to pay more to secure supplies (OECD/IEA 2004). This is thought to becontributing to between 20 and 25 percent of the current oil price.
Underinvestment in exploration and refining
Prices have also been higher because of underinvestment. The key players in the globalenergy industry, OPEC national companies andthe large multinational companies, failed to anticipate the growth in demand and did not sufficiently expand their output. Indeed, at theend of the 20th Century, following the collapse ofthe price, they had often reduced or evenstopped investment and then did not subsequently step up production as prices rose.
Some people argue that the recent price rises,particularly for sweet-light crudes such as WTI,have actually served a useful purpose in stimulating investment across the oil supplychain. This is also often seen as a ‘justification’ forthe oil price rise.
However, underinvestment in the oil sector maynot be simply an inadequate response to risingdemand but also may reflect a general situationof uncertainty and price volatility, leading to avicious circle whereby the lack of investmentcould once again propel prices upward.
Added to underinvestment in exploration is inadequate investment in refining capacity,particularly for the lighter products that have tobe processed out of heavy-sour crudes, mainlygasoline, diesel and ATF.
Chapter 2: The macroeconomic impact 29
Box 2-2 Has world oil production peaked?
Recent oil price rises have again triggered discussions about natural limits to oil production – ‘peak oil’ – and revived the‘Hubbert’s Peak’ theory, which concerns the long-term rate of extraction and depletion of conventional oil and other fossilfuels. In 1956, geophysicist M. King Hubbert created a model of known reserves and proposed that oil production in the continental United States would peak between 1965 and 1970, and that world production would peak in 2000. He was moreor less right about the US, where oil production peaked in 1971. He was wrong about global production, although supportersof his theory suggest that the global peak has merely been delayed by the 1973 and 1979 OPEC oil shocks, which effectivelyreduced global demand.
The oil price rise in late 2002 focused greater attention on Hubbert’s theory and its potential implications, including discussions about whether the peak has in fact been reached. Some, like the Association for the Study of Peak Oil and Gas,assert that the peak was reached in 2004/2005. Others, such as the International Energy Agency (IEA), feel that oil productionwill peak only in 2039, pointing, for example, to limited exploration in the Middle East and Russia; large reserves in countrieswhose governments prefer not to explore; untapped frontiers in deepwater and polar regions; the potential for developmentof new and unconventional oil and gas products; and continued underinvestment in exploration and production.
Key players in the global
energy industry have not
sufficiently expanded
output, resulting in
underinvestment in
exploration and refining

The macroeconomic impact
What have been the macroeconomic consequences of these steep rises in oil prices?The following paragraphs assess the effects,globally, regionally and subregionally, on GDPgrowth and inflation, as well as on foreignexchange reserves and current account balances.They also look at changes in the consumption ofother forms of energy.
GDP growth, inflation and oil intensity of GDP
One of the greatest worries about a steep rise inthe price of oil is that it will stifle economicgrowth. The simplest way of assessing this is tocompare rates of GDP growth with changes in theaverage price of oil. As Figure 2-5 indicates,though oil-price rise does not appear to have
affected growth significantly till 2004, either atthe global level or within the Asian developingcountries, it appears the impact is being felt post-2005. Over the period 1999-2004, the crude pricemore than trebled, but real GDP continued togrow, both for the world as a whole and for developing Asia. The steep increase in oil pricessince 2005, it appears, has caused a slightdecrease in the GDP growth rate both at theglobal as well as regional level. This decliningtrend is more pronounced in the case of Asiandeveloping countries. Though it needs to be verified with more recent data, the trend showsthat the global economy is feeling the heat of oilprice rise.
The increase in the prices of petroleum productscould also have stoked inflation. But again, at theglobal level this does not appear to have happened; indeed, inflation declined (Figure 2-6).
30 Overcoming Vulnerability to Rising Oil Prices: Options for Asia and the Pacific
0
5
10
15
20
25
30
35
40
1990 1992 1994 1996 1998 2000 2002 2004 2006
Co
nsu
mer
pri
ce
0
10
20
30
40
50
60
70
Cru
de
pri
ce (U
S$/b
arre
l)
Developing Asia Average price of crude World
Figure 2-6 Oil product prices and the consumer price index, 1990-2006
Sources: IMF 2000; IMF 2006b
0
2
4
6
8
10
12
1990 1992 1994 1996 1998 2000 2002 2004 2006
Real
GD
P g
row
th (%
)
00
10
20
30
40
50
60
70
Cru
de
pri
ce (U
S$/b
arre
l)
Developing Asia Average price of crude World
Figure 2-5 Real GDP growth and rising oil prices, 1990-2006
Sources: IMF 2006b; EIA 2007a; EIA 2007b

The situation is different in developing countriesin Asia because of some inflationary trends.Quarterly data showed that after fluctuationsbetween 2002 and 2004, the inflation rate hadstabilized toward the end of 2005 but showed anupward trend in the first quarter of 2006.
A further possible macroeconomic consequenceis that economic growth could have become lessoil intensive, encouraging countries to use fewerbarrels of oil per unit of GDP. As indicated inFigure 2-7, this had already been happeningthroughout the 1990s, though the region’s oilintensity is still much higher than the global average, implying higher dependence on oil andlower efficiency of oil consumption.
For all three variables – GDP, inflation and oil intensity– the average values for the periods before andafter the price hike are shown in Table B-1 ofAppendix B. This further reinforces the aboveobservations reflecting the minimal influence ofthe oil price increase on macroeconomic indicators.
Trends in prices of other energy sources and otheressential items
The rise in the price of oil also can influence,either directly or indirectly, the prices of otherenergy sources, particularly those of gas and coal,as well as a number of other items.
Gas – Because oil and gas can be substituted formany uses, including power generation and as afeedstock for fertilizers, the price of oil has had astrong influence on that of gas, as is evident inFigure 2-8. In the years ahead the two prices maydecouple to some extent, since long-term gascontracts are based more on spot or futures gasprices. Similarly, for the power sector, which by2030 is likely to account for nearly half of gasdemand, gas prices are likely to be indexed onelectricity prices. Nevertheless, since gas and oilstill compete in non-power sectors, such as fertilizer and steel, oil prices will continue to influence gas prices on the spot and futures markets. It should also be pointed out that gas
Chapter 2: The macroeconomic impact 31
0.005
0.004
0.003
0.002
0.001
0.0001990 1991 1992 1993 1994 1995 1996 1997 1998 1999 2000 2001 2002 2003 2004 2005
Inte
nsi
ty b
arre
ls/U
S$
Developing Asia oil intensity World oil intensity
Figure 2-7 Oil intensity of GDP for the world and developing Asia, 1990-2005
Sources: IMF 2006c; BP 2005
0
50
100
150
200
250
300
1990 1992 1994 1996 1998 2000 2002 2004 2006
Ind
ex (2
002
= 1
00)
Coal price index Natural gas price indexIndex of crude oil
Figure 2-8 Movements of prices of crude oil, coal and natural gas – indexed to 2002, 1990-2006
Sources: IMF 2006c; BP 2005

markets,unlike those for oil,are highly regionalized,and prices often diverge substantially across andwithin regions (OECD/IEA 2004).
Coal – In most sectors coal and oil are not directly substitutable, especially in the short tomedium term, so the prices are not closely linked(Figure 2-8). Nevertheless, in several developingnations in the region, high and rising oil pricesmay in the longer term propel a shift from oiltoward more coal-intensive technologies.
Commodity prices – Oil can also be expected toinfluence the prices of other commodities.Table 2-2shows the price indices for major commoditygroups, which divide overall into fuel and non-fuel. The weights refer to the proportion that each represents of total export earnings.The energy group, in which oil has a large weight,closely tracks increasing oil prices. Food, on theother hand, has not shown a large increase – only27 percent – as production has kept pace withdemand and, for some basic items, prices are regulated. For metals, the price rises will reflectglobal economic expansion, with consequentincreases in demand as well as rises in production
costs because of the increase in the price of coking coal.
Impact by subregion
Oil price rises can have greater impacts in certainregions and countries. This section tracks thesedifferences with respect to four macroeconomicvariables: the GDP growth rate; the inflation rate;the change in foreign exchange reserves; and thecurrent account balance as a percentage of GDP.It would also have been interesting to monitorcentral government expenditure but this provedimpossible because of the lack of uniform data.
GDP growth
In general, the Asian economies are benefitingfrom a strong world economy with unabateddemand for varied products (Figure 2-9). Somecountries will also have been affected by non-economic factors: Nepal and Sri Lanka, forexample, have been coping with political turmoiland insurgency, while Maldives, which dependsheavily on international tourism, was devastatedby the December 2004 tsunami.
32 Overcoming Vulnerability to Rising Oil Prices: Options for Asia and the Pacific
Table 2-2 Price trends for other commodities, 2003-2005
Commodities Weights 2003 2004 2005/Q2 05 Q3 05 Q4 06 Q1 06 Q22
Non-fuel commodities1 52 82 97 107 107 111 122 138Food 22 86 98 98 98 98 103 109Metals 16 81 110 139 138 151 177 218
Energy 48 161 211 292 326 311 332 369Spot crude3 40 168 220 310 349 329 355 397Natural gas 5 162 180 256 272 312 283 288Coal 3 74 146 130 133 109 130 144
Notes: 1. Weights are based on 1995-97 average world export earnings. 2. Provisional. 3. Average Petroleum Spot Price (APSP). Average of U.K. Brent, Dubai and West Texas Intermediate, equally weighted.Mombasa Auction price (Best PFI, Kenyan) replaces London Auction price beginning July 1998
Source: IMF 2006b
-10.00
-5.00
0.00
5.00
10.00
1990 1992 1994 1996 1998 2000 2002 2004 2006
GD
P g
row
th ra
te %
0.00
10.00
20.00
30.00
40.00
50.00
Ave
rag
e o
il p
rice
(US$
/bar
rel)
Average GDP growth (SEA)Average GDP growth (SWA)Average GDP growth (NEA)
Average GDP growth (Pacific)Average international crude oil prices (avg of Brent and OPEC)
Figure 2-9 GDP growth rate by subregion, 1990-2006
Sources: World Bank 2005a; World Bank 2007b; IEA 2006
The oil price rise does not
appear to have
dramatically affected
economic growth across
the region as a whole
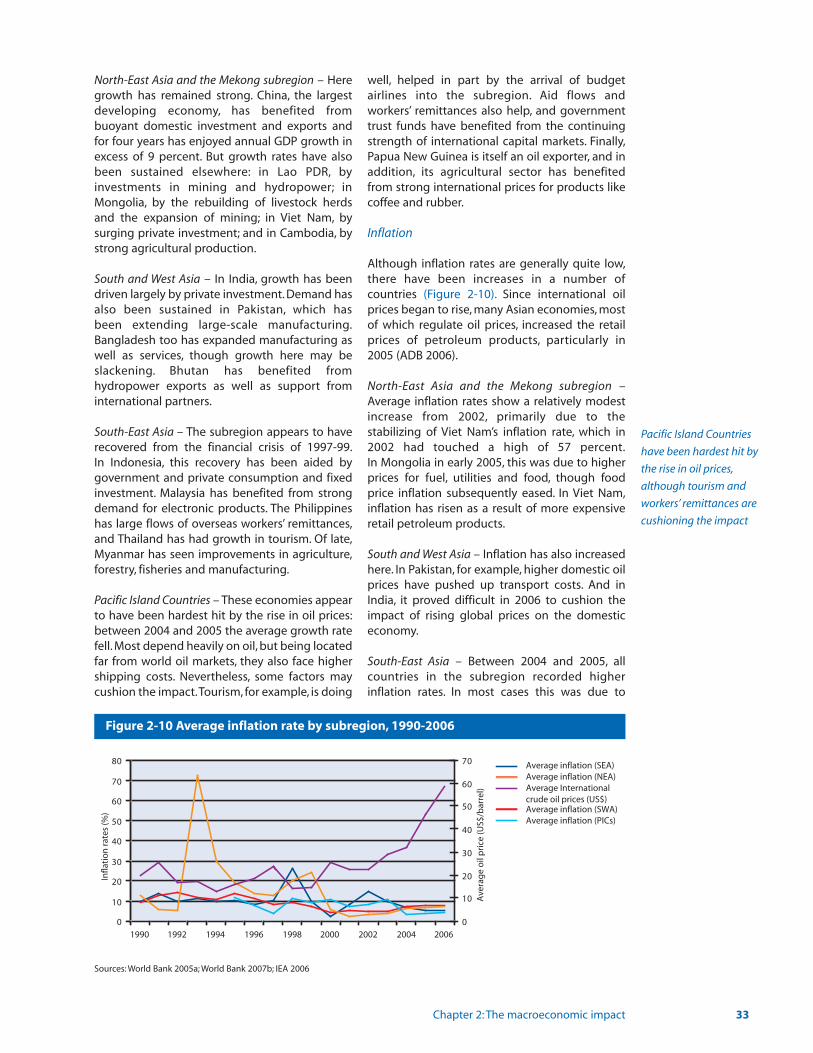
North-East Asia and the Mekong subregion – Heregrowth has remained strong. China, the largestdeveloping economy, has benefited from buoyant domestic investment and exports andfor four years has enjoyed annual GDP growth inexcess of 9 percent. But growth rates have alsobeen sustained elsewhere: in Lao PDR, byinvestments in mining and hydropower; inMongolia, by the rebuilding of livestock herdsand the expansion of mining; in Viet Nam, bysurging private investment; and in Cambodia, bystrong agricultural production.
South and West Asia – In India, growth has beendriven largely by private investment. Demand hasalso been sustained in Pakistan, which has been extending large-scale manufacturing.Bangladesh too has expanded manufacturing aswell as services, though growth here may beslackening. Bhutan has benefited fromhydropower exports as well as support frominternational partners.
South-East Asia – The subregion appears to haverecovered from the financial crisis of 1997-99.In Indonesia, this recovery has been aided by government and private consumption and fixedinvestment. Malaysia has benefited from strongdemand for electronic products. The Philippineshas large flows of overseas workers’ remittances,and Thailand has had growth in tourism. Of late,Myanmar has seen improvements in agriculture,forestry, fisheries and manufacturing.
Pacific Island Countries – These economies appearto have been hardest hit by the rise in oil prices:between 2004 and 2005 the average growth ratefell. Most depend heavily on oil, but being locatedfar from world oil markets, they also face highershipping costs. Nevertheless, some factors maycushion the impact.Tourism, for example, is doing
well, helped in part by the arrival of budget airlines into the subregion. Aid flows and workers’ remittances also help, and governmenttrust funds have benefited from the continuingstrength of international capital markets. Finally,Papua New Guinea is itself an oil exporter, and inaddition, its agricultural sector has benefitedfrom strong international prices for products like coffee and rubber.
Inflation
Although inflation rates are generally quite low,there have been increases in a number of countries (Figure 2-10). Since international oilprices began to rise, many Asian economies, mostof which regulate oil prices, increased the retailprices of petroleum products, particularly in 2005 (ADB 2006).
North-East Asia and the Mekong subregion –Average inflation rates show a relatively modestincrease from 2002, primarily due to the stabilizing of Viet Nam’s inflation rate, which in2002 had touched a high of 57 percent.In Mongolia in early 2005, this was due to higherprices for fuel, utilities and food, though foodprice inflation subsequently eased. In Viet Nam,inflation has risen as a result of more expensiveretail petroleum products.
South and West Asia – Inflation has also increasedhere. In Pakistan, for example, higher domestic oilprices have pushed up transport costs. And inIndia, it proved difficult in 2006 to cushion theimpact of rising global prices on the domesticeconomy.
South-East Asia – Between 2004 and 2005, allcountries in the subregion recorded higher inflation rates. In most cases this was due to
Chapter 2: The macroeconomic impact 33
0
10
20
30
40
50
60
70
80
1990 1992 1994 1996 1998 2000 2002 2004 2006
Infla
tio
n ra
tes
(%)
0
10
20
30
40
50
60
70
Ave
rag
e o
il p
rice
(US$
/bar
rel)
Average inflation (SEA)Average inflation (NEA)Average International crude oil prices (US$)Average inflation (SWA)Average inflation (PICs)
Figure 2-10 Average inflation rate by subregion, 1990-2006
Sources: World Bank 2005a; World Bank 2007b; IEA 2006
Pacific Island Countries
have been hardest hit by
the rise in oil prices,
although tourism and
workers’ remittances are
cushioning the impact
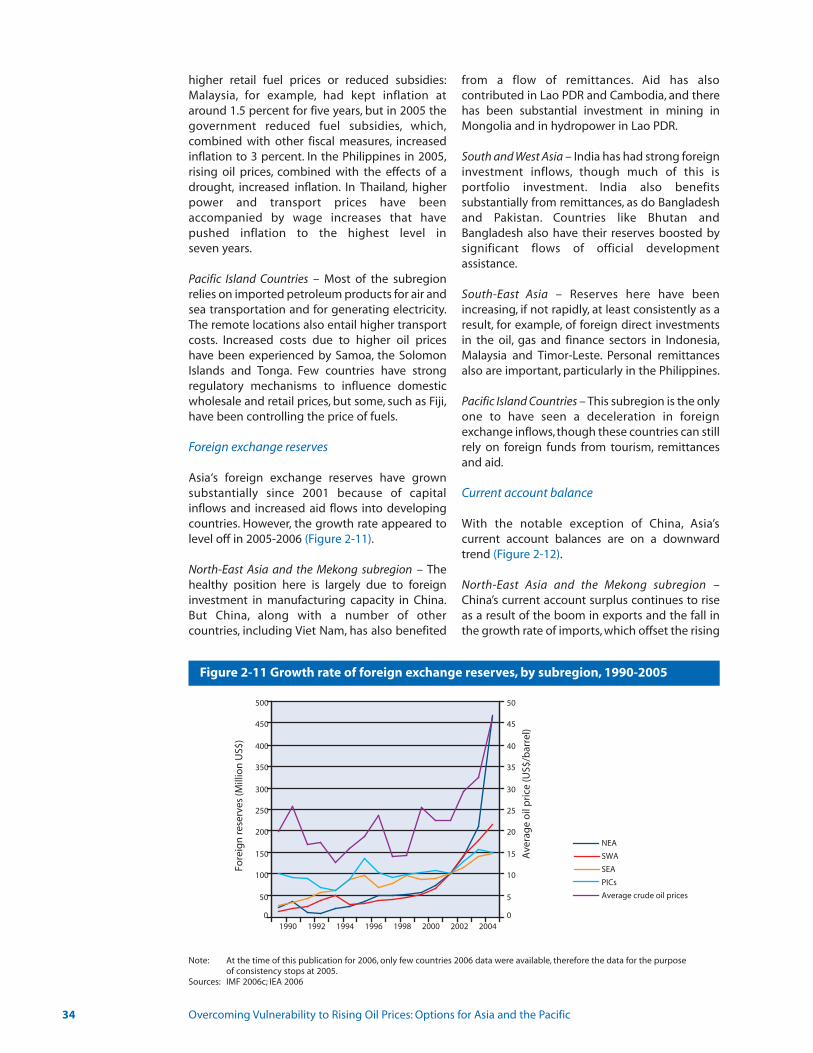
higher retail fuel prices or reduced subsidies:Malaysia, for example, had kept inflation ataround 1.5 percent for five years, but in 2005 thegovernment reduced fuel subsidies, which,combined with other fiscal measures, increasedinflation to 3 percent. In the Philippines in 2005,rising oil prices, combined with the effects of adrought, increased inflation. In Thailand, higherpower and transport prices have been accompanied by wage increases that havepushed inflation to the highest level in seven years.
Pacific Island Countries – Most of the subregionrelies on imported petroleum products for air andsea transportation and for generating electricity.The remote locations also entail higher transportcosts. Increased costs due to higher oil priceshave been experienced by Samoa, the SolomonIslands and Tonga. Few countries have strong regulatory mechanisms to influence domesticwholesale and retail prices, but some, such as Fiji,have been controlling the price of fuels.
Foreign exchange reserves
Asia‘s foreign exchange reserves have grown substantially since 2001 because of capitalinflows and increased aid flows into developingcountries. However, the growth rate appeared tolevel off in 2005-2006 (Figure 2-11).
North-East Asia and the Mekong subregion – Thehealthy position here is largely due to foreigninvestment in manufacturing capacity in China.But China, along with a number of other countries, including Viet Nam, has also benefited
from a flow of remittances. Aid has also contributed in Lao PDR and Cambodia, and therehas been substantial investment in mining inMongolia and in hydropower in Lao PDR.
South and West Asia – India has had strong foreigninvestment inflows, though much of this is portfolio investment. India also benefits substantially from remittances, as do Bangladeshand Pakistan. Countries like Bhutan andBangladesh also have their reserves boosted bysignificant flows of official development assistance.
South-East Asia – Reserves here have beenincreasing, if not rapidly, at least consistently as aresult, for example, of foreign direct investmentsin the oil, gas and finance sectors in Indonesia,Malaysia and Timor-Leste. Personal remittancesalso are important, particularly in the Philippines.
Pacific Island Countries – This subregion is the onlyone to have seen a deceleration in foreignexchange inflows, though these countries can stillrely on foreign funds from tourism, remittancesand aid.
Current account balance
With the notable exception of China, Asia’s current account balances are on a downwardtrend (Figure 2-12).
North-East Asia and the Mekong subregion –China’s current account surplus continues to riseas a result of the boom in exports and the fall inthe growth rate of imports, which offset the rising
34 Overcoming Vulnerability to Rising Oil Prices: Options for Asia and the Pacific
50
0
100
150
200
250
300
350
400
450
500
5
0
10
15
20
25
30
35
40
45
50
1990 1992 1994 1996 1998 2000 2002 2004
Fore
ign
rese
rves
(Mill
ion
US$
)
Ave
rag
e o
il p
rice
(US$
/bar
rel)
NEA
SWA
SEA
PICs
Average crude oil prices
Figure 2-11 Growth rate of foreign exchange reserves, by subregion, 1990-2005
Note: At the time of this publication for 2006, only few countries 2006 data were available, therefore the data for the purpose of consistency stops at 2005.
Sources: IMF 2006c; IEA 2006
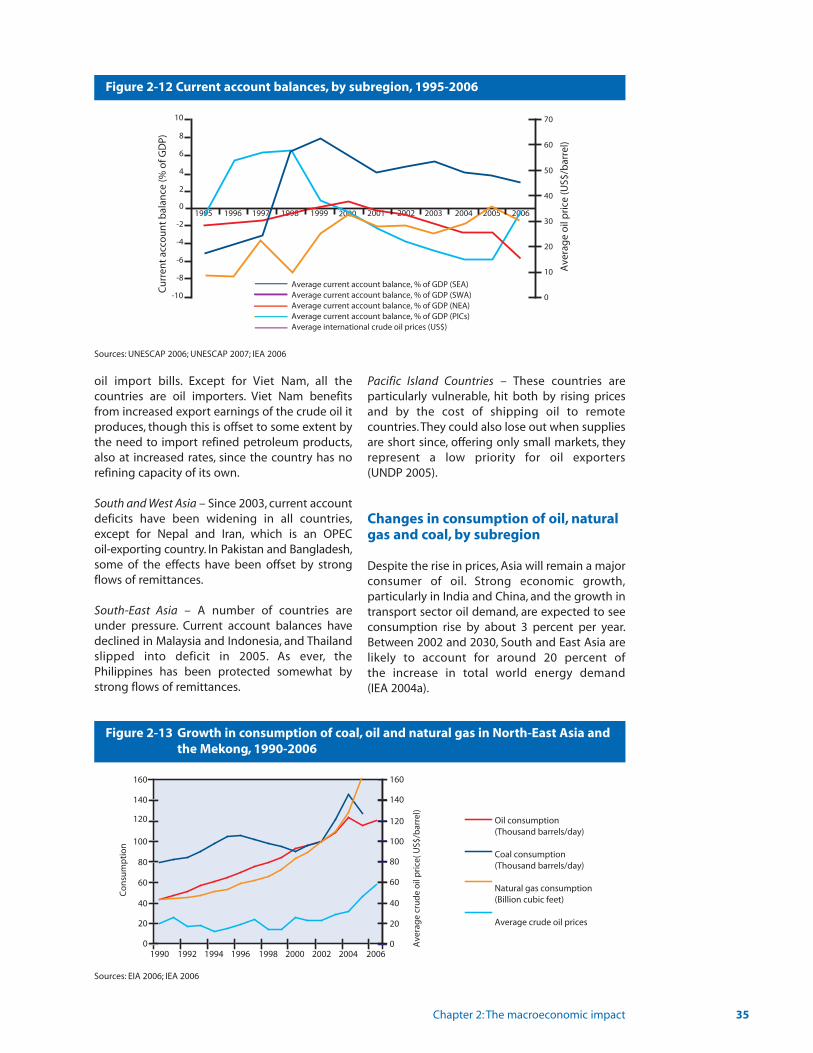
oil import bills. Except for Viet Nam, all the countries are oil importers. Viet Nam benefitsfrom increased export earnings of the crude oil itproduces, though this is offset to some extent bythe need to import refined petroleum products,also at increased rates, since the country has norefining capacity of its own.
South and West Asia – Since 2003, current accountdeficits have been widening in all countries,except for Nepal and Iran, which is an OPEC oil-exporting country. In Pakistan and Bangladesh,some of the effects have been offset by strongflows of remittances.
South-East Asia – A number of countries areunder pressure. Current account balances havedeclined in Malaysia and Indonesia, and Thailandslipped into deficit in 2005. As ever, thePhilippines has been protected somewhat bystrong flows of remittances.
Pacific Island Countries – These countries are particularly vulnerable, hit both by rising pricesand by the cost of shipping oil to remote countries.They could also lose out when suppliesare short since, offering only small markets, theyrepresent a low priority for oil exporters (UNDP 2005).
Changes in consumption of oil, naturalgas and coal, by subregion
Despite the rise in prices, Asia will remain a majorconsumer of oil. Strong economic growth,particularly in India and China, and the growth intransport sector oil demand, are expected to seeconsumption rise by about 3 percent per year.Between 2002 and 2030, South and East Asia arelikely to account for around 20 percent of the increase in total world energy demand (IEA 2004a).
Chapter 2: The macroeconomic impact 35
0
20
40
60
80
100
120
140
160
1990 1992 1994 1996 1998 2000 2002 2004 20060
20
40
60
80
100
120
140
160
Oil consumption(Thousand barrels/day)
Coal consumption(Thousand barrels/day)
Natural gas consumption(Billion cubic feet)
Average crude oil prices
Co
nsu
mp
tio
n
Ave
rag
e cr
ud
e o
il p
rice
( US$
/bar
rel)
Figure 2-13 Growth in consumption of coal, oil and natural gas in North-East Asia and the Mekong, 1990-2006
Sources: EIA 2006; IEA 2006
-10
-8
-6
-4
-2
0
2
4
6
8
10
1995 1996 1997 1998 1999 2000 2001 2002 2003 2004 2005 2006
Cu
rren
t ac
cou
nt
bal
ance
(% o
f GD
P)
0
10
20
30
40
50
60
70
Ave
rag
e o
il p
rice
(US$
/bar
rel)
Average current account balance, % of GDP (SEA)Average current account balance, % of GDP (SWA)Average current account balance, % of GDP (NEA)Average current account balance, % of GDP (PICs)Average international crude oil prices (US$)
Figure 2-12 Current account balances, by subregion, 1995-2006
Sources: UNESCAP 2006; UNESCAP 2007; IEA 2006
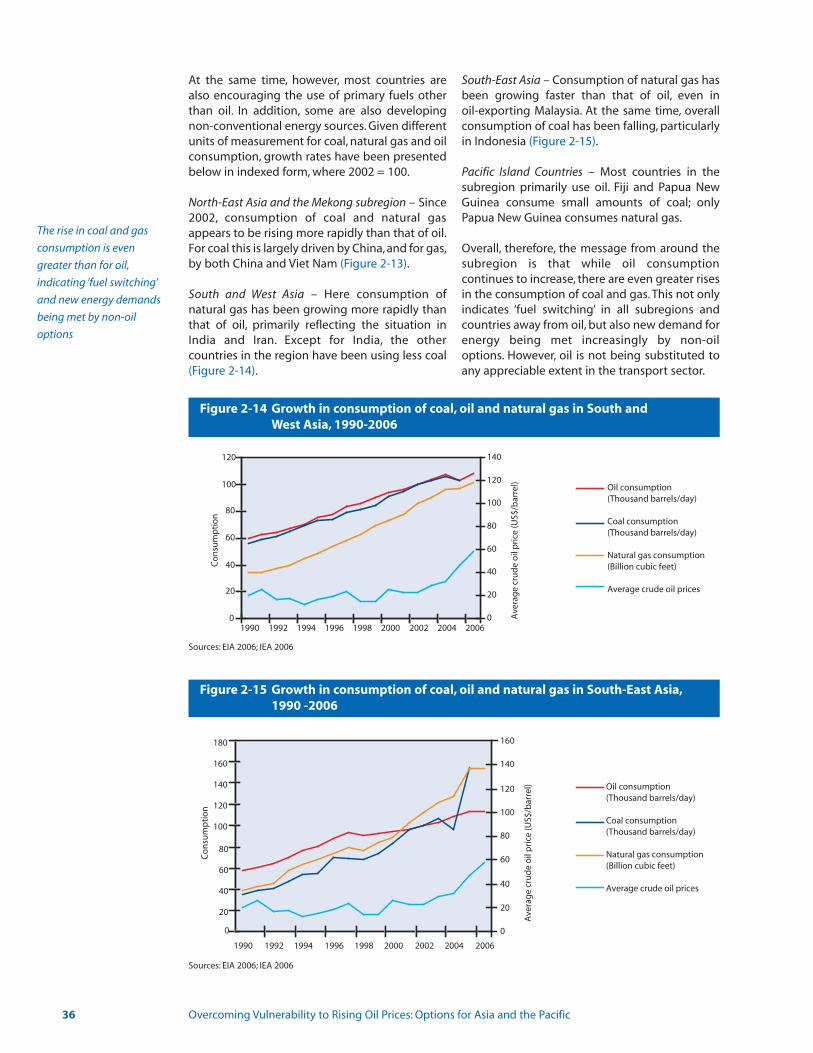
At the same time, however, most countries arealso encouraging the use of primary fuels otherthan oil. In addition, some are also developingnon-conventional energy sources. Given differentunits of measurement for coal, natural gas and oilconsumption, growth rates have been presentedbelow in indexed form, where 2002 = 100.
North-East Asia and the Mekong subregion – Since2002, consumption of coal and natural gasappears to be rising more rapidly than that of oil.For coal this is largely driven by China, and for gas,by both China and Viet Nam (Figure 2-13).
South and West Asia – Here consumption of natural gas has been growing more rapidly thanthat of oil, primarily reflecting the situation inIndia and Iran. Except for India, the other countries in the region have been using less coal(Figure 2-14).
South-East Asia – Consumption of natural gas hasbeen growing faster than that of oil, even in oil-exporting Malaysia. At the same time, overallconsumption of coal has been falling, particularlyin Indonesia (Figure 2-15).
Pacific Island Countries – Most countries in thesubregion primarily use oil. Fiji and Papua NewGuinea consume small amounts of coal; onlyPapua New Guinea consumes natural gas.
Overall, therefore, the message from around thesubregion is that while oil consumption continues to increase, there are even greater risesin the consumption of coal and gas. This not onlyindicates ‘fuel switching’ in all subregions andcountries away from oil, but also new demand forenergy being met increasingly by non-oiloptions. However, oil is not being substituted toany appreciable extent in the transport sector.
36 Overcoming Vulnerability to Rising Oil Prices: Options for Asia and the Pacific
0
20
40
60
80
100
120
1990 1992 1994 1996 1998 2000 2002 2004 20060
20
40
60
80
100
120
140
Oil consumption(Thousand barrels/day)
Coal consumption(Thousand barrels/day)
Natural gas consumption(Billion cubic feet)
Average crude oil prices
Co
nsu
mp
tio
n
Ave
rag
e cr
ud
e o
il p
rice
(US$
/bar
rel)
Figure 2-14 Growth in consumption of coal, oil and natural gas in South and West Asia, 1990-2006
Sources: EIA 2006; IEA 2006
0
20
40
60
80
100
120
140
160
180
1990 1992 1994 1996 1998 2000 2002 2004 2006
0
20
40
60
80
100
120
140
160
Oil consumption(Thousand barrels/day)
Coal consumption(Thousand barrels/day)
Natural gas consumption(Billion cubic feet)
Average crude oil prices
Co
nsu
mp
tio
n
Ave
rag
e cr
ud
e o
il p
rice
(US$
/bar
rel)
Figure 2-15 Growth in consumption of coal, oil and natural gas in South-East Asia,1990 -2006
Sources: EIA 2006; IEA 2006
The rise in coal and gas
consumption is even
greater than for oil,
indicating ‘fuel switching’
and new energy demands
being met by non-oil
options

Electricity generation
One of the most important uses of primary energy sources is to generate electricity, the availability of which has a direct impact on thelives of the poor, for a whole range of uses fromlighting to powering agricultural equipment.Across the countries surveyed in this report, thereappears to have been a shift toward generatingelectricity from natural gas. Coal also remainsimportant, as does hydropower, though its useappears to be diminishing in countries likeMyanmar, Sri Lanka and Viet Nam. Nuclear energytoo is making inroads; in 2002 it constitutedaround 1 percent of the primary energy mix inChina and India (IEA 2004a).
Encouragingly, between 1990 and 2003 all countries saw significant rises in electricity production, from 110 percent in the Philippinesto 370 percent in Viet Nam. The most rapidprogress seems to have been in Malaysia andThailand, as well as in China. But striking contrastsexist across the region: per-capita electricity consumption in high-income countries is about26 times that in low-income countries. This is indicated in Table 2-3, which also shows thatthree countries, Nepal, Myanmar and Sri Lanka,have per capita electricity consumption figuresthat are lower than the low-income groupaverage.
Chapter 2: The macroeconomic impact 37
Source: World Bank 2006
Percentageincrease inelectricity
production(bn kWh)
1990-2003
Electricity consumption
per capita,(kWh) 2003
Percentage of oil intotal electricity
generation
Percentage of natural gas in
total electricity generation
Observations
1990 2003 1990 2003
China 207 1,379 7.9 3 0.5 0.3 High usage of coal: 80% of all electricity generated from coal in 2003
India 119 435 4.3 4.6 3.4 11.5 High usage of coal: 68.3% of all electricitygenerated from coal in 2003
Indonesia 239 440 42.7 24.6 2.3 20.3 Diminishing role of hydropower as a sourceof energy generation
Iran 158 1,916 37.3 16 52.5 76.7 Natural gas main source of electricity generation; diminishing role of oil
Malaysia 241 3,061 50 4.3 20.4 74 Natural gas main source of electricity generation; diminishing role of oil
Myanmar 148 101 10.9 6.8 39.3 57 Natural gas replacing hydropower as themajor source of electricity generation
Nepal 156 68 0.1 0.2 … … Almost 100% of electricity generated from hydropower
Pakistan 114 408 20.6 15.7 33.6 48.5 Natural gas replacing hydropower as a major source of electricity generation
Philippines 110 574 46.7 14.2 … 24.9 Coal and natural gas accounts for 28% and25% of electricity generated; diminishing role of hydropower
Sri Lanka 138 352 0.2 56.5 … … Oil replacing hydropower as the main source of electricity generation
Thailand 165 1,752 23.5 2.7 40.2 73 In 1990, coal, oil and hydropower contributedto 25%, 23% and 11%, respectively, of electricity generated
Viet Nam 370 429 15 6.5 0.1 29.4 Percentage of electricity generated from hydropower decreased from 62% in 1990 to 46% in 2003
Table 2-3 Electricity production and proportion produced from oil and natural gas
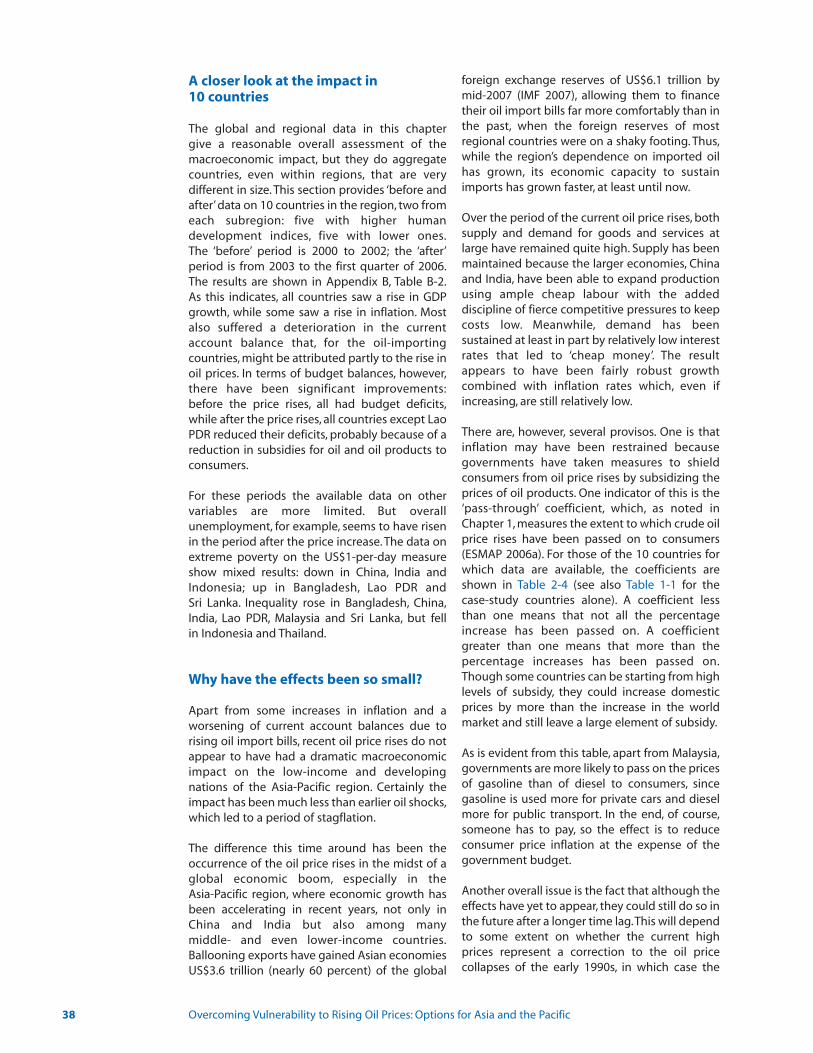
A closer look at the impact in 10 countries
The global and regional data in this chapter give a reasonable overall assessment of themacroeconomic impact, but they do aggregatecountries, even within regions, that are very different in size. This section provides ‘before andafter’ data on 10 countries in the region, two fromeach subregion: five with higher human development indices, five with lower ones.The ‘before’ period is 2000 to 2002; the ‘after’period is from 2003 to the first quarter of 2006.The results are shown in Appendix B, Table B-2.As this indicates, all countries saw a rise in GDPgrowth, while some saw a rise in inflation. Mostalso suffered a deterioration in the currentaccount balance that, for the oil-importing countries, might be attributed partly to the rise inoil prices. In terms of budget balances, however,there have been significant improvements:before the price rises, all had budget deficits,while after the price rises, all countries except LaoPDR reduced their deficits, probably because of areduction in subsidies for oil and oil products toconsumers.
For these periods the available data on othervariables are more limited. But overall unemployment, for example, seems to have risenin the period after the price increase. The data onextreme poverty on the US$1-per-day measureshow mixed results: down in China, India andIndonesia; up in Bangladesh, Lao PDR and Sri Lanka. Inequality rose in Bangladesh, China,India, Lao PDR, Malaysia and Sri Lanka, but fell in Indonesia and Thailand.
Why have the effects been so small?
Apart from some increases in inflation and aworsening of current account balances due to rising oil import bills, recent oil price rises do notappear to have had a dramatic macroeconomicimpact on the low-income and developingnations of the Asia-Pacific region. Certainly theimpact has been much less than earlier oil shocks,which led to a period of stagflation.
The difference this time around has been theoccurrence of the oil price rises in the midst of aglobal economic boom, especially in the Asia-Pacific region, where economic growth hasbeen accelerating in recent years, not only inChina and India but also among many middle- and even lower-income countries.Ballooning exports have gained Asian economiesUS$3.6 trillion (nearly 60 percent) of the global
foreign exchange reserves of US$6.1 trillion bymid-2007 (IMF 2007), allowing them to financetheir oil import bills far more comfortably than inthe past, when the foreign reserves of mostregional countries were on a shaky footing. Thus,while the region’s dependence on imported oilhas grown, its economic capacity to sustainimports has grown faster, at least until now.
Over the period of the current oil price rises, bothsupply and demand for goods and services atlarge have remained quite high. Supply has beenmaintained because the larger economies, Chinaand India, have been able to expand productionusing ample cheap labour with the added discipline of fierce competitive pressures to keepcosts low. Meanwhile, demand has been sustained at least in part by relatively low interestrates that led to ‘cheap money’. The result appears to have been fairly robust growth combined with inflation rates which, even ifincreasing, are still relatively low.
There are, however, several provisos. One is thatinflation may have been restrained because governments have taken measures to shield consumers from oil price rises by subsidizing theprices of oil products. One indicator of this is the‘pass-through’ coefficient, which, as noted inChapter 1, measures the extent to which crude oilprice rises have been passed on to consumers(ESMAP 2006a). For those of the 10 countries forwhich data are available, the coefficients areshown in Table 2-4 (see also Table 1-1 for the case-study countries alone). A coefficient lessthan one means that not all the percentageincrease has been passed on. A coefficient greater than one means that more than the percentage increases has been passed on.Though some countries can be starting from highlevels of subsidy, they could increase domesticprices by more than the increase in the worldmarket and still leave a large element of subsidy.
As is evident from this table, apart from Malaysia,governments are more likely to pass on the pricesof gasoline than of diesel to consumers, sincegasoline is used more for private cars and dieselmore for public transport. In the end, of course,someone has to pay, so the effect is to reduceconsumer price inflation at the expense of thegovernment budget.
Another overall issue is the fact that although theeffects have yet to appear, they could still do so inthe future after a longer time lag.This will dependto some extent on whether the current highprices represent a correction to the oil price collapses of the early 1990s, in which case the
38 Overcoming Vulnerability to Rising Oil Prices: Options for Asia and the Pacific

macroeconomic effects may not actually begreat. On the other hand, they could represent alonger secular trend, and impacts in the futurecould be quite serious.
It is also notable that despite the oil priceincrease, there does not seem to have been a fallin demand for oil. This is partly because oil consumption does not seem very sensitive to
price increases, that is, short-run ‘demand elasticity’ is quite low, ranging between -0.02 and-0.03 percent. On the other hand, as their incomesrise, consumers tend to require even more oil,that is, ‘income elasticity’ is quite high, rangingbetween 0.12 and 0.19 percent. Thus, despite rising prices these two elasticities have sustainedincreased oil consumption.
Chapter 2: The macroeconomic impact 39
Table 2-4 Pass-through coefficients, gasoline and diesel
Country Gasoline DieselBangladesh 0.79 0.43China 0.71 0.53India 1.25 0.66Indonesia 1.20 1.02Lao PDR 1.86 1.35Malaysia 0.75 0.84Sri Lanka 1.80 0.83Thailand 1.37 1.15
Note: The period considered is January 2004 to April 2006.The pass-through coefficient is the ratio of change in domestic retail prices to the change in the appropriate international product converted to local currency. The international reference prices used are the Persian Gulf for South Asia and Singapore for East Asia.
Source: ESMAP 2006a


Chapter 3: National vulnerability to oil price rises
3
Rising oil prices have serious implications for theAsia-Pacific region. Of the region’s commerciallytraded energy, 30 percent comes from oil andmost of the rest, 47 percent, comes from coal,with natural gas a distant but rising third at 11percent (BP 2006). Although many countries,notably China and India, have domestic suppliesof coal, when it comes to oil and gas, they aremore likely to rely on imports.
Oil intensity
One useful indicator of dependence on oil is ‘oil intensity,’ which is the amount of oil required to produce a unit of economic output,conveniently expressed through an ‘oil intensityindex’ where the global average is 1.0. This canthen be considered alongside estimates of the ‘oil supply gap,’ or the difference betweendomestic production and consumption, to indicate the extent of a country’s vulnerabilityto international oil price fluctuations. The information for some of the larger countries inthe region and elsewhere is presented in
Figure 3-1. Of these, China, India, the Republic ofKorea and Thailand appear to be at greatest risk,because they have high oil intensities and alsodepend heavily on imports. In addition, thoughnot included in this figure, some smaller countriesin the region also are at risk, including Cambodia,Nepal and the Pacific Island Countries.
The situation in most countries has also beenexacerbated by rising oil consumption. The significance of this can be appreciated by considering the proportion that oil represents ofthe country’s total energy supply and the extent to which it has changed over the past 10 years.This is illustrated for a range of countriesin Figure 3-2, which shows that for most countries, grouped to the left of the figure, theproportion of oil in the mix has increased – especially in Sri Lanka, for power generation, andin Viet Nam, for transport and industrial steam.Nevertheless, even among this group, the shareof energy coming from oil can still be quite modest. In China and India this is because theyhave other options, including coal andhydropower.
National vulnerability to oil price rises
Rising oil prices affect every country to some extent, but some are much more exposed thanothers – highly oil dependent, perhaps, or relying heavily on expensive imports. This chapterassesses this vulnerability for the developing countries across the region, along with the potential impacts on human development. The vulnerability levels are assessed through anindexing system with three dimensions that capture the combined influence of oil availabilityon economic strength, performance and growth.
0
500
1,000
1,500
2,000
2,500
3,000
4,000
3,500
Ch
ina
Ind
ia
Rep
ub
lic o
f Ko
rea
Spai
n
Net
her
lan
ds
Taiw
an
Bel
giu
m &
Luxe
mb
ou
rg
Turk
ey
Thai
lan
d
Sou
th A
fric
a
Pola
nd
Gre
ece
Paki
stan
Port
ug
al
Phili
pp
ines
Oil
sup
ply
gap
(th
ou
san
d b
arre
ls/d
ay)
0.0
0.2
0.4
0.6
0.8
1.0
1.2
1.4
1.6
1.8
2.0
Oil
inte
nsi
ty in
dex
Oil supply gap (production minus consumption; thousand barrels per day)
Oil intensity index (world average equals one)
Figure 3-1 Oil intensity index and oil supply gap for some major oil importers, 2004
Source: Economist Intelligence Unit 2006

42 Overcoming Vulnerability to Rising Oil Prices: Options for Asia and the Pacific
The smaller group of countries on the right ofFigure 3-2 have reduced their oil dependence.These include the more advanced developingcountries like Malaysia and Thailand, which havebeen basing their growth more on service industries that are less energy intensive, while they have been able to substitute oil with naturalgas and coal for power generation.
Oil consumption and economic growth
In general, per capita oil consumption in Asia-Pacific developing countries still remains low: in2004, it was less than 0.8 tonnes of oil equivalent(toe), against the average of 4.7 in the OECDcountries. Nevertheless, most countries in theregion have been increasing oil consumption aspart of more rapid economic growth. They have,for example, been mechanizing agriculture,expanding their industries, and using more personal and freight transport. At the same time,they have been modernizing away from traditional forms of energy such as biomass,human or animal labour, and in some cases solidfuels, and towards more modern fuels, includingelectricity, oil and gas. This has been happening,for example, in China, India, Sri Lanka and Viet Nam.
Figure 3-3 illustrates, for selected countries, thecorrelation between oil consumption and economic growth. For each country the lines jointhe points for these pairs of variables, in dateorder. The story is clearest, perhaps, for countrieslike China, whose fairly straight line indicates thatper capita oil consumption has risen steadilyalong with increases in per capita GDP. The
situation is similar in India, though the overallchanges in both variables have been smaller.For Viet Nam the line has also been fairly straight,but is much steeper, implying that growth isbecoming more oil intensive at a greater pacethan in other countries, because people use more motorcycles and cars along with other oil-basedappliances for industrial steam generation.
For other countries the situation is different.For Myanmar, for example, the line is virtually flat,an unusual case. This means that although thecountry has a rapidly expanding economy, it hasnot seen a corresponding rise in per capita oilconsumption. This could be because its growth isbased on higher state earnings – from the exportof oil and gas and other natural resources – whilewithin the economy, people have not been making greater use of transportation and otheroil-consuming sectors have only grown slowly.Other countries such as Pakistan and thePhilippines, on the other hand, have more eccentric lines, reflecting the fact that per capitaGDP and/or per capita oil consumption have attimes risen and at times fallen.
It is not surprising that economic growth shouldresult in increased consumption of modern formsof energy, including hydroelectricity, coal and oil.Less acknowledged, perhaps, is the fact that inorder to achieve faster growth, countries need tomake greater use of oil products, that is, theyneed to become more oil intensive. If they cannotmake this change, their growth is likely to behampered. If they want to expand rural transportation, for example, they will need toconsume more gasoline and diesel for some timeto come.
0
10
20
30
40
50
60
70
Nep
al
Mya
nm
ar
Ch
ina
Vie
t N
am
Bru
nei
Dar
uss
alam
Ban
gla
des
h
Ind
ia
Sri L
anka
Ind
on
esia
DPR
Ko
rea
Paki
stan
Phili
pp
ines
Thai
lan
d
Mal
aysi
a
Oil
dem
and
/ T
PES
(%)
1995 2005
Figure 3-2 Changes in the share of oil in total primary energy supply, 1995-2005
Data source: IEA 2007a
Yet if poor countries do not
become more oil intensive,
their growth is likely to be
further hampered
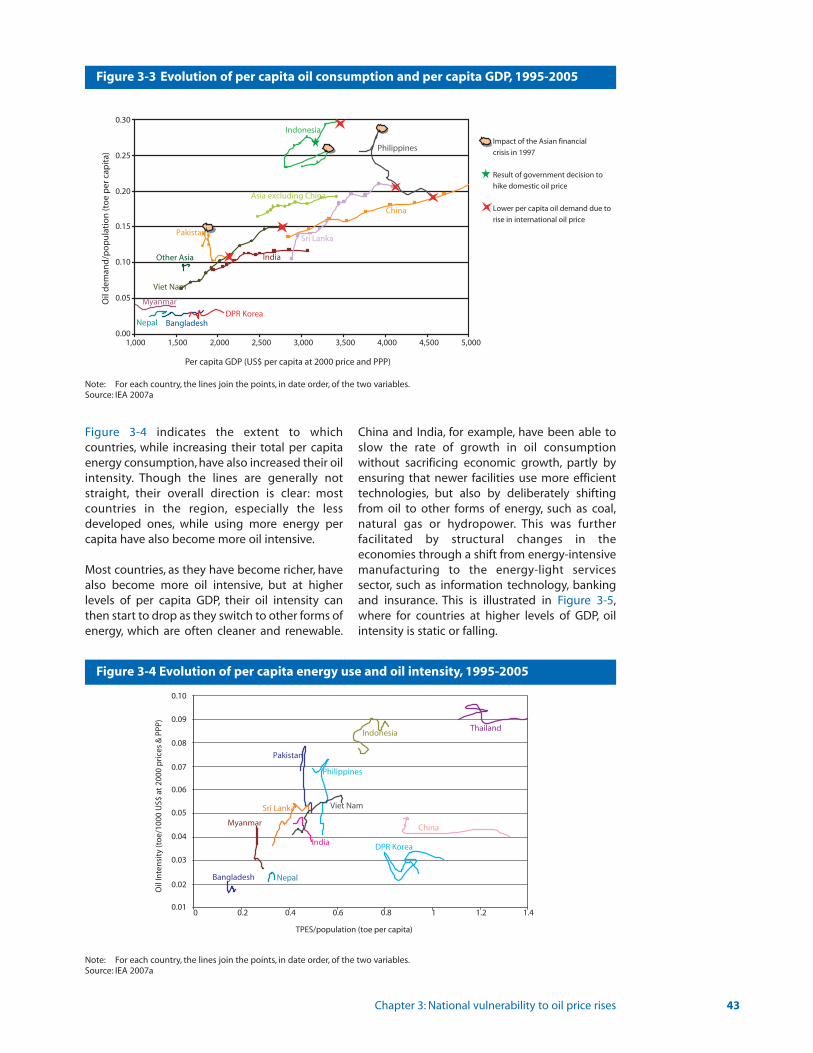
Chapter 3: National vulnerability to oil price rises 43
Figure 3-4 indicates the extent to which countries, while increasing their total per capitaenergy consumption, have also increased their oilintensity. Though the lines are generally notstraight, their overall direction is clear: most countries in the region, especially the less developed ones, while using more energy percapita have also become more oil intensive.
Most countries, as they have become richer, havealso become more oil intensive, but at higher levels of per capita GDP, their oil intensity canthen start to drop as they switch to other forms ofenergy, which are often cleaner and renewable.
China and India, for example, have been able toslow the rate of growth in oil consumption without sacrificing economic growth, partly byensuring that newer facilities use more efficienttechnologies, but also by deliberately shiftingfrom oil to other forms of energy, such as coal,natural gas or hydropower. This was further facilitated by structural changes in theeconomies through a shift from energy-intensivemanufacturing to the energy-light services sector, such as information technology, bankingand insurance. This is illustrated in Figure 3-5,where for countries at higher levels of GDP, oilintensity is static or falling.
0.10
0.08
0.07
0.06
0.05
0.04
0.03
0.02
0.01
0.09
0 0.2 0.4 0.6 0.8 1 1.2 1.4
TPES/population (toe per capita)
Oil
Inte
nsi
ty (t
oe/
1000
US$
at
2000
pri
ces
& P
PP)
Bangladesh Nepal
Myanmar
IndonesiaThailand
China
DPR Korea
Philippines
India
Viet NamSri Lanka
Pakistan
Figure 3-4 Evolution of per capita energy use and oil intensity, 1995-2005
Note: For each country, the lines join the points, in date order, of the two variables.Source: IEA 2007a
0.00
0.05
0.10
0.15
0.20
0.25
0.30
1,000 1,500 2,000 2,500 3,000 3,500 4,000 4,500 5,000
Per capita GDP (US$ per capita at 2000 price and PPP)
Oil
dem
and
/po
pu
lati
on
(to
e p
er c
apit
a)
Indonesia
India
Pakistan
Nepal
Philippines
Other Asia
China
Asia excluding China
Sri Lanka
DPR KoreaBangladesh
Myanmar
Viet Nam
Impact of the Asian financial
crisis in 1997
Result of government decision to
hike domestic oil price
Lower per capita oil demand due to
rise in international oil price
Figure 3-3 Evolution of per capita oil consumption and per capita GDP, 1995-2005
Note: For each country, the lines join the points, in date order, of the two variables.Source: IEA 2007a

Nevertheless, declines in oil intensity have notalways been due to gains in efficiency. Malaysiaand Thailand, for example, saw a drop in oil intensity because of the Asian financial crisis inthe late 1990s which resulted in temporarydeclines in per capita GDP. Viet Nam, on the otherhand, has seen an increase in oil intensity as aresult of structural changes in its economy.
Oil and human development
Countries that increase their oil consumption canthus accelerate economic growth. However, theywill not see a real improvement in human
development unless they ensure that the benefits are shared broadly across their societies.Otherwise, there is a danger that the benefits willbe seized by the affluent minority, who tend to bemore prolific consumers of electricity and oil.Countries therefore need to ensure that the poor too can make best use of modern sources of energy.
The value of increased energy supplies for humandevelopment is illustrated in Figure 3-6.The tail ofthe arrow represents the 1995 position and thetip, the 2004 position.This shows first, as might beexpected, that countries with higher per capitaenergy use also have higher levels of human
44 Overcoming Vulnerability to Rising Oil Prices: Options for Asia and the Pacific
0.01
0.02
0.03
0.04
0.05
0.06
0.07
0.08
0.09
0.10
0.11
0.12
0.13
0.14
0.15
0 1,000 2,000 3,000 4,000 5,000 6,000 7,000 8,000 9,000 10,000
Per capita GDP (US$ per capita at 2000 price and PPP)
Indonesia
India
Pakistan
Nepal
Philippines
Thailand
Malaysia
Other Asia
China
Asia excludingChina
Sri LankaDPR Korea
Bangladesh
Myanmar
Viet NamO
il in
ten
sity
(to
e p
er 1
000
US$
at
2000
pri
ces
& P
PP)
Figure 3-5 Evolution of oil intensity and per capita GDP, 1995-2005
Note: For each country, the lines join the points, in date order, of the two variables Source: IEA 2007a
0.4
0.45
0.5
0.55
0.6
0.65
0.7
0.75
0.8
0.85
0 0.5 1 1.5 2 2.5Primary energy supply/population (toe per capita)
BangladeshNepal
Pakistan
India
Myanmar
Viet Nam Indonesia
Sri Lanka
Philippines Thailand Malaysia
China
Hu
man
Dev
elo
pm
ent
Ind
ex
Figure 3-6 Human Development Index and per capita energy use, 1995 and 2004
Sources: IEA 2007a; UNDP 2006
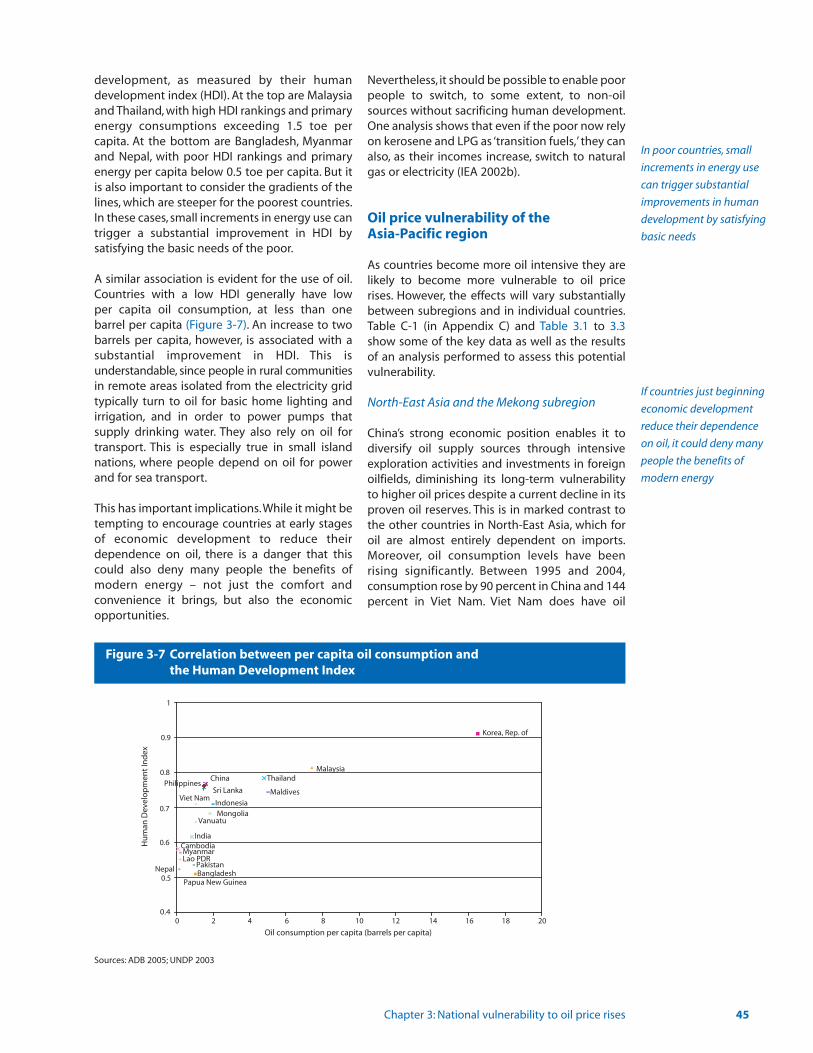
development, as measured by their human development index (HDI). At the top are Malaysiaand Thailand, with high HDI rankings and primaryenergy consumptions exceeding 1.5 toe per capita. At the bottom are Bangladesh, Myanmarand Nepal, with poor HDI rankings and primaryenergy per capita below 0.5 toe per capita. But itis also important to consider the gradients of thelines, which are steeper for the poorest countries.In these cases, small increments in energy use cantrigger a substantial improvement in HDI by satisfying the basic needs of the poor.
A similar association is evident for the use of oil.Countries with a low HDI generally have low per capita oil consumption, at less than onebarrel per capita (Figure 3-7). An increase to twobarrels per capita, however, is associated with a substantial improvement in HDI. This is understandable, since people in rural communitiesin remote areas isolated from the electricity gridtypically turn to oil for basic home lighting andirrigation, and in order to power pumps that supply drinking water. They also rely on oil fortransport. This is especially true in small islandnations, where people depend on oil for powerand for sea transport.
This has important implications.While it might betempting to encourage countries at early stagesof economic development to reduce theirdependence on oil, there is a danger that thiscould also deny many people the benefits ofmodern energy – not just the comfort and convenience it brings, but also the economicopportunities.
Nevertheless, it should be possible to enable poorpeople to switch, to some extent, to non-oilsources without sacrificing human development.One analysis shows that even if the poor now relyon kerosene and LPG as ‘transition fuels,’ they canalso, as their incomes increase, switch to naturalgas or electricity (IEA 2002b).
Oil price vulnerability of the Asia-Pacific region
As countries become more oil intensive they arelikely to become more vulnerable to oil pricerises. However, the effects will vary substantiallybetween subregions and in individual countries.Table C-1 (in Appendix C) and Table 3.1 to 3.3show some of the key data as well as the resultsof an analysis performed to assess this potentialvulnerability.
North-East Asia and the Mekong subregion
China’s strong economic position enables it todiversify oil supply sources through intensiveexploration activities and investments in foreignoilfields, diminishing its long-term vulnerabilityto higher oil prices despite a current decline in itsproven oil reserves. This is in marked contrast tothe other countries in North-East Asia, which foroil are almost entirely dependent on imports.Moreover, oil consumption levels have been rising significantly. Between 1995 and 2004,consumption rose by 90 percent in China and 144percent in Viet Nam. Viet Nam does have oil
Chapter 3: National vulnerability to oil price rises 45
Korea, Rep. of
MalaysiaThailand
Maldives
IndonesiaMongolia
Vanuatu
India
Lao PDRPakistan
ChinaPhilippines
Sri LankaViet Nam
CambodiaMyanmar
BangladeshNepal
Papua New Guinea
0.4
0.5
0.6
0.7
0.8
0.9
1
0 2 4 6 8 10 12 14 16 18 20
Oil consumption per capita (barrels per capita)
Hu
man
Dev
elo
pm
ent
Ind
ex
Figure 3-7 Correlation between per capita oil consumption and the Human Development Index
Sources: ADB 2005; UNDP 2003
In poor countries, small
increments in energy use
can trigger substantial
improvements in human
development by satisfying
basic needs
If countries just beginning
economic development
reduce their dependence
on oil, it could deny many
people the benefits of
modern energy
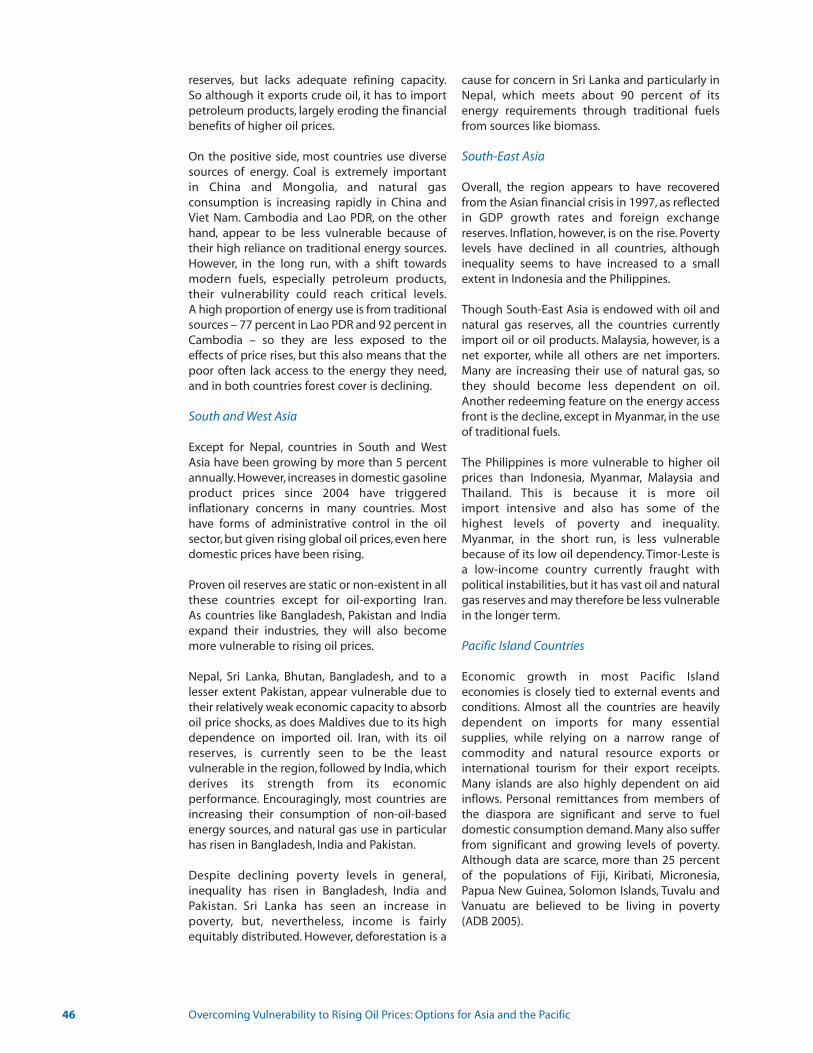
reserves, but lacks adequate refining capacity.So although it exports crude oil, it has to importpetroleum products, largely eroding the financialbenefits of higher oil prices.
On the positive side, most countries use diversesources of energy. Coal is extremely important in China and Mongolia, and natural gas consumption is increasing rapidly in China andViet Nam. Cambodia and Lao PDR, on the otherhand, appear to be less vulnerable because oftheir high reliance on traditional energy sources.However, in the long run, with a shift towardsmodern fuels, especially petroleum products,their vulnerability could reach critical levels.A high proportion of energy use is from traditionalsources – 77 percent in Lao PDR and 92 percent inCambodia – so they are less exposed to theeffects of price rises, but this also means that thepoor often lack access to the energy they need,and in both countries forest cover is declining.
South and West Asia
Except for Nepal, countries in South and WestAsia have been growing by more than 5 percentannually. However, increases in domestic gasolineproduct prices since 2004 have triggered inflationary concerns in many countries. Mosthave forms of administrative control in the oilsector, but given rising global oil prices, even heredomestic prices have been rising.
Proven oil reserves are static or non-existent in allthese countries except for oil-exporting Iran.As countries like Bangladesh, Pakistan and Indiaexpand their industries, they will also becomemore vulnerable to rising oil prices.
Nepal, Sri Lanka, Bhutan, Bangladesh, and to alesser extent Pakistan, appear vulnerable due totheir relatively weak economic capacity to absorboil price shocks, as does Maldives due to its highdependence on imported oil. Iran, with its oilreserves, is currently seen to be the least vulnerable in the region, followed by India, whichderives its strength from its economic performance. Encouragingly, most countries areincreasing their consumption of non-oil-basedenergy sources, and natural gas use in particularhas risen in Bangladesh, India and Pakistan.
Despite declining poverty levels in general,inequality has risen in Bangladesh, India andPakistan. Sri Lanka has seen an increase in poverty, but, nevertheless, income is fairly equitably distributed. However, deforestation is a
cause for concern in Sri Lanka and particularly inNepal, which meets about 90 percent of its energy requirements through traditional fuelsfrom sources like biomass.
South-East Asia
Overall, the region appears to have recoveredfrom the Asian financial crisis in 1997, as reflectedin GDP growth rates and foreign exchangereserves. Inflation, however, is on the rise. Povertylevels have declined in all countries, althoughinequality seems to have increased to a smallextent in Indonesia and the Philippines.
Though South-East Asia is endowed with oil andnatural gas reserves, all the countries currentlyimport oil or oil products. Malaysia, however, is anet exporter, while all others are net importers.Many are increasing their use of natural gas, sothey should become less dependent on oil.Another redeeming feature on the energy accessfront is the decline, except in Myanmar, in the useof traditional fuels.
The Philippines is more vulnerable to higher oilprices than Indonesia, Myanmar, Malaysia andThailand. This is because it is more oil import intensive and also has some of the highest levels of poverty and inequality.Myanmar, in the short run, is less vulnerablebecause of its low oil dependency. Timor-Leste isa low-income country currently fraught withpolitical instabilities, but it has vast oil and naturalgas reserves and may therefore be less vulnerablein the longer term.
Pacific Island Countries
Economic growth in most Pacific Islandeconomies is closely tied to external events andconditions. Almost all the countries are heavilydependent on imports for many essential supplies, while relying on a narrow range of commodity and natural resource exports or international tourism for their export receipts.Many islands are also highly dependent on aidinflows. Personal remittances from members ofthe diaspora are significant and serve to fueldomestic consumption demand. Many also sufferfrom significant and growing levels of poverty.Although data are scarce, more than 25 percentof the populations of Fiji, Kiribati, Micronesia,Papua New Guinea, Solomon Islands, Tuvalu andVanuatu are believed to be living in poverty (ADB 2005).
46 Overcoming Vulnerability to Rising Oil Prices: Options for Asia and the Pacific
The Pacific Island Countries in general areextremely vulnerable to increased oil prices. Theycomprise distant and small markets and have tobear the added burden of higher shipping costs.Electrical power generation in the islands is largely fuelled by diesel.Those less vulnerable arethe larger countries of Samoa and Papua NewGuinea. Samoa has one of the region’s most efficient retail fuel markets as well as thestrongest economic performance, with lower levels of poverty than most other Pacific IslandCountries. Papua New Guinea produces andexports crude oil, and refines oil at the recentlycommissioned Napanapa oil refinery both forexport and domestic consumption. The rise in oilprices has therefore had considerable positiveimplications for, and has made a big contributionto, the government budget.
An Oil Price Vulnerability Index
Is it possible to quantify the extent of this vulnerability? The earlier part of this chapter considered this by assessing which countrieswere both oil intensive and also relied on oilimports. But as the section above has shown, thisis only a small part of the story. The degree of vulnerability will depend on many other factors,such as the GDP growth rate, and on foreignexchange reserves. The extent to which poor people are vulnerable will also vary, for example,according to the types of energy they use and tohow much they depend on oil as an energysource.
One way to highlight the relative vulnerability ofcountries in the region is to construct an‘Oil Price Vulnerability Index’ (OPVI).This needs tocapture the three commonly accepted aspects ofvulnerability: hazards, resistance and damage.Hazards are international events not under thecountry’s control. Resistance represents theresilience and fundamental strength of the economy. Damage is measured through socialvulnerability and is tracked by indicators ofhuman development.
Developing a robust OPVI thus involves combining relevant economic, energy and socialvariables. For this exercise 15 variables were initially identified. They could be broadly dividedinto two categories: economy related and energy related. The 10 economy-related variableswere: real GDP growth rate, GDP per capita,balance of payments, current account, budgetbalance, import cover, share of net oil fuel subsidy
or tax revenue in GDP, contribution of food andbeverages to inflation, trade as a percentage ofGDP, the Gini index and the Human DevelopmentIndex. The five energy-related variables were: oilintensity of GDP, oil import dependence, share ofoil in primary energy consumption, the ratio of oilreserves to production, and the share of transportin oil consumption. Table C-1 in Appendix Cshows the values of these variables for the 24countries in the region for which comparabledata were available.
As with any index constructed with a large number of variables, there is likely to be significant redundancy or overlap. Some variables could be dependent on each other;others could involve double counting. An assessment was therefore carried out using logical reasoning and correlation analysis to justify the inclusion of each variable.This exercisereduced the number of variables to eight which,using ‘principal component analysis,’ a popularstatistical technique, were then grouped throughlinear combinations of variables into three principal components, logically related to three'dimensions.’ The process for developing theOPVI is elaborated in Figure 3.8 and details of the methods used are given in Appendix C.
The three resulting dimensions were:
1. Economic strength (Strength)• Balance of payments: current account • Budget balance• Import cover • Oil import dependence
Strength represents the economic capacity toafford oil imports. A country will be less vulnerable if it has high and positive scores forbalance of payments, budget balance and importcover, and a lower score for oil import dependence.
2. Economic performance (Performance)• GDP per capita • Oil intensity of GDP
Better economic performance results in higherlevels of GDP per capita, which should make acountry less vulnerable. In developing countriesthat are shifting from low-quality traditional fuelsto high-quality modern fuels such as petroleumproducts, this will lead to an increase in oil intensity. This may not be an attractive indicatorfrom an environmental standpoint but is relevantat initial stages of economic development.
Chapter 3: National vulnerability to oil price rises 47
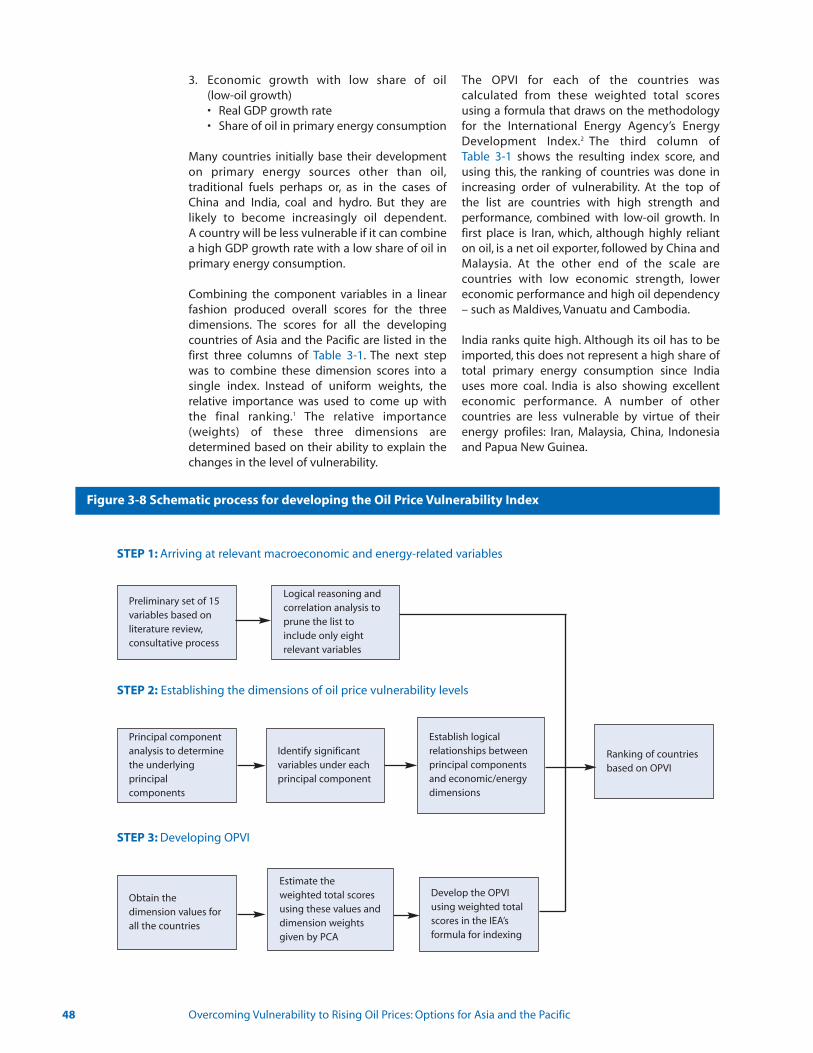
3. Economic growth with low share of oil (low-oil growth)• Real GDP growth rate• Share of oil in primary energy consumption
Many countries initially base their developmenton primary energy sources other than oil,traditional fuels perhaps or, as in the cases ofChina and India, coal and hydro. But they are likely to become increasingly oil dependent.A country will be less vulnerable if it can combinea high GDP growth rate with a low share of oil inprimary energy consumption.
Combining the component variables in a linearfashion produced overall scores for the threedimensions. The scores for all the developingcountries of Asia and the Pacific are listed in thefirst three columns of Table 3-1. The next step was to combine these dimension scores into asingle index. Instead of uniform weights, the relative importance was used to come up withthe final ranking.1 The relative importance(weights) of these three dimensions are determined based on their ability to explain thechanges in the level of vulnerability.
The OPVI for each of the countries was calculated from these weighted total scores using a formula that draws on the methodologyfor the International Energy Agency’s EnergyDevelopment Index.2 The third column of Table 3-1 shows the resulting index score, andusing this, the ranking of countries was done inincreasing order of vulnerability. At the top ofthe list are countries with high strength and performance, combined with low-oil growth. Infirst place is Iran, which, although highly relianton oil, is a net oil exporter, followed by China andMalaysia. At the other end of the scale are countries with low economic strength, lower economic performance and high oil dependency– such as Maldives, Vanuatu and Cambodia.
India ranks quite high. Although its oil has to beimported, this does not represent a high share oftotal primary energy consumption since Indiauses more coal. India is also showing excellenteconomic performance. A number of other countries are less vulnerable by virtue of theirenergy profiles: Iran, Malaysia, China, Indonesiaand Papua New Guinea.
48 Overcoming Vulnerability to Rising Oil Prices: Options for Asia and the Pacific
Figure 3-8 Schematic process for developing the Oil Price Vulnerability Index
Preliminary set of 15variables based onliterature review,consultative process
Logical reasoning andcorrelation analysis toprune the list toinclude only eight relevant variables
Principal componentanalysis to determinethe underlying principal components
Obtain the dimension values forall the countries
Estimate the weighted total scoresusing these values anddimension weightsgiven by PCA
Develop the OPVIusing weighted totalscores in the IEA’sformula for indexing
Identify significantvariables under eachprincipal component
Establish logical relationships betweenprincipal componentsand economic/energydimensions
Ranking of countriesbased on OPVI
STEP 1: Arriving at relevant macroeconomic and energy-related variables
STEP 2: Establishing the dimensions of oil price vulnerability levels
STEP 3: Developing OPVI
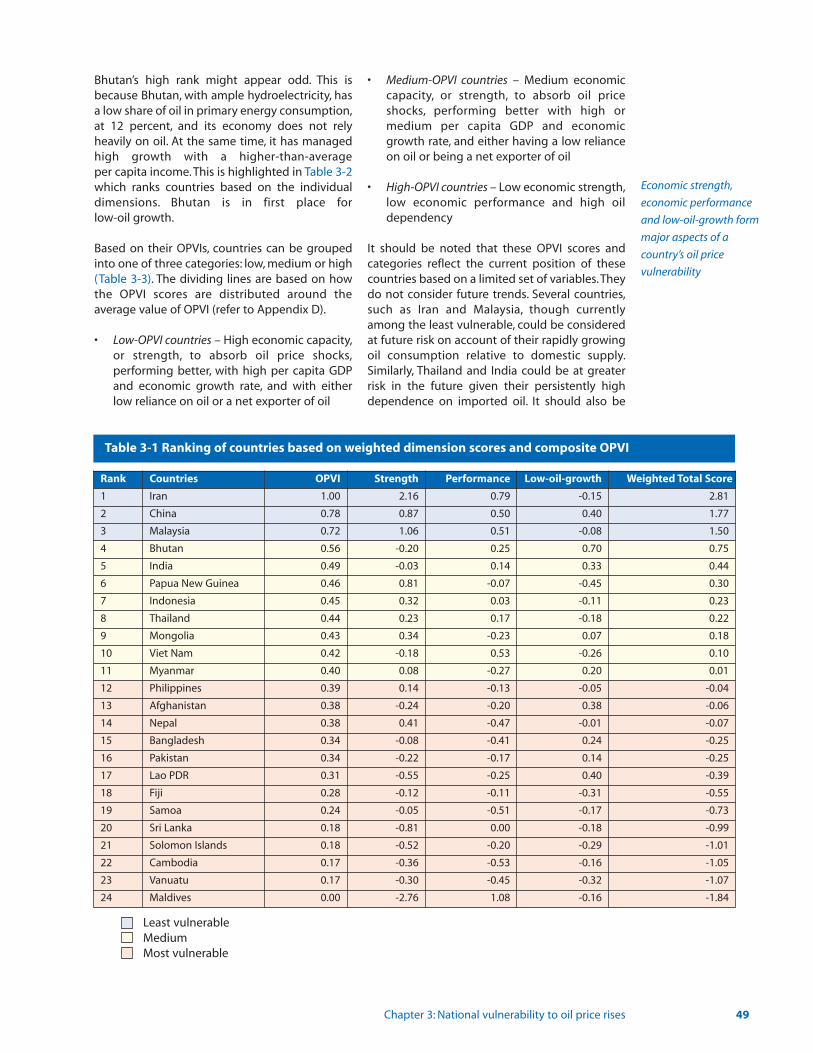
Bhutan’s high rank might appear odd. This isbecause Bhutan, with ample hydroelectricity, hasa low share of oil in primary energy consumption,at 12 percent, and its economy does not relyheavily on oil. At the same time, it has managedhigh growth with a higher-than-average per capita income. This is highlighted in Table 3-2which ranks countries based on the individualdimensions. Bhutan is in first place for low-oil growth.
Based on their OPVIs, countries can be groupedinto one of three categories: low, medium or high(Table 3-3). The dividing lines are based on howthe OPVI scores are distributed around the average value of OPVI (refer to Appendix D).
• Low-OPVI countries – High economic capacity,or strength, to absorb oil price shocks,performing better, with high per capita GDP and economic growth rate, and with either low reliance on oil or a net exporter of oil
• Medium-OPVI countries – Medium economic capacity, or strength, to absorb oil price shocks, performing better with high or medium per capita GDP and economic growth rate, and either having a low reliance on oil or being a net exporter of oil
• High-OPVI countries – Low economic strength,low economic performance and high oil dependency
It should be noted that these OPVI scores and categories reflect the current position of thesecountries based on a limited set of variables.Theydo not consider future trends. Several countries,such as Iran and Malaysia, though currentlyamong the least vulnerable, could be consideredat future risk on account of their rapidly growingoil consumption relative to domestic supply.Similarly, Thailand and India could be at greaterrisk in the future given their persistently highdependence on imported oil. It should also be
Chapter 3: National vulnerability to oil price rises 49
Table 3-1 Ranking of countries based on weighted dimension scores and composite OPVI
Rank Countries OPVI Strength Performance Low-oil-growth Weighted Total Score
1 Iran 1.00 2.16 0.79 -0.15 2.81
2 China 0.78 0.87 0.50 0.40 1.77
3 Malaysia 0.72 1.06 0.51 -0.08 1.50
4 Bhutan 0.56 -0.20 0.25 0.70 0.75
5 India 0.49 -0.03 0.14 0.33 0.44
6 Papua New Guinea 0.46 0.81 -0.07 -0.45 0.30
7 Indonesia 0.45 0.32 0.03 -0.11 0.23
8 Thailand 0.44 0.23 0.17 -0.18 0.22
9 Mongolia 0.43 0.34 -0.23 0.07 0.18
10 Viet Nam 0.42 -0.18 0.53 -0.26 0.10
11 Myanmar 0.40 0.08 -0.27 0.20 0.01
12 Philippines 0.39 0.14 -0.13 -0.05 -0.04
13 Afghanistan 0.38 -0.24 -0.20 0.38 -0.06
14 Nepal 0.38 0.41 -0.47 -0.01 -0.07
15 Bangladesh 0.34 -0.08 -0.41 0.24 -0.25
16 Pakistan 0.34 -0.22 -0.17 0.14 -0.25
17 Lao PDR 0.31 -0.55 -0.25 0.40 -0.39
18 Fiji 0.28 -0.12 -0.11 -0.31 -0.55
19 Samoa 0.24 -0.05 -0.51 -0.17 -0.73
20 Sri Lanka 0.18 -0.81 0.00 -0.18 -0.99
21 Solomon Islands 0.18 -0.52 -0.20 -0.29 -1.01
22 Cambodia 0.17 -0.36 -0.53 -0.16 -1.05
23 Vanuatu 0.17 -0.30 -0.45 -0.32 -1.07
24 Maldives 0.00 -2.76 1.08 -0.16 -1.84
Economic strength,
economic performance
and low-oil-growth form
major aspects of a
country’s oil price
vulnerability
Least vulnerableMediumMost vulnerable
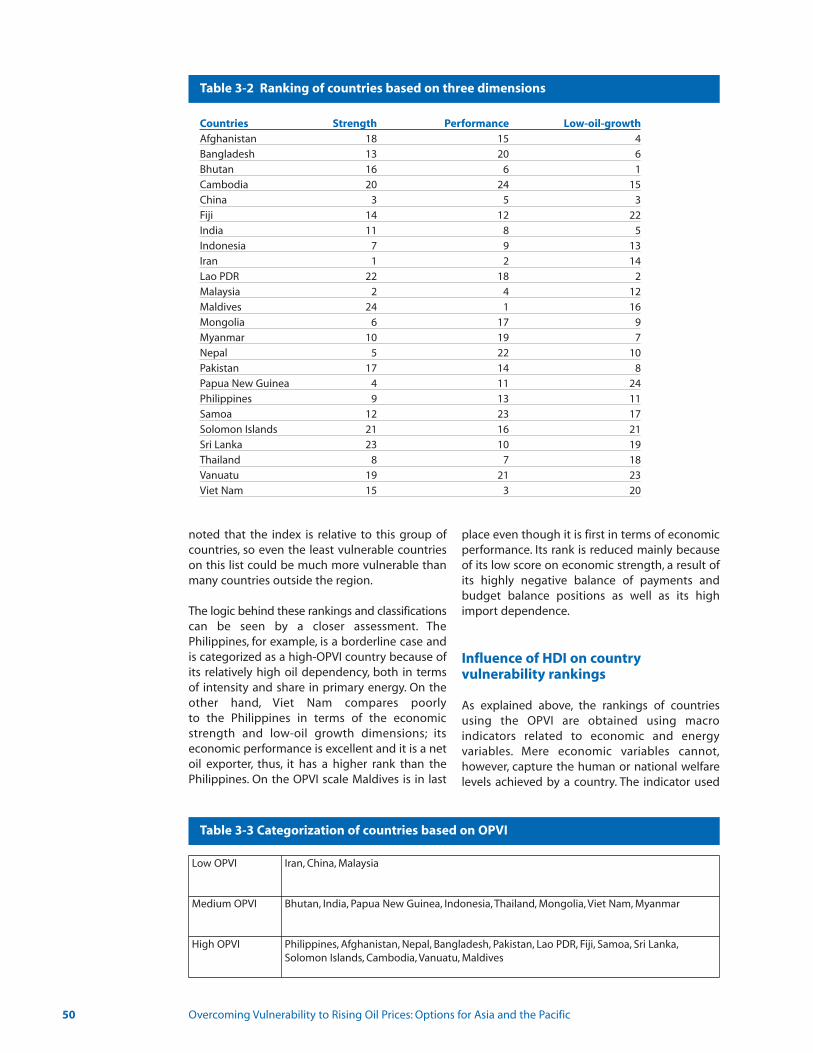
noted that the index is relative to this group ofcountries, so even the least vulnerable countrieson this list could be much more vulnerable thanmany countries outside the region.
The logic behind these rankings and classificationscan be seen by a closer assessment. ThePhilippines, for example, is a borderline case andis categorized as a high-OPVI country because ofits relatively high oil dependency, both in termsof intensity and share in primary energy. On theother hand, Viet Nam compares poorly to the Philippines in terms of the economicstrength and low-oil growth dimensions; its economic performance is excellent and it is a netoil exporter, thus, it has a higher rank than thePhilippines. On the OPVI scale Maldives is in last
place even though it is first in terms of economicperformance. Its rank is reduced mainly becauseof its low score on economic strength, a result ofits highly negative balance of payments andbudget balance positions as well as its highimport dependence.
Influence of HDI on country vulnerability rankings
As explained above, the rankings of countriesusing the OPVI are obtained using macro indicators related to economic and energy variables. Mere economic variables cannot,however, capture the human or national welfarelevels achieved by a country. The indicator used
50 Overcoming Vulnerability to Rising Oil Prices: Options for Asia and the Pacific
Table 3-2 Ranking of countries based on three dimensions
Table 3-3 Categorization of countries based on OPVI
Countries Strength Performance Low-oil-growthAfghanistan 18 15 4
Bangladesh 13 20 6
Bhutan 16 6 1
Cambodia 20 24 15
China 3 5 3
Fiji 14 12 22
India 11 8 5
Indonesia 7 9 13
Iran 1 2 14
Lao PDR 22 18 2
Malaysia 2 4 12
Maldives 24 1 16
Mongolia 6 17 9
Myanmar 10 19 7
Nepal 5 22 10
Pakistan 17 14 8
Papua New Guinea 4 11 24
Philippines 9 13 11
Samoa 12 23 17
Solomon Islands 21 16 21
Sri Lanka 23 10 19
Thailand 8 7 18
Vanuatu 19 21 23
Viet Nam 15 3 20
Low OPVI Iran, China, Malaysia
Medium OPVI Bhutan, India, Papua New Guinea, Indonesia, Thailand, Mongolia, Viet Nam, Myanmar
High OPVI Philippines, Afghanistan, Nepal, Bangladesh, Pakistan, Lao PDR, Fiji, Samoa, Sri Lanka,Solomon Islands, Cambodia, Vanuatu, Maldives

for this purpose is the Human DevelopmentIndex (HDI). An attempt has been made here,therefore, to incorporate the HDI as a ninth variable. The ranking of countries based on thisOPVI is presented in Table 3-4 along with therankings obtained earlier.
Clearly, the countries with higher HDI levels haveimproved their rankings whereas countries withpoor HDIs have worsened their rankings.Maldives, which was ranked last on the OPVIbased only on macro indicators, improves its rankto 13. On the other hand, India’s rank falls from 5to 9. Countries such as Fiji, Philippines, Sri Lanka,Thailand and Viet Nam improve their rankings,
whereas all the South Asian countries (except SriLanka) along with Lao PDR, Myanmar andMongolia drop in the ranking. Iran remains at thetop because of its strong macroeconomic indicators. This is also the case with China andMalaysia, which interchange positions.
As the OPVI and earlier sections of this chapterhave shown, a number of countries in the regionare very vulnerable to oil price rises, and theycould become even more vulnerable in thefuture. What can they do to reduce this vulnerability? That is the subject of the next chapter.
Chapter 3: National vulnerability to oil price rises 51
Table 3-4 OPVI ranking of countries with and without the influence of HDI
Endnotes1 The analysis earlier had concluded that the variables in the ‘Strength’ dimension accounted for 33 percent of the variance; those in the
‘Performance’ dimension for 23 percent; and those in the ‘Low-oil growth’ dimension for 19 percent. The dimension scores were therefore
weighted accordingly to produce the weighted total score shown in the last column of Table 3-1.
2 Dimension index = Dimension value – minimum value
Maximum value – minimum value
Countries OPVI rank without HDI OPVI rank with HDI
Afghanistan 13 23
Bangladesh 15 21
Bhutan 4 11
Cambodia 22 24
China 2 3
Fiji 18 10
India 5 9
Indonesia 7 6
Iran 1 1
Lao PDR 17 22
Malaysia 3 2
Maldives 24 13
Mongolia 9 12
Myanmar 11 15
Nepal 14 18
Pakistan 16 17
Papua New Guinea 6 8
Philippines 12 7
Samoa 19 16
Solomon Islands 21 19
Sri Lanka 20 14
Thailand 8 4
Vanuatu 23 20
Viet Nam 10 5
A number of countries in
the region are very
vulnerable to oil price rises,
and could become even
more so in the future
Least vulnerableMediumMost vulnerable

Chapter 4: Options for reducing oil price vulnerability
4Rising oil prices can create a number of problems.They can, for example, increase inflation and putpressure on foreign exchange reserves. They canalso create difficulties for poor households bypushing up the prices of kerosene and LPG, andfor poor farmers through higher prices for fertilizers. This, in turn, creates problems for governments that wish to protect their citizensthrough subsidies. How can governmentsrespond? This chapter outlines five strategicdirections. The first pertains to managing the economic costs of oil price volatility and how thiscan be handled in the short run through a basketof fiscal and financial instruments. The secondlooks at the supply side, covering both domesticand other sources of oil. The third and fourthstrategies both focus on reducing the demand foroil: one through reducing oil intensity, the otherthrough diversifying to other fuels. The fifth strategy deals with emergency responses.
Managing oil price risk
Many governments have shielded consumersfrom the effects of oil price rises through a seriesof pricing measures that have regulated the‘pass-through’. These measures, which are summarized in Table 4-1, include the following:
Subsidies
Governments often subsidize petroleum products, commonly household fuels such askerosene and LPG but also, in some cases,transportation fuels. This, however, can be verycostly. Thailand, for example, introduced priceceilings for petroleum products in January 2004,most of which continued until October 2004, andceilings for diesel until February 2005, resulting ina subsidy bill for that period of around US$2.2 billion (ESMAP 2006b). Indonesia had a similarprogramme, which in 2005 produced a subsidybill of about US$9.9 billion. An IMF study
concluded that for a range of countries subsidyexpenditures could be higher than health andeducation expenditures combined (IMF 2006d).
On the other hand, the case studies in this reportalso point to the adverse consequences of completely withdrawing subsidies on householdpetroleum products, particularly kerosene, sincethis may push poor households back down theenergy ladder to traditional fuels.
Governments will therefore want to ensure thatsubsidy programmes are well managed andaccurately targeted for the poor. Malaysia, forexample, in 2006 launched a smart-card schemetargeted at public transport operators and fishermen, giving them access to subsidiesthrough a monthly quota based on vehicle category or boat size. Lessons may also belearned from outside the region. Brazil, for example, progressively limited subsidies on LPGto only low-income consumers. This proved veryeffective and between 1960 and 2004 penetration of LPG increased from 18 percent to98 percent (Modi et al. 2005). Other optionsinclude giving fewer subsidies for petroleum-based fuels and more for the capital costs ofinstalling renewable technologies, as explored inthe next chapter. Of course, the most enduringsolution would be to reduce levels of poverty sothat subsidies would be unnecessary.
Tax adjustment
Because many retail petroleum products,especially transportation fuels, can be quite heavily taxed, governments can smooth theprices for consumers by adjusting the rates of taxation. This has been the main form of adjustment in Bangladesh, for example, and LaoPDR. Following the recent oil price rise, more governments have resorted to tax adjustmentsrather than subsidies.
Options for reducing oil price vulnerability
What should countries do in response to rising oil prices? Clearly they will want to boost supplies and restrain demand. But they will also need to find ways of managing oil price riskswhile, at the same time, preparing for potential oil shocks. This chapter reviews some of themain options and the experience of the Asia-Pacific region in implementing them.

54 Overcoming Vulnerability to Rising Oil Prices: Options for Asia and the Pacific
Price restraint
Some governments have passed the subsidy burden on to the private sector, requiring companies to absorb international oil priceincreases. In China, India and Sri Lanka,for example, governments have obliged companies in the downstream oil sector to sell atlower prices. Similarly, in Indonesia, Pakistan, thePhilippines and Thailand, governments have usedtheir influence on the oil sector to keep petroleum product prices low.
Compensation schemes
If prices go up or subsidies are reduced,governments can try to offset the impact on thepoor by compensating them in various ways.Indonesia, for example, after reducing subsidieson petroleum products in 2005, redirected someof the savings to a cash transfer programme forthe poor of about US$30 per household everythree months, as well as to poverty reduction programmes in education, rural developmentand health. China too has, in some provinces,briefly introduced cash transfer schemes to helptide consumers over rising oil prices.Governments also may consider that other safetynet programmes offer good opportunities for targeting. Sri Lanka, for example, has a foodstamps programme that is substantially bettertargeted than those for kerosene subsidies (IMF 2006d).
A number of countries in the region have appliedone or more of these pricing-related measures(Table 4-1). The guiding principles for theseshould be efficiency, equity, and effective revenue-raising, while also taking opportunitiesto reduce environmental impacts, for example,through higher taxes on gasoline for private cars.
Using financial tools
As well as being concerned about the level ofprices, policy makers will also be worried abouttheir volatility and the potential for suddenshocks. To cushion against these, governmentsand companies have at their disposal a variety ofsophisticated financial products that they canbuy and sell to enable them to offset the risks ofsudden fluctuations. These derivatives take various forms, including ‘forwards,’ ‘futures,’‘options’ and ‘swaps,’ all of which can dampen theimpact of price fluctuations. However, they arerelevant largely in the short-term context, and allinvolve certain speculative risks of their own.
A number of African countries, includingMauritius and Cameroon, have used such market-based energy risk management tools. Butcountries in the Asia-Pacific region have seldomadopted these measures, probably because theiroil markets have been dominated by state-owned oil companies and utilities. Morerecently, however, a process of deregulation hasencouraged new risk management initiatives(Fusaro 2003). Some major corporate oil consumers in the region have also been usingthese tools. Airlines such as Cathay Pacific,Singapore Airlines and Malaysia Airlines usederivatives to hedge their jet fuel exposure.These measures are of course more appropriate for smoothing out prices and do not assist much with long-term price issues. It also seemsthat the use of such instruments is more relevantto major corporate consumers than to national governments.
In addition to market-based tools, governmentsalso have a number of other options for copingwith oil price volatility. These include:
Table 4-1 Price-based responses in selected countries
Source: ESMAP 2006a
Subsidies Tax adjustment Price restraint Compensationschemes
Bangladesh
China
India
Indonesia
Lao PDR
Malaysia
Pakistan
Philippines
Sri Lanka
Thailand
Viet Nam
üüü
üü
ü
ü
üü
üüüüüüü
üüü
üüüü
ü
ü
ü
üü
Governments can try to
offset the impact of price
rises by compensating the
poor in various ways

• Stabilization funds – These can be used by both oil exporters and importers. Based on pre-determined rules, exporters will pay into the fund when prices are high and can withdraw from it when prices are lower.Importers do the opposite. Norway, for example, in 1990, established a State Petroleum Fund to transfer wealth from oil and gas reserves to a broad-based portfolio of international securities. As well as acting as a form of savings, this also distributes wealth across generations. Management of the fund is outsourced but operates under government guidelines. Oil importers have also used such funds to stabilize retail prices.Namibia, for example, has imposed on consumers an ‘equalization levy’ for every litre of diesel and petrol they buy – money which is transferred to a National Energy Fund.Within the region, Thailand established an oil price stabilization fund in 2004 to finance oil price subsidies. While the initial large demand upon the fund has subsided because of the subsequent removal of diesel and gasoline subsidies, the fund remains an
important source of financing for LPG subsidies of about US$12.6 million a month (ADB 2005). India and the Philippines have had such funds, but these have now been suspended. Stabilization funds can be valuable, but they can also be difficult and expensive to operate and are probably best suited for addressing short– to medium-term oil price shocks.
• Long-term contracts – Countries may also shield themselves from short-term fluctuations in oil prices by engaging in long-term contracts based on prices that are either fixed or adjustable within agreed ceilings and targets. Most of the trade in natural gas uses such contracts, but they are less common in the oil sector where, even in long-term contracts, the prices are linked to market prices. At present, however, there seems to be a move away from long-term contracts even for natural gas and crude oil,so this does not seem like a useful immediate option.
Chapter 4: Options for reducing oil price vulnerability 55
Table 4-2 Priority policy actions towards managing oil price risk
Countries Legislative and regulatory measures
Fiscal, financial andinstitutional measures
Direct public investment
Pricing of petroleumproducts
• Regulate pricing policies such that while the interests of the poor are protected, leakages to the non-poor are prevented.
• Regulate policies for oil-intensive sectors such as fertilizers.
• Mandate pricing based fiscal measures to manage oil price risk.
• Promote investments to develop integrated transport plans to ensure effective utilization of petroleum products.
Targeting oil subsidies • Mandate policies that prevent leakages of subsidies.
• Explore options of substitution of the petroleum subsidies with capital subsidies topromote renewable forms of energy.
• Explore policy options which enhance purchasing power of the people to ensure access and affordability of people.
• Use targeted subsidies on household fuels (LPG, kerosene)to shield consumers from thefull impact of oil price rise.
• Implement cash compensation schemes to cushion the impacts.
• Ration subsidized fuels through a monthly quota (e.g., smart card scheme in Malaysia targeting transport operators and fishermen).
• Develop institutional arrangements and infrastructure for implementation of smart cards for disbursement of subsidies to eligible families.
Financial tools • Promote the usage of the Oil Stabilization Fund, which can transfer the oil price benefits to the fund and from there to the budget when prices rise.
• Promote usage of long-term,market-based energy risk management tools.
• Combine financial instruments such as forwards, futures,options and swaps (increasingly used to manage oil price risk) with caps, collars and floors.
• Introduce compensatory financing to allow countries to borrow on concessional terms.
• Undertake investments in sectors that can enhance income levels of the people by ensuring livelihood opportunities.
• Put in place institutional arrangements for the efficient adoption of various financial tools for oil price risk management.
Enhancing oil supply
Although the supply of oil is finite, governmentsin the region can take a number of measures toenhance supplies. These, which are summarizedin Table 4-3, include the following:
Strengthening oil exploration and extraction
Higher prices can spur the search for new sourcesor encourage the exploitation of those hithertounattractive. Some of the region’s existing producers are now developing new fields.In Viet Nam, for example, exploration activitieshave been yielding results: in October 2004,a joint venture comprising AmericanTechnologies, Petronas, Singapore Petroleum andPetro Vietnam announced a 100-million-barrel oil discovery off the country’s northeast coast.The Philippines too, though having only smallreserves, in its Energy Plan 2005, stressed intensive promotion of oil and gas exploration.And the government of Sri Lanka is increasinglypinning its hopes on oil and gas discovery:In October 2005, it formed a new Ministry forPetroleum Resources Development to invite bidsfor oil and gas exploration (ESMAP 2006a).
A number of oil-producing countries have alsobeen simplifying their procedures and dismantling national monopolies in order toencourage greater private investment, includingforeign investment. Indonesia, for example, hasbeen limiting the control over oil sectordevelopment that was previously the preserve ofPertamina, the state-owned oil company. AndPakistan has executed production sharing agreements with exploration companies based inAustria, France and Malaysia. These measuresoffer considerable potential for LDCs in particular,since as well as bringing in capital investment,they also free up state resources for investment inthe social sector.
High oil prices have induced some regional countries who are not oil producers to redoubletheir efforts to discover resources, especially offshore. The main strategies in Sri Lanka and thePhilippines, for example, involve oil and gasexploration.
Countries can also take advantage of newtechnology to expand options, enabling companies to carry out more offshore drilling andmake better use of unconventional sources, ashas been done with tar sands in Canada and veryheavy oil in Venezuela. These newer resourcesmay be more expensive to exploit, but higher oilprices are making them more viable. New technology can also boost production at existing
sites where rates of recovery are quite low.Globally, the average recovery rate is 35 percent,but in India, for example, it is 30 percent, and inIran only 24 to 27 percent.
Increasing refining capacity
Another important way of enhancing supplies ofpetroleum products is to increase the capacity ofrefineries, as has been happening in China, India,Malaysia and Singapore. But it is also important toensure that new refineries can process heavy sourcrudes, which are cheaper and more readily available, while meeting the demand for lighterproducts such as transportation fuels, andaccommodating environmental requirements.
To refine heavier sour crudes, European and USrefineries have been adding catalytic and hydro-cracking capacities. Asian refineries havealso been doing so, but more slowly. China hasbeen upgrading its refineries for this purpose,and in India, Reliance Petroleum is in the processof establishing a new 29-million-tonne refinery,capable of processing the heaviest and sourest ofcrude oils from the Middle East into high-qualityrefined products, primarily for export. This willbenefit not only India but also the region’s LDCs,which will have a new source of supply reasonably close to home and thus with lowertransport costs. Building this kind of capacity is,however, expensive and time-consuming and hasa high import requirement, so it will likely fall outside the reach of most of the poorer countries.
Diversifying sources of oil
Some economies in the regions that have sufficient demand can widen their range of supply sources, in three main ways:
• Invest in foreign oil fields – India and China,mostly through state-owned companies,have already been investing in oil extraction in other countries. The China National Petroleum Corporation, for example, has invested in a number of countries, including Kazakhstan and Myanmar (ESMAP 2006a).
• Diversify import sources – One way of reducing vulnerability to oil supply disruptions is to diversify sources of imports. For crude supplies, most Asian countries will continue to depend largely on the Middle East, which is geographically the closest, but they could also diversify to some extent to Russia,Central Asia and Africa. This would reduce risks and also increase competition (APERC 2003). Maintaining oil price stability will also depend on regional and international
56 Overcoming Vulnerability to Rising Oil Prices: Options for Asia and the Pacific
Some of the region’s
existing producers are now
developing new oil fields
cooperation among consuming countries, as well as on continuing dialogues between producers and consumers. Some importing countries have, for example, started negotiating price discounts or concessionary financing terms with oil producers.For example, Bangladesh, in March 2006,made an agreement with Kuwait and the UnitedArab Emirates to buy oil on concessionary terms. India has mooted the idea of limitingprice volatility through an agreementbetween producers and consumers on a priceband mechanism. Another option is to makebulk purchases: Honduras, for instance,recently announced such a government-supervised scheme. The Pacific IslandCountries are currently discussing a joint procurement arrangement that could gainthem price discounts on bulk purchases.
• Cross-border trade – There are also opportunities for diversifying sources of oil by tapping the region’s own oil resources through regional cooperation and mutually beneficial trade with neighbouring countries.On the one hand, the region has many consuming countries, which need to ensure the security, stability and sustainability of their oil supplies. These include the large oil consumers, China and India, as well as relatively smaller consumers ranging from Pakistan, Sri Lanka and Thailand to the mainly traditional energy consumers like Lao PDR and Cambodia. At the same time, the region also has a number off crude oil exporters – including Myanmar, Malaysia, Indonesia,Papua New Guinea and Viet Nam. Both
consuming and producing countries could therefore explore a common policy platform of Asian oil security, while bearing in mind the need to diversify sources of oil imports as well as sources of energy. This is especially important for LDCs, which have limited capacity to cushion themselves against supply bottlenecks and price barriers.Cross-border trade in oil could be promoted through mutually beneficial bilateral agreements. For this purpose, the oil sector could also learn from existing forms of regional cooperation for gas and electricity (Box 4-1).
Engaging in barter
The demand for oil is so large and persistent thatmany countries would do well to acquire it byexchanging their own exports directly. Barteringis a particularly useful option for countries thatare short of US dollars, but other countries toocan benefit from the reduced transaction costs.
Countries could, for example, trade manufacturedproducts or industrial crops for oil, arranging toget most grades of oil, most of the time, at thebest available exchange ratios. They could alsooffer services. A number of oil-producing countries, especially those in Africa, lack the fundsor knowledge to develop their infrastructure,while many Asian oil-consuming developingcountries like China and India, which are struggling with high oil prices, can offer largepools of highly capable professionals and technical knowledge in exchange for oil.
Chapter 4: Options for reducing oil price vulnerability 57
Box 4-1 Energy cooperation: Examples from gas and electricity
Most energy resources yield optimal benefits when exploited by two or more nations, especially when they are relatively smalland the resources are distributed across several countries. The hydroelectric potential of a river valley system,for example, can be exploited by several countries, and gas grids can connect several national markets. Such systems makebetter use of capacity and reduce costs.
There already exist some examples in the Asia-Pacific region. Bhutan and India have arrangements for hydropower, as do LaoPDR and Thailand, and following the discovery of 10 gas fields, Thailand and Malaysia have agreed on a Joint DevelopmentArea. In addition, for gas, Indonesia has agreements with the Philippines, Thailand and Singapore.
Now there is also an example for oil. Early in 2006,Timor-Leste signed a politically significant agreement with Australia to shareequally the oil and gas revenues in a disputed territory that includes the Greater Sunrise gas field.
Transportation of liquefied natural gas over long distances requires dedicated reserves and significant investment in infrastructure. But these can bring substantial economic benefits, as with the 8,000-kilometre Trans-Asian gas pipeline systemthat links East Asian markets. In this context, ASEAN's Regional Power Grid and Trans-ASEAN Gas Pipeline (TAGP) are important initiatives that can promote cross-border trade and cooperation for greater regional energy security. The TAGP isexpected to build on existing national grids and bilateral pipeline connections, which at present connect Indonesia andMalaysia to Singapore, Myanmar to Thailand, and the delivery of gas to Malaysia and Thailand from the Malaysia-Thailand JointDevelopment Area.
Bartering of manufactured
products, services or
technical knowledge in
exchange for oil is
a particularly useful option
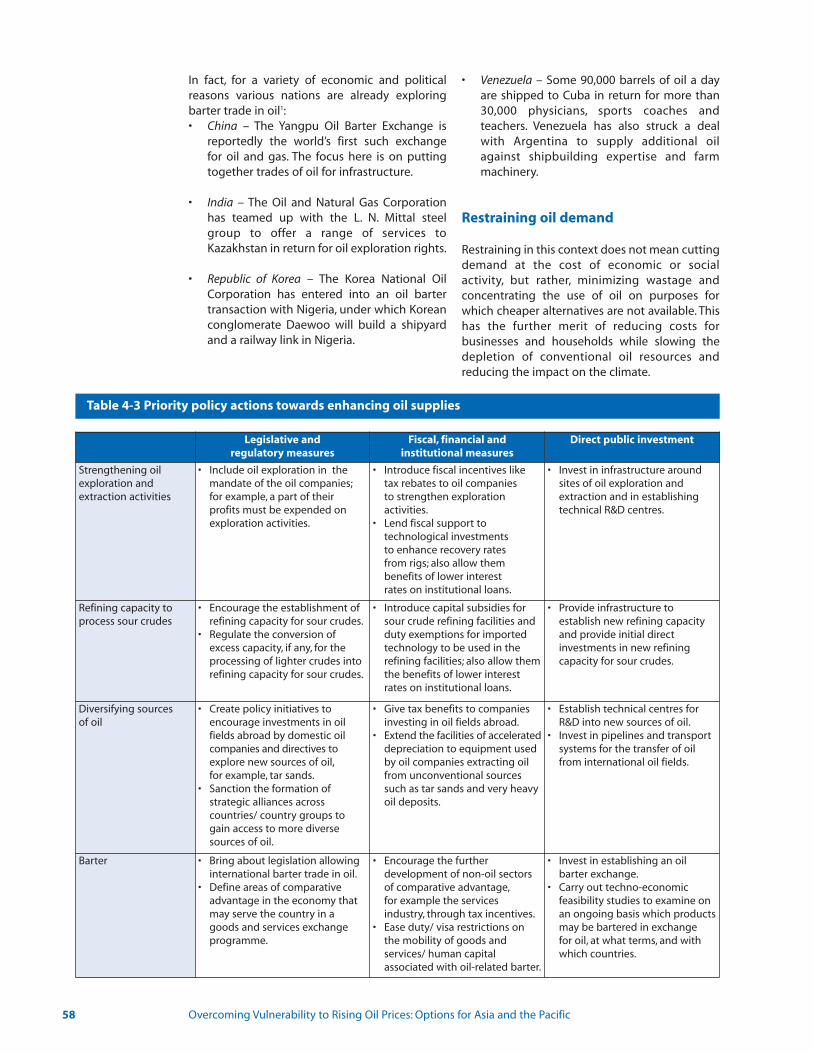
In fact, for a variety of economic and political reasons various nations are already exploringbarter trade in oil1:• China – The Yangpu Oil Barter Exchange is
reportedly the world’s first such exchangefor oil and gas. The focus here is on putting together trades of oil for infrastructure.
• India – The Oil and Natural Gas Corporation has teamed up with the L. N. Mittal steel group to offer a range of services to Kazakhstan in return for oil exploration rights.
• Republic of Korea – The Korea National Oil Corporation has entered into an oil barter transaction with Nigeria, under which Korean conglomerate Daewoo will build a shipyard and a railway link in Nigeria.
• Venezuela – Some 90,000 barrels of oil a day are shipped to Cuba in return for more than 30,000 physicians, sports coaches and teachers. Venezuela has also struck a deal with Argentina to supply additional oil against shipbuilding expertise and farm machinery.
Restraining oil demand
Restraining in this context does not mean cuttingdemand at the cost of economic or social activity, but rather, minimizing wastage and concentrating the use of oil on purposes forwhich cheaper alternatives are not available. Thishas the further merit of reducing costs for businesses and households while slowing thedepletion of conventional oil resources andreducing the impact on the climate.
58 Overcoming Vulnerability to Rising Oil Prices: Options for Asia and the Pacific
Table 4-3 Priority policy actions towards enhancing oil supplies
Legislative andregulatory measures
Fiscal, financial andinstitutional measures
Direct public investment
Strengthening oil exploration and extraction activities
• Include oil exploration in the mandate of the oil companies;for example, a part of their profits must be expended on exploration activities.
• Introduce fiscal incentives like tax rebates to oil companies to strengthen exploration activities.
• Lend fiscal support to technological investments to enhance recovery rates from rigs; also allow them benefits of lower interest rates on institutional loans.
• Invest in infrastructure around sites of oil exploration and extraction and in establishing technical R&D centres.
Refining capacity toprocess sour crudes
• Encourage the establishment of refining capacity for sour crudes.
• Regulate the conversion of excess capacity, if any, for the processing of lighter crudes into refining capacity for sour crudes.
• Introduce capital subsidies for sour crude refining facilities and duty exemptions for imported technology to be used in the refining facilities; also allow them the benefits of lower interest rates on institutional loans.
• Provide infrastructure to establish new refining capacity and provide initial direct investments in new refining capacity for sour crudes.
Diversifying sources of oil
• Create policy initiatives to encourage investments in oil fields abroad by domestic oil companies and directives to explore new sources of oil,for example, tar sands.
• Sanction the formation of strategic alliances across countries/ country groups to gain access to more diverse sources of oil.
• Give tax benefits to companies investing in oil fields abroad.
• Extend the facilities of accelerated depreciation to equipment used by oil companies extracting oil from unconventional sources such as tar sands and very heavy oil deposits.
• Establish technical centres for R&D into new sources of oil.
• Invest in pipelines and transport systems for the transfer of oil from international oil fields.
Barter • Bring about legislation allowing international barter trade in oil.
• Define areas of comparative advantage in the economy that may serve the country in a goods and services exchange programme.
• Encourage the further development of non-oil sectors of comparative advantage,for example the services industry, through tax incentives.
• Ease duty/ visa restrictions on the mobility of goods and services/ human capital associated with oil-related barter.
• Invest in establishing an oil barter exchange.
• Carry out techno-economic feasibility studies to examine onan ongoing basis which products may be bartered in exchange for oil, at what terms, and with which countries.
This process has already been underway in thebroader energy context, which includes oil.Between 1990 and 2002, energy efficiencyimprovements have helped reduce global energydemand by 20 percent (ENERDATA 2006). Overthis period, 15 European countries on averageimproved the energy efficiency of final consumers by 10 percent. While between 1990and 2003 their primary and final energy consumption increased by 0.9 percent per annum, their GDP grew twice as fast,demonstrating that economic activity had partially been decoupled from energy use.Around 10 percent of these gains came fromstructural changes in the economy toward lessenergy-intensive activities, often in the servicesector.
Asia-Pacific countries too have been improvingenergy efficiency. China has been leading theway: between 1990 and 2003, energy use per US$PPP GDP declined from 0.49 to 0.22 kilograms ofoil equivalent (kgoe) (World Bank 2006). India tooachieved a reduction over the same period, from0.25 to 0.18 kgoe, and Sri Lanka from 0.14 to 0.11kgoe. Their changes may be smaller than China'sbut are still impressive since these countries started from higher levels of efficiency. Manyother countries in the region have begun stressing energy efficiency and energy conservation. Indonesia, for example, has developed a Blueprint for Energy Management,while the Philippines has adopted an Energy Planto curtail the intensity of fossil fuel consumptionand help achieve energy independence. Chinaand India have also enacted laws to conserveenergy and have established accompanyingimplementation mechanisms.
There are four broad strategies for achievinggreater efficiency in oil use:
• Making structural changes – Shifting to less oil-intensive activities, from manufacturing to services, for example.
• Reducing oil intensity – Changing the patterns and practices of production and consumption to make them less oil intensive.
• Improving technology – Upgrading productionequipment and making consumer devices more energy-efficient.
• Substituting fuels – Displacing oil with other fuels.
The first three options are discussed in detail inthe sections below on transport, industry,agriculture and households. The issue of fueldiversification is discussed in two parts. The firstpart in this chapter concerns diversification usingfossil fuels.The second part, which forms the nextchapter, concerns renewable energy options.
The options for reducing oil intensity are summarized in Table 4-4.
Transport
Countries can develop strategies for reducingfuel consumption through, for example, inter-cityfreight transport plans, urban mobility plans thatcan involve inter-modal mass transit, and specificplans for targeted groups, such as youth andworkers.They can also promote better use of landand ‘smart growth’ that reduces urban sprawl andthe need for driving, while also reducing fuelwastage through real-time, congestion-basedroad pricing. All these methods also will have thebenefit of improving air quality.
Another set of options involves changing patterns and practices to reduce vehicle-kilometres travelled. These include adjusting fueland vehicle prices, improving mass transit services and promoting car-pooling and the useof smaller and more efficient vehicles. The government of Philippines, for example, has halted the purchase of new vehicles, optimizedoffice air conditioning and reduced official trips.Other options include promoting on-board fuel economy technology, encouraging telecommuting and motivating drivers to drivemore efficiently.
In an example from outside the region, Honduras,in May 2006, introduced several new measures tosave fuel costs. It changed fuel taxation toencourage fuel switching from gasoline with aresearch octane number of 95 to 87, and itordered the 60,000 state-owned vehicles to usethe cheapest fuel available and to circulate onalternate days depending on their license plates.Other ways to reduce energy intensity requirebetter technology. These would involve more efficient vehicles, including hybrid cars as well asinnovative structures and advanced materialssuch as lightweight steel and carbon-fibre composites. 'Intelligent highway systems’also cancontribute, along with telematic systems forfreight transport and more advanced technologyin railways, airplanes and marine transport.
Chapter 4: Options for reducing oil price vulnerability 59
New mass transit plans and
‘smart growth’ that reduces
urban sprawl can reduce
fuel costs and consumption
Some of these measures require major andpotentially disruptive technological adaptations.To cushion the immediate impact on economicactivity, these could be introduced in a phasedmanner. China, for example, is implementing fuelefficiency norms for passenger cars in two phases: Phase I was implemented in 2005/06,while Phase II will be implemented in 2008/09.
Industry
Many countries have been diversifying away fromindustries that are energy intensive, initiallyfocusing on industries linked, upstream or downstream, to energy production. When itcomes to energy-intensive products, they havebeen aiming to use a higher proportion of recycled materials. Within the electricity industry,some have been using a higher proportion ofrenewables and making efforts to manage peakelectricity demand. They have also been takingmeasures to improve energy efficiency elsewherewhile shifting from oil to other energy sources,particularly those like Lao PDR and Bhutan, whichhave considerable hydroelectric potential.
Some countries have also been trying to changeconsumption patterns, for example, through education campaigns that aim to reduce peakelectricity demand. In Viet Nam in 2005 and 2006,government agencies were asked to reduce fuelpurchase expenditures by 10 percent (ESMAP2006b). Countries in other regions, such asGuatemala, Honduras and Tunisia, have adopteddaylight saving time in summer to reduce electricity consumption. Moreover, in Tunisia thepublic sector is required to choose low-energyconsumption equipment and carry out annualenergy audits. Several other countries are providing tax incentives and publicity campaignsto promote the purchase of energy-efficientappliances or imposing a ban on the import andmarketing of inefficient appliances (ESMAP2006a).
Options for promoting more efficient use of energy include: offering tax rebates for energy-efficient technologies; raising taxes onenergy guzzlers; introducing programmes forbenchmarking and for appropriate labelling;improving building codes; and subsidizing energy audits. Industry and government can alsonegotiate voluntary agreements for improvingenergy efficiency and reducing energy-relatedgreenhouse gas emissions.
It is especially important to ensure effective programmes for testing the energy efficiency ofequipment and promoting energy efficiencystandards. Some countries in the region haveintroduced these but need to improve enforcement.
Countries can also make better use of new technologies, to improve the efficiency of, forexample, furnaces, boilers, burners, thermal insulation and steam networks, and to optimizeand integrate various processes. Other optionsinclude thermal cascading, district energyschemes and better energy recovery.
Agriculture
Energy efficiency in agriculture can be increasedby, for example, optimizing the use of oil-consuming agricultural machinery through cooperatives, reducing energy input per hectareand reclaiming marginal land for cultivation.There also exist possibilities for changing farmingpatterns and practices: encouraging farmers tooperate tractors and pumps more efficiently andmoving to night or drip irrigation. In the 1980s,Bangladesh imported from China many cheapbut inefficient diesel irrigation pump sets, but following rural electrification, has encouragedfarmers to switch to electric pump sets.
Households
Households can increase energy efficiency byworking together. Many have micro-enterprisesat home that they could combine as communityenterprises. They could also consider communitycooking.
Manufacturers likewise have an important part toplay in improving household energy use. Theycan offer more efficient appliances, including airconditioners, room heaters, electric irons, TV setsand motorized grinders. In many cases they do sovoluntarily, but can also be obliged to follow regulations based on standards and specifications.All equipment should be screened before it goeson sale, so that consumers can make choicesbased on energy efficiency.
For this to work, consumers will need to be sensitized to the benefits of buying energy-efficient equipment that may be slightly moreexpensive but will bring long-term savings. Inrural areas these will include more efficient stovesand better-designed kerosene lamps.
60 Overcoming Vulnerability to Rising Oil Prices: Options for Asia and the Pacific
Industries may benefit from
tax rebates for energy-
efficient technologies, as
well as subsidized
energy audits
Manufacturers have an
important part to play in
improving household
energy use, by offering
more efficient appliances
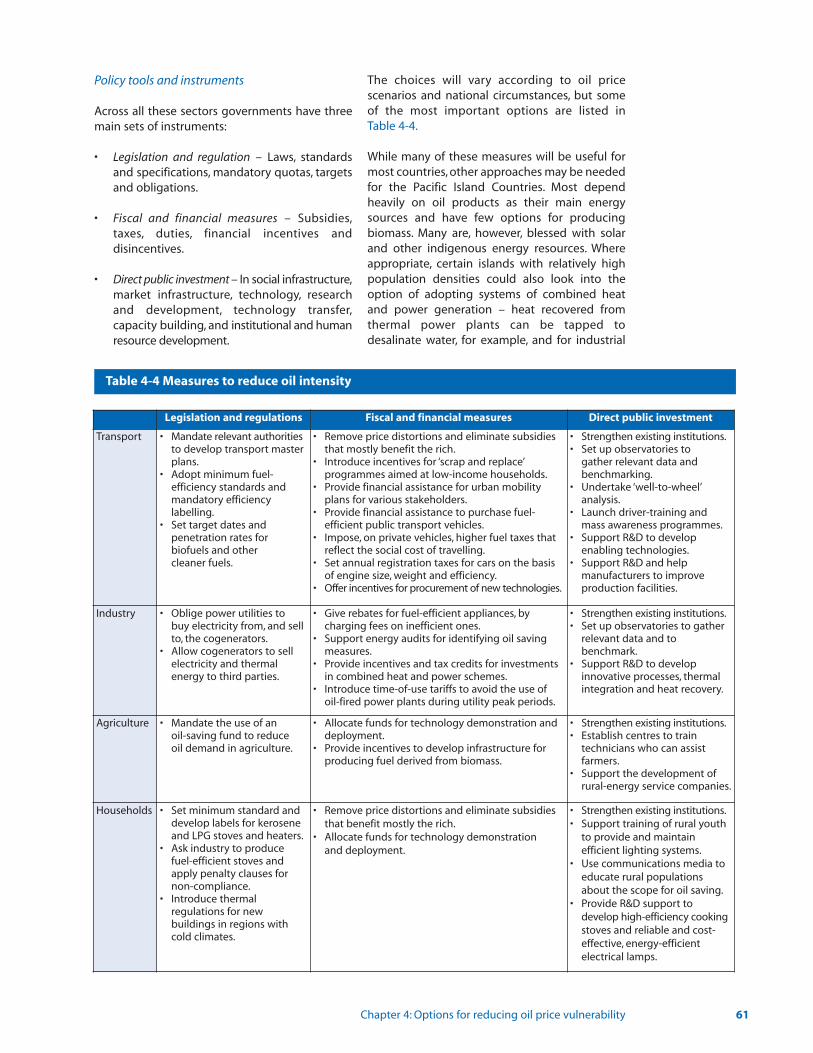
Policy tools and instruments
Across all these sectors governments have threemain sets of instruments:
• Legislation and regulation – Laws, standards and specifications, mandatory quotas, targets and obligations.
• Fiscal and financial measures – Subsidies,taxes, duties, financial incentives and disincentives.
• Direct public investment – In social infrastructure,market infrastructure, technology, research and development, technology transfer,capacity building, and institutional and human resource development.
The choices will vary according to oil price scenarios and national circumstances, but someof the most important options are listed inTable 4-4.
While many of these measures will be useful formost countries, other approaches may be neededfor the Pacific Island Countries. Most dependheavily on oil products as their main energysources and have few options for producing biomass. Many are, however, blessed with solarand other indigenous energy resources. Where appropriate, certain islands with relatively highpopulation densities could also look into theoption of adopting systems of combined heatand power generation – heat recovered fromthermal power plants can be tapped to desalinate water, for example, and for industrial
Chapter 4: Options for reducing oil price vulnerability 61
Table 4-4 Measures to reduce oil intensity
Legislation and regulations Fiscal and financial measures Direct public investment
Transport • Mandate relevant authorities to develop transport master plans.
• Adopt minimum fuel- efficiency standards and mandatory efficiency labelling.
• Set target dates and penetration rates for biofuels and other cleaner fuels.
• Remove price distortions and eliminate subsidies that mostly benefit the rich.
• Introduce incentives for ‘scrap and replace’programmes aimed at low-income households.
• Provide financial assistance for urban mobility plans for various stakeholders.
• Provide financial assistance to purchase fuel-efficient public transport vehicles.
• Impose, on private vehicles, higher fuel taxes that reflect the social cost of travelling.
• Set annual registration taxes for cars on the basis of engine size, weight and efficiency.
• Offer incentives for procurement of new technologies.
• Strengthen existing institutions.• Set up observatories to
gather relevant data and benchmarking.
• Undertake ‘well-to-wheel’analysis.
• Launch driver-training and mass awareness programmes.
• Support R&D to develop enabling technologies.
• Support R&D and help manufacturers to improve production facilities.
Industry • Oblige power utilities to buy electricity from, and sell to, the cogenerators.
• Allow cogenerators to sell electricity and thermal energy to third parties.
• Give rebates for fuel-efficient appliances, by charging fees on inefficient ones.
• Support energy audits for identifying oil saving measures.
• Provide incentives and tax credits for investments in combined heat and power schemes.
• Introduce time-of-use tariffs to avoid the use of oil-fired power plants during utility peak periods.
• Strengthen existing institutions.• Set up observatories to gather
relevant data and to benchmark.
• Support R&D to develop innovative processes, thermal integration and heat recovery.
Agriculture • Mandate the use of an oil-saving fund to reduceoil demand in agriculture.
• Allocate funds for technology demonstration and deployment.
• Provide incentives to develop infrastructure for producing fuel derived from biomass.
• Strengthen existing institutions.• Establish centres to train
technicians who can assist farmers.
• Support the development of rural-energy service companies.
Households • Set minimum standard and develop labels for kerosene and LPG stoves and heaters.
• Ask industry to produce fuel-efficient stoves and apply penalty clauses for non-compliance.
• Introduce thermal regulations for new buildings in regions with cold climates.
• Remove price distortions and eliminate subsidies that benefit mostly the rich.
• Allocate funds for technology demonstration and deployment.
• Strengthen existing institutions.• Support training of rural youth
to provide and maintain efficient lighting systems.
• Use communications media to educate rural populations about the scope for oil saving.
• Provide R&D support to develop high-efficiency cooking stoves and reliable and cost-effective, energy-efficient electrical lamps.
processes. In addition, electricity utilities on theislands can introduce pricing measures to reducepeak demand and, where feasible, distributeenergy-efficient appliances to households.
Diversifying fuels
Given that energy demands will continue to rise,particularly in developing countries, restrainingdemand for oil will have to be accompanied byefforts to switch in the medium and long termfrom oil to alternative energy sources, includinglarge hydro, coal, natural gas and renewable ener-gy technologies.These measures will, however, besubject to tradeoffs between the demands of efficiency, environmental protection, and equity.
Sustaining access to energy services and switchingfrom oil to domestic energy resources is alsodependent on accessing adequate capital andsometimes technology to expand domestic energy supply systems. Possible energy sector liberalization and associated trade in energy services may further support otherdomestic efforts.
Natural gas and coal
One of the most readily available options is natural gas. Between 2002 and 2030, the IEA (IEA2004b) expects gas consumption in developingAsia to more than triple, from about 208 to 672billion cubic metres (bcm). Most of the absolutedemand increase will be in East Asia, althoughIndia’s share will also increase significantly. Atpresent natural gas is not generally used forpower generation but is likely to be used more forthis purpose in future: in fact, about half of theincrease in gas consumption in Asia by 2030could be for power generation and some 23 percent for industry. Most of the increase in thegas trade in Asia is expected to be in the form ofliquefied natural gas.
The IEA expects gas flows into the Asia-Pacificregion in 2030 to be dominated by those fromthe Middle East, including 57 bcm per year to theRepublic of Korea, 44 bcm per year to India and13 bcm per year to China (IEA 2004b). The othermajor flows into the region are expected to befrom Russia, including 22 bcm per year to Japanand 19 bcm per year to China. The main sourceswithin the region will be Indonesia, which willexport 64 bcm per year to Japan, and Australia,which is expected to export around 40 bcm peryear to Japan.
Asian countries are adopting natural gas combined cycle (NGCC) power generation systems. These have low levels of pollutant emissions and high efficiencies: advanced NGCCs incorporating air or steam-cooled gas turbine blades and compressor inter-cooling areable to provide efficiencies beyond 55 percent.To achieve even higher efficiencies, new materialswill be needed that can withstand very high temperatures.
Another area in which natural gas will find wideapplication is the combined generation of heatand power, or ‘cogeneration.’ As gas pipelines getextended, cogeneration will be promoted forapplications where both heat and electricity canbe used on site, surplus electricity is exported tothe grid and surplus heat is fed into a districtheating network to meet industrial steam andcommercial cooling needs. The main targets inrecent years have been the new industrial orurban zones and airport complexes in countrieslike Malaysia and Thailand. Cogeneration can substantially reduce generation losses, with conversion efficiency of fuel to useful power andheat as high as 80 to 90 percent. Cogenerationalso has significant potential to reduce CO2
emissions.
A further option is to use hybrid cycles in whicheach cycle uses a different fuel. For example, agas-fired plant can be integrated into a coal-firedfacility. A heat recovery unit transfers heat fromthe exhaust of the gas turbine to the coal side ofthe process. This is more efficient and cost-effective than building separate units and is suitable for sites such as industrial estates thatrequire large quantities of high-pressure steam(Box 4-2).2
Gas will also be used more for transport. To lowerpollution in congested city centres many cities ofthe region are starting to use natural gas and liquefied petroleum gas as fuels for urban transportation.
For power generation many countries will also bemaking greater use of coal. In developing Asia,coal use for this purpose will almost quadruple by2030. Compared with other fossil fuels, however,coal presents significant environmental challenges. Some of the near-term promisingtechnologies for clean coal power generation arethe use of better materials, higher pressures andtemperatures, double reheating and reduction incondenser pressure. Technologies that are promising for higher power generation efficiencyinclude supercritical pulverized fuel technology,atmospheric fluidized bed combustion,
62 Overcoming Vulnerability to Rising Oil Prices: Options for Asia and the Pacific
Efforts must be made to
diversify to oil alternatives
such as hydropower, coal,
natural gas and renewable
energy technologies
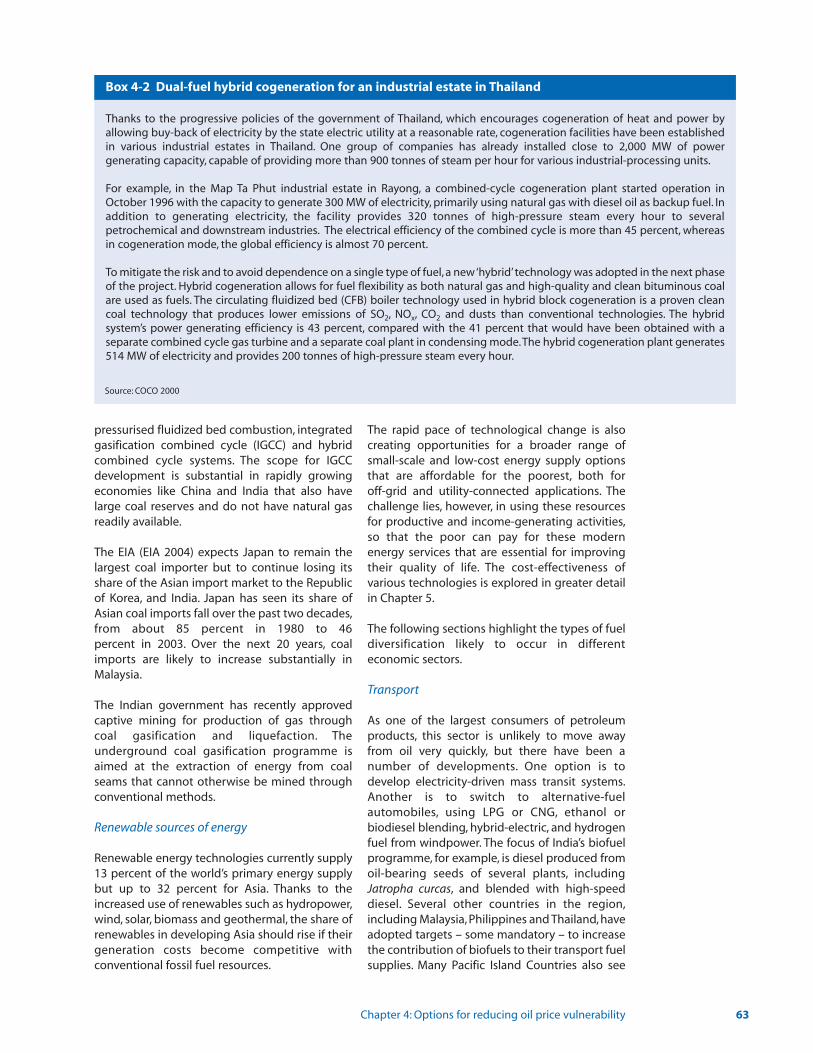
pressurised fluidized bed combustion, integratedgasification combined cycle (IGCC) and hybridcombined cycle systems. The scope for IGCCdevelopment is substantial in rapidly growingeconomies like China and India that also havelarge coal reserves and do not have natural gasreadily available.
The EIA (EIA 2004) expects Japan to remain thelargest coal importer but to continue losing itsshare of the Asian import market to the Republicof Korea, and India. Japan has seen its share ofAsian coal imports fall over the past two decades,from about 85 percent in 1980 to 46 percent in 2003. Over the next 20 years, coalimports are likely to increase substantially inMalaysia.
The Indian government has recently approvedcaptive mining for production of gas throughcoal gasification and liquefaction. The underground coal gasification programme isaimed at the extraction of energy from coalseams that cannot otherwise be mined throughconventional methods.
Renewable sources of energy
Renewable energy technologies currently supply13 percent of the world’s primary energy supplybut up to 32 percent for Asia. Thanks to theincreased use of renewables such as hydropower,wind, solar, biomass and geothermal, the share ofrenewables in developing Asia should rise if theirgeneration costs become competitive with conventional fossil fuel resources.
The rapid pace of technological change is alsocreating opportunities for a broader range ofsmall-scale and low-cost energy supply optionsthat are affordable for the poorest, both for off-grid and utility-connected applications. Thechallenge lies, however, in using these resourcesfor productive and income-generating activities,so that the poor can pay for these modern energy services that are essential for improvingtheir quality of life. The cost-effectiveness of various technologies is explored in greater detailin Chapter 5.
The following sections highlight the types of fueldiversification likely to occur in different economic sectors.
Transport
As one of the largest consumers of petroleumproducts, this sector is unlikely to move awayfrom oil very quickly, but there have been a number of developments. One option is to develop electricity-driven mass transit systems.Another is to switch to alternative-fuel automobiles, using LPG or CNG, ethanol orbiodiesel blending, hybrid-electric, and hydrogenfuel from windpower. The focus of India’s biofuelprogramme, for example, is diesel produced fromoil-bearing seeds of several plants, includingJatropha curcas, and blended with high-speeddiesel. Several other countries in the region,including Malaysia, Philippines and Thailand, haveadopted targets – some mandatory – to increasethe contribution of biofuels to their transport fuelsupplies. Many Pacific Island Countries also see
Chapter 4: Options for reducing oil price vulnerability 63
Box 4-2 Dual-fuel hybrid cogeneration for an industrial estate in Thailand
Thanks to the progressive policies of the government of Thailand, which encourages cogeneration of heat and power byallowing buy-back of electricity by the state electric utility at a reasonable rate, cogeneration facilities have been establishedin various industrial estates in Thailand. One group of companies has already installed close to 2,000 MW of power generating capacity, capable of providing more than 900 tonnes of steam per hour for various industrial-processing units.
For example, in the Map Ta Phut industrial estate in Rayong, a combined-cycle cogeneration plant started operation inOctober 1996 with the capacity to generate 300 MW of electricity, primarily using natural gas with diesel oil as backup fuel. Inaddition to generating electricity, the facility provides 320 tonnes of high-pressure steam every hour to several petrochemical and downstream industries. The electrical efficiency of the combined cycle is more than 45 percent, whereasin cogeneration mode, the global efficiency is almost 70 percent.
To mitigate the risk and to avoid dependence on a single type of fuel, a new ‘hybrid’technology was adopted in the next phaseof the project. Hybrid cogeneration allows for fuel flexibility as both natural gas and high-quality and clean bituminous coalare used as fuels. The circulating fluidized bed (CFB) boiler technology used in hybrid block cogeneration is a proven cleancoal technology that produces lower emissions of SO2, NOx, CO2 and dusts than conventional technologies. The hybrid system’s power generating efficiency is 43 percent, compared with the 41 percent that would have been obtained with a separate combined cycle gas turbine and a separate coal plant in condensing mode.The hybrid cogeneration plant generates514 MW of electricity and provides 200 tonnes of high-pressure steam every hour.
Source: COCO 2000
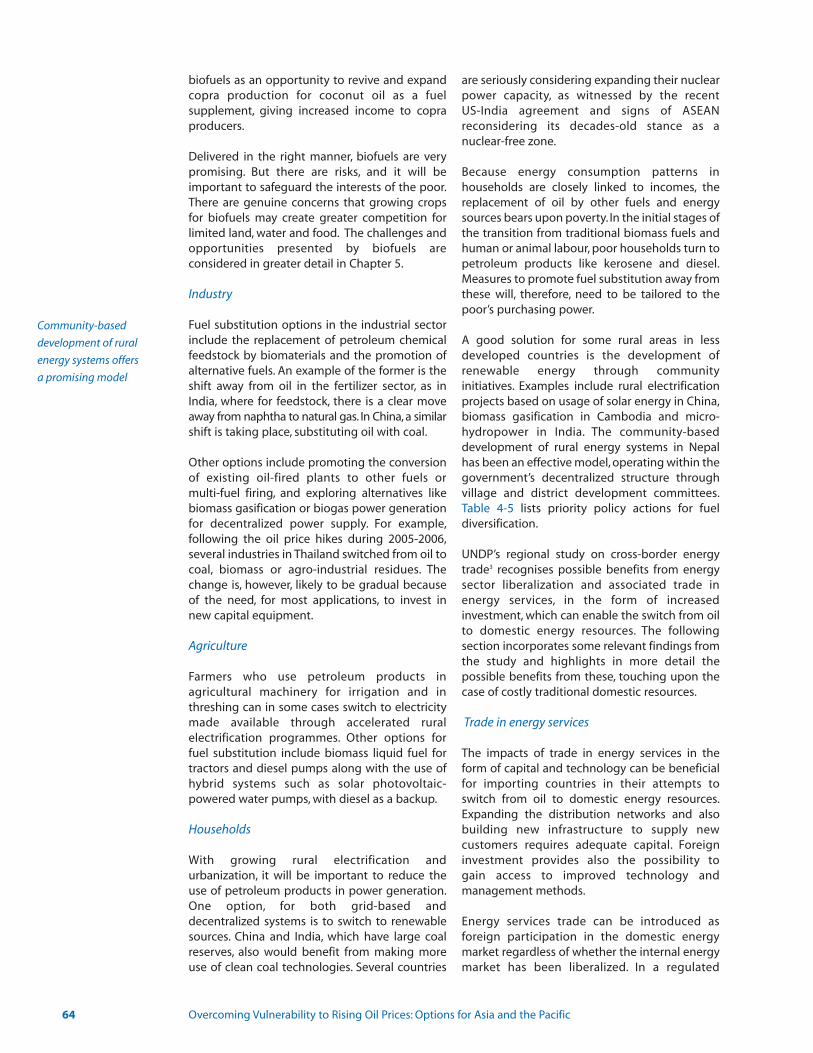
biofuels as an opportunity to revive and expandcopra production for coconut oil as a fuel supplement, giving increased income to copraproducers.
Delivered in the right manner, biofuels are verypromising. But there are risks, and it will be important to safeguard the interests of the poor.There are genuine concerns that growing cropsfor biofuels may create greater competition forlimited land, water and food. The challenges andopportunities presented by biofuels are considered in greater detail in Chapter 5.
Industry
Fuel substitution options in the industrial sectorinclude the replacement of petroleum chemicalfeedstock by biomaterials and the promotion ofalternative fuels. An example of the former is theshift away from oil in the fertilizer sector, as inIndia, where for feedstock, there is a clear moveaway from naphtha to natural gas. In China, a similarshift is taking place, substituting oil with coal.
Other options include promoting the conversionof existing oil-fired plants to other fuels or multi-fuel firing, and exploring alternatives likebiomass gasification or biogas power generationfor decentralized power supply. For example,following the oil price hikes during 2005-2006,several industries in Thailand switched from oil tocoal, biomass or agro-industrial residues. Thechange is, however, likely to be gradual becauseof the need, for most applications, to invest innew capital equipment.
Agriculture
Farmers who use petroleum products in agricultural machinery for irrigation and inthreshing can in some cases switch to electricitymade available through accelerated rural electrification programmes. Other options forfuel substitution include biomass liquid fuel fortractors and diesel pumps along with the use ofhybrid systems such as solar photovoltaic-powered water pumps, with diesel as a backup.
Households
With growing rural electrification and urbanization, it will be important to reduce theuse of petroleum products in power generation.One option, for both grid-based and decentralized systems is to switch to renewablesources. China and India, which have large coalreserves, also would benefit from making moreuse of clean coal technologies. Several countries
are seriously considering expanding their nuclearpower capacity, as witnessed by the recent US-India agreement and signs of ASEAN reconsidering its decades-old stance as a nuclear-free zone.
Because energy consumption patterns in households are closely linked to incomes, thereplacement of oil by other fuels and energysources bears upon poverty. In the initial stages ofthe transition from traditional biomass fuels andhuman or animal labour, poor households turn topetroleum products like kerosene and diesel.Measures to promote fuel substitution away fromthese will, therefore, need to be tailored to thepoor’s purchasing power.
A good solution for some rural areas in less developed countries is the development ofrenewable energy through community initiatives. Examples include rural electrificationprojects based on usage of solar energy in China,biomass gasification in Cambodia and micro-hydropower in India. The community-baseddevelopment of rural energy systems in Nepalhas been an effective model, operating within thegovernment’s decentralized structure throughvillage and district development committees.Table 4-5 lists priority policy actions for fuel diversification.
UNDP’s regional study on cross-border energytrade3 recognises possible benefits from energysector liberalization and associated trade in energy services, in the form of increased investment, which can enable the switch from oilto domestic energy resources. The following section incorporates some relevant findings fromthe study and highlights in more detail the possible benefits from these, touching upon thecase of costly traditional domestic resources.
Trade in energy services
The impacts of trade in energy services in theform of capital and technology can be beneficialfor importing countries in their attempts toswitch from oil to domestic energy resources.Expanding the distribution networks and alsobuilding new infrastructure to supply new customers requires adequate capital. Foreigninvestment provides also the possibility to gain access to improved technology and management methods.
Energy services trade can be introduced as foreign participation in the domestic energy market regardless of whether the internal energymarket has been liberalized. In a regulated
64 Overcoming Vulnerability to Rising Oil Prices: Options for Asia and the Pacific
Community-based
development of rural
energy systems offers
a promising model
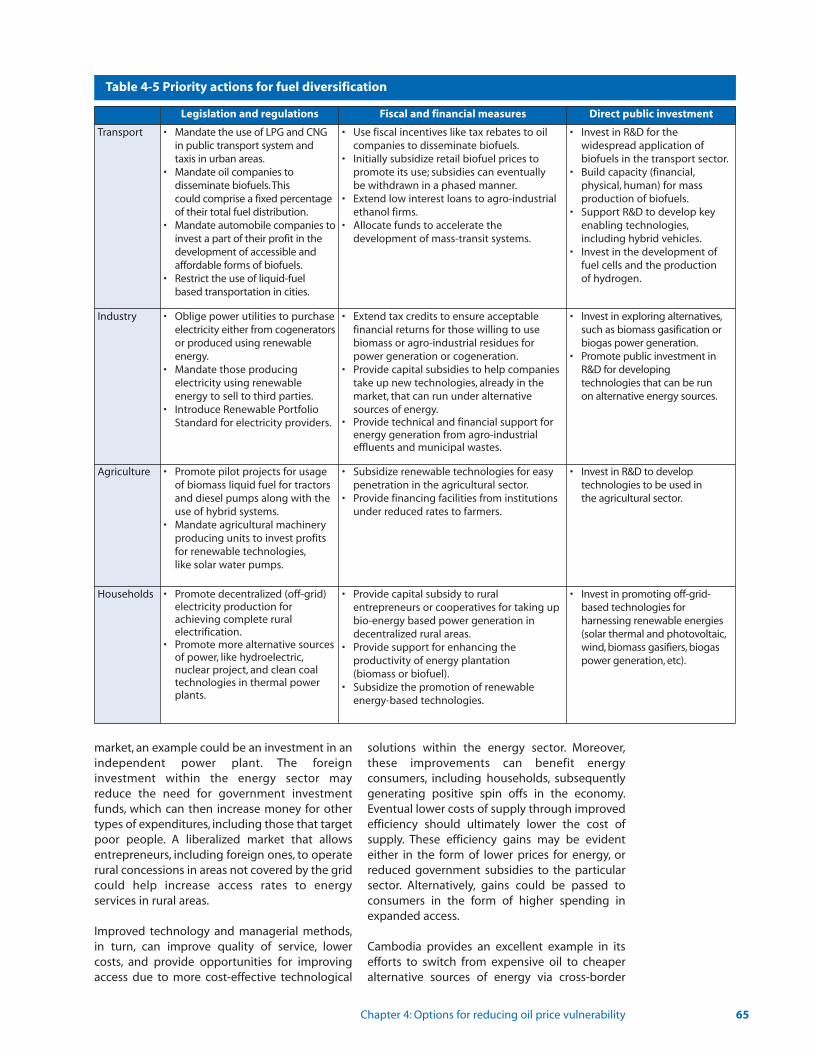
market, an example could be an investment in anindependent power plant. The foreign investment within the energy sector may reduce the need for government investmentfunds, which can then increase money for othertypes of expenditures, including those that targetpoor people. A liberalized market that allowsentrepreneurs, including foreign ones, to operaterural concessions in areas not covered by the gridcould help increase access rates to energy services in rural areas.
Improved technology and managerial methods,in turn, can improve quality of service, lowercosts, and provide opportunities for improvingaccess due to more cost-effective technological
solutions within the energy sector. Moreover,these improvements can benefit energy consumers, including households, subsequentlygenerating positive spin offs in the economy.Eventual lower costs of supply through improvedefficiency should ultimately lower the cost of supply. These efficiency gains may be evidenteither in the form of lower prices for energy, orreduced government subsidies to the particularsector. Alternatively, gains could be passed toconsumers in the form of higher spending inexpanded access.
Cambodia provides an excellent example in itsefforts to switch from expensive oil to cheaperalternative sources of energy via cross-border
Chapter 4: Options for reducing oil price vulnerability 65
Table 4-5 Priority actions for fuel diversification
Legislation and regulations Fiscal and financial measures Direct public investment
Transport • Mandate the use of LPG and CNG in public transport system and taxis in urban areas.
• Mandate oil companies to disseminate biofuels.This could comprise a fixed percentage of their total fuel distribution.
• Mandate automobile companies to invest a part of their profit in the development of accessible and affordable forms of biofuels.
• Restrict the use of liquid-fuel based transportation in cities.
• Use fiscal incentives like tax rebates to oil companies to disseminate biofuels.
• Initially subsidize retail biofuel prices to promote its use; subsidies can eventually be withdrawn in a phased manner.
• Extend low interest loans to agro-industrial ethanol firms.
• Allocate funds to accelerate the development of mass-transit systems.
• Invest in R&D for the widespread application of biofuels in the transport sector.
• Build capacity (financial,physical, human) for mass production of biofuels.
• Support R&D to develop key enabling technologies,including hybrid vehicles.
• Invest in the development of fuel cells and the production of hydrogen.
Industry • Oblige power utilities to purchase electricity either from cogeneratorsor produced using renewable energy.
• Mandate those producing electricity using renewable energy to sell to third parties.
• Introduce Renewable Portfolio Standard for electricity providers.
• Extend tax credits to ensure acceptable financial returns for those willing to use biomass or agro-industrial residues for power generation or cogeneration.
• Provide capital subsidies to help companies take up new technologies, already in the market, that can run under alternative sources of energy.
• Provide technical and financial support for energy generation from agro-industrial effluents and municipal wastes.
• Invest in exploring alternatives,such as biomass gasification or biogas power generation.
• Promote public investment in R&D for developing technologies that can be runon alternative energy sources.
Agriculture • Promote pilot projects for usage of biomass liquid fuel for tractors and diesel pumps along with the use of hybrid systems.
• Mandate agricultural machinery producing units to invest profits for renewable technologies,like solar water pumps.
• Subsidize renewable technologies for easy penetration in the agricultural sector.
• Provide financing facilities from institutions under reduced rates to farmers.
• Invest in R&D to develop technologies to be used inthe agricultural sector.
Households • Promote decentralized (off-grid) electricity production for achieving complete rural electrification.
• Promote more alternative sources of power, like hydroelectric,nuclear project, and clean coaltechnologies in thermal power plants.
• Provide capital subsidy to rural entrepreneurs or cooperatives for taking up bio-energy based power generation in decentralized rural areas.
• Provide support for enhancing the productivity of energy plantation (biomass or biofuel).
• Subsidize the promotion of renewable energy-based technologies.
• Invest in promoting off-grid-based technologies for harnessing renewable energies (solar thermal and photovoltaic,wind, biomass gasifiers, biogas power generation, etc).
trade. In addition, efforts are being made to relymore on domestic sources of energy,developed with the help of foreign investments(Box 4-3).
Costly domestic resources
A common strategy in many countries is an effortto rely more on domestic energy resources.Nevertheless, replacing oil by other fuels andenergy sources might not be the first option inthose countries where the poor rely on traditional biomass fuels. In many cases, withouttrade an energy supply system would be costlyand access to energy services would be restricted, either because prices are beyond thepoor, or because the sector's resources are sostretched as to limit investment in supply to thepoor. The initial stage of fuel diversification isthen more likely to be toward petroleum products as was discussed in the context of fueldiversification at the household level.
Therefore, expansion of access to petroleumproducts via trade can help lower the pressure onbiomass resources by reducing the use of fuelwood and charcoal, although the transitionaway from these fuels is often slow and influenced by a variety of economic and socialfactors.
Preparing for emergencies
Each country also needs to prepare for abruptdisruptions in oil supplies. This should involvemeasures to build strategic reserves as well asplans to make rapid and drastic cuts in oil consumption through rationing systems.Following the oil price shocks in the 1970s and1980s, a number of countries like Bangladesh,India, Sri Lanka and Viet Nam introduced suchmeasures as fuel rationing, fuel stamps and lifeline tariffs. Indeed, in India some of thesemeasures like kerosene rationing and quotas at
subsidized prices are still in place. Some of theavailable measures, which are summarized inTable 4-6, are as follows.
Building strategic reserves
Both governments and private companies cankeep stockpiles of crude oil and oil products separate from operational ones. The cost of holding emergency stocks should be passed onto consumers through the market price. Thesecosts can be high. For India, for example, the costof building storage to stock 15 million tonnes ofcrude oil was estimated in 2004 at US$950 million (UNCTAD 2006). Governments can,however, reduce costs by holding stocks jointlywith other countries (APERC 2000).
As well as using the stockpiles for emergencies,governments might also consider them as waysof managing consumption and also of helping toreduce worldwide demand. But it may not be feasible to use reserves as a buffer against pricevolatility, and they will clearly be of little use duringlong periods of constrained production. Instead,they should be seen more as short-term solutions.
Several Asia-Pacific countries have begun todevelop strategic oil reserves. Japan has 171 daysof consumption reserve, which would correspondto nearly 980 million barrels. India has begun todevelop a strategic crude oil reserve expected tobe pegged at 40 million barrels. The Republic ofKorea has a reported reserve of 43 million barrelsand Australia has 90 days of reserves in additionto over 200 days held in private reserves. Amongthe ASEAN countries, Thailand recently increasedthe size of its strategic reserve from 60 to 70 daysof consumption. Singapore has an estimated storage capacity of 32 million barrels of crude oiland 65 million barrels of oil products. By 2008,China plans to have an 800-million-barrel strategic reserve stored at four facilities (Sakhuja 2005).
66 Overcoming Vulnerability to Rising Oil Prices: Options for Asia and the Pacific
Box 4-3 Fuel diversification in Cambodia via cross-border trade and domestic resources
Electricity is quite expensive in the Cambodian capital Phnom Penh. It relies on oil-driven generators which make the price ofelectricity among the highest in the world. High electricity price has prompted the expansion of cross-border trade with itsneighbours Viet Nam and Thailand. Phnom Penh will be supplied with electricity from Viet Nam starting in 2008, whereas eastern and southern provinces of Cambodia are being connected to Thai electrical grids. This fuel switch could reduce theprice to half or even to one-eighth compared to the price before the switch. Further efforts are being made to diversify awayfrom gasoline and diesel to alternative energy sources. Domestic hydroelectricity power generation, to be developed with thehelp of foreign investment, is envisaged for the future. Cooperation with Chinese companies is already bringing about a majorchange in Cambodia; local generators are giving way to nationwide grid connected hydroelectricity. While being relativelyexpensive due to high capital investment, hydropower should still be cheaper for consumers than electricity generated from oil.
Source: Sokha 2006; Sokha 2007
An example of a multi-country strategic reservewithin the framework of regional cooperation isthe 1986 ASEAN Petroleum Security Agreement(APSA). This established an ASEAN EmergencyPetroleum Sharing Scheme. In cases of criticalshortage, total supply falls below 80 percent ofnormal domestic consumption, the oil-exportingmembers of ASEAN would provide emergency oilsupplies. In times of broader crises affecting morethan one ASEAN member state, the agreementcalls for the distribution to be allocated initially inproportion to their respective normal domesticconsumption and to exports for the 12-monthperiod prior to the crisis. APSA has never actuallybeen executed, although it nearly was in the early1990s during the Gulf War (Giragosian 2004).
Rationing to ensure essential supplies
Even if a country can draw on an emergencystockpile, it will still need to restrain demand,both to conserve fuel and send a strong marketsignal. High prices may themselves restraindemand but may need to be supplemented byother measures such as establishing quotas forsectors that provide essential services (OECD/IEA2004). But such rationing must be done with caution, bearing in mind possible fallouts:
• Hoarding – Panic buying may result in hoarding. This can be averted by keeping oil supplies tight, for instance, through an oil allocation scheme.
• Economic downturn – Rationing may curtail economic activity and affect the incomes of vulnerable groups.
• Reduced mobility – Restrictions on transport would constrain mobility. This may not only reduce economic activity through lost work days but also undermine social welfare by denying access to education or health care.
The transport sector does, however, offer manyopportunities to restrain oil demand in emergency situations. As described earlier, theseinclude increasing the use of public transport,encouraging car-pooling and telecommuting,changing work schedules, introducing drivingbans and restrictions, and promoting ‘ecodriving,’which includes modifying the driving style, forexample, and adjusting tyre inflation to increasefuel efficiency. It should be noted, however, that inmost developing countries of the region,these measures would generally only work inlarge cities.
All of these initiatives require countries to plan andadopt systems early so that when a crisis arises, measures can be put in place quickly.Preparing for oil emergencies either throughaccess to strategic oil reserves or through rationingrequires considerable advance preparations.Table 4-6 outlines some of the priority measuresthat would have to be undertaken.
In addition to the options listed in this chapter,countries will also want to consider diversifyingthe fuels they use, and in particular, making more use of renewable resources. This issue isaddressed in detail in the next chapter.
Chapter 4: Options for reducing oil price vulnerability 67
Building strategic reserves
and rationing are critical in
preparing for abrupt
disruptions of oil supply
Table 4-6 Priority policy actions for preparedness for oil-related emergencies
Legislative and regulatory measures Fiscal, financial and institutional measures Direct public investment
Buildingstrategicreserves
• Estimate the number of days for which reserves are to be maintained and the kinds of products to be stocked.
• Mandate oil companies to maintain reserves.
• Give fiscal incentives to oil companies for maintaining reserves through internalization of full costs of holding reserves.
• Explore possibilities for reserves in other countries.
• Build storage reserves and facilities for transportationinto and out of the reserves.
Rationing toensure essential supplies
• Define what essential services would be catered to and the requirement for these services.
• Regulate supplies to non-essential services through restrictions.
• Implement driving bans and restrictions.
• Use fuel allocation coupons as a last resort.
• Reduce/remove fuel subsidies accompanied by smart cards or cash transfers for poor households.
• Impose fines for use of oil in non-essential services.
• Give fiscal incentives for use of public transport system especially during off-peak periods.
• Create public campaigns to promote energy conservation.
• Allow preferential access to infrastructure for oil savers,e.g. special lanes for car pools as opposed to solo cars.
• Expand the public transport system.

68 Overcoming Vulnerability to Rising Oil Prices: Options for Asia and the Pacific
Endnotes
1 http://www.barternews.com/barter_happenings_around_the_globe.htm.
2 COCO (The Cogeneration Public Company Limited). 2000. The Evolution of Energy Supply for Thai Industries,
The Cogeneration Public Company Limited, Bangkok.
3 Policy Study on Cross-border Energy Trade and its Impact on the Poor.
Chapter 5: Options in renewable energy
5
Earlier chapters have shown how rising oil priceshave hit many poor communities and also putpressure on the budgets of those governmentsthat have tried to protect them through subsidies. In response, a number of countries withthe appropriate natural resources have beendiversifying to other energy sources such aslarge-scale hydroelectricity, natural gas or coal.
But in recent years, countries all over the worldhave been exploiting a wider array and scale ofrenewable energy sources, particularly solar,wind, small-hydro, geothermal and biomass1.Investments in these renewable energy sourceshave recently been growing rapidly because ofsignificant oil price increases and increasing concerns for climate change.These investments –mostly in developed countries – coupled withongoing technology improvements and costreduction policies and programmes, have madethe cost of modern energy services from renewable energy technologies (RETs) increasinglycompetitive with oil-based systems.
As indicated in Chapter 4, renewable energy technologies currently supply 13 percent of theworld’s primary energy supply, whereas theirshare is as high as 32 percent for Asia (IEA 2007b).A regional study undertaken by UNDP identifiedseveral models introduced in the region thatshowcase successful examples of scaling up off-grid renewable energy technologies,particularly in the poorer countries of the region2.These models include household biogas in Nepal,solar photovoltaic (PV) home systems in Sri Lanka, Nepal and now Bangladesh, and micro-hydropower in Indonesia, Nepal and thePhilippines. In almost all cases, these markets are
the result of public-private partnerships. RETs areoften ideal for rural or remote communities,providing them with sustainable energy servicesfor heating, electricity generation, transportationand other mechanical power applications.
The rise of renewables
The strongest growth in RET use has been in grid-connected power facilities such as small-hydro, wind farms and biomass cogenerationfacilities. However, the viability and competitiveness of RET-based power generationfacilities depend on many site-specific factors,such as local renewable resource endowmentand policy and programme support. Thus, somegrid-based RET power generation facilities maybe cost competitive with fossil-based systems inone country, but not in another.There can also be differences between subregions within a country. Nevertheless, in most areas off-grid RET-based power generation facilities are generally cost-competitive with similarly sizedpetroleum-based systems.
The cost competitiveness of RETs was analysed ina 2002 IEA study. Based on the experience ofdeveloped and developing countries, the IEA estimated the costs of generating electricityusing biomass, solar, small-hydro, wind and geothermal technologies. Table 5-1 presents thefindings, showing the ranges of investment andgenerating costs for 2002 with correspondingprojections for 2010. These ranges are quite widesince the costs for renewables can vary greatlyaccording to the type of system, the local physicalenvironment and government policies.
Options in renewable energy
The previous chapter reviewed five broad strategies for reducing oil-price vulnerability. One ofthese was to diversify to other fuels, and this chapter considers one of the most promising waysof doing so – making greater use of renewable energy technologies.
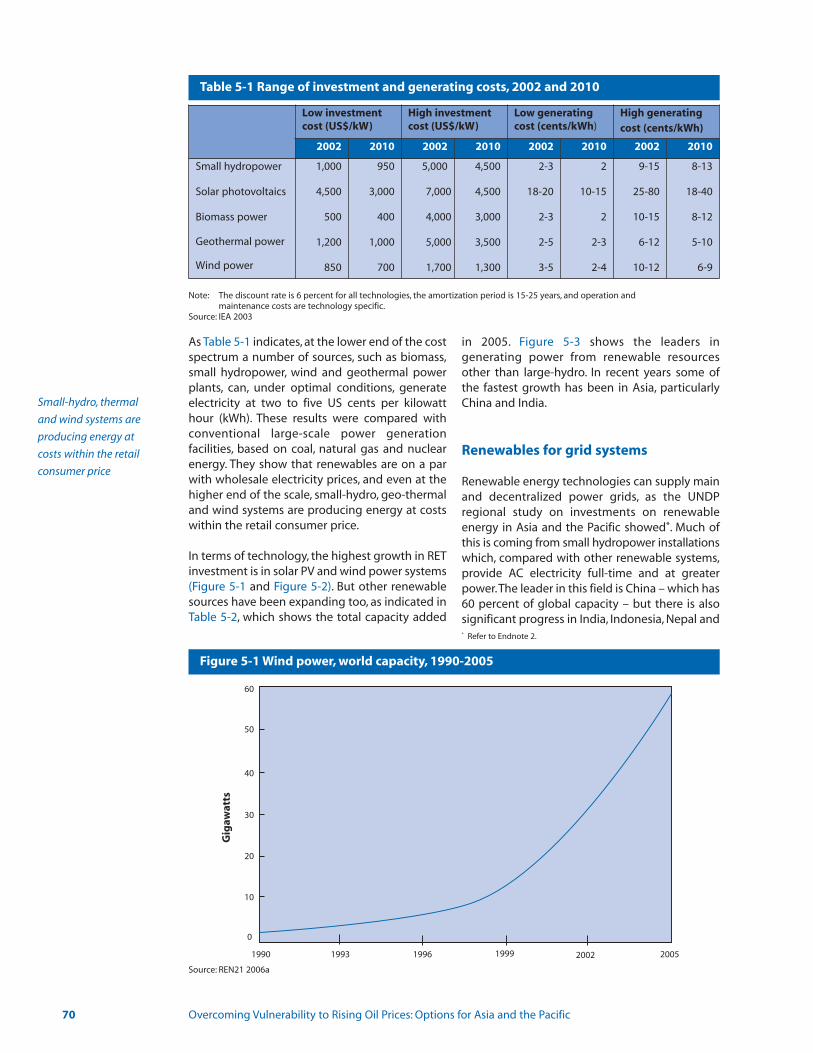
As Table 5-1 indicates, at the lower end of the costspectrum a number of sources, such as biomass,small hydropower, wind and geothermal powerplants, can, under optimal conditions, generateelectricity at two to five US cents per kilowatt hour (kWh). These results were compared withconventional large-scale power generation facilities, based on coal, natural gas and nuclear energy. They show that renewables are on a parwith wholesale electricity prices, and even at thehigher end of the scale, small-hydro, geo-thermaland wind systems are producing energy at costs within the retail consumer price.
In terms of technology, the highest growth in RETinvestment is in solar PV and wind power systems(Figure 5-1 and Figure 5-2). But other renewablesources have been expanding too, as indicated inTable 5-2, which shows the total capacity added
in 2005. Figure 5-3 shows the leaders in generating power from renewable resourcesother than large-hydro. In recent years some ofthe fastest growth has been in Asia, particularlyChina and India.
Renewables for grid systems
Renewable energy technologies can supply mainand decentralized power grids, as the UNDPregional study on investments on renewableenergy in Asia and the Pacific showed*. Much ofthis is coming from small hydropower installationswhich, compared with other renewable systems,provide AC electricity full-time and at greaterpower.The leader in this field is China – which has60 percent of global capacity – but there is alsosignificant progress in India, Indonesia, Nepal and
70 Overcoming Vulnerability to Rising Oil Prices: Options for Asia and the Pacific
Table 5-1 Range of investment and generating costs, 2002 and 2010
Figure 5-1 Wind power, world capacity, 1990-2005
Low investmentcost (US$/kW)
High investmentcost (US$/kW)
Low generatingcost (cents/kWh)
High generatingcost (cents/kWh)
2002 2010 2002 2010 2002 2010 2002 2010
Small hydropower
Solar photovoltaics
Biomass power
Geothermal power
Wind power
1,000
4,500
500
1,200
850
950
3,000
400
1,000
700
5,000
7,000
4,000
5,000
1,700
4,500
4,500
3,000
3,500
1,300
2-3
18-20
2-3
2-5
3-5
2
10-15
2
2-3
2-4
9-15
25-80
10-15
6-12
10-12
8-13
18-40
8-12
5-10
6-9
Note: The discount rate is 6 percent for all technologies, the amortization period is 15-25 years, and operation and maintenance costs are technology specific.
Source: IEA 2003
Source: REN21 2006a
1990
60
50
40
30
20
10
0
1993 1996 1999 2002 2005
Gig
awat
ts
Small-hydro, thermal
and wind systems are
producing energy at
costs within the retail
consumer price
* Refer to Endnote 2.

Sri Lanka. In these countries, micro-hydropowersystems are usually developed as community-based energy systems and have often been ableto provide energy services more equitably, as wellas offer sufficient power for productive end usesin rural and remote areas. However, scaling upthese community-based models remains a challenge.
Grids are also being fed by wind energy systems.In this case Asia’s leader is India, which has 4.4gigawatts (GW) of installed capacity. But Chinatoo is moving ahead; already it has 1.3 GW ofwind electric capacity and is adding more quickly; its near-shore and off-shore capacity isestimated at many tens of gigawatts. ThePhilippines also has considerable potential and, in
2004, inaugurated a 25 MW wind farm, the first inthe South-East Asian subregion. There are also opportunities for Pacific Island Countries, butapart from Fiji,which has one 10 MW plant,countrieshave yet to invest in grid-connected wind systems.
The other main source for grid electricity fromrenewable energy is biomass. Cogeneration systems,using agricultural wastes such as bagasse,rice husk, wood wastes and palm-oil empty fruitbunches, can generate heat and power simultaneously very efficiently and have paybacktimes of only 2-4 years. Indonesia,The Philippines,Sri Lanka,Thailand and Viet Nam have all installedsuch grid-connected biomass power productionfacilities.
Chapter 5: Options in renewable energy 71
Table 5-2 Global capacities for renewable energy in power generation, 2005
Figure 5-2 Solar PV systems, world capacity, 1990-2005
Source: REN21 2006a
Source: REN21 2006a
1990
6,000
5,000
4,000
3,000
2,000
1,000
0
1993 1996 1999 2002 2005
Meg
awat
ts
Total
Grid-connectedonly
Power generation Added during 2005
Total at end of 2005
Growth rate of existing in 2005
Large hydropowerSmall hydropowerWind turbinesBiomass powerGeothermal powerSolar PV, grid-connected (GW)
(homes)
Solar PV, off-grid (GW)(homes)
12-14 GW5 GW
11.5 GW2-3 GW0.3 GW1.1 GW
200,000
0.3 GW>270,000
750 GW66 GW59 GW44 GW9.3 GW3.1 GW
650,000
2.3 GW2,400,000
1.5-2.0 %8%
24%---
3%55%
---
15%---
China is leading in
micro-hydropower, while
India is a leader in wind
energy systems
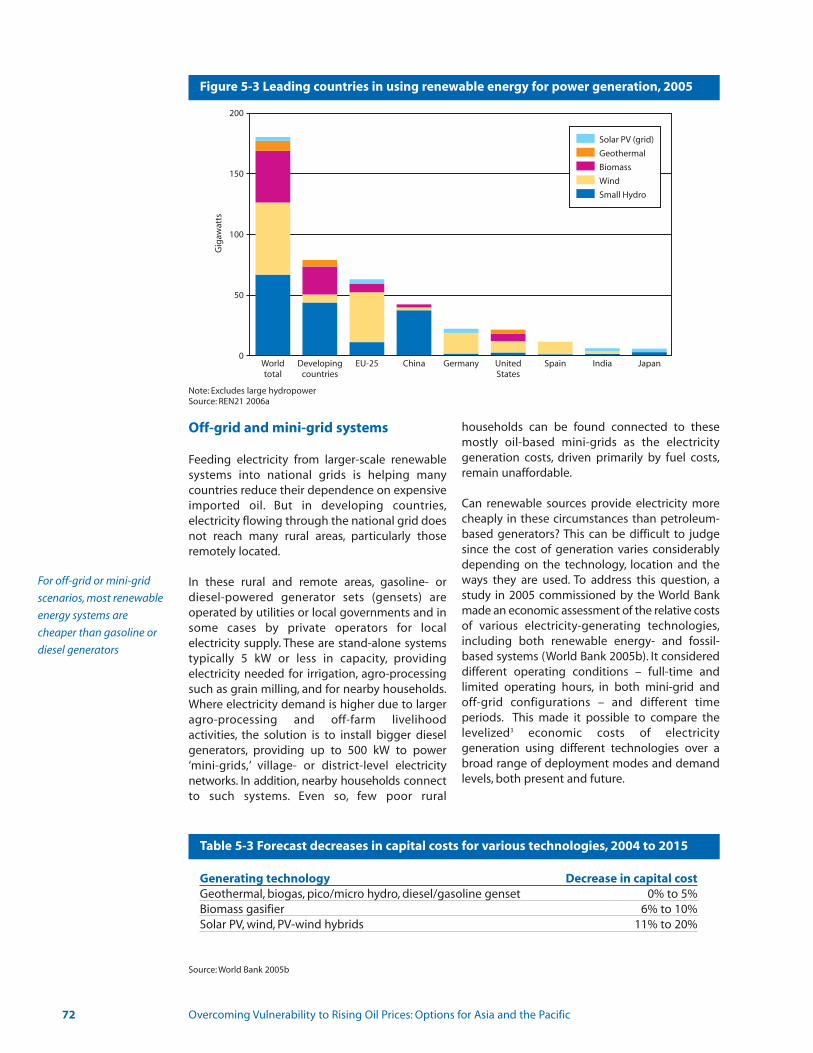
Off-grid and mini-grid systems
Feeding electricity from larger-scale renewablesystems into national grids is helping many countries reduce their dependence on expensiveimported oil. But in developing countries,electricity flowing through the national grid doesnot reach many rural areas, particularly thoseremotely located.
In these rural and remote areas, gasoline- ordiesel-powered generator sets (gensets) areoperated by utilities or local governments and insome cases by private operators for local electricity supply. These are stand-alone systemstypically 5 kW or less in capacity, providing electricity needed for irrigation, agro-processingsuch as grain milling, and for nearby households.Where electricity demand is higher due to largeragro-processing and off-farm livelihood activities, the solution is to install bigger dieselgenerators, providing up to 500 kW to power‘mini-grids,’ village- or district-level electricity networks. In addition, nearby households connectto such systems. Even so, few poor rural
households can be found connected to thesemostly oil-based mini-grids as the electricity generation costs, driven primarily by fuel costs,remain unaffordable.
Can renewable sources provide electricity morecheaply in these circumstances than petroleum-based generators? This can be difficult to judgesince the cost of generation varies considerablydepending on the technology, location and theways they are used. To address this question, astudy in 2005 commissioned by the World Bankmade an economic assessment of the relative costsof various electricity-generating technologies,including both renewable energy- and fossil-based systems (World Bank 2005b). It considereddifferent operating conditions – full-time and limited operating hours, in both mini-grid andoff-grid configurations – and different time periods. This made it possible to compare the levelized3 economic costs of electricity generation using different technologies over abroad range of deployment modes and demandlevels, both present and future.
72 Overcoming Vulnerability to Rising Oil Prices: Options for Asia and the Pacific
Figure 5-3 Leading countries in using renewable energy for power generation, 2005
Table 5-3 Forecast decreases in capital costs for various technologies, 2004 to 2015
Worldtotal
Developingcountries
EU-25 China Germany UnitedStates
Spain India Japan
200
150
100
50
0
Solar PV (grid)
Geothermal
Biomass
Wind
Small Hydro
Gig
awat
ts
Note: Excludes large hydropowerSource: REN21 2006a
Source: World Bank 2005b
Generating technology Decrease in capital costGeothermal, biogas, pico/micro hydro, diesel/gasoline genset 0% to 5% Biomass gasifier 6% to 10% Solar PV, wind, PV-wind hybrids 11% to 20%
For off-grid or mini-grid
scenarios, most renewable
energy systems are
cheaper than gasoline or
diesel generators
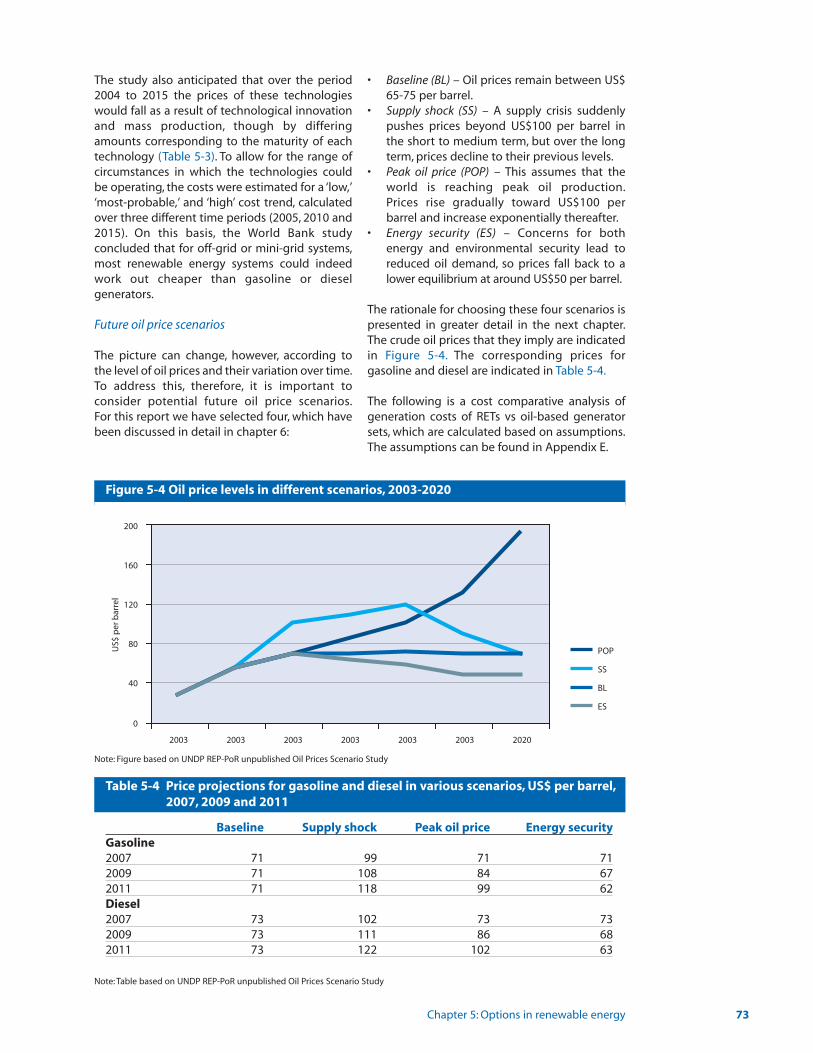
The study also anticipated that over the period2004 to 2015 the prices of these technologieswould fall as a result of technological innovationand mass production, though by differingamounts corresponding to the maturity of eachtechnology (Table 5-3). To allow for the range ofcircumstances in which the technologies couldbe operating, the costs were estimated for a ‘low,’‘most-probable,’ and ‘high’ cost trend, calculatedover three different time periods (2005, 2010 and2015). On this basis, the World Bank study concluded that for off-grid or mini-grid systems,most renewable energy systems could indeedwork out cheaper than gasoline or diesel generators.
Future oil price scenarios
The picture can change, however, according tothe level of oil prices and their variation over time.To address this, therefore, it is important to consider potential future oil price scenarios.For this report we have selected four, which havebeen discussed in detail in chapter 6:
• Baseline (BL) – Oil prices remain between US$ 65-75 per barrel.
• Supply shock (SS) – A supply crisis suddenly pushes prices beyond US$100 per barrel in the short to medium term, but over the long term, prices decline to their previous levels.
• Peak oil price (POP) – This assumes that the world is reaching peak oil production.Prices rise gradually toward US$100 per barrel and increase exponentially thereafter.
• Energy security (ES) – Concerns for both energy and environmental security lead to reduced oil demand, so prices fall back to a lower equilibrium at around US$50 per barrel.
The rationale for choosing these four scenarios ispresented in greater detail in the next chapter.The crude oil prices that they imply are indicatedin Figure 5-4. The corresponding prices for gasoline and diesel are indicated in Table 5-4.
The following is a cost comparative analysis of generation costs of RETs vs oil-based generatorsets, which are calculated based on assumptions.The assumptions can be found in Appendix E.
Chapter 5: Options in renewable energy 73
Figure 5-4 Oil price levels in different scenarios, 2003-2020
Note: Figure based on UNDP REP-PoR unpublished Oil Prices Scenario Study
Table 5-4 Price projections for gasoline and diesel in various scenarios, US$ per barrel,2007, 2009 and 2011
Note: Table based on UNDP REP-PoR unpublished Oil Prices Scenario Study
Baseline Supply shock Peak oil price Energy securityGasoline2007 71 99 71 712009 71 108 84 672011 71 118 99 62Diesel2007 73 102 73 732009 73 111 86 682011 73 122 102 63
2003 2003 2003 2003 2003 2003 2020
0
40
80
120
160
200
US$
per
bar
rel
POP
SS
BL
ES
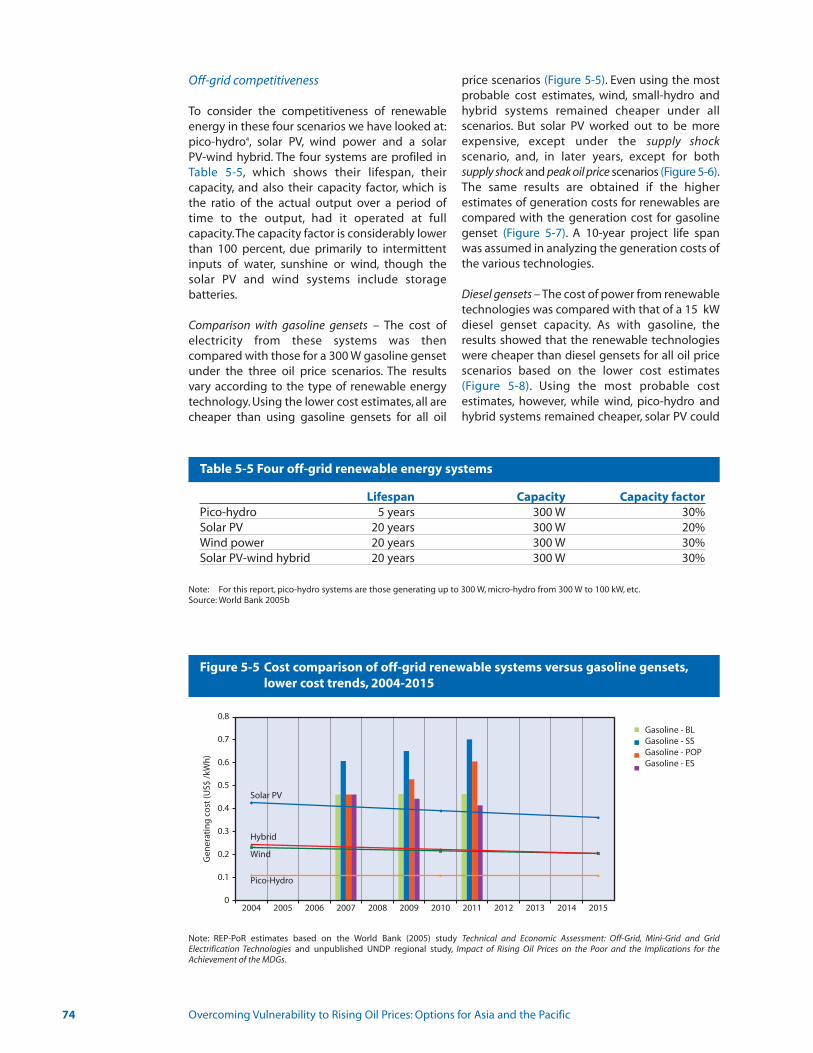
Off-grid competitiveness
To consider the competitiveness of renewableenergy in these four scenarios we have looked at:pico-hydro4, solar PV, wind power and a solar PV-wind hybrid. The four systems are profiled inTable 5-5, which shows their lifespan, their capacity, and also their capacity factor, which isthe ratio of the actual output over a period oftime to the output, had it operated at full capacity.The capacity factor is considerably lowerthan 100 percent, due primarily to intermittentinputs of water, sunshine or wind, though thesolar PV and wind systems include storage batteries.
Comparison with gasoline gensets – The cost ofelectricity from these systems was then compared with those for a 300 W gasoline gensetunder the three oil price scenarios. The resultsvary according to the type of renewable energytechnology. Using the lower cost estimates, all arecheaper than using gasoline gensets for all oil
price scenarios (Figure 5-5). Even using the mostprobable cost estimates, wind, small-hydro andhybrid systems remained cheaper under all scenarios. But solar PV worked out to be moreexpensive, except under the supply shockscenario, and, in later years, except for both supply shock and peak oil price scenarios (Figure 5-6).The same results are obtained if the higher estimates of generation costs for renewables arecompared with the generation cost for gasolinegenset (Figure 5-7). A 10-year project life spanwas assumed in analyzing the generation costs ofthe various technologies.
Diesel gensets – The cost of power from renewabletechnologies was compared with that of a 15 kWdiesel genset capacity. As with gasoline, theresults showed that the renewable technologieswere cheaper than diesel gensets for all oil pricescenarios based on the lower cost estimates(Figure 5-8). Using the most probable cost estimates, however, while wind, pico-hydro andhybrid systems remained cheaper, solar PV could
74 Overcoming Vulnerability to Rising Oil Prices: Options for Asia and the Pacific
Table 5-5 Four off-grid renewable energy systems
Figure 5-5 Cost comparison of off-grid renewable systems versus gasoline gensets,lower cost trends, 2004-2015
Note: For this report, pico-hydro systems are those generating up to 300 W, micro-hydro from 300 W to 100 kW, etc.Source: World Bank 2005b
Note: REP-PoR estimates based on the World Bank (2005) study Technical and Economic Assessment: Off-Grid, Mini-Grid and GridElectrification Technologies and unpublished UNDP regional study, Impact of Rising Oil Prices on the Poor and the Implications for theAchievement of the MDGs.
Lifespan Capacity Capacity factorPico-hydro 5 years 300 W 30%Solar PV 20 years 300 W 20%Wind power 20 years 300 W 30%Solar PV-wind hybrid 20 years 300 W 30%
Gen
erat
ing
co
st (U
S$ /
kWh
)
2004 2005 2006 2007 2008 2009 2010 2011 2012 2013 2014 2015
0.1
0.2
0
0.3
0.4
0.5
0.6
0.7
0.8
Gasoline - BL Gasoline - SS Gasoline - POP Gasoline - ES
Solar PV
Hybrid
Wind
Pico-Hydro
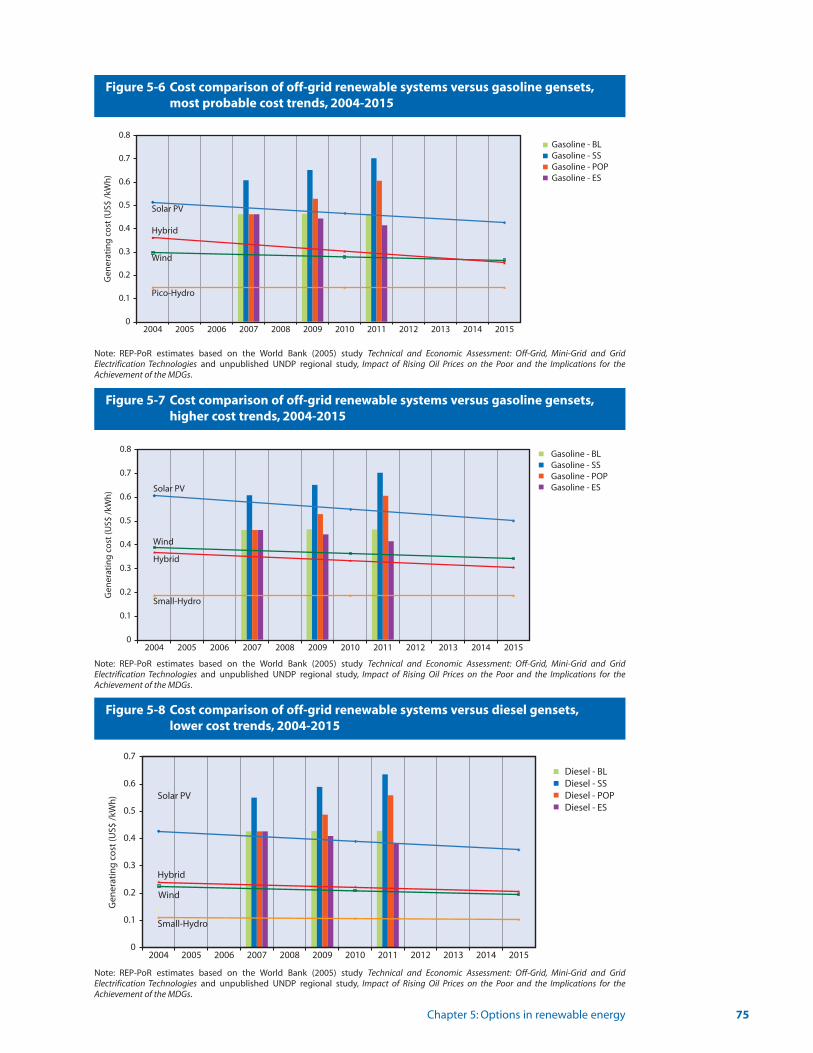
Chapter 5: Options in renewable energy 75
Figure 5-6 Cost comparison of off-grid renewable systems versus gasoline gensets,most probable cost trends, 2004-2015
Note: REP-PoR estimates based on the World Bank (2005) study Technical and Economic Assessment: Off-Grid, Mini-Grid and GridElectrification Technologies and unpublished UNDP regional study, Impact of Rising Oil Prices on the Poor and the Implications for theAchievement of the MDGs.
Gen
erat
ing
co
st (U
S$ /
kWh
)
2004 2005 2006 2007 2008 2009 2010 2011 2012 2013 2014 2015
0.1
0.2
0
0.3
0.4
0.5
0.6
0.7
0.8Gasoline - BL Gasoline - SS Gasoline - POP Gasoline - ES
Solar PV
Hybrid
Wind
Pico-Hydro
Figure 5-7 Cost comparison of off-grid renewable systems versus gasoline gensets,higher cost trends, 2004-2015
Gen
erat
ing
co
st (U
S$ /
kWh
)
2004 2005 2006 2007 2008 2009 2010 2011 2012 2013 2014 2015
0.1
0.2
0
0.3
0.4
0.5
0.6
0.7
0.8 Gasoline - BL Gasoline - SS Gasoline - POP Gasoline - ESSolar PV
Hybrid
Wind
Small-Hydro
Figure 5-8 Cost comparison of off-grid renewable systems versus diesel gensets,lower cost trends, 2004-2015
Gen
erat
ing
co
st (U
S$ /
kWh
)
2004 2005 2006 2007 2008 2009 2010 2011 2012 2013 2014 2015
0.1
0.2
0
0.3
0.4
0.5
0.6
0.7
Diesel - BL Diesel - SS Diesel - POP Diesel - ES
Solar PV
Hybrid
Wind
Small-Hydro
Note: REP-PoR estimates based on the World Bank (2005) study Technical and Economic Assessment: Off-Grid, Mini-Grid and GridElectrification Technologies and unpublished UNDP regional study, Impact of Rising Oil Prices on the Poor and the Implications for theAchievement of the MDGs.
Note: REP-PoR estimates based on the World Bank (2005) study Technical and Economic Assessment: Off-Grid, Mini-Grid and GridElectrification Technologies and unpublished UNDP regional study, Impact of Rising Oil Prices on the Poor and the Implications for theAchievement of the MDGs.

be more expensive, except under the ‘supplyshock’ or ‘peak oil’ scenarios (Figure 5-9). Usingthe higher cost estimates, all three renewablesremained cheaper than diesel genset, and solarPV becomes the most expensive option at present, in 2007 (Figure 5-10). In 2009, it becomescheaper than diesel genset under the ‘supplyshock’ scenario, and in 2015 it becomes cheaperunder both the ‘supply-shock’and ‘peak-oil’scenarios.
Mini-grid competitiveness
Several of the above-mentioned renewableoptions are suitable for powering mini-grids.Seven of these are profiled in Table 5-6. With thesame methods as for the off-grid systems, usingboth lower and most probable cost estimatesacross the four oil-price scenarios, these systemshave been compared with a potential fossil fuelcompetitor, a 100 kW diesel genset.
At the lower cost estimates, six of the optionsproved cheaper than diesel gensets across allfour oil price scenarios (Figure 5-11). The exception was solar PV, which was significantlymore expensive. For the most probable cost estimates, five of the systems were still cheaperthan diesel gensets (Figure 5-12). This time theexceptions were again solar PV systems, joined byPV-wind hybrids, which were more expensiveexcept in scenarios where the crude oil price isabove US$70 per barrel. For the higher cost trend,solar PV, as expected, remains the most expensivesystem (Figure 5-13). PV-wind hybrid and windalmost equal the cost for diesel gensets in 2009under the ‘peak oil price’ scenario, but the cost islower than for diesel under this scenario in theyear 2015.
76 Overcoming Vulnerability to Rising Oil Prices: Options for Asia and the Pacific
Figure 5-9 Cost comparison of off-grid renewable systems versus diesel gensets,most probable cost trends, 2004-2015
Gen
erat
ing
co
st (U
S$ /
kWh
)
2004 2005 2006 2007 2008 2009 2010 2011 2012 2013 2014 2015
0.1
0.2
0
0.3
0.4
0.5
0.6
0.7Diesel - BL Diesel - SS Diesel - POP Diesel - ESSolar PV
Hybrid
Wind
Small-Hydro
Note: REP-PoR estimates based on the World Bank (2005) study Technical and Economic Assessment: Off-Grid, Mini-Grid and GridElectrification Technologies and unpublished UNDP regional study, Impact of Rising Oil Prices on the Poor and the Implications for theAchievement of the MDGs.
Figure 5-10 Cost comparison of off-grid renewable systems versus diesel gensets,higher cost trends, 2004-2015
Gen
erat
ing
co
st (U
S$ /
kWh
)
2004 2005 2006 2007 2008 2009 2010 2011 2012 2013 2014 2015
0.1
0.2
0
0.3
0.4
0.5
0.6
0.7 Diesel - BL Diesel - SS Diesel - POP Diesel - ES
Solar PV
Hybrid
Wind
Small-Hydro
Note: REP-PoR estimates based on the World Bank (2005) study Technical and Economic Assessment: Off-Grid, Mini-Grid and GridElectrification Technologies and unpublished UNDP regional study, Impact of Rising Oil Prices on the Poor and the Implications for theAchievement of the MDGs.
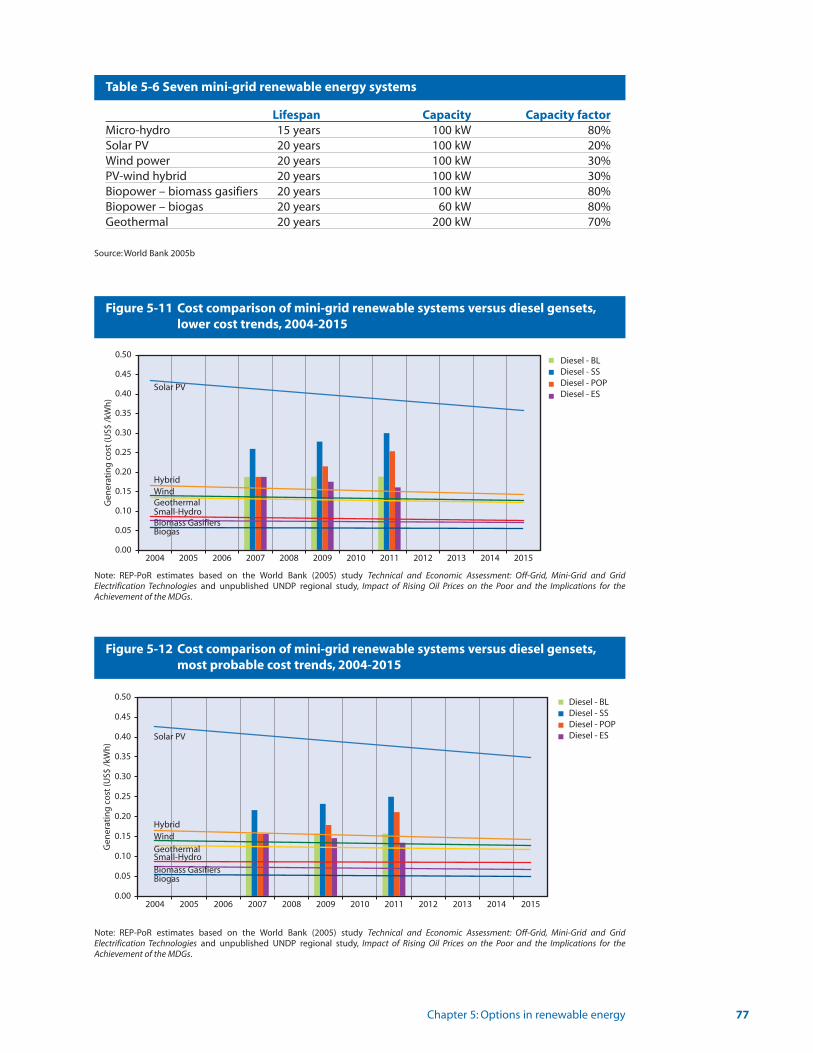
Chapter 5: Options in renewable energy 77
Figure 5-11 Cost comparison of mini-grid renewable systems versus diesel gensets,lower cost trends, 2004-2015
Gen
erat
ing
co
st (U
S$ /
kWh
)
2004 2005 2006 2007 2008 2009 2010 2011 2012 2013 2014 20150.00
0.05
0.10
0.15
0.20
0.25
0.30
0.35
0.40
0.45
0.50Diesel - BL Diesel - SS Diesel - POP Diesel - ES
Solar PV
HybridWind
Small-Hydro
BiogasBiomass Gasifiers
Geothermal
Note: REP-PoR estimates based on the World Bank (2005) study Technical and Economic Assessment: Off-Grid, Mini-Grid and GridElectrification Technologies and unpublished UNDP regional study, Impact of Rising Oil Prices on the Poor and the Implications for theAchievement of the MDGs.
Figure 5-12 Cost comparison of mini-grid renewable systems versus diesel gensets,most probable cost trends, 2004-2015
Gen
erat
ing
co
st (U
S$ /
kWh
)
2004 2005 2006 2007 2008 2009 2010 2011 2012 2013 2014 20150.00
0.05
0.10
0.15
0.20
0.25
0.30
0.35
0.40
0.45
0.50Diesel - BL Diesel - SS Diesel - POP Diesel - ESSolar PV
HybridWind
Small-Hydro
BiogasBiomass Gasifiers
Geothermal
Note: REP-PoR estimates based on the World Bank (2005) study Technical and Economic Assessment: Off-Grid, Mini-Grid and GridElectrification Technologies and unpublished UNDP regional study, Impact of Rising Oil Prices on the Poor and the Implications for theAchievement of the MDGs.
Table 5-6 Seven mini-grid renewable energy systems
Source: World Bank 2005b
Lifespan Capacity Capacity factorMicro-hydro 15 years 100 kW 80%Solar PV 20 years 100 kW 20%Wind power 20 years 100 kW 30%PV-wind hybrid 20 years 100 kW 30%Biopower – biomass gasifiers 20 years 100 kW 80%Biopower – biogas 20 years 60 kW 80%Geothermal 20 years 200 kW 70%

These results have considerable significance forremote and underdeveloped rural communities,since they underline the viability of renewableenergy for use both in the household and forincome generation. RETs can be used to increaseagricultural production by providing affordableenergy for irrigation, grain milling and other cropprocessing activities that can be intensified withthe use of electricity. Electricity can also be usedfor diversifying and increasing rural productionby making possible operations of hatcheries,aerated fish farms and refrigeration systems forstorage and preservation of agricultural produce.Electricity likewise can be available to powersmall electric motors in small and micro rural-based off-farm enterprises, paving the wayfor rural industrialization. If agriculture and ruraleconomic development programmes are
successful in reducing poverty, that success canbe enhanced and strengthened with the use ofRET-based electricity supply.
Heating
Table 5-7 shows the main types of heating systems in use globally. Traditional biomass dominates, but modern biomass heating is moving ahead, solar heaters are becoming morecommon, and more use is being made of geothermal energy.
Traditional biomass is the main heating source formost developing countries, especially in ruralareas. It also remains significant in urban areas,particularly for poor households. In the
78 Overcoming Vulnerability to Rising Oil Prices: Options for Asia and the Pacific
Figure 5-13 Cost comparison of mini-grid renewable systems versus diesel gensets,higher cost trends, 2004-2015
Gen
erat
ing
co
st (U
S$/k
Wh
)
2004 2005 2006 2007 2008 2009 2010 2011 2012 2013 2014 20150.00
0.10
0.20
0.30
0.40
0.50
0.60
0.50Diesel - BL Diesel - SS Diesel - POP Diesel - ES
Solar PV
Hybrid
Wind
Small-Hydro
Biogas
Biomass Gasifiers
Geothermal
Note: REP-PoR estimates based on the World Bank (2005) study Technical and Economic Assessment: Off-Grid, Mini-Grid and GridElectrification Technologies and unpublished UNDP regional study, Impact of Rising Oil Prices on the Poor and the Implications for theAchievement of the MDGs.
Note: n/a = not available Source: REN21 2006a
Added during 2005 Stock at the end of 2005
Growth rate of existing in 2005
Biomass heating n/a 220 GWth ---
Solar collectors forhot water and spaceheating, glazed
Power 13 GWth 88 GWth ---
Surface area 19 million m2 125 million m2 ---
Number of homes 7 million 46 million ---
Geothermal heating 2.6 GWth 28 GWth 9%
Biomass cookingstoves in use
Total, all types n/a 570 million ---
Improved n/a 220 million ---
Household-scale biogas digesters in use n/a 21 million ---
Table 5-7 Global use of renewable energy for heating, 2005
Renewable energy use
is viable for income
generation, increasing
agricultural production
and powering
rural industrialization
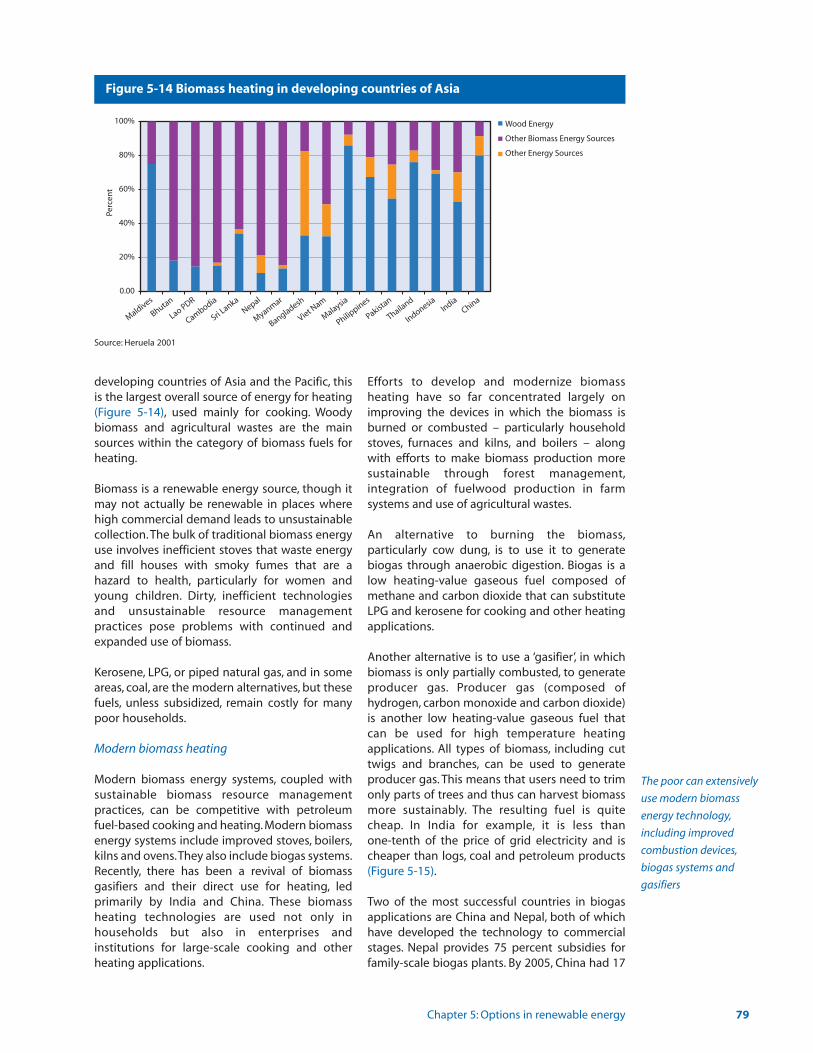
developing countries of Asia and the Pacific, thisis the largest overall source of energy for heating(Figure 5-14), used mainly for cooking. Woodybiomass and agricultural wastes are the main sources within the category of biomass fuels forheating.
Biomass is a renewable energy source, though itmay not actually be renewable in places wherehigh commercial demand leads to unsustainablecollection. The bulk of traditional biomass energyuse involves inefficient stoves that waste energyand fill houses with smoky fumes that are a hazard to health, particularly for women andyoung children. Dirty, inefficient technologiesand unsustainable resource management practices pose problems with continued andexpanded use of biomass.
Kerosene, LPG, or piped natural gas, and in someareas, coal, are the modern alternatives, but thesefuels, unless subsidized, remain costly for manypoor households.
Modern biomass heating
Modern biomass energy systems, coupled withsustainable biomass resource management practices, can be competitive with petroleumfuel-based cooking and heating. Modern biomassenergy systems include improved stoves, boilers,kilns and ovens.They also include biogas systems.Recently, there has been a revival of biomass gasifiers and their direct use for heating, led primarily by India and China. These biomass heating technologies are used not only in households but also in enterprises and institutions for large-scale cooking and otherheating applications.
Efforts to develop and modernize biomass heating have so far concentrated largely onimproving the devices in which the biomass isburned or combusted – particularly householdstoves, furnaces and kilns, and boilers – alongwith efforts to make biomass production moresustainable through forest management,integration of fuelwood production in farm systems and use of agricultural wastes.
An alternative to burning the biomass,particularly cow dung, is to use it to generate biogas through anaerobic digestion. Biogas is alow heating-value gaseous fuel composed ofmethane and carbon dioxide that can substituteLPG and kerosene for cooking and other heating applications.
Another alternative is to use a ‘gasifier’, in which biomass is only partially combusted, to generateproducer gas. Producer gas (composed of hydrogen, carbon monoxide and carbon dioxide)is another low heating-value gaseous fuel thatcan be used for high temperature heating applications. All types of biomass, including cuttwigs and branches, can be used to generate producer gas. This means that users need to trimonly parts of trees and thus can harvest biomassmore sustainably. The resulting fuel is quitecheap. In India for example, it is less than one-tenth of the price of grid electricity and ischeaper than logs, coal and petroleum products(Figure 5-15).
Two of the most successful countries in biogasapplications are China and Nepal, both of whichhave developed the technology to commercialstages. Nepal provides 75 percent subsidies forfamily-scale biogas plants. By 2005, China had 17
Chapter 5: Options in renewable energy 79
Figure 5-14 Biomass heating in developing countries of Asia
MaldivesChina
India
Indonesia
Thailand
Pakistan
Philippines
Malaysia
Viet Nam
Bangladesh
MyanmarNepal
Sri Lanka
Cambodia
Lao PDR
Bhutan0.00
20%
40%
60%
80%
100% Wood Energy
Other Biomass Energy Sources
Other Energy Sources
Perc
ent
Source: Heruela 2001
The poor can extensively
use modern biomass
energy technology,
including improved
combustion devices,
biogas systems and
gasifiers
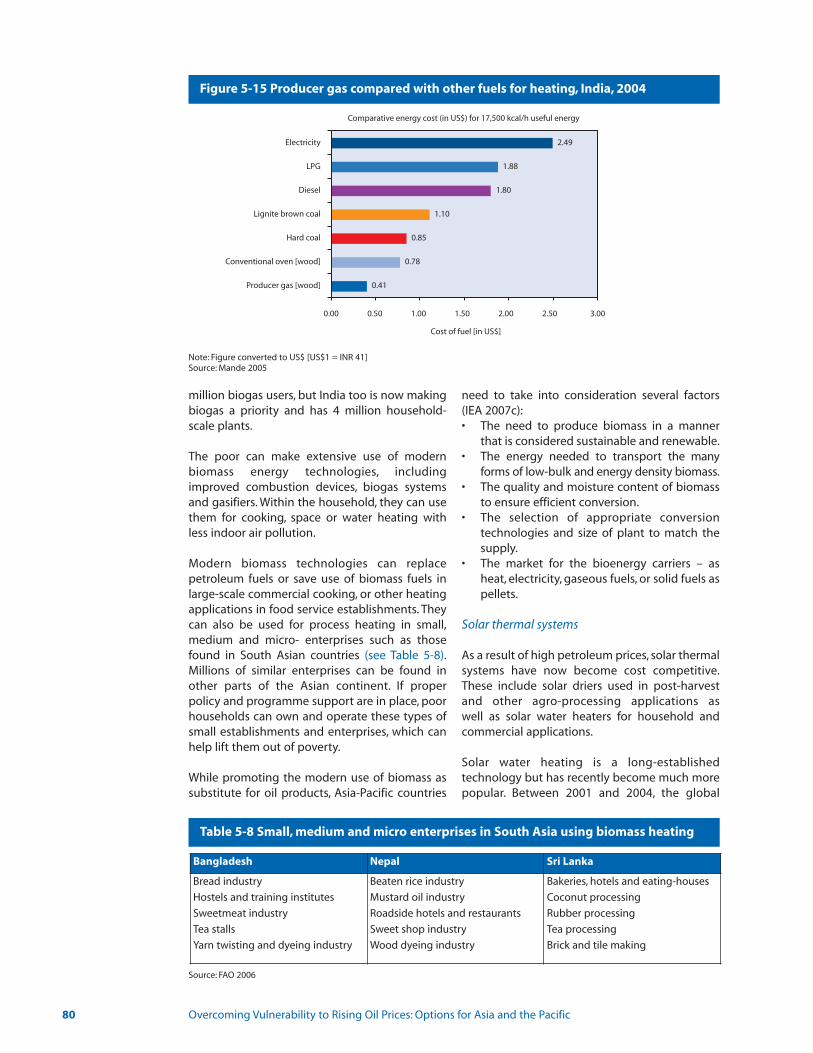
million biogas users, but India too is now makingbiogas a priority and has 4 million household-scale plants.
The poor can make extensive use of modern biomass energy technologies, includingimproved combustion devices, biogas systemsand gasifiers. Within the household, they can usethem for cooking, space or water heating withless indoor air pollution.
Modern biomass technologies can replace petroleum fuels or save use of biomass fuels inlarge-scale commercial cooking, or other heatingapplications in food service establishments. Theycan also be used for process heating in small,medium and micro- enterprises such as thosefound in South Asian countries (see Table 5-8).Millions of similar enterprises can be found inother parts of the Asian continent. If proper policy and programme support are in place, poorhouseholds can own and operate these types ofsmall establishments and enterprises, which canhelp lift them out of poverty.
While promoting the modern use of biomass assubstitute for oil products, Asia-Pacific countries
need to take into consideration several factors(IEA 2007c):• The need to produce biomass in a manner
that is considered sustainable and renewable.• The energy needed to transport the many
forms of low-bulk and energy density biomass.• The quality and moisture content of biomass
to ensure efficient conversion.• The selection of appropriate conversion
technologies and size of plant to match the supply.
• The market for the bioenergy carriers – as heat, electricity, gaseous fuels, or solid fuels as pellets.
Solar thermal systems
As a result of high petroleum prices, solar thermalsystems have now become cost competitive.These include solar driers used in post-harvestand other agro-processing applications as well as solar water heaters for household and commercial applications.
Solar water heating is a long-established technology but has recently become much morepopular. Between 2001 and 2004, the global
80 Overcoming Vulnerability to Rising Oil Prices: Options for Asia and the Pacific
Figure 5-15 Producer gas compared with other fuels for heating, India, 2004
Table 5-8 Small, medium and micro enterprises in South Asia using biomass heating
Comparative energy cost (in US$) for 17,500 kcal/h useful energy
Cost of fuel [in US$]
Electricity
LPG
Diesel
Lignite brown coal
Hard coal
Conventional oven [wood]
Producer gas [wood]
2.49
1.88
1.80
1.10
0.85
0.78
0.41
0.00 0.50 1.00 1.50 2.00 2.50 3.00
Note: Figure converted to US$ [US$1 = INR 41] Source: Mande 2005
Source: FAO 2006
Bangladesh Nepal Sri Lanka
Bread industry
Hostels and training institutes
Sweetmeat industry
Tea stalls
Yarn twisting and dyeing industry
Beaten rice industry
Mustard oil industry
Roadside hotels and restaurants
Sweet shop industry
Wood dyeing industry
Bakeries, hotels and eating-houses
Coconut processing
Rubber processing
Tea processing
Brick and tile making
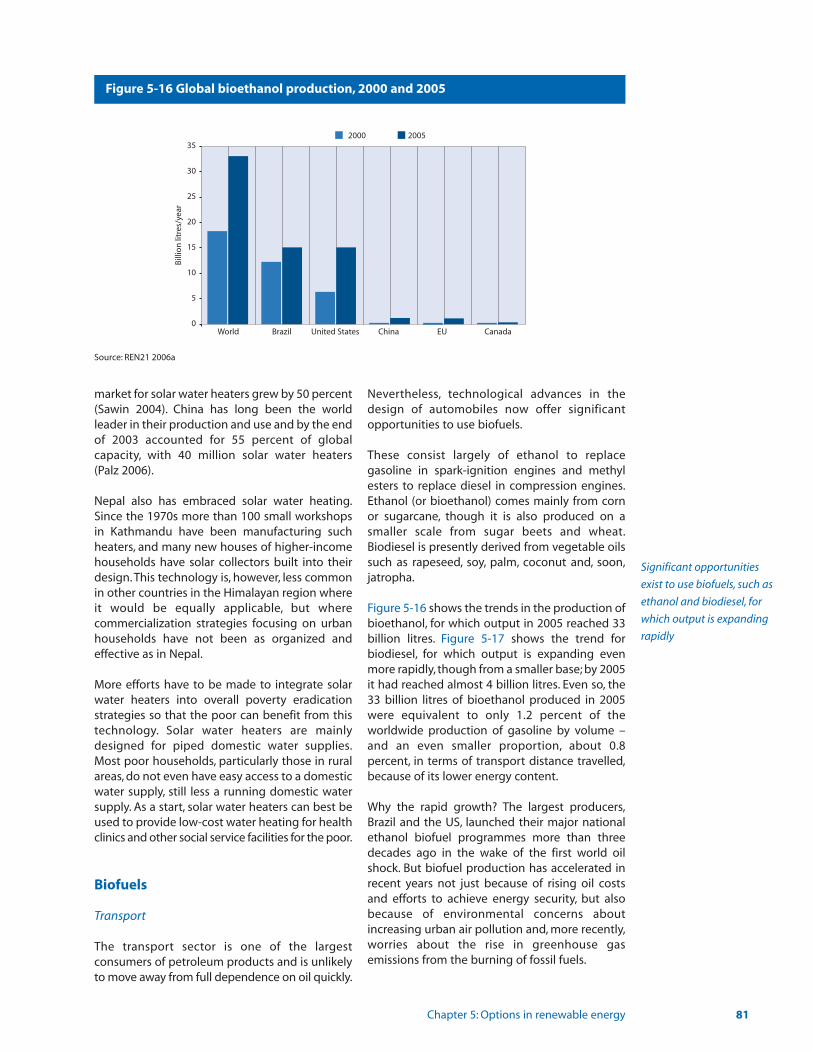
market for solar water heaters grew by 50 percent(Sawin 2004). China has long been the worldleader in their production and use and by the endof 2003 accounted for 55 percent of global capacity, with 40 million solar water heaters (Palz 2006).
Nepal also has embraced solar water heating.Since the 1970s more than 100 small workshopsin Kathmandu have been manufacturing suchheaters, and many new houses of higher-incomehouseholds have solar collectors built into theirdesign. This technology is, however, less commonin other countries in the Himalayan region whereit would be equally applicable, but where commercialization strategies focusing on urbanhouseholds have not been as organized andeffective as in Nepal.
More efforts have to be made to integrate solarwater heaters into overall poverty eradicationstrategies so that the poor can benefit from thistechnology. Solar water heaters are mainlydesigned for piped domestic water supplies.Most poor households, particularly those in ruralareas, do not even have easy access to a domesticwater supply, still less a running domestic watersupply. As a start, solar water heaters can best beused to provide low-cost water heating for healthclinics and other social service facilities for the poor.
Biofuels
Transport
The transport sector is one of the largest consumers of petroleum products and is unlikelyto move away from full dependence on oil quickly.
Nevertheless, technological advances in thedesign of automobiles now offer significantopportunities to use biofuels.
These consist largely of ethanol to replace gasoline in spark-ignition engines and methylesters to replace diesel in compression engines.Ethanol (or bioethanol) comes mainly from cornor sugarcane, though it is also produced on asmaller scale from sugar beets and wheat.Biodiesel is presently derived from vegetable oilssuch as rapeseed, soy, palm, coconut and, soon,jatropha.
Figure 5-16 shows the trends in the production ofbioethanol, for which output in 2005 reached 33billion litres. Figure 5-17 shows the trend forbiodiesel, for which output is expanding evenmore rapidly, though from a smaller base; by 2005it had reached almost 4 billion litres. Even so, the33 billion litres of bioethanol produced in 2005were equivalent to only 1.2 percent of the worldwide production of gasoline by volume –and an even smaller proportion, about 0.8 percent, in terms of transport distance travelled,because of its lower energy content.
Why the rapid growth? The largest producers,Brazil and the US, launched their major nationalethanol biofuel programmes more than threedecades ago in the wake of the first world oilshock. But biofuel production has accelerated inrecent years not just because of rising oil costsand efforts to achieve energy security, but alsobecause of environmental concerns aboutincreasing urban air pollution and, more recently,worries about the rise in greenhouse gas emissions from the burning of fossil fuels.
Chapter 5: Options in renewable energy 81
Figure 5-16 Global bioethanol production, 2000 and 2005
World Brazil United States China EU Canada0
5
10
15
20
25
30
352000 2005
Bill
ion
litr
es/y
ear
Source: REN21 2006a
Significant opportunities
exist to use biofuels, such as
ethanol and biodiesel, for
which output is expanding
rapidly

Leading biofuel producers
The main producers of biofuels are indicated inTable 5-9. For bioethanol the dominant producerhas been Brazil, which makes the fuel from sugarcane, though the United States, whichmakes it mostly from corn, has now caught up. InAsia the principal producers are China and India,and they are also in the forefront of biofuelsdevelopment. In India, a rejuvenated sugarethanol programme calls for the availability of E5gasoline (gasoline with 5 percent ethanol) inmost of the country, and there are plans to raisethis to E10 and then E20. In China, the government is making E10 blends mandatory in
five provinces that account for 16 percent of thenation’s passenger cars. In Japan, the governmenthas permitted low-level ethanol blends in preparation for a possible blending mandate,with the intention, by 2030, of replacing 20 percentof the nation’s oil demand with either biofuels orgas-to-liquid fuels made from natural gas.
In South-East Asia, Thailand, eager to reduce thecost of oil imports while particularly supportingcassava growers, has mandated an ambitious 10percent ethanol mix in gasoline starting in 2007.For similar reasons, to support coconut growers,the Philippines will mandate 2 percent biodieseland 5 percent ethanol. In both Malaysia and
82 Overcoming Vulnerability to Rising Oil Prices: Options for Asia and the Pacific
Figure 5-17 World biodiesel production, 2000-2005
Table 5-9 World biofuels production by country, 2005
2000 2001 2002 2003 2004 20050.0
4.0
3.5
3.0
2.5
2.0
1.5
1.0
0.5
Bill
ion
litr
es/y
ear
Source: REN21 2006a
Source: REN21 2006a
Country Fuel ethanol Biodiesel(billion litres) (billion litres)
Brazil 15 -United States 15 0.25Germany 0.2 1.9China 1.0 -France 0.15 0.6Italy - 0.5Spain 0.3 0.1Canada 0.2 0.1India 0.3 -Columbia 0.2 -Sweden 0.2 -Czech Republic - 0.15Poland 0.05 0.1Denmark - 0.1Austria - 0.1Slovakia - 0.1EU Total 0.9 3.6World Total 33 3.9
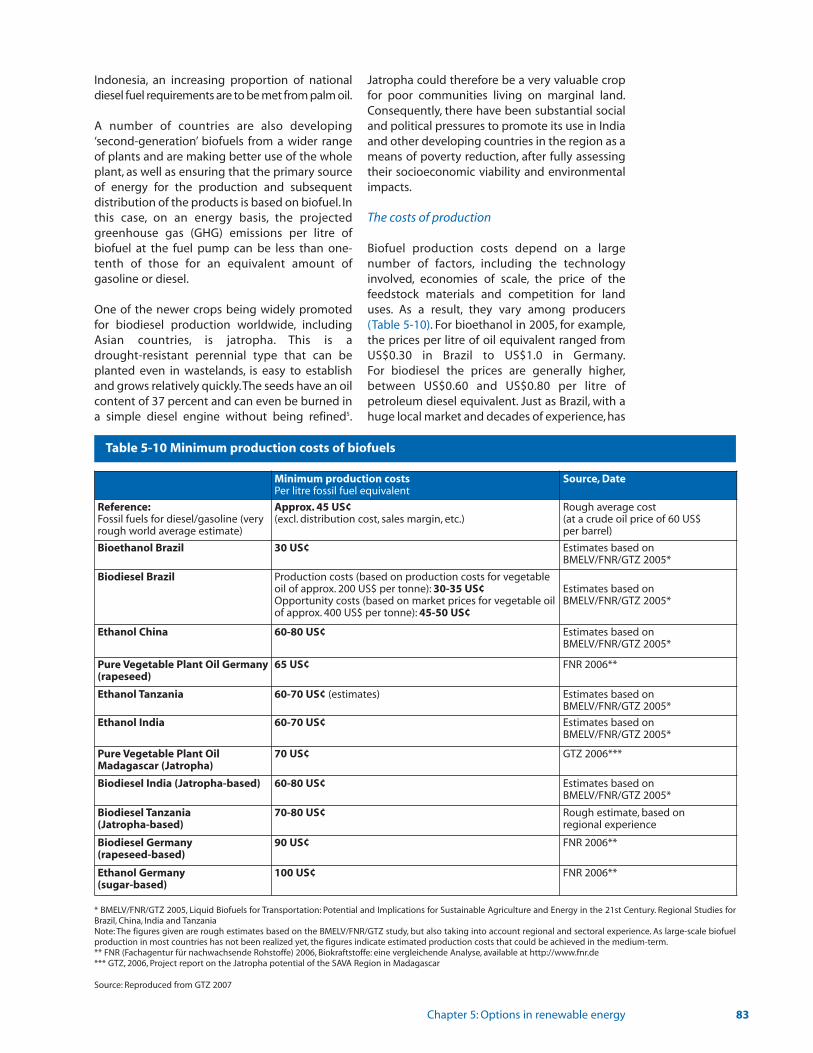
Indonesia, an increasing proportion of nationaldiesel fuel requirements are to be met from palm oil.
A number of countries are also developing ‘second-generation’ biofuels from a wider rangeof plants and are making better use of the wholeplant, as well as ensuring that the primary sourceof energy for the production and subsequent distribution of the products is based on biofuel. Inthis case, on an energy basis, the projected greenhouse gas (GHG) emissions per litre of biofuel at the fuel pump can be less than one-tenth of those for an equivalent amount of gasoline or diesel.
One of the newer crops being widely promotedfor biodiesel production worldwide, includingAsian countries, is jatropha. This is a drought-resistant perennial type that can beplanted even in wastelands, is easy to establishand grows relatively quickly.The seeds have an oilcontent of 37 percent and can even be burned ina simple diesel engine without being refined5.
Jatropha could therefore be a very valuable cropfor poor communities living on marginal land.Consequently, there have been substantial socialand political pressures to promote its use in Indiaand other developing countries in the region as ameans of poverty reduction, after fully assessingtheir socioeconomic viability and environmentalimpacts.
The costs of production
Biofuel production costs depend on a large number of factors, including the technologyinvolved, economies of scale, the price of thefeedstock materials and competition for landuses. As a result, they vary among producers(Table 5-10). For bioethanol in 2005, for example,the prices per litre of oil equivalent ranged fromUS$0.30 in Brazil to US$1.0 in Germany.For biodiesel the prices are generally higher,between US$0.60 and US$0.80 per litre of petroleum diesel equivalent. Just as Brazil, with ahuge local market and decades of experience, has
Chapter 5: Options in renewable energy 83
Table 5-10 Minimum production costs of biofuels
Source: Reproduced from GTZ 2007
Minimum production costs Per litre fossil fuel equivalent
Source, Date
Reference:Fossil fuels for diesel/gasoline (veryrough world average estimate)
Approx. 45 US¢ (excl. distribution cost, sales margin, etc.)
Rough average cost (at a crude oil price of 60 US$ per barrel)
Bioethanol Brazil 30 US¢ Estimates based onBMELV/FNR/GTZ 2005*
Biodiesel Brazil Production costs (based on production costs for vegetableoil of approx. 200 US$ per tonne): 30-35 US¢ Opportunity costs (based on market prices for vegetable oilof approx. 400 US$ per tonne): 45-50 US¢
Estimates based onBMELV/FNR/GTZ 2005*
Ethanol China 60-80 US¢ Estimates based onBMELV/FNR/GTZ 2005*
Pure Vegetable Plant Oil Germany(rapeseed)
65 US¢ FNR 2006**
Ethanol Tanzania 60-70 US¢ (estimates) Estimates based onBMELV/FNR/GTZ 2005*
Ethanol India 60-70 US¢ Estimates based onBMELV/FNR/GTZ 2005*
Pure Vegetable Plant OilMadagascar (Jatropha)
70 US¢ GTZ 2006***
Biodiesel India (Jatropha-based) 60-80 US¢ Estimates based onBMELV/FNR/GTZ 2005*
Biodiesel Tanzania (Jatropha-based)
70-80 US¢ Rough estimate, based on regional experience
Biodiesel Germany (rapeseed-based)
90 US¢ FNR 2006**
Ethanol Germany (sugar-based)
100 US¢ FNR 2006**
* BMELV/FNR/GTZ 2005, Liquid Biofuels for Transportation: Potential and Implications for Sustainable Agriculture and Energy in the 21st Century. Regional Studies forBrazil, China, India and TanzaniaNote: The figures given are rough estimates based on the BMELV/FNR/GTZ study, but also taking into account regional and sectoral experience. As large-scale biofuelproduction in most countries has not been realized yet, the figures indicate estimated production costs that could be achieved in the medium-term.** FNR (Fachagentur für nachwachsende Rohstoffe) 2006, Biokraftstoffe: eine vergleichende Analyse, available at http://www.fnr.de*** GTZ, 2006, Project report on the Jatropha potential of the SAVA Region in Madagascar
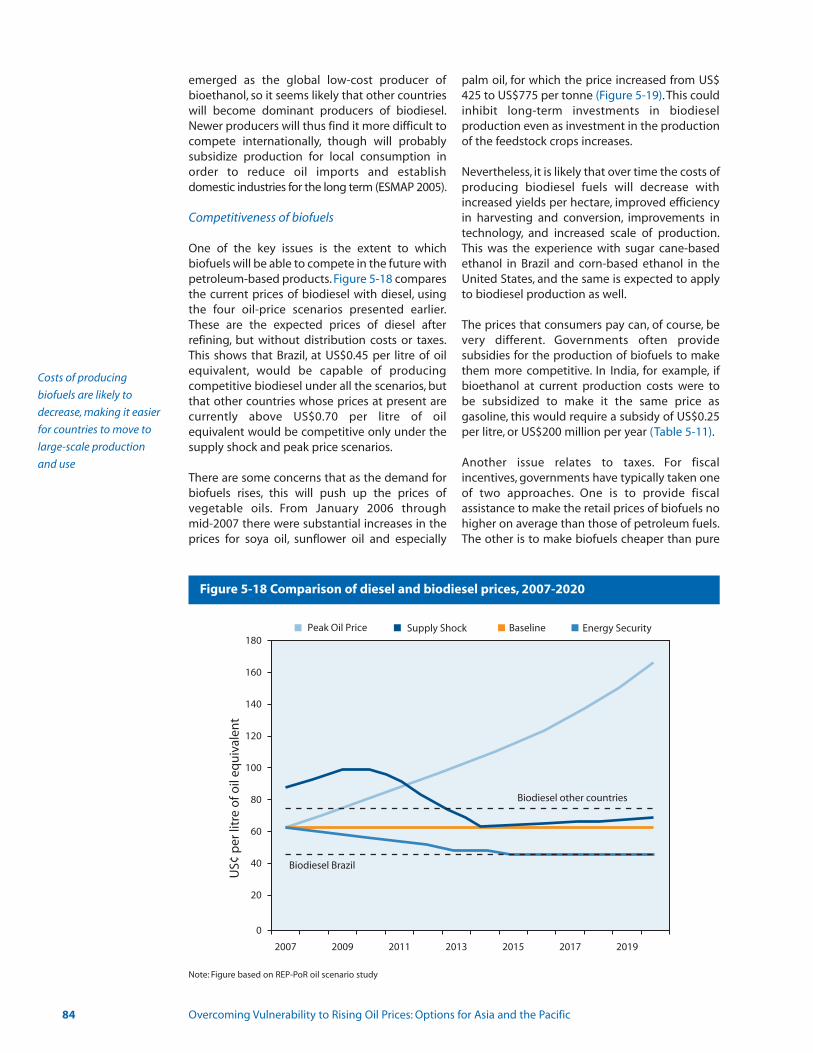
emerged as the global low-cost producer ofbioethanol, so it seems likely that other countrieswill become dominant producers of biodiesel.Newer producers will thus find it more difficult tocompete internationally, though will probablysubsidize production for local consumption inorder to reduce oil imports and establish domestic industries for the long term (ESMAP 2005).
Competitiveness of biofuels
One of the key issues is the extent to which biofuels will be able to compete in the future withpetroleum-based products. Figure 5-18 comparesthe current prices of biodiesel with diesel, usingthe four oil-price scenarios presented earlier.These are the expected prices of diesel after refining, but without distribution costs or taxes.This shows that Brazil, at US$0.45 per litre of oilequivalent, would be capable of producing competitive biodiesel under all the scenarios, butthat other countries whose prices at present arecurrently above US$0.70 per litre of oil equivalent would be competitive only under thesupply shock and peak price scenarios.
There are some concerns that as the demand forbiofuels rises, this will push up the prices of vegetable oils. From January 2006 through mid-2007 there were substantial increases in theprices for soya oil, sunflower oil and especially
palm oil, for which the price increased from US$425 to US$775 per tonne (Figure 5-19). This couldinhibit long-term investments in biodiesel production even as investment in the productionof the feedstock crops increases.
Nevertheless, it is likely that over time the costs ofproducing biodiesel fuels will decrease withincreased yields per hectare, improved efficiencyin harvesting and conversion, improvements intechnology, and increased scale of production.This was the experience with sugar cane-basedethanol in Brazil and corn-based ethanol in theUnited States, and the same is expected to applyto biodiesel production as well.
The prices that consumers pay can, of course, bevery different. Governments often provide subsidies for the production of biofuels to makethem more competitive. In India, for example, ifbioethanol at current production costs were tobe subsidized to make it the same price as gasoline, this would require a subsidy of US$0.25per litre, or US$200 million per year (Table 5-11).
Another issue relates to taxes. For fiscal incentives, governments have typically taken oneof two approaches. One is to provide fiscal assistance to make the retail prices of biofuels nohigher on average than those of petroleum fuels.The other is to make biofuels cheaper than pure
84 Overcoming Vulnerability to Rising Oil Prices: Options for Asia and the Pacific
Figure 5-18 Comparison of diesel and biodiesel prices, 2007-2020
Note: Figure based on REP-PoR oil scenario study
2007 2009 2011 2013 2015 2017 2019
0
180
160
140
120
100
80
60
40
20
Biodiesel Brazil
Biodiesel other countries
Energy SecuritySupply ShockPeak Oil Price Baseline
US¢
per
litr
e o
f oil
equ
ival
ent
Costs of producing
biofuels are likely to
decrease, making it easier
for countries to move to
large-scale production
and use
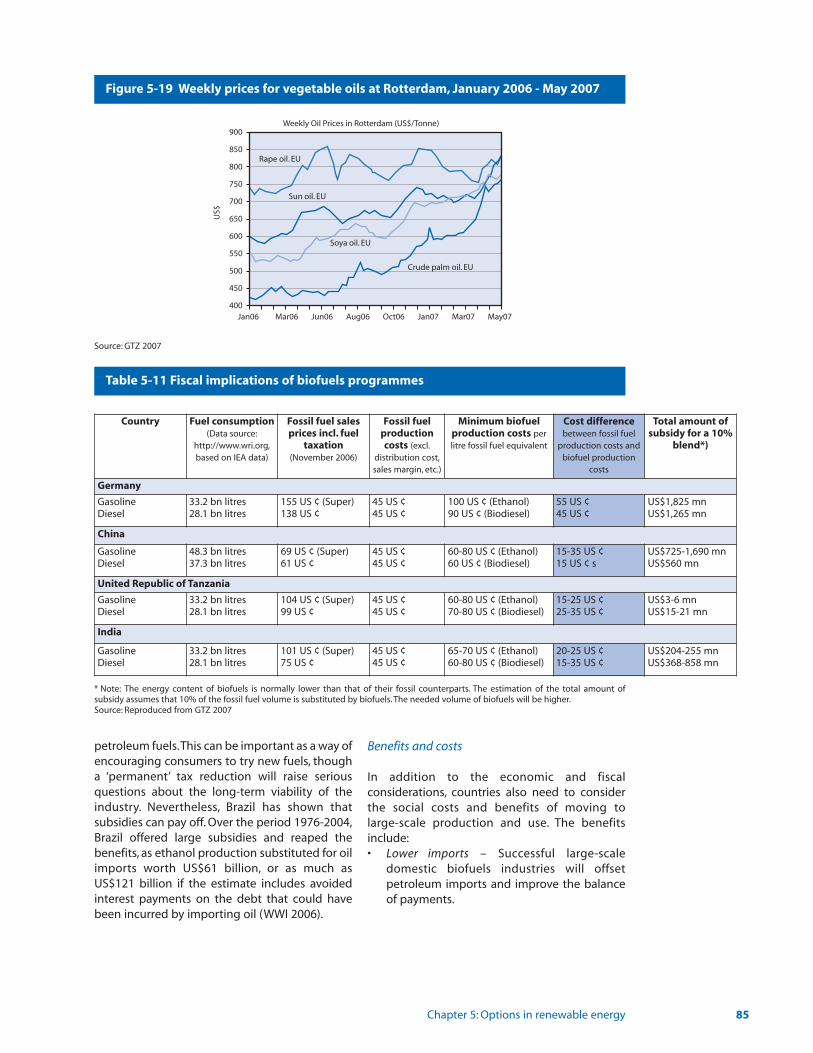
petroleum fuels.This can be important as a way of encouraging consumers to try new fuels, thougha ‘permanent’ tax reduction will raise seriousquestions about the long-term viability of theindustry. Nevertheless, Brazil has shown that subsidies can pay off. Over the period 1976-2004,Brazil offered large subsidies and reaped the benefits, as ethanol production substituted for oilimports worth US$61 billion, or as much as US$121 billion if the estimate includes avoided interest payments on the debt that could havebeen incurred by importing oil (WWI 2006).
Benefits and costs
In addition to the economic and fiscal considerations, countries also need to considerthe social costs and benefits of moving to large-scale production and use. The benefitsinclude:• Lower imports – Successful large-scale
domestic biofuels industries will offset petroleum imports and improve the balance of payments.
Chapter 5: Options in renewable energy 85
Figure 5-19 Weekly prices for vegetable oils at Rotterdam, January 2006 - May 2007
Source: GTZ 2007
Mar06 Jun06 Aug06 Oct06 Jan07 Mar07 May07
Weekly Oil Prices in Rotterdam (US$/Tonne)
Rape oil. EU
Sun oil. EU
Soya oil. EU
Crude palm oil. EU
900
400
450
500
550
600
650
700
750
800
850
Jan06
US$
Table 5-11 Fiscal implications of biofuels programmes
Country Fuel consumption(Data source:
http://www.wri.org,based on IEA data)
Fossil fuel salesprices incl. fuel
taxation(November 2006)
Fossil fuel productioncosts (excl.
distribution cost,sales margin, etc.)
Minimum biofuelproduction costs perlitre fossil fuel equivalent
Cost differencebetween fossil fuel
production costs andbiofuel production
costs
Total amount ofsubsidy for a 10%
blend*)
Germany
GasolineDiesel
33.2 bn litres28.1 bn litres
155 US ¢ (Super)138 US ¢
45 US ¢45 US ¢
100 US ¢ (Ethanol)90 US ¢ (Biodiesel)
55 US ¢ 45 US ¢
US$1,825 mnUS$1,265 mn
China
GasolineDiesel
48.3 bn litres37.3 bn litres
69 US ¢ (Super)61 US ¢
45 US ¢45 US ¢
60-80 US ¢ (Ethanol)60 US ¢ (Biodiesel)
15-35 US ¢ 15 US ¢ s
US$725-1,690 mnUS$560 mn
United Republic of Tanzania
GasolineDiesel
33.2 bn litres28.1 bn litres
104 US ¢ (Super)99 US ¢
45 US ¢45 US ¢
60-80 US ¢ (Ethanol)70-80 US ¢ (Biodiesel)
15-25 US ¢ 25-35 US ¢
US$3-6 mnUS$15-21 mn
India
GasolineDiesel
33.2 bn litres28.1 bn litres
101 US ¢ (Super)75 US ¢
45 US ¢45 US ¢
65-70 US ¢ (Ethanol)60-80 US ¢ (Biodiesel)
20-25 US ¢ 15-35 US ¢
US$204-255 mnUS$368-858 mn
* Note: The energy content of biofuels is normally lower than that of their fossil counterparts. The estimation of the total amount of subsidy assumes that 10% of the fossil fuel volume is substituted by biofuels. The needed volume of biofuels will be higher.Source: Reproduced from GTZ 2007
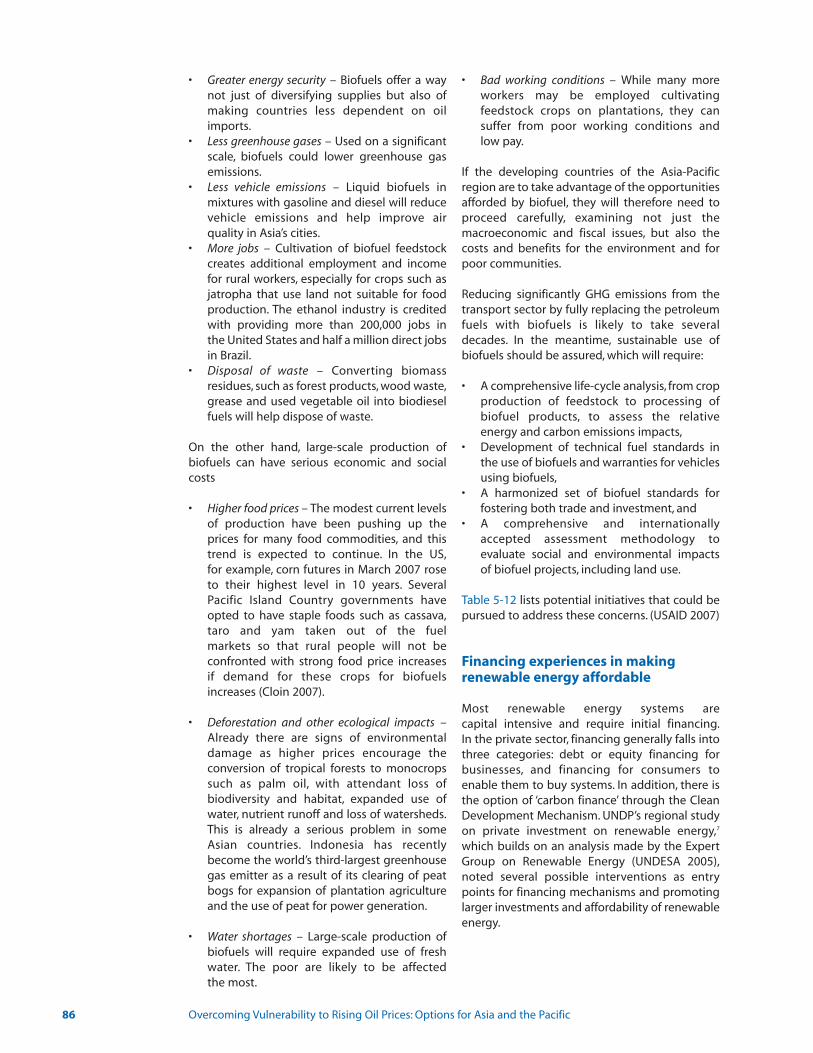
• Greater energy security – Biofuels offer a way not just of diversifying supplies but also ofmaking countries less dependent on oil imports.
• Less greenhouse gases – Used on a significant scale, biofuels could lower greenhouse gas emissions.
• Less vehicle emissions – Liquid biofuels in mixtures with gasoline and diesel will reduce vehicle emissions and help improve air quality in Asia’s cities.
• More jobs – Cultivation of biofuel feedstock creates additional employment and income for rural workers, especially for crops such as jatropha that use land not suitable for food production. The ethanol industry is credited with providing more than 200,000 jobs in the United States and half a million direct jobs in Brazil.
• Disposal of waste – Converting biomass residues, such as forest products, wood waste,grease and used vegetable oil into biodiesel fuels will help dispose of waste.
On the other hand, large-scale production of biofuels can have serious economic and socialcosts
• Higher food prices – The modest current levels of production have been pushing up the prices for many food commodities, and this trend is expected to continue. In the US,for example, corn futures in March 2007 rose to their highest level in 10 years. Several Pacific Island Country governments have opted to have staple foods such as cassava,taro and yam taken out of the fuel markets so that rural people will not be confronted with strong food price increases if demand for these crops for biofuels increases (Cloin 2007).
• Deforestation and other ecological impacts – Already there are signs of environmental damage as higher prices encourage the conversion of tropical forests to monocrops such as palm oil, with attendant loss of biodiversity and habitat, expanded use of water, nutrient runoff and loss of watersheds.This is already a serious problem in some Asian countries. Indonesia has recently become the world’s third-largest greenhouse gas emitter as a result of its clearing of peat bogs for expansion of plantation agriculture and the use of peat for power generation.
• Water shortages – Large-scale production of biofuels will require expanded use of fresh water. The poor are likely to be affected the most.
• Bad working conditions – While many more workers may be employed cultivating feedstock crops on plantations, they can suffer from poor working conditions and low pay.
If the developing countries of the Asia-Pacificregion are to take advantage of the opportunitiesafforded by biofuel, they will therefore need toproceed carefully, examining not just the macroeconomic and fiscal issues, but also thecosts and benefits for the environment and forpoor communities.
Reducing significantly GHG emissions from thetransport sector by fully replacing the petroleumfuels with biofuels is likely to take severaldecades. In the meantime, sustainable use of biofuels should be assured, which will require:
• A comprehensive life-cycle analysis, from crop production of feedstock to processing of biofuel products, to assess the relative energy and carbon emissions impacts,
• Development of technical fuel standards in the use of biofuels and warranties for vehicles using biofuels,
• A harmonized set of biofuel standards for fostering both trade and investment, and
• A comprehensive and internationally accepted assessment methodology to evaluate social and environmental impacts of biofuel projects, including land use.
Table 5-12 lists potential initiatives that could bepursued to address these concerns. (USAID 2007)
Financing experiences in makingrenewable energy affordable
Most renewable energy systems are capital intensive and require initial financing.In the private sector, financing generally falls intothree categories: debt or equity financing forbusinesses, and financing for consumers toenable them to buy systems. In addition, there isthe option of ‘carbon finance’ through the CleanDevelopment Mechanism. UNDP’s regional studyon private investment on renewable energy,7
which builds on an analysis made by the ExpertGroup on Renewable Energy (UNDESA 2005),noted several possible interventions as entrypoints for financing mechanisms and promotinglarger investments and affordability of renewableenergy.
86 Overcoming Vulnerability to Rising Oil Prices: Options for Asia and the Pacific
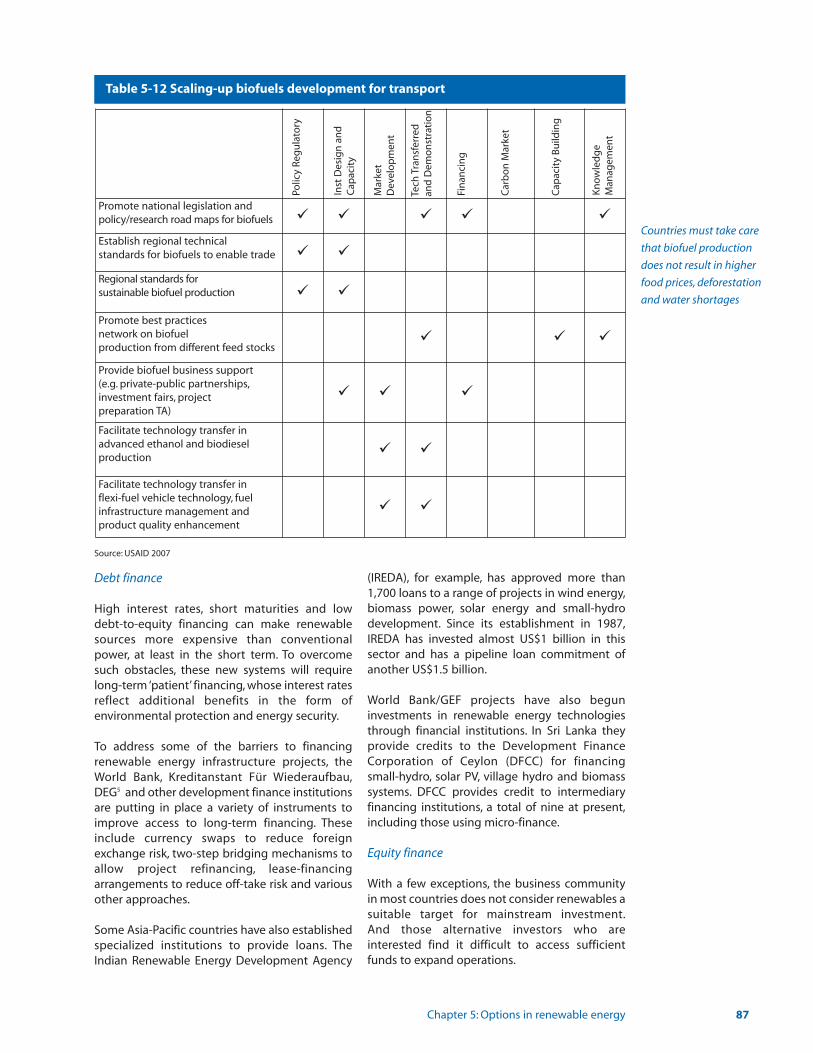
Debt finance
High interest rates, short maturities and low debt-to-equity financing can make renewablesources more expensive than conventionalpower, at least in the short term. To overcomesuch obstacles, these new systems will requirelong-term ‘patient’ financing, whose interest ratesreflect additional benefits in the form of environmental protection and energy security.
To address some of the barriers to financingrenewable energy infrastructure projects, theWorld Bank, Kreditanstant Für Wiederaufbau,DEG5 and other development finance institutionsare putting in place a variety of instruments toimprove access to long-term financing. Theseinclude currency swaps to reduce foreignexchange risk, two-step bridging mechanisms toallow project refinancing, lease-financingarrangements to reduce off-take risk and variousother approaches.
Some Asia-Pacific countries have also establishedspecialized institutions to provide loans. TheIndian Renewable Energy Development Agency
(IREDA), for example, has approved more than1,700 loans to a range of projects in wind energy,biomass power, solar energy and small-hydrodevelopment. Since its establishment in 1987,IREDA has invested almost US$1 billion in thissector and has a pipeline loan commitment ofanother US$1.5 billion.
World Bank/GEF projects have also begun investments in renewable energy technologiesthrough financial institutions. In Sri Lanka theyprovide credits to the Development FinanceCorporation of Ceylon (DFCC) for financing small-hydro, solar PV, village hydro and biomasssystems. DFCC provides credit to intermediaryfinancing institutions, a total of nine at present,including those using micro-finance.
Equity finance
With a few exceptions, the business communityin most countries does not consider renewables asuitable target for mainstream investment.And those alternative investors who are interested find it difficult to access sufficientfunds to expand operations.
Chapter 5: Options in renewable energy 87
Table 5-12 Scaling-up biofuels development for transport
Promote national legislation and policy/research road maps for biofuels � � � � �
Establish regional technical standards for biofuels to enable trade � �
Regional standards for sustainable biofuel production � �
Promote best practices network on biofuel production from different feed stocks
� � �
Provide biofuel business support (e.g. private-public partnerships,investment fairs, project preparation TA)
� � �
Facilitate technology transfer inadvanced ethanol and biodiesel production
� �
Facilitate technology transfer inflexi-fuel vehicle technology, fuelinfrastructure management and product quality enhancement
� �
Polic
y Re
gu
lato
ry
Inst
Des
ign
an
dC
apac
ity
Mar
ket
Dev
elo
pm
ent
Tech
Tra
nsf
erre
d
and
Dem
on
stra
tio
n
Fin
anci
ng
Car
bo
n M
arke
t
Cap
acit
y B
uild
ing
Kn
ow
led
ge
Man
agem
ent
Source: USAID 2007
Countries must take care
that biofuel production
does not result in higher
food prices, deforestation
and water shortages

To help fill the gap, a number of budding international social and environmental venturecapital funds have emerged to provide seed capital. The US-based E+Co, for example, is anindependent company that provides businessdevelopment services and modest loans or equity investments, aiming to demonstrate topublic- and private-sector investors the advantages of local clean-energy enterprises.One example is a project for biogas productionusing the biomass waste from one of Thailand’slargest cassava processors. E+Co has investedUS$197,500, with leveraged co-financing of US$3.4 million from equity investors and banks. Thefactory is now displacing 8 million litres of heavyfuel oil each year, while generating 30,000 MWhof electricity.
Another example is the international non-profitorganization Winrock International which, alongwith network members in Indonesia and thePhilippines, has provided seed capital for pre-investment support and cost-share investments. Since 1998, Winrock’s Nepal programme, for example, has been able to leverage more than US$5 million in equity investment in the small hydropower sector.
New types of finance instruments are also nowavailable, including ‘quasi-equity,’ which can combine some forms of preferred shares withsubordinated debt and the option to be boughtout later.
End-user finance
Households or communities that want to installrenewable energy technologies can get financefrom various sources, including retailers,commercial bank loans and microcredit. Or theycan lease the equipment or pay fees for services.Retailers who want to build a large-scale credit-backed sales operation will usually look toa banking institution. Thus far, however, this ishappening only on a small scale. Banks are certainly making loans in unprecedented numbers for household appliances, motorcycles,cars and homes across many countries in Asiaand the Pacific, largely in urban areas and basedon salaried incomes. Mainstream banks have not, however, been financing renewable energysystems.
Across the region, microfinance organizations toohave only just started lending for solar home systems or biogas. Prominent examples includeGrameen Shakti (Box 5-1) and Bangladesh RuralAdvancement Committee (BRAC) in Bangladesh
and Sarvodaya Economic EnterprisesDevelopment Services in Sri Lanka, all of whichbenefit from lines of credit from the World Bankand the Global Environment Facility. In othercountries without long traditions of microfinance, it has been more difficult to raise thefunds. However, organizations such as the TriodosBank of the Netherlands have been providing loans to microfinance institutions toon-lend to their customers for energy systems.
For the poorest households, usually the most successful way of providing finance for energy isby combining this with income-generation activities. One example is Wahan Dharak, a ruralcooperative society in Maharashtra, India, whichfor a daily fee provides micro-enterprises withsolar lanterns.
Carbon finance
Another potential source of finance is the CleanDevelopment Mechanism (CDM) which emergedfrom the Kyoto Protocol. This allows emitters indeveloped countries to buy emission rights byfunding projects that help reduce carbon dioxideemissions in developing countries. In Asia, as ofAugust 2007, the market for CDM projects was dominated by India (42 percent) and China (42 percent), with smaller volumes of registeredand pipeline projects in Malaysia (4 percent) anda number of other countries (12 percent) (UNEP Risoe 2007).
Most CDM transactions aim to reduce emissionsof HFC (hydrofluorocarbon) gases from industry,of nitrous oxide from agriculture and of methanefrom landfill projects. However, the trend is shifting gradually toward renewable energywhich, as of July 2007, accounted for 53 percentof CDM projects. Renewable energy CDM projectsare largely concerned with biomass (32 percent),hydro (28 percent), and wind (25 percent), withsmaller amounts from geothermal, biogas, tidaland solar. Asia and Pacific developing countriesaccount for 58 percent of the CDM projectpipeline, with 284 projects in India alone andaround 60 in China (UNFCCC 2007).
For CDM projects, renewables have the disadvantage of having high initial costs andbeing quite high-risk. And for household projects,it can also be difficult to provide ‘emission reduction units’ on a sufficient scale. Buyers typically purchase a minimum of 30,000 tonnesof CO2 per year, which would need a project with120,000 solar home systems to make it worthwhile to develop into a CDM project.
88 Overcoming Vulnerability to Rising Oil Prices: Options for Asia and the Pacific
Innovative financing can
result in larger investments
in renewable energy,
including new debt and
equity investments,
end-user finance and
carbon finance
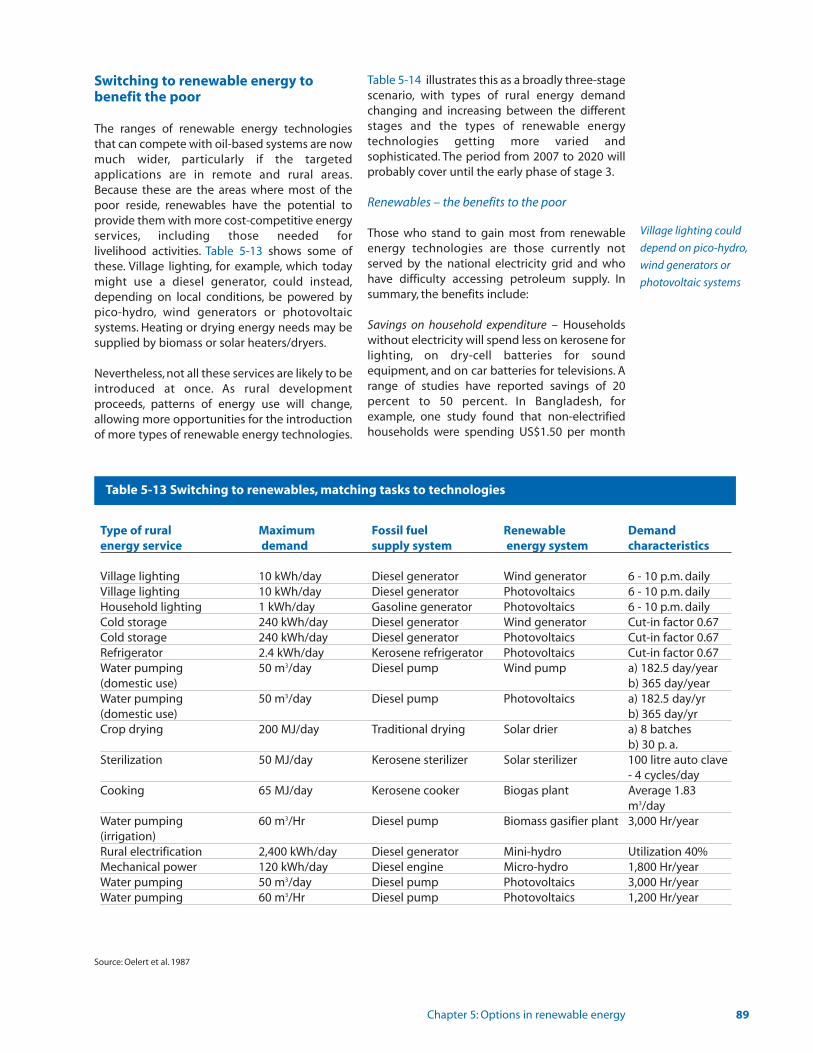
Switching to renewable energy to benefit the poor
The ranges of renewable energy technologiesthat can compete with oil-based systems are nowmuch wider, particularly if the targeted applications are in remote and rural areas.Because these are the areas where most of thepoor reside, renewables have the potential toprovide them with more cost-competitive energyservices, including those needed for livelihood activities. Table 5-13 shows some ofthese. Village lighting, for example, which todaymight use a diesel generator, could instead,depending on local conditions, be powered bypico-hydro, wind generators or photovoltaic systems. Heating or drying energy needs may besupplied by biomass or solar heaters/dryers.
Nevertheless, not all these services are likely to beintroduced at once. As rural development proceeds, patterns of energy use will change,allowing more opportunities for the introductionof more types of renewable energy technologies.
Table 5-14 illustrates this as a broadly three-stagescenario, with types of rural energy demandchanging and increasing between the differentstages and the types of renewable energy technologies getting more varied and sophisticated. The period from 2007 to 2020 willprobably cover until the early phase of stage 3.
Renewables – the benefits to the poor
Those who stand to gain most from renewableenergy technologies are those currently notserved by the national electricity grid and whohave difficulty accessing petroleum supply. Insummary, the benefits include:
Savings on household expenditure – Householdswithout electricity will spend less on kerosene forlighting, on dry-cell batteries for sound equipment, and on car batteries for televisions. Arange of studies have reported savings of 20 percent to 50 percent. In Bangladesh, for example, one study found that non-electrifiedhouseholds were spending US$1.50 per month
Chapter 5: Options in renewable energy 89
Type of rural Maximum Fossil fuel Renewable Demand energy service demand supply system energy system characteristics
Village lighting 10 kWh/day Diesel generator Wind generator 6 - 10 p.m. dailyVillage lighting 10 kWh/day Diesel generator Photovoltaics 6 - 10 p.m. dailyHousehold lighting 1 kWh/day Gasoline generator Photovoltaics 6 - 10 p.m. dailyCold storage 240 kWh/day Diesel generator Wind generator Cut-in factor 0.67Cold storage 240 kWh/day Diesel generator Photovoltaics Cut-in factor 0.67Refrigerator 2.4 kWh/day Kerosene refrigerator Photovoltaics Cut-in factor 0.67Water pumping 50 m3/day Diesel pump Wind pump a) 182.5 day/year(domestic use) b) 365 day/yearWater pumping 50 m3/day Diesel pump Photovoltaics a) 182.5 day/yr(domestic use) b) 365 day/yrCrop drying 200 MJ/day Traditional drying Solar drier a) 8 batches
b) 30 p. a.Sterilization 50 MJ/day Kerosene sterilizer Solar sterilizer 100 litre auto clave
- 4 cycles/dayCooking 65 MJ/day Kerosene cooker Biogas plant Average 1.83
m3/dayWater pumping 60 m3/Hr Diesel pump Biomass gasifier plant 3,000 Hr/year(irrigation)Rural electrification 2,400 kWh/day Diesel generator Mini-hydro Utilization 40%Mechanical power 120 kWh/day Diesel engine Micro-hydro 1,800 Hr/yearWater pumping 50 m3/day Diesel pump Photovoltaics 3,000 Hr/yearWater pumping 60 m3/Hr Diesel pump Photovoltaics 1,200 Hr/year
Table 5-13 Switching to renewables, matching tasks to technologies
Source: Oelert et al. 1987
Village lighting could
depend on pico-hydro,
wind generators or
photovoltaic systems
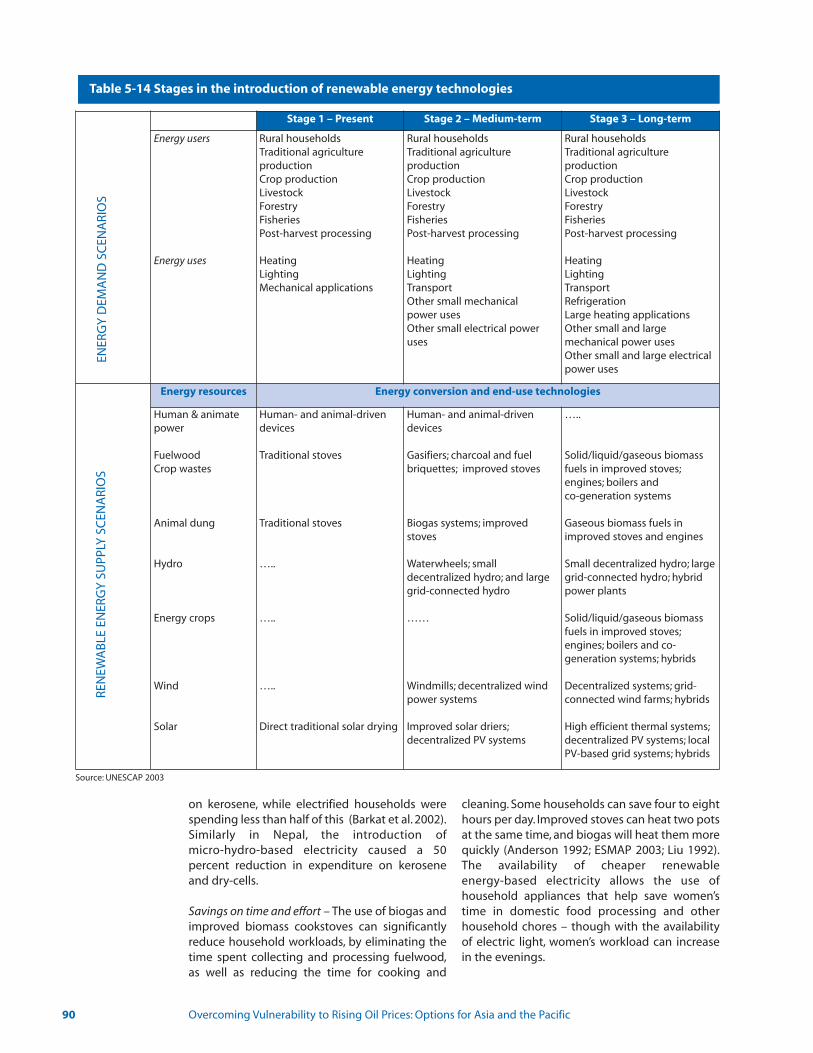
on kerosene, while electrified households werespending less than half of this (Barkat et al. 2002).Similarly in Nepal, the introduction of micro-hydro-based electricity caused a 50 percent reduction in expenditure on keroseneand dry-cells.
Savings on time and effort – The use of biogas andimproved biomass cookstoves can significantlyreduce household workloads, by eliminating thetime spent collecting and processing fuelwood,as well as reducing the time for cooking and
cleaning. Some households can save four to eighthours per day. Improved stoves can heat two potsat the same time, and biogas will heat them more quickly (Anderson 1992; ESMAP 2003; Liu 1992).The availability of cheaper renewable energy-based electricity allows the use of household appliances that help save women’stime in domestic food processing and otherhousehold chores – though with the availabilityof electric light, women’s workload can increasein the evenings.
90 Overcoming Vulnerability to Rising Oil Prices: Options for Asia and the Pacific
Stage 1 – Present Stage 2 – Medium-term Stage 3 – Long-term
Energy users
Energy uses
Rural householdsTraditional agriculture productionCrop productionLivestockForestryFisheriesPost-harvest processing
HeatingLightingMechanical applications
Rural householdsTraditional agriculture productionCrop productionLivestockForestryFisheriesPost-harvest processing
HeatingLightingTransportOther small mechanical power usesOther small electrical poweruses
Rural householdsTraditional agriculture productionCrop productionLivestockForestryFisheriesPost-harvest processing
HeatingLightingTransportRefrigerationLarge heating applicationsOther small and large mechanical power usesOther small and large electricalpower uses
Energy resources Energy conversion and end-use technologies
Human & animatepower
FuelwoodCrop wastes
Animal dung
Hydro
Energy crops
Wind
Solar
Human- and animal-drivendevices
Traditional stoves
Traditional stoves
…..
…..
…..
Direct traditional solar drying
Human- and animal-drivendevices
Gasifiers; charcoal and fuel briquettes; improved stoves
Biogas systems; improvedstoves
Waterwheels; small decentralized hydro; and largegrid-connected hydro
……
Windmills; decentralized windpower systems
Improved solar driers;decentralized PV systems
…..
Solid/liquid/gaseous biomassfuels in improved stoves;engines; boilers and co-generation systems
Gaseous biomass fuels inimproved stoves and engines
Small decentralized hydro; largegrid-connected hydro; hybridpower plants
Solid/liquid/gaseous biomassfuels in improved stoves;engines; boilers and co-generation systems; hybrids
Decentralized systems; grid-connected wind farms; hybrids
High efficient thermal systems;decentralized PV systems; localPV-based grid systems; hybrids
ENER
GY
DEM
AN
D S
CEN
ARI
OS
REN
EWA
BLE
EN
ERG
Y S
UPP
LY S
CEN
ARI
OS
Table 5-14 Stages in the introduction of renewable energy technologies
Source: UNESCAP 2003
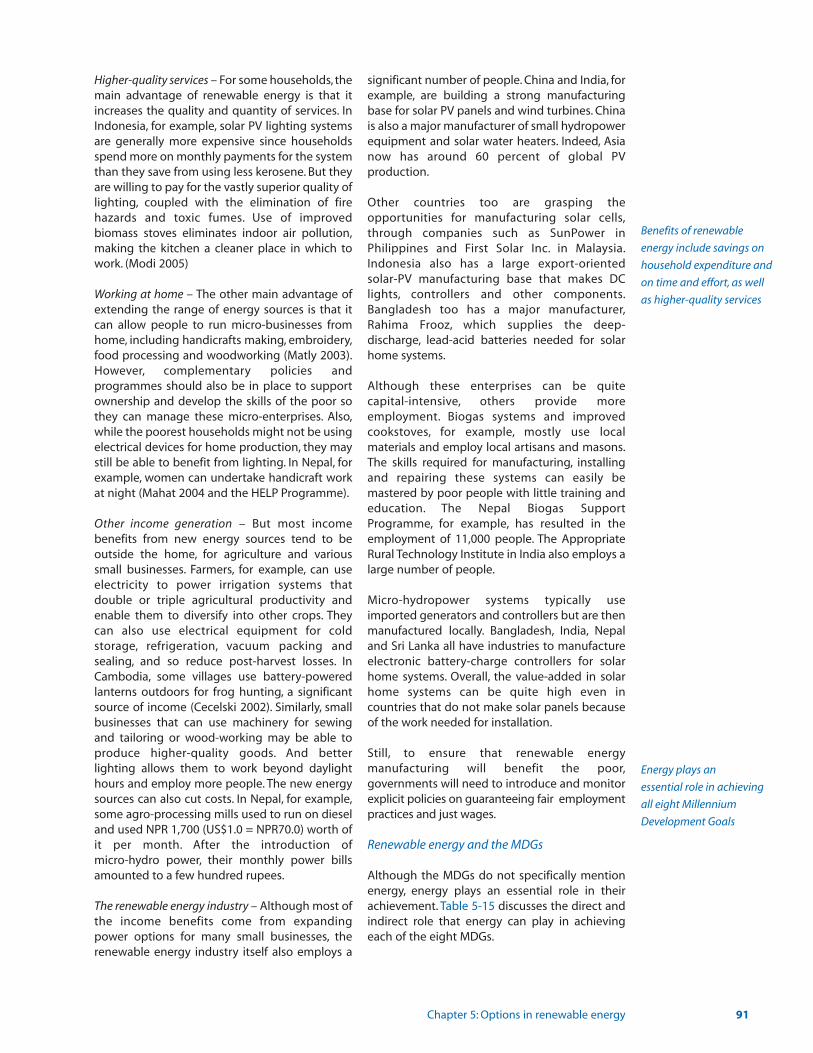
Higher-quality services – For some households, themain advantage of renewable energy is that itincreases the quality and quantity of services. InIndonesia, for example, solar PV lighting systemsare generally more expensive since householdsspend more on monthly payments for the systemthan they save from using less kerosene. But theyare willing to pay for the vastly superior quality oflighting, coupled with the elimination of fire hazards and toxic fumes. Use of improved biomass stoves eliminates indoor air pollution,making the kitchen a cleaner place in which towork. (Modi 2005)
Working at home – The other main advantage ofextending the range of energy sources is that itcan allow people to run micro-businesses fromhome, including handicrafts making, embroidery,food processing and woodworking (Matly 2003).However, complementary policies and programmes should also be in place to supportownership and develop the skills of the poor sothey can manage these micro-enterprises. Also,while the poorest households might not be usingelectrical devices for home production, they maystill be able to benefit from lighting. In Nepal, forexample, women can undertake handicraft workat night (Mahat 2004 and the HELP Programme).
Other income generation – But most income benefits from new energy sources tend to be outside the home, for agriculture and varioussmall businesses. Farmers, for example, can useelectricity to power irrigation systems that double or triple agricultural productivity andenable them to diversify into other crops. Theycan also use electrical equipment for cold storage, refrigeration, vacuum packing and sealing, and so reduce post-harvest losses. InCambodia, some villages use battery-poweredlanterns outdoors for frog hunting, a significantsource of income (Cecelski 2002). Similarly, smallbusinesses that can use machinery for sewingand tailoring or wood-working may be able toproduce higher-quality goods. And better lighting allows them to work beyond daylighthours and employ more people. The new energysources can also cut costs. In Nepal, for example,some agro-processing mills used to run on dieseland used NPR 1,700 (US$1.0 = NPR70.0) worth ofit per month. After the introduction of micro-hydro power, their monthly power billsamounted to a few hundred rupees.
The renewable energy industry – Although most ofthe income benefits come from expandingpower options for many small businesses, therenewable energy industry itself also employs a
significant number of people. China and India, forexample, are building a strong manufacturingbase for solar PV panels and wind turbines. Chinais also a major manufacturer of small hydropowerequipment and solar water heaters. Indeed, Asianow has around 60 percent of global PV production.
Other countries too are grasping the opportunities for manufacturing solar cells,through companies such as SunPower inPhilippines and First Solar Inc. in Malaysia.Indonesia also has a large export-oriented solar-PV manufacturing base that makes DClights, controllers and other components.Bangladesh too has a major manufacturer,Rahima Frooz, which supplies the deep-discharge, lead-acid batteries needed for solarhome systems.
Although these enterprises can be quite capital-intensive, others provide more employment. Biogas systems and improvedcookstoves, for example, mostly use local materials and employ local artisans and masons.The skills required for manufacturing, installingand repairing these systems can easily be mastered by poor people with little training andeducation. The Nepal Biogas SupportProgramme, for example, has resulted in theemployment of 11,000 people. The AppropriateRural Technology Institute in India also employs alarge number of people.
Micro-hydropower systems typically use imported generators and controllers but are thenmanufactured locally. Bangladesh, India, Nepaland Sri Lanka all have industries to manufactureelectronic battery-charge controllers for solarhome systems. Overall, the value-added in solarhome systems can be quite high even in countries that do not make solar panels becauseof the work needed for installation.
Still, to ensure that renewable energy manufacturing will benefit the poor,governments will need to introduce and monitorexplicit policies on guaranteeing fair employmentpractices and just wages.
Renewable energy and the MDGs
Although the MDGs do not specifically mentionenergy, energy plays an essential role in theirachievement. Table 5-15 discusses the direct andindirect role that energy can play in achievingeach of the eight MDGs.
Chapter 5: Options in renewable energy 91
Benefits of renewable
energy include savings on
household expenditure and
on time and effort, as well
as higher-quality services
Energy plays an
essential role in achieving
all eight Millennium
Development Goals
92 Overcoming Vulnerability to Rising Oil Prices: Options for Asia and the Pacific
Table 5-15 Renewable energy and the Millennium Development Goals
Source: UN-Energy 2005
MDGs Relevance of renewable energy
1. Eradicate extreme poverty and hunger Energy inputs, such as electricity and fuels, are essential togenerate jobs, industrial activities, transportation, commerce,micro-enterprises and agriculture outputs. Most staple foods mustbe processed, conserved and cooked, requiring heat from variousfuels.
2. Achieve universal primary education To attract teachers to rural areas, electricity is needed for homesand schools. After-dusk study requires illumination. Many children,especially girls, do not attend primary schools, because they haveto carry wood and water to meet family subsistence needs.
3. Promote gender equality and empower women Lack of access to modern fuels and electricity contributes to gender inequality. Women are responsible for most householdcooking and water-boiling activities. This takes time away fromother productive activities as well as from educational and socialparticipation. Access to modern fuels eases women’s domesticburden and allows them to pursue educational, economic andother opportunities.
4. Reduce child mortality Diseases caused by unboiled water, and respiratory illness causedby the effects of indoor air pollution from traditional fuels andstoves, directly contribute to infant and child disease and mortality.
5. Improve maternal health Women are disproportionately affected by indoor air pollutionand water- and food-borne illnesses. Lack of electricity in healthclinics, little illumination for night time deliveries, and the daily drudgery and physical burden of fuel collection and transport allcontribute to poor maternal health conditions, especially in ruralareas.
6. Combat HIV/AIDS, malaria and other diseases Electricity for communication such as radio and television canspread important public health information to combat deadly diseases. Healthcare facilities, doctors and nurses all require electricity and the services that it provides (illumination,refrigeration, sterilization, etc) to deliver effective health services.
7. Ensure environmental sustainability Conventional modes of energy production, distribution and consumption have many adverse effects on the local, regional andglobal environment, including indoor, local and regional air pollution, local particulates, land degradation, acidification of landand water, and climate change. Cleaner energy systems are neededto address all of these effects and to contribute to environmental sustainability.
8. Develop a global partnership for development The World Summit for Sustainable Development called for partnerships between public entities, development agencies,civil society and the private sector to support sustainable development, including the delivery of affordable, reliable and environmentally sustainable energy services.
A policy framework for renewableenergy favourable to the poor8
Conventional energy systems tend to have lowcapital costs, but significant operating costs.For renewable systems the picture is reversed:Capital costs are high, but over time these are offset by low operating costs. Added to this arethe environmental benefits, the prospect ofincreased employment, reduced import dependence and reduced burden on foreignexchange.
However, the marketplace does not account forany of this value creation. Nor does it regard therural poor as good credit risks, seeing off-grid systems as high-risk, low-return propositions. Inthe past, some governments have respondedwith large subsidies in the hope that this wouldattract the private sector into the market. But itnow seems unlikely that this on its own will domuch to deliver energy services to the rural poor.
Instead of withdrawing to let private marketsdevelop on their own, a better approach wouldbe to work alongside local communities and theprivate sector to remove barriers and reducerisks. Among the policies that have proven theirability to advance renewables are:
• Create supportive policy and institutional frameworks – In most countries, energy is principally a private business, but providing energy access for rural areas has traditionally been considered a government responsibility.Indeed, governments already subsidize the extension of electricity grids and provide the poor with subsidized petroleum fuels. They could similarly give support for renewable energy technologies, while linking these with wider rural development and poverty eradication initiatives. Governments could also support reliable assessments of renewable resources so as to encourage investment.
• Promote private sector involvement – Supplyingrural energy services often means dealing with a large number of small transactions dispersed over a wide area. This problem can be addressed with innovative financing mechanisms. These include microcredit,whether from the energy company or its dealers, or from micro-finance institutions or community-based organizations. These can be linked with specially designed credit lines through larger financial institutions,
potentially backed by the government. The new financing mechanisms also include micro-rental or fee-for-service approaches,where all or part of the equipment remains the property of the company, and customers make regular payments for its use. One example is a utility-style concession in which a concessionaire owns the system, charges a monthly fee and is responsible for the service.
• Level the playing field – Higher oil prices are creating major problems for countries that subsidize those fuels, threatening economic growth if the subsidies are kept in place and encouraging consumer outrage if they are not. Conventional energy sources also impose external costs on the environment and human health. These can be internalized with levies and taxes, as some countries in Europe are doing through carbon taxes to internalize the cost of greenhouse gas emissions. Just as many of the costs of conventional energy are not internalized, markets and policies often fail to internalize the myriad positive externalities – improvements in health care,education, communications and employment – that can result from bringing electricity to underserved areas. Community leaders, local residents and project developers should seek to explicitly identify such benefits. Identifying the costs and benefits would also benefit from reliable methodologies for quantifying externalities.
• Nurture micro-enterprise – Renewable energy technologies can spur the creation of micro-enterprises by engaging local people,particularly the poor, in harnessing energy and in providing energy services. Renewable energy fights poverty most effectively when linked with income generation in both producing and using the energy, though the energy also has to meet essential human needs for cooking, lighting, heating and water supply.
• Integrate projects around local needs and capacity – Renewable energy services must be coupled with existing development activities for water, health, education and entrepreneurship, which it can also make more effective. In particular, they should address the requirements of women, by offering security and income, reducing labour and improving health by reducing indoor air pollution.
Chapter 5: Options in renewable energy 93
Capital costs of renewable
systems are high, but are
offset by low operating
costs, environmental
benefits and increased
employment
Countries must create
supportive policy and
institutional frameworks
for renewables and
promote private sector
involvement
Biofuel development to benefit the poor
Biofuels are very promising if delivered in theright manner; but with the ever-increasingdemand for transport fuels, there are genuineconcerns that biofuels may create greater competition for limited land and biodiversity,water and food. From the point of view of benefits for the poor, biofuels present a numberof challenges and opportunities which have to beexamined carefully and balanced.
The rapid growth in the demand and productionof liquid biofuels and its impacts, particularly onfood security, rural development, land use andthe environment, can be both positive and negative. Development or expansion of existingliquid biofuels policies and programmes,particularly in making biofuels developmentwork more effectively for poverty eradication,should be evaluated and assessed with considerations of these aspects:• Attention on biofuels should not be limited to
sugar and starch crops for the production of ethanol and vegetable-oil plants for the production of biodiesel. A comprehensive sustainable bioenergy programme should cover all sources:
° Sustainable production of trees and other woody biomass from forests and non-forest areas for solid biofuel production.
° Agricultural residues for heat and power generation through direct combustion,co-generation, biogas generation and gasification.
° Cellulosic sources available for second-generation biofuel technologies from the agriculture and forestry sectors.
• All end uses of these bioenergy sources should be considered, such as heat and electricity, including non-transport uses of liquid biofuels – liquid biofuels are too focused on private urban transport use.
• Establishment of clear linkages between bioenergy development and food prices, food security, rural economics, trade, employment,biodiversity and climate change. Such linkages have to be assessed at the local,national and global levels.
• Promotion of active entry of small-scale farmers into bioenergy conversion stages and upward movement in the market supply chain.
• Promote engagement of SMEs in seeking production models of varying scales to allow them to be more competitive, using cooperatives, for example.
The exercise in expanding and strengtheningbiofuels programmes so that the poor get a greater share of the benefits should start with an evaluation and assessment of current experiences and policies.This can include modelsand practical tools currently used in national,regional and international organizations in areassuch as land use planning, biofuels potential evaluation and impacts on food security andcommodity prices.
In most developing countries there is a need tostrengthen the decision-making capacities so asto tap the above-mentioned opportunities whilstavoiding potentially important negative impactsin various fields linked to rural livelihoods,equitable economic development and the environment.
The benefits of renewable energy services for the poor
In summary, renewable energy technologies offergreat potential for providing energy services to the rural poor, especially those notconnected to electricity grids. At specific locations and oil price levels, they are likely to becheaper and cleaner than fossil fuel alternativesor both off-grid and mini-grid systems, making itpossible for poor communities not just toimprove their living conditions, but also theirincome-earning opportunities. However, the upfront costs can be high, requiring innovativefinancing methods and government support.
Biomass energy, particularly biofuels, can substitute for oil imports and will steadilybecome more competitive. Governments need to be aware of the social, economic and environmental impacts of biofuel production andhence put policy measures in place.The recent rapid increase in biofuel productionhas triggered concerns about its negativeimpacts on food supply and prices. Using foodcrops, such as corn, to produce ethanol will pushup the prices of corn and corn-derived fooditems. This has already happened. There is alsoconcern about using up land for biofuel feedstock production.
Indeed, there is increasing concern that currentbiofuel development trends, instead of helpingachieve poverty eradication in rural areas, couldinstead exacerbate food insecurity. There are alsoenvironmental concerns about the impacts ofmonoculture biofuel feedstock plantations andthe conversion of forests to such plantations.
94 Overcoming Vulnerability to Rising Oil Prices: Options for Asia and the Pacific
Food security, rural
development and land use
concerns of biofuel
development must be
addressed
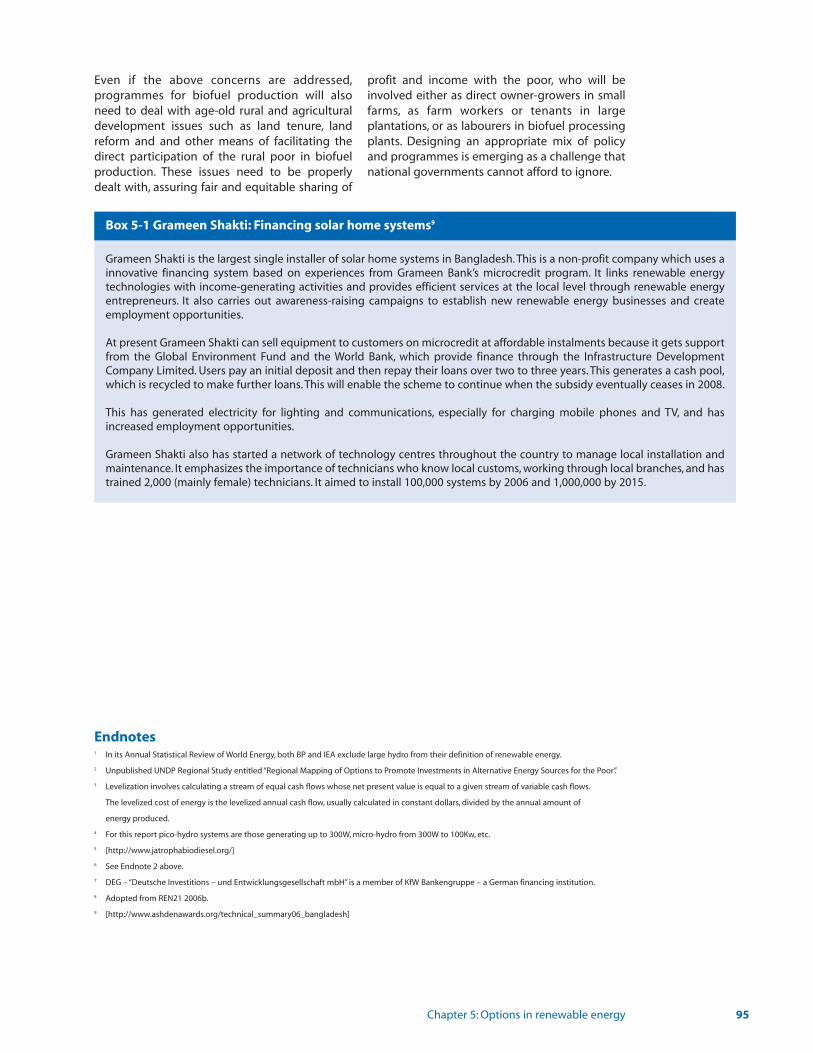
Even if the above concerns are addressed,programmes for biofuel production will alsoneed to deal with age-old rural and agriculturaldevelopment issues such as land tenure, landreform and and other means of facilitating thedirect participation of the rural poor in biofuel production. These issues need to be properlydealt with, assuring fair and equitable sharing of
profit and income with the poor, who will beinvolved either as direct owner-growers in smallfarms, as farm workers or tenants in large plantations, or as labourers in biofuel processingplants. Designing an appropriate mix of policyand programmes is emerging as a challenge thatnational governments cannot afford to ignore.
Chapter 5: Options in renewable energy 95
Grameen Shakti is the largest single installer of solar home systems in Bangladesh. This is a non-profit company which uses ainnovative financing system based on experiences from Grameen Bank’s microcredit program. It links renewable energy technologies with income-generating activities and provides efficient services at the local level through renewable energyentrepreneurs. It also carries out awareness-raising campaigns to establish new renewable energy businesses and createemployment opportunities.
At present Grameen Shakti can sell equipment to customers on microcredit at affordable instalments because it gets supportfrom the Global Environment Fund and the World Bank, which provide finance through the Infrastructure DevelopmentCompany Limited. Users pay an initial deposit and then repay their loans over two to three years. This generates a cash pool,which is recycled to make further loans. This will enable the scheme to continue when the subsidy eventually ceases in 2008.
This has generated electricity for lighting and communications, especially for charging mobile phones and TV, and hasincreased employment opportunities.
Grameen Shakti also has started a network of technology centres throughout the country to manage local installation andmaintenance. It emphasizes the importance of technicians who know local customs, working through local branches, and hastrained 2,000 (mainly female) technicians. It aimed to install 100,000 systems by 2006 and 1,000,000 by 2015.
Box 5-1 Grameen Shakti: Financing solar home systems9
Endnotes1 In its Annual Statistical Review of World Energy, both BP and IEA exclude large hydro from their definition of renewable energy.
2 Unpublished UNDP Regional Study entitled “Regional Mapping of Options to Promote Investments in Alternative Energy Sources for the Poor”.
3 Levelization involves calculating a stream of equal cash flows whose net present value is equal to a given stream of variable cash flows.
The levelized cost of energy is the levelized annual cash flow, usually calculated in constant dollars, divided by the annual amount of
energy produced.
4 For this report pico-hydro systems are those generating up to 300W, micro-hydro from 300W to 100Kw, etc.
5 [http://www.jatrophabiodiesel.org/]
6 See Endnote 2 above.
7 DEG – “Deutsche Investitions – und Entwicklungsgesellschaft mbH” is a member of KfW Bankengruppe – a German financing institution.
8 Adopted from REN21 2006b.
9 [http://www.ashdenawards.org/technical_summary06_bangladesh]


Chapter 6: Policies for an era of uncertain oil prices
6
The two previous chapters have set out fivebroad strategies for coping with higher oil prices.In summary, these were:1. Managing oil price risk – Covering such issues
as pricing policies, targeted subsidies and financial tools.
2. Enhancing oil supply – Including strengtheningoil exploration and extraction, building refining capacity, diversifying sources of supply and engaging in barter.
3. Restraining oil demand – Increasing efficiencyin transport, industry and agriculture.
4. Preparing for emergencies – Building strategic reserves and planning for rationing.
5. Diversifying fuels – In some cases this may mean using more coal, but for many countries the opportunities will lie in renewable resources.
This chapter suggests a ranking of these strategies and their sub-strategies according totheir potential to meet various objectives:increasing country-level and household energysecurity, increasing income generation,alleviating human poverty and minimizing environmental impacts. The strategies were alsoassessed in terms of their cost and the timerequired for implementation. A process for prioritizing sub-strategies under different oilprice scenarios for case study countries is illustrated in Figure 6-1. Those with the highestpotential to meet the various objectives listedabove have the highest ranking (refer toAppendix F for methodology). Where sub-strategies have equal importance, they are givenequal ranks, so although there are 18 sub-strategies in Table 6-1, there are only seven ranks.Which of these strategies should take priority willdepend very much on national circumstances,which are discussed in subsequent sections ofthis chapter. For ease of interpretation, the strategies are grouped into three priority classes:
high, medium and low (Table 6-2). Sub-strategieswith ranks 1 to 3 are grouped as high priority,sub-strategies with rank 4 as medium priority,and those with ranks 5 to 7 as low priority.
Clearly, the most appropriate policy mix willchange depending on what happens to oil prices.To arrive at a more precise sequence, it is useful to consider different possible scenarios. As introduced in Chapter 5, the four proposed in thisreport are: baseline, supply shock, peak oil priceand energy security.
Baseline (BL)
This is derived from the oil market scenario presented by the IMF (IMF 2005) which is consistent with those of the IEA, OECD and OPEC.It assumes that future oil market developmentsare likely to be in two phases. First, until 2010,high oil prices will keep the oil market broadly inbalance, with incremental oil demand being metmostly by high non-OPEC production. From 2010,as non-OPEC production peaks, there are likely tobe calls on OPEC to increase output. Subject toshort-term reversible spikes, oil prices will rangebetween US$65 and US$75 per barrel. The oilintensity of economies will remain constant, ordecline at current rates as a result of substitutionmainly by natural gas and coal, which will be offset by continued growth in aggregatedemand. This scenario assumes an average constant price of US$70 per barrel.
Supply Shock (SS)
This scenario considers an abrupt drop in oil supply. This could be due to geopolitical events,such as armed conflicts in the Middle East, or arise in political tension over supply terms in
Policies for an era of uncertain oil prices
What can the countries of the region do to protect themselves in an increasingly uncertain energy environment? This chapter considers how they can respond to different oil price scenarios, looking in particular at the options for China, India, Indonesia and Lao PDR. It alsoexplores ways all countries can secure energy and power for the poor, and proposes a newregional compensatory finance facility as a means to help Least Developed Countries and low-income countries to address crises due to oil price rises.
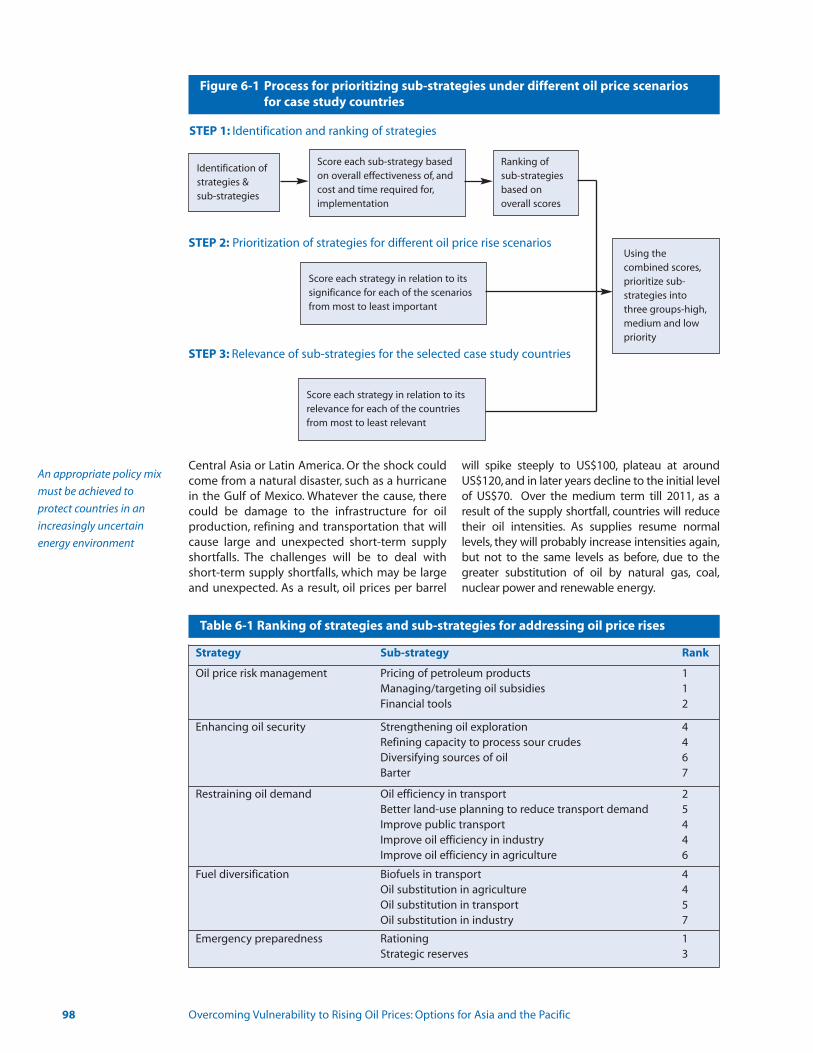
98 Overcoming Vulnerability to Rising Oil Prices: Options for Asia and the Pacific
Central Asia or Latin America. Or the shock couldcome from a natural disaster, such as a hurricanein the Gulf of Mexico. Whatever the cause, therecould be damage to the infrastructure for oil production, refining and transportation that willcause large and unexpected short-term supplyshortfalls. The challenges will be to deal withshort-term supply shortfalls, which may be largeand unexpected. As a result, oil prices per barrel
will spike steeply to US$100, plateau at aroundUS$120, and in later years decline to the initial levelof US$70. Over the medium term till 2011, as aresult of the supply shortfall, countries will reducetheir oil intensities. As supplies resume normal levels, they will probably increase intensities again,but not to the same levels as before, due to thegreater substitution of oil by natural gas, coal,nuclear power and renewable energy.
Figure 6-1 Process for prioritizing sub-strategies under different oil price scenariosfor case study countries
Table 6-1 Ranking of strategies and sub-strategies for addressing oil price rises
An appropriate policy mix
must be achieved to
protect countries in an
increasingly uncertain
energy environment
Identification of strategies &sub-strategies
Score each sub-strategy basedon overall effectiveness of, andcost and time required for,implementation
Ranking of sub-strategiesbased on overall scores
Score each strategy in relation to itssignificance for each of the scenariosfrom most to least important
Score each strategy in relation to itsrelevance for each of the countriesfrom most to least relevant
Using the combined scores,prioritize sub-strategies intothree groups-high,medium and lowpriority
STEP 1: Identification and ranking of strategies
STEP 2: Prioritization of strategies for different oil price rise scenarios
STEP 3: Relevance of sub-strategies for the selected case study countries
Strategy Sub-strategy Rank
Oil price risk management Pricing of petroleum products 1Managing/targeting oil subsidies 1Financial tools 2
Enhancing oil security Strengthening oil exploration 4Refining capacity to process sour crudes 4Diversifying sources of oil 6Barter 7
Restraining oil demand Oil efficiency in transport 2Better land-use planning to reduce transport demand 5Improve public transport 4Improve oil efficiency in industry 4Improve oil efficiency in agriculture 6
Fuel diversification Biofuels in transport 4Oil substitution in agriculture 4Oil substitution in transport 5Oil substitution in industry 7
Emergency preparedness Rationing 1Strategic reserves 3
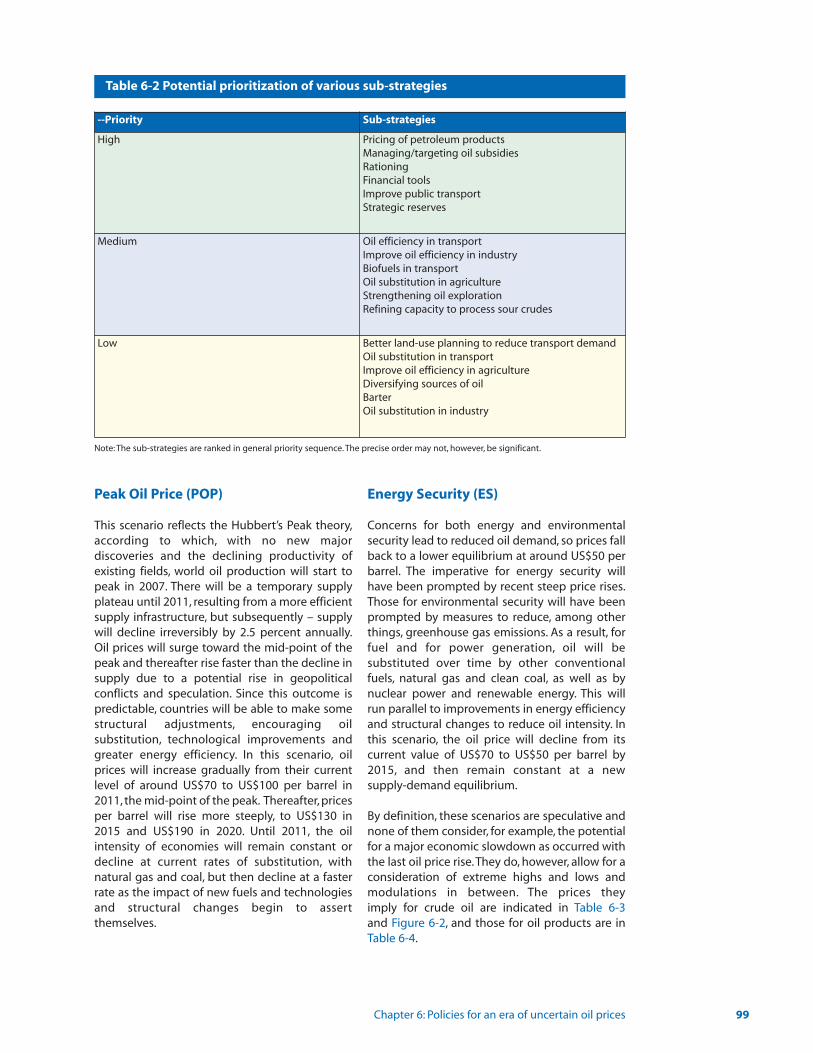
Peak Oil Price (POP)
This scenario reflects the Hubbert’s Peak theory,according to which, with no new major discoveries and the declining productivity ofexisting fields, world oil production will start topeak in 2007. There will be a temporary supplyplateau until 2011, resulting from a more efficientsupply infrastructure, but subsequently – supplywill decline irreversibly by 2.5 percent annually.Oil prices will surge toward the mid-point of thepeak and thereafter rise faster than the decline insupply due to a potential rise in geopolitical conflicts and speculation. Since this outcome ispredictable, countries will be able to make somestructural adjustments, encouraging oil substitution, technological improvements andgreater energy efficiency. In this scenario, oilprices will increase gradually from their currentlevel of around US$70 to US$100 per barrel in2011, the mid-point of the peak. Thereafter, pricesper barrel will rise more steeply, to US$130 in2015 and US$190 in 2020. Until 2011, the oilintensity of economies will remain constant ordecline at current rates of substitution, with natural gas and coal, but then decline at a fasterrate as the impact of new fuels and technologiesand structural changes begin to assert themselves.
Energy Security (ES)
Concerns for both energy and environmentalsecurity lead to reduced oil demand, so prices fallback to a lower equilibrium at around US$50 perbarrel. The imperative for energy security willhave been prompted by recent steep price rises.Those for environmental security will have beenprompted by measures to reduce, among otherthings, greenhouse gas emissions. As a result, forfuel and for power generation, oil will be substituted over time by other conventionalfuels, natural gas and clean coal, as well as bynuclear power and renewable energy. This willrun parallel to improvements in energy efficiencyand structural changes to reduce oil intensity. Inthis scenario, the oil price will decline from its current value of US$70 to US$50 per barrel by2015, and then remain constant at a new supply-demand equilibrium.
By definition, these scenarios are speculative andnone of them consider, for example, the potentialfor a major economic slowdown as occurred withthe last oil price rise.They do, however, allow for aconsideration of extreme highs and lows andmodulations in between. The prices they imply for crude oil are indicated in Table 6-3and Figure 6-2, and those for oil products are in Table 6-4.
Chapter 6: Policies for an era of uncertain oil prices 99
Table 6-2 Potential prioritization of various sub-strategies
--Priority Sub-strategies
High Pricing of petroleum productsManaging/targeting oil subsidiesRationingFinancial toolsImprove public transportStrategic reserves
Medium Oil efficiency in transportImprove oil efficiency in industryBiofuels in transportOil substitution in agricultureStrengthening oil explorationRefining capacity to process sour crudes
Low Better land-use planning to reduce transport demandOil substitution in transportImprove oil efficiency in agricultureDiversifying sources of oilBarterOil substitution in industry
Note: The sub-strategies are ranked in general priority sequence. The precise order may not, however, be significant.
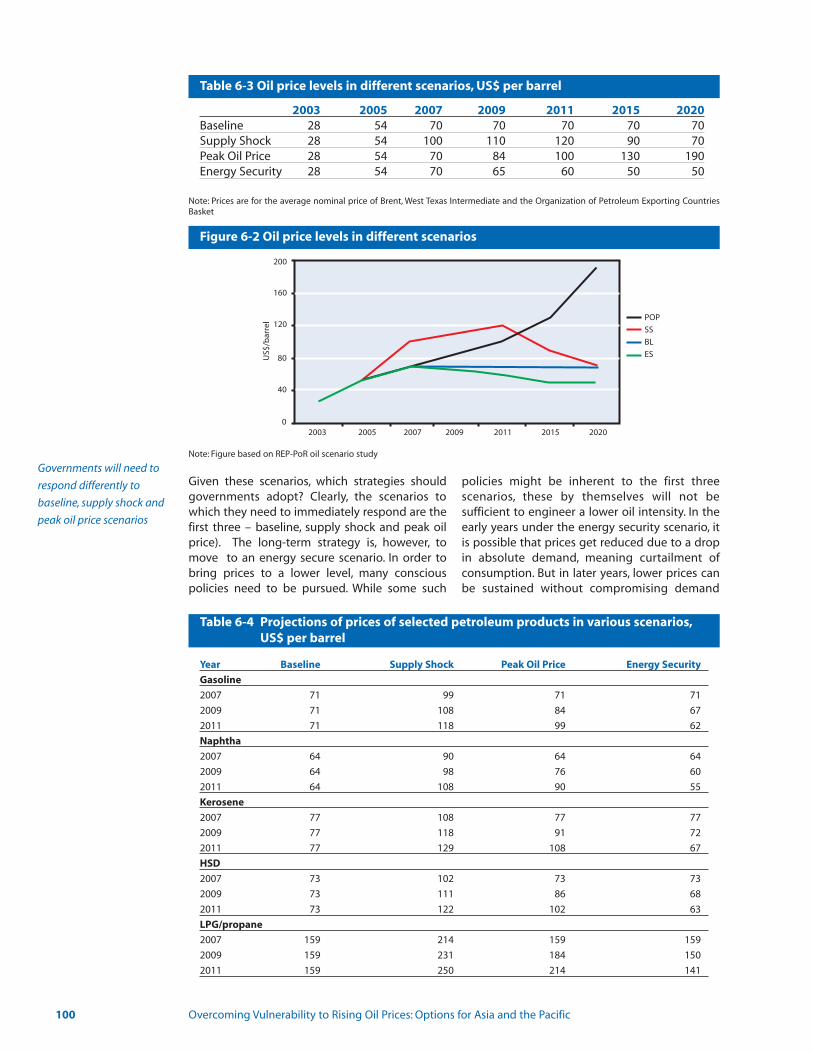
Given these scenarios, which strategies shouldgovernments adopt? Clearly, the scenarios towhich they need to immediately respond are thefirst three – baseline, supply shock and peak oilprice). The long-term strategy is, however, tomove to an energy secure scenario. In order tobring prices to a lower level, many conscious policies need to be pursued. While some such
policies might be inherent to the first three scenarios, these by themselves will not be sufficient to engineer a lower oil intensity. In theearly years under the energy security scenario, itis possible that prices get reduced due to a dropin absolute demand, meaning curtailment of consumption. But in later years, lower prices canbe sustained without compromising demand
100 Overcoming Vulnerability to Rising Oil Prices: Options for Asia and the Pacific
2003 2005 2007 2009 2011 2015 2020Baseline 28 54 70 70 70 70 70Supply Shock 28 54 100 110 120 90 70Peak Oil Price 28 54 70 84 100 130 190Energy Security 28 54 70 65 60 50 50
Table 6-3 Oil price levels in different scenarios, US$ per barrel
Figure 6-2 Oil price levels in different scenarios
Table 6-4 Projections of prices of selected petroleum products in various scenarios,US$ per barrel
Note: Prices are for the average nominal price of Brent, West Texas Intermediate and the Organization of Petroleum Exporting CountriesBasket
Note: Figure based on REP-PoR oil scenario study
200U
S$/b
arre
l
160
120
80
40
02003 2005 2007 2009 2011 2015 2020
POP
SS
BL
ES
Year Baseline Supply Shock Peak Oil Price Energy Security
Gasoline
2007 71 99 71 71
2009 71 108 84 67
2011 71 118 99 62
Naphtha
2007 64 90 64 64
2009 64 98 76 60
2011 64 108 90 55
Kerosene
2007 77 108 77 77
2009 77 118 91 72
2011 77 129 108 67
HSD
2007 73 102 73 73
2009 73 111 86 68
2011 73 122 102 63
LPG/propane
2007 159 214 159 159
2009 159 231 184 150
2011 159 250 214 141
Governments will need to
respond differently to
baseline, supply shock and
peak oil price scenarios
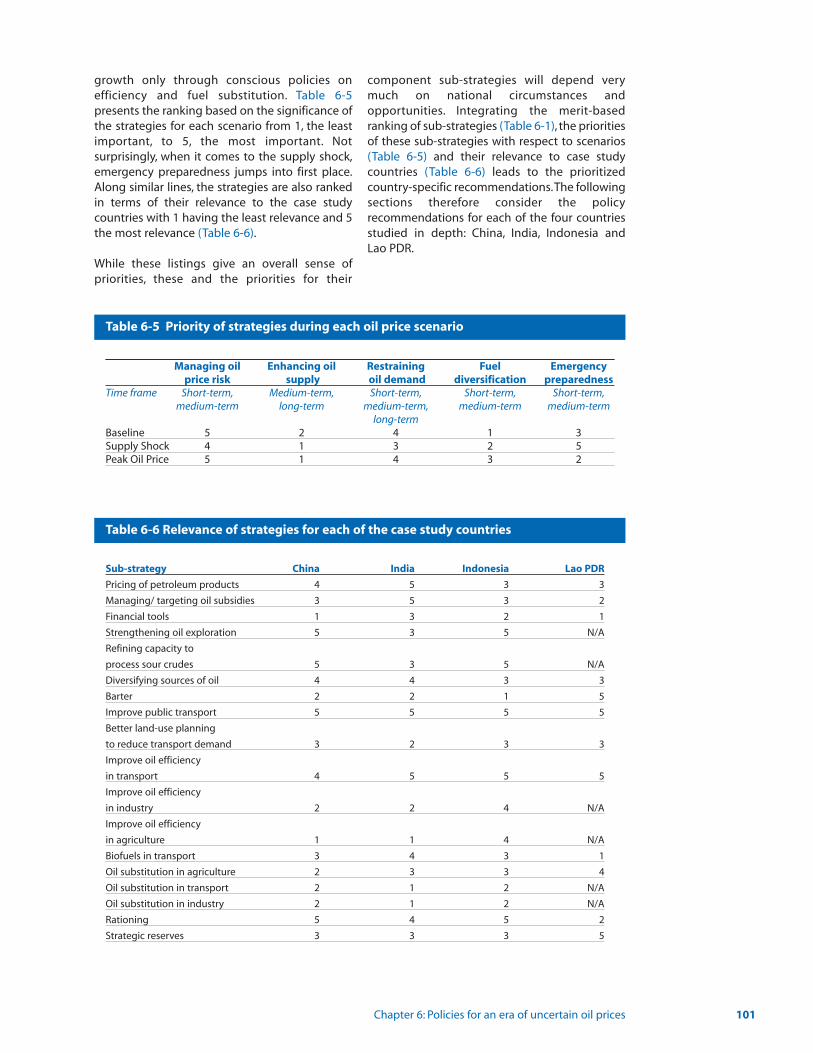
growth only through conscious policies on efficiency and fuel substitution. Table 6-5presents the ranking based on the significance ofthe strategies for each scenario from 1, the leastimportant, to 5, the most important. Not surprisingly, when it comes to the supply shock,emergency preparedness jumps into first place.Along similar lines, the strategies are also rankedin terms of their relevance to the case study countries with 1 having the least relevance and 5the most relevance (Table 6-6).
While these listings give an overall sense of priorities, these and the priorities for their
component sub-strategies will depend verymuch on national circumstances and opportunities. Integrating the merit-basedranking of sub-strategies (Table 6-1), the prioritiesof these sub-strategies with respect to scenarios(Table 6-5) and their relevance to case studycountries (Table 6-6) leads to the prioritized country-specific recommendations.The followingsections therefore consider the policy recommendations for each of the four countriesstudied in depth: China, India, Indonesia and Lao PDR.
Chapter 6: Policies for an era of uncertain oil prices 101
Table 6-5 Priority of strategies during each oil price scenario
Table 6-6 Relevance of strategies for each of the case study countries
Managing oil Enhancing oil Restraining Fuel Emergencyprice risk supply oil demand diversification preparedness
Time frame Short-term, Medium-term, Short-term, Short-term, Short-term,medium-term long-term medium-term, medium-term medium-term
long-termBaseline 5 2 4 1 3Supply Shock 4 1 3 2 5Peak Oil Price 5 1 4 3 2
Sub-strategy China India Indonesia Lao PDR
Pricing of petroleum products 4 5 3 3
Managing/ targeting oil subsidies 3 5 3 2
Financial tools 1 3 2 1
Strengthening oil exploration 5 3 5 N/A
Refining capacity to
process sour crudes 5 3 5 N/A
Diversifying sources of oil 4 4 3 3
Barter 2 2 1 5
Improve public transport 5 5 5 5
Better land-use planning
to reduce transport demand 3 2 3 3
Improve oil efficiency
in transport 4 5 5 5
Improve oil efficiency
in industry 2 2 4 N/A
Improve oil efficiency
in agriculture 1 1 4 N/A
Biofuels in transport 3 4 3 1
Oil substitution in agriculture 2 3 3 4
Oil substitution in transport 2 1 2 N/A
Oil substitution in industry 2 1 2 N/A
Rationing 5 4 5 2
Strategic reserves 3 3 3 5

China
China has been somewhat shielded from higheroil prices by its strong economic performanceand its access to alternative energy sources,notably coal. Because of its sheer economicpower, China ranks as one of the least vulnerablecountries on the OPVI. The other low-OPVI countries, Iran and Malaysia, cannot necessarilyfollow the same strategies, though they can gainsome indications.
Baseline
China already has strong petroleum pricing anddistribution measures that are backed by subsidies targeted to fishermen, farmers andstate-owned forestry enterprises and that extendto oil refining companies. It has also imposed aspecial oil income levy on companies producingcrude oil locally on prices over US$40 per barrel,and then used the revenue to subsidize vulnerable groups and other public welfare purposes. In the short run, China will benefit from strengthening these measures. Itcould then take steps to reduce demand throughoil efficiency measures, particularly in the transport sector, as well as diversify to other fuels.To shield consumers during periods of oil price
rise, in addition to targeted subsidies, it can alsoexplore measures such as smart cards and cashtransfers. Also, it can continue with plans for astrategic reserve. Over the medium-term, thefocus would have to be on enhancing oil supply.
Supply Shock
In this case, the task will be to prepare for theemergency. The priorities will be to build onstrategic reserves while establishing quotas foroil-consuming sectors. This scenario would alsorequire a system of rationing, as well as cashgrants to vulnerable groups. This could involvecompensation for LPG usage, and the introduction of smart cards and vouchers forpetroleum product consumption. This scenariowould also require a continued emphasis on pricing and distribution policies, along withmeasures to improve efficiency in the transportsector, including the introduction of biofuels,while bearing in mind the implications for landuse and the potential socioeconomic impacts.China could also expand its use of barter byexchanging its own commodities or export itemsdirectly for oil. In this direction, China has alreadyestablished the Yangpu Oil Barter Exchange,reportedly the world’s first for oil and gas.
102 Overcoming Vulnerability to Rising Oil Prices: Options for Asia and the Pacific
Baseline Supply Shock Peak Oil Price
Pricing of petroleum products
Managing/targeting oil subsidies
Oil efficiency in transport
Improve public transport
Strategic reserves
Strengthening oil exploration
Pricing of petroleum products
Managing/targeting oil subsidies
Oil efficiency in transport
Improve public transport
Strategic reserves
Better land-use planning to reduce transport demand
Strategic reserves
Pricing of petroleum products
Rationing
Managing/targeting oil subsidies
Oil efficiency in transport
Improve public transport
Refining capacity to process sour crudes
Better land-use planning to reduce transport demand
Rationing
Financial tools
Improve oil efficiency in industry
Diversifying sources of oil
Financial tools
Strengthening oil exploration
Refining capacity to process sour crudes
Rationing
Improve oil efficiency in industry
Strengthening oil exploration
Refining capacity to process sour crudes
Better land-use planning to reduce transport demand
Financial tools
Improve oil efficiency in industry
Oil substitution in transport
Improve oil efficiency in agriculture
Oil substitution in transport
Barter
Biofuels in transport
Oil substitution in agriculture
Oil substitution in industry
Biofuels in transport
Oil substitution in agriculture
Diversifying sources of oil
Improve oil efficiency in agriculture
Oil substitution in industry
Barter
Diversifying sources of oil
Biofuels in transport
Oil substitution in agriculture
Improve oil efficiency in agriculture
Oil substitution in industry
Barter
Table 6-7 China – sequence of priority strategies in different oil price scenarios
High Medium Low
In the short run, China can
further strengthen its
petroleum pricing and
distribution measures
and subsidies

Peak Oil Price
This scenario allows time for structural adjustments, fuel substitution, technologicalimprovement and greater energy efficiency.China has already been moving along this path,and is exploring technology options to enablefuel switching, such as coal for oil in fertilizermanufacturing. In the transport sector, the government is already considering ways to promote fuel efficiency and the use of alternativefuels, as with hydrogen for mass transit. Anotherexisting programme valuable in this scenariowould be ethanol blending with appropriate taxincentives. As a beginning, the government ismaking 10 percent ethanol blending mandatoryin five provinces that account for 16 percent ofthe nation’s passenger cars. China would alsobenefit from continued investments in foreign oilfields.
Along with the several initiatives underway inChina, the government could also take a numberof supporting measures. These include:
• Tariffs and rebates – Reduce import tariffs and export rebates to ensure a steady domestic supply of petroleum products and steady government earnings against sudden volatility in oil prices.
• Diversify sources of supply – Improve the climate for investment in the oil and gas sectors, while acquiring exploration and development rights in oil fields abroad.
• Fuel efficiency – Promote efficiency in the transport sector to curb increasing demand.
• Alternative energy development – Develop liquefied coal and nuclear energy programmes while removing barriers to the development of geothermal sources.
India
The recent oil price rises did not have a largemacroeconomic impact in India, mainly becauseof the country’s strong economic performance,large foreign exchange reserves and extensiveuse of coal. There were, however, micro-levelimpacts on the poor that can provide pointers tothe necessary corrective measures. Table 6-8shows those that would be appropriate to thevarious oil price scenarios. India belongs to themedium-OPVI group, so these measures couldalso provide guidelines appropriate for othercountries in that group.
Chapter 6: Policies for an era of uncertain oil prices 103
Baseline Supply Shock Peak Oil Price
Pricing of petroleum products
Managing/targeting oil subsidies
Improve public transport
Oil efficiency in transport
Financial tools
Strategic reserves
Pricing of petroleum products
Managing/targeting oil subsidies
Improve public transport
Oil efficiency in transport
Financial tools
Oil substitution in transport
Pricing of petroleum products
Managing/targeting oil subsidies
Strategic reserves
Rationing
Improve public transport
Oil efficiency in transport
Rationing
Better land-use planning to reduce transport demand
Improve oil efficiency in industry
Diversifying sources of oil
Strengthening oil exploration
Refining capacity to process sour crudes
Strategic reserves
Better land-use planning to reduce transport demand
Improve oil efficiency in industry
Biofuels in transport
Rationing
Diversifying sources of oil
Financial tools
Oil substitution in transport
Better land-use planning to reduce transport demand
Improve oil efficiency in industry
Biofuels in transport
Diversifying sources of oil
Oil substitution in transport
Improve oil efficiency in agriculture
Biofuels in transport
Oil substitution in agriculture
Oil substitution in industry
Barter
Improve oil efficiency in agriculture
Strengthening oil exploration
Refining capacity to process sour crudes
Oil substitution in agriculture
Oil substitution in industry
Barter
Strengthening oil exploration
Refining capacity to process sour crudes
Improve oil efficiency in agriculture
Oil substitution in agriculture
Barter
Oil substitution in industry
Table 6-8 India – sequence of priority strategies in different oil price scenarios
High Medium Low
India’s priority can be to
move to a system of
market-determined pricing
of petroleum product
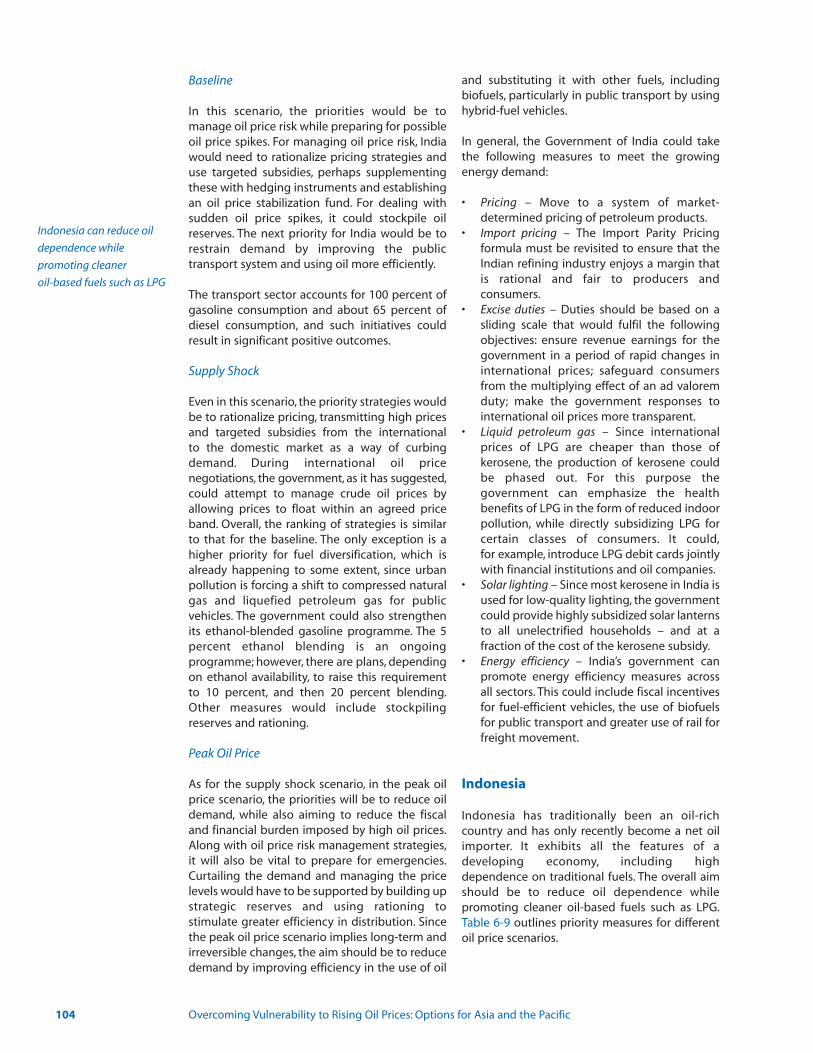
Baseline
In this scenario, the priorities would be to manage oil price risk while preparing for possibleoil price spikes. For managing oil price risk, Indiawould need to rationalize pricing strategies anduse targeted subsidies, perhaps supplementingthese with hedging instruments and establishingan oil price stabilization fund. For dealing withsudden oil price spikes, it could stockpile oilreserves. The next priority for India would be torestrain demand by improving the public transport system and using oil more efficiently.
The transport sector accounts for 100 percent ofgasoline consumption and about 65 percent ofdiesel consumption, and such initiatives couldresult in significant positive outcomes.
Supply Shock
Even in this scenario, the priority strategies wouldbe to rationalize pricing, transmitting high pricesand targeted subsidies from the international to the domestic market as a way of curbingdemand. During international oil price negotiations, the government, as it has suggested,could attempt to manage crude oil prices byallowing prices to float within an agreed priceband. Overall, the ranking of strategies is similarto that for the baseline. The only exception is ahigher priority for fuel diversification, which isalready happening to some extent, since urbanpollution is forcing a shift to compressed naturalgas and liquefied petroleum gas for public vehicles. The government could also strengthenits ethanol-blended gasoline programme. The 5 percent ethanol blending is an ongoing programme; however, there are plans, dependingon ethanol availability, to raise this requirementto 10 percent, and then 20 percent blending.Other measures would include stockpilingreserves and rationing.
Peak Oil Price
As for the supply shock scenario, in the peak oilprice scenario, the priorities will be to reduce oildemand, while also aiming to reduce the fiscaland financial burden imposed by high oil prices.Along with oil price risk management strategies,it will also be vital to prepare for emergencies.Curtailing the demand and managing the pricelevels would have to be supported by building upstrategic reserves and using rationing to stimulate greater efficiency in distribution. Sincethe peak oil price scenario implies long-term and irreversible changes, the aim should be to reducedemand by improving efficiency in the use of oil
and substituting it with other fuels, including biofuels, particularly in public transport by usinghybrid-fuel vehicles.
In general, the Government of India could takethe following measures to meet the growingenergy demand:
• Pricing – Move to a system of market-determined pricing of petroleum products.
• Import pricing – The Import Parity Pricing formula must be revisited to ensure that the Indian refining industry enjoys a margin that is rational and fair to producers and consumers.
• Excise duties – Duties should be based on a sliding scale that would fulfil the following objectives: ensure revenue earnings for the government in a period of rapid changes in international prices; safeguard consumers from the multiplying effect of an ad valorem duty; make the government responses to international oil prices more transparent.
• Liquid petroleum gas – Since international prices of LPG are cheaper than those of kerosene, the production of kerosene could be phased out. For this purpose the government can emphasize the health benefits of LPG in the form of reduced indoor pollution, while directly subsidizing LPG for certain classes of consumers. It could,for example, introduce LPG debit cards jointly with financial institutions and oil companies.
• Solar lighting – Since most kerosene in India is used for low-quality lighting, the government could provide highly subsidized solar lanterns to all unelectrified households – and at a fraction of the cost of the kerosene subsidy.
• Energy efficiency – India’s government can promote energy efficiency measures across all sectors. This could include fiscal incentives for fuel-efficient vehicles, the use of biofuels for public transport and greater use of rail for freight movement.
Indonesia
Indonesia has traditionally been an oil-rich country and has only recently become a net oilimporter. It exhibits all the features of a developing economy, including high dependence on traditional fuels. The overall aimshould be to reduce oil dependence while promoting cleaner oil-based fuels such as LPG.Table 6-9 outlines priority measures for differentoil price scenarios.
104 Overcoming Vulnerability to Rising Oil Prices: Options for Asia and the Pacific
Indonesia can reduce oil
dependence while
promoting cleaner
oil-based fuels such as LPG

Baseline
In this scenario, the focus should be on reducingoil demand for transport. This should include disincentives for the use of personal transport, forexample, through progressive taxation for family cars, with higher rates for second and thirdvehicles. The government should continue withits efforts to encourage carpooling and car sharing and improve the quality and quantity ofpublic transport. Fiscal measures could includeremoving gasoline and diesel subsidies, exceptfor public transport, while imposing taxes onfuels for personal transport and using that revenue to invest in public transport. At the sametime, Indonesia could make better use of its oilreserves by improving the climate for investmentin the oil and gas sectors and offering incentivesfor the development and implementation ofimproved oil recovery technologies and forextraction from marginal fields.
Supply Shock
This would require emergency preparedness,building strategic reserves and reducing oildemand through rationing and for other regulations. This will have to be accompanied bythe selective use of financial instruments to tidethe country over during short-term oil pricevolatility. Given that the urban poor have few
alternatives to oil products such as kerosene andLPG, the government would also need to intro-duce a system of rationing to secure supplies,particularly for cooking.
At the same time, Indonesia could also make better use of coal, improving the infrastructureand investing in research and development inclean coal technology. Small industries and partsof the service sector could replace diesel andkerosene with coal briquettes.
Peak Oil Price
This scenario should prompt faster exploration ofalternatives to oil. Public transport, for example,could make greater use of electricity and, in particular, natural gas, which would entail constructing pipelines to transmit gas from thefields to the cities. This would also improve accessto natural gas for households. These measureswould have to go hand-in-hand with those for oilconservation, as outlined for the baseline scenario. Faced with dwindling oil resources, thecountry could also invest more in the developmentof biofuels. Existing diesel-based decentralized electricity generation in remote locations in particular would benefit from a switch to biofuels. The peak oil price would also allow timefor the development of the country’s geothermalpotential. Although a geothermal law has been
Chapter 6: Policies for an era of uncertain oil prices 105
Baseline Supply Shock Peak Oil Price
Improve public transport
Pricing of petroleum products
Managing / targeting oil subsidies
Oil efficiency in transport
Strategic reserves
Improve oil efficiency in industry
Financial tools
Improve public transport
Pricing of petroleum products
Managing / targeting oil subsidies
Oil efficiency in transport
Improve oil efficiency in industry
Financial tools
Improve oil efficiency in agriculture
Strategic reserves
Rationing
Improve public transport
Pricing of petroleum products
Managing / targeting oil subsidies
Oil efficiency in transport
Improve oil efficiency in industry
Improve oil efficiency in agriculture
Strengthening oil exploration
Refining capacity to process sour crudes
Better land-use planning to reduce transport demand
Rationing
Strategic reserves
Better land-use planning to reduce transport demand
Strengthening oil exploration
Refining capacity to process sour crudes
Biofuels in transport
Financial tools
Improve oil efficiency in agriculture
Strengthening oil exploration
Refining capacity to process sour crudes
Better land-use planning to reduce transport demand
Diversifying sources of oil
Biofuels in transport
Oil substitution in transport
Oil substitution in agriculture
Oil substitution in industry
Barter
Rationing
Oil substitution in transport
Oil substitution in agriculture
Oil substitution in industry
Diversifying sources of oil
Barter
Biofuels in transport
Oil substitution in transport
Oil substitution in agriculture
Diversifying sources of oil
Oil substitution in industry
Barter
Table 6-9 Indonesia – sequence of priority strategies in different oil price scenarios
High Medium Low

passed, there are several regulatory problems,especially taxation, that some investors considera barrier.
Irrespective of trends in oil prices, Indonesiawould benefit from addressing:• Subsidies – Design and implement targeted
subsidy schemes for LPG or piped gas,particularly for poor urban households.
• Transport – Improve oil efficiency through the design and promotion of public transportsystems based on gas or electricity.
• Coal – Invest in improvements in the utilization of coal.
• Renewables – Promote renewable sources of energy such as geothermal, solar, micro-hydro and wind.
Lao PDR
As a low-income country with a relatively lowpenetration of modern energy, Lao PDR is in aunique position to frame its energy policy tomaximize its people’s long-term welfare. In general, Lao PDR prices its petroleum products soas to closely track international oil price trends,but also uses temporary tax and duty exemptionsto cushion the populace from the impact of risingoil prices. The country may also consider adopting targeted subsidies for vulnerable sections, for the poor in remote rural areas and for mass transportation companies. The recommended priority policy options across theoil price scenarios are indicated in Table 6-10. LaoPDR is a high-OPVI country, so its strategies needto have long-term perspectives. The strategiesunder all the scenarios thus focus on restrainingoil demand.
Baseline
The challenges are likely to come from sudden oilprice spikes. This calls for emergency preparedness, for which the only available strategy is rationing. Lacking its own refiningcapacity, Lao PDR cannot consider stockpiling oilreserves to tide the country over during spike periods. The long-term aim should be to reduceoil demand by improving efficiency in public sector transport and other transport. Lao PDR willalso need to speed up its development of indigenous sources of energy, particularlyhydropower, and other renewable sources ofenergy.
Supply Shock
Since Lao PDR uses petroleum products primarilyfor transportation, in this scenario it will need to
enforce measures for fuel efficiency and conservation. This could include restrictions onuse of motorized transport while enhancing theprovision of public transport.These options couldbe supported with fiscal and regulatory measuressuch as high road taxes and parking charges forprivately owned vehicles. Incentives should alsobe provided for the use of biodiesel and electric-powered vehicles, particularly using jatropha oil, of which the country plans to produce 6 million litres annually by 2010. Also, theMinistry of Energy and Mines proposes to buildtwo sugar factories to produce 80,000 tonnes ofbioethanol annually by 2010.
For a least developed country it is difficult andexpensive to implement technological improvements. However, since Lao PDR importsautomobile parts for domestic assembly, or automobiles in their entirety, it can restrain therate of growth in oil demand by setting stringentfuel efficiency criteria on imports.
Peak Oil Price
As with the other scenarios, the list of priorities istopped by measures to restrain demand, improveefficiency and promote public transport. Thiswould need to be accompanied by appropriatepricing strategies and rationing measures tostreamline the demand for petroleum products.For fuel diversification, Lao PDR has already initiated a programme on biofuels, which couldbecome one of the prioritized strategies.
For power generation it can also use wood chipsand rice husks as localized energy sources as wellas coal. Hydropower is particularly important,since this can not only help fulfil the country’srequirements for power generation, but also,through exports to neighbouring countries,produce revenue that can be earmarked tofinance oil imports. To achieve this, however, LaoPDR would need to collaborate closely with themore advanced nations as well as multilateral aidand funding agencies, which should be able tooffer support to vulnerable communities inremote areas.
To prevent poor households from switching backto solid fuels, the government could consider providing targeted subsidies for modern fuels aswell as cash compensation schemes for the verypoor. Poor households that still have to switchback could, however, be supplied with improvedcooking stoves and smoke hoods.
Other policy options could include the issuing ofsmart cards and vouchers for petroleum productconsumption, as well as engaging in barter for oil
106 Overcoming Vulnerability to Rising Oil Prices: Options for Asia and the Pacific
Energy strategies for Lao
PDR require long-term
perspectives, emphasizing
biofuels, alternative energy
for transport, and biomass
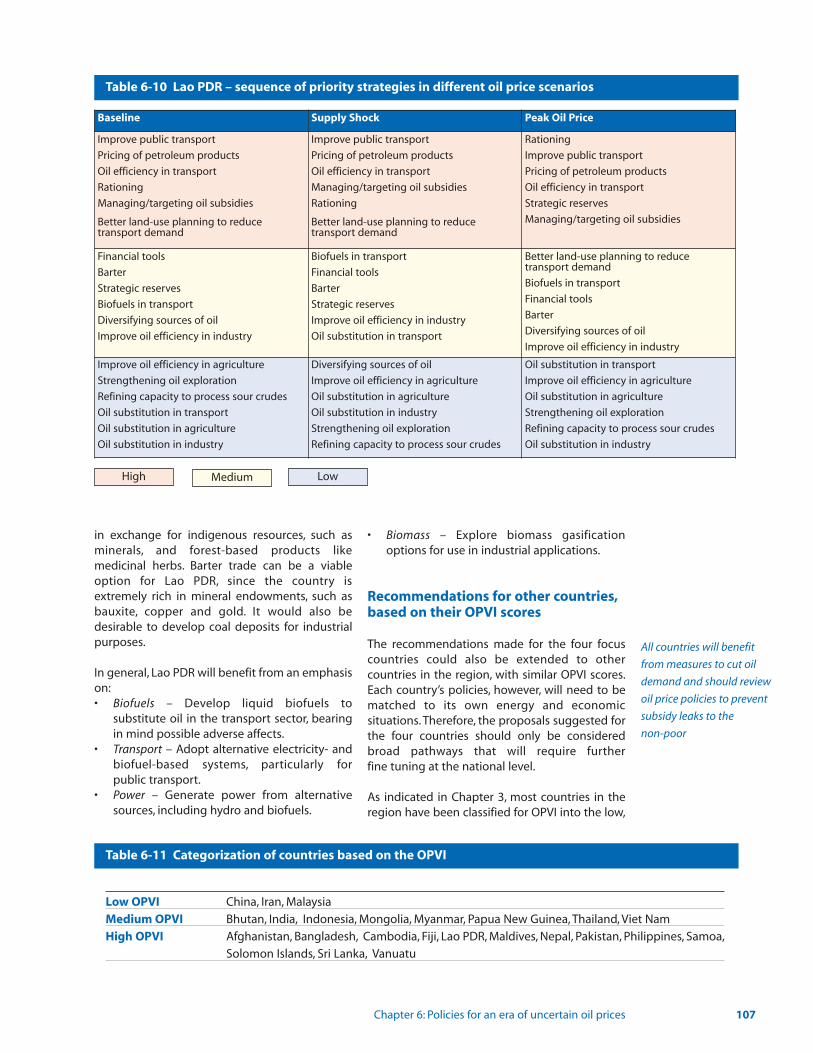
in exchange for indigenous resources, such asminerals, and forest-based products like medicinal herbs. Barter trade can be a viableoption for Lao PDR, since the country is extremely rich in mineral endowments, such asbauxite, copper and gold. It would also be desirable to develop coal deposits for industrialpurposes.
In general, Lao PDR will benefit from an emphasison:• Biofuels – Develop liquid biofuels to
substitute oil in the transport sector, bearing in mind possible adverse affects.
• Transport – Adopt alternative electricity- and biofuel-based systems, particularly for public transport.
• Power – Generate power from alternative sources, including hydro and biofuels.
• Biomass – Explore biomass gasification options for use in industrial applications.
Recommendations for other countries,based on their OPVI scores
The recommendations made for the four focuscountries could also be extended to other countries in the region, with similar OPVI scores.Each country’s policies, however, will need to bematched to its own energy and economic situations. Therefore, the proposals suggested forthe four countries should only be consideredbroad pathways that will require further fine tuning at the national level.
As indicated in Chapter 3, most countries in theregion have been classified for OPVI into the low,
Chapter 6: Policies for an era of uncertain oil prices 107
Baseline Supply Shock Peak Oil Price
Improve public transport
Pricing of petroleum products
Oil efficiency in transport
Rationing
Managing/targeting oil subsidies
Better land-use planning to reduce transport demand
Improve public transport
Pricing of petroleum products
Oil efficiency in transport
Managing/targeting oil subsidies
Rationing
Better land-use planning to reduce transport demand
Rationing
Improve public transport
Pricing of petroleum products
Oil efficiency in transport
Strategic reserves
Managing/targeting oil subsidies
Financial tools
Barter
Strategic reserves
Biofuels in transport
Diversifying sources of oil
Improve oil efficiency in industry
Biofuels in transport
Financial tools
Barter
Strategic reserves
Improve oil efficiency in industry
Oil substitution in transport
Better land-use planning to reduce transport demand
Biofuels in transport
Financial tools
Barter
Diversifying sources of oil
Improve oil efficiency in industry
Improve oil efficiency in agriculture
Strengthening oil exploration
Refining capacity to process sour crudes
Oil substitution in transport
Oil substitution in agriculture
Oil substitution in industry
Diversifying sources of oil
Improve oil efficiency in agriculture
Oil substitution in agriculture
Oil substitution in industry
Strengthening oil exploration
Refining capacity to process sour crudes
Oil substitution in transport
Improve oil efficiency in agriculture
Oil substitution in agriculture
Strengthening oil exploration
Refining capacity to process sour crudes
Oil substitution in industry
Table 6-10 Lao PDR – sequence of priority strategies in different oil price scenarios
High Medium Low
Table 6-11 Categorization of countries based on the OPVI
Low OPVI China, Iran, Malaysia
Medium OPVI Bhutan, India, Indonesia, Mongolia, Myanmar, Papua New Guinea, Thailand, Viet Nam
High OPVI Afghanistan, Bangladesh, Cambodia, Fiji, Lao PDR, Maldives, Nepal, Pakistan, Philippines, Samoa,
Solomon Islands, Sri Lanka, Vanuatu
All countries will benefit
from measures to cut oil
demand and should review
oil price policies to prevent
subsidy leaks to the
non-poor

medium or high categories (Table 6-11).Countries in the low-OPVI category could thusconsider the strategies suggested for China,those in the medium category that of India andIndonesia, and those in the high category that ofLao PDR. Much will depend, however, on thesource of vulnerability; those for which it derives from overdependence on oil rather thanfrom economic fragility will need to concentratemore on fuel diversification.
All countries would, however, benefit from measures to cut oil demand and should reviewtheir oil price policies to prevent subsidies from leaking to the non-poor. In addition, in thesupply shock and peak oil price scenarios, theywould of course need to prepare for emergencies.China is a special country, and no country, even ifit is categorized as a low-OPVI country, can simplypursue the same strategies as China. The prioritized sub-strategies for China can at bestserve as guidelines for other countries in the group, such as Iran and Malaysia. However,sub-strategies under fuel diversification and restraining demand are universally applicable.
This may not be the case with countries like Indiaand Indonesia, which are classified as mediumOPVI, nor Lao PDR, which is classified as highOPVI. In terms of the need for variety of solutions, countries like India and Indonesia are comparable to Thailand and Viet Nam. Both thesecountries can follow India and Indonesia in prioritizing their strategies.
The ranking of sub-strategies for Lao PDR couldform the basis for many other countries in thehigh-OPVI group. Countries like Bangladesh,Nepal and Cambodia can adopt the prioritizationsuggested for Lao PDR without much modification. Each is endowed with one or theother energy resources; for example, Nepal withhydro, Bangladesh with natural gas andCambodia with crude oil and natural gasresources. All these countries should, like LaoPDR, give a high priority to sub-strategies likeimproving public transport, increasing energyefficiency and pricing petroleum products moreeffectively. All these countries should have effective mechanisms for implementing targeted subsidies and rationing in order to shield thepoor from the impact of steep price rises.
Safeguarding the interests of the poor
As highlighted in earlier chapters, rising oil priceshave had a serious impact on the poor, causingsome rural households to revert either completelyor partially to biomass fuels, and in the case ofChina, from LPG to coal.The urban poor, however,do not generally have the option to switch to biomass so are likely to face increasing energypoverty. In addition, higher transport costs mayreduce access to essential services such as healthand education, and in some cases farmers willface higher prices for fertilizers. Some of the overall strategies to safeguard the poor are summarized by sector in Table 6-12. The ways inwhich these and other strategies fit together for
108 Overcoming Vulnerability to Rising Oil Prices: Options for Asia and the Pacific
Table 6-12 Sectoral strategies to safeguard the poor from higher oil prices
Sectors Strategies
Transport • Subsidize and enhance the services of public transport forms.• Better facility planning in urban areas to reduce transport demand.
Agriculture • Subsidize electricity for irrigation purposes to low-income consumers so that dependence on oil for running pump-sets reduces.
• Strategically develop the infrastructure for markets/cooperatives so that farmers do not have to travel long distances to sell their agricultural produce.
• Promote transport pooling among farmers to reduce their transportation costs to nearby nodal centres.
Households • Target LPG subsidies at low-income consumers.• Reduce/remove subsidies on kerosene, subject to availability of alternative fuels.• Provide cash transfers for specific purposes, like primary education (e.g., Indonesia) to cushion the impact of rising
oil prices.• Promote the use of renewable energy-based lanterns and cooking devices, improved biomass cookstoves
and community-based biomass gasifiers for electricity generation.
Social sector(health,education,infrastructure)
• Improve provisions for health care, education and service facilities in both rural and peri-urban areas to reduce travel costs.
• Better roads to reduce travel costs through lower energy consumption.• Make adequate provisions for basic infrastructure services like water and sanitation, electricity etc., to improve the
standard of living of the poor and make them less vulnerable to the impacts of increasing oil prices.
Strategies to safeguard
the poor from high oil
prices must encompass
transport, agriculture,
health, education
and infrastructure
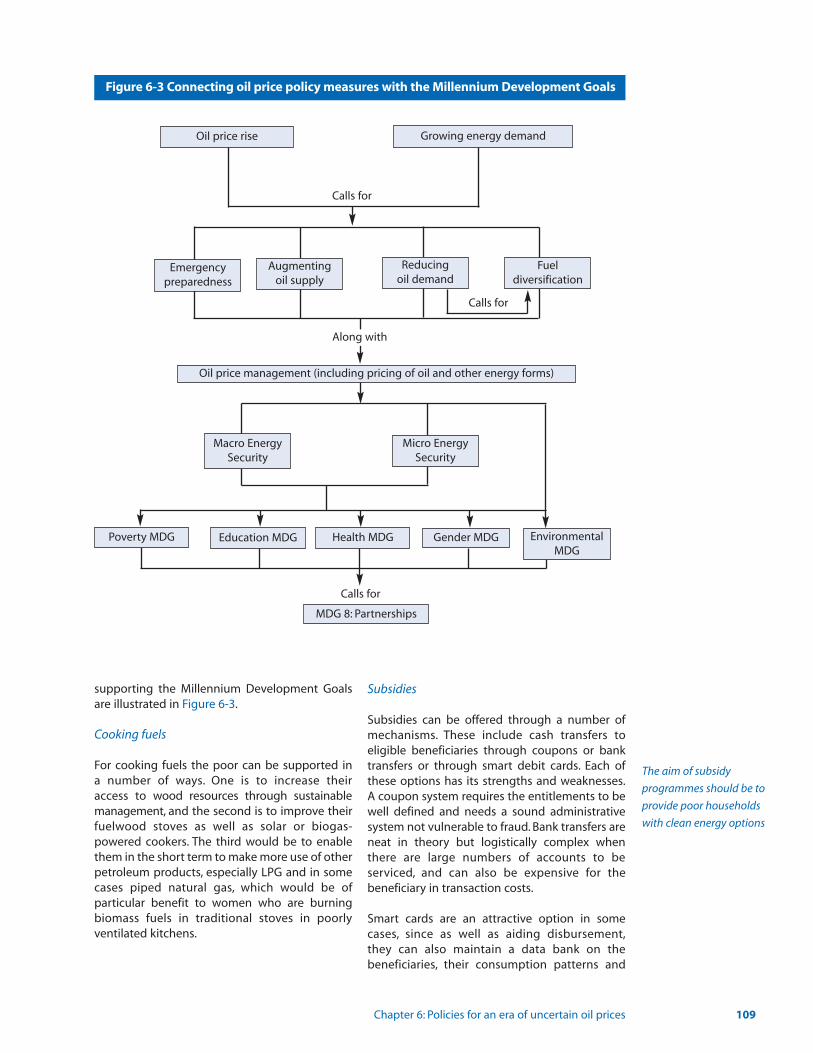
supporting the Millennium Development Goalsare illustrated in Figure 6-3.
Cooking fuels
For cooking fuels the poor can be supported in a number of ways. One is to increase their access to wood resources through sustainable management, and the second is to improve theirfuelwood stoves as well as solar or biogas-powered cookers. The third would be to enablethem in the short term to make more use of otherpetroleum products, especially LPG and in somecases piped natural gas, which would be of particular benefit to women who are burningbiomass fuels in traditional stoves in poorly ventilated kitchens.
Subsidies
Subsidies can be offered through a number ofmechanisms. These include cash transfers to eligible beneficiaries through coupons or banktransfers or through smart debit cards. Each ofthese options has its strengths and weaknesses.A coupon system requires the entitlements to bewell defined and needs a sound administrativesystem not vulnerable to fraud. Bank transfers areneat in theory but logistically complex whenthere are large numbers of accounts to be serviced, and can also be expensive for the beneficiary in transaction costs.
Smart cards are an attractive option in somecases, since as well as aiding disbursement,they can also maintain a data bank on the beneficiaries, their consumption patterns and
Chapter 6: Policies for an era of uncertain oil prices 109
Figure 6-3 Connecting oil price policy measures with the Millennium Development Goals
The aim of subsidy
programmes should be to
provide poor households
with clean energy options
Oil price rise
Education MDG Health MDG Gender MDG
MDG 8: Partnerships
Oil price management (including pricing of oil and other energy forms)
Calls for
Calls for
Calls for
Growing energy demand
EnvironmentalMDG
Macro EnergySecurity
Micro EnergySecurity
Reducing oil demand
Augmenting oil supply
Emergency preparedness
Fuel diversification
Along with
Poverty MDG

transaction histories. But they are only practicalfor countries that have the technologicalcapacity. Those such as India that already havesome e-governance structures and institutionsmay be in a position to consider smart cards, butother countries may have to rely on cash transfers.
The aim of subsidy programmes should be toprovide poor households with clean energyoptions. This means that they should be used, forexample, to promote LPG rather than kerosene asan alternative to traditional fuels. However, allsubsidy programmes have to guard against thedanger that black marketers will corner supplies – which will require legislative reformsand the strengthening of institutional capacitiesfor monitoring and enforcement.
Transport
Some compensation for rising transport costscould be provided through smart cards or othermechanisms to provide poor households withaccess to public transport at subsidized rates.However, other solutions lie outside the energysector and include moving services and workplaces closer to communities or, as has happened in China, resettling communities closerto services. Journey times, and thus costs, couldalso be cut, resulting from better rural road infrastructure coupled with improved systems ofpublic transport.
Liquid biofuels
Liquid biofuels, bioethanol and biodiesel, are particularly relevant for emerging Asia, which by2050 is expected to witness a fivefold increase inthe use of fuels for transport. Biofuels can bringclear benefits in terms of improved energy security as well as opportunities for boostingrural agricultural production and employment.Strategically used, they can also contribute to amodest reduction in the growth in greenhousegas emissions from road transport.
Biofuels can be very useful for remote mountainous and island communities, providingthem with greater energy security and lower fuelcosts for boats, mini-trucks and agriculturalequipment, while also serving as routes for disposal of waste products. But there are caveats.They may initially be more expensive to the enduser than petroleum-based fuels, though areexpected to become cheaper over time.Moreover, diverting land to the production ofcrops for biofuels may also cut food production
and drive up food costs. There are also environmental implications from the conversionof tropical forests to palm-oil monocrops.
Some of the fuel-food tradeoffs can be averted,by combining food and energy production, forexample, or growing energy crops only on moremarginal lands, and by intensifying research toimprove crop productivity. But overall, it is clearthat while liquid biofuels hold significant promise, they should be developed with caution.
Income generation
Some interventions, such as the introduction ofdecentralized renewable energy systems, canalso help the poor by providing them with newsources of energy for productive activities,particularly in communities in rural areas thathave high population densities. UNDP’s RuralEnergy Development Programme in Nepal offersa good example of how a focused initiative centred around the use of small-scale renewableenergy technologies can contribute to povertyreduction while, at the same time, help to reduce the impacts of the oil price rises.Biomass-based systems, in particular, offer hugepotential to diversify agricultural and forestryactivities, improve food security and reducepoverty. Many Asian countries, such as India andViet Nam, are converting bagasse into processheat and electricity and in some cases supplyingelectricity to the grid. Solid biofuels and biogasalso have tremendous potential for income generation.
Recommendations for internationalaction
In pursuing the recommendations, countries inthe region should also be able to rely on supportfrom bilateral and multilateral developmentagencies, whose efforts could be focused on thefollowing areas:
Alliances – Helping countries develop strategicalliances to identify new sources of oil as well asto develop alternatives to oil.
Institutional frameworks – Helping countriesdevelop institutional frameworks at the local,national and regional levels to promote integratedapproaches to the energy sector.
Pro-poor policies – Helping countries integratepro-poor policies in the energy sector with
110 Overcoming Vulnerability to Rising Oil Prices: Options for Asia and the Pacific
International actions
should focus on supporting
alliances, pro-poor policies,
research and producer-
consumer dialogues

policies in other sectors – such as road, transportand communication infrastructure, health andeducation services, water supply, agriculture andforestry, and small- and micro-enterprise development.
Indicators – Frame and encourage the use ofdevelopment indicators relevant to energy security at both national and household levels soas to measure the impacts of oil prices on incomeand on human poverty.
Mechanisms – Help governments to establishsome of the necessary mechanisms, such as oil price stabilization funds, innovative compensation and subsidy schemes, and microcredit facilities to assist the poor in acquir-ing more energy-efficient technologies andappliances.
Research – Facilitate research into comparativeassessments of alternatives to oil, especially biofuels, clean-coal technologies, renewable energy technologies and nuclear power, as wellas on techniques to enhance the recovery of oiland find new sources of oil.
Finance – Develop financing options under existing schemes, such as the CDM, to provide afillip to the development of bioenergy and othermechanisms, such as a compensatory financefacility, outlined in the next section, to assist leastdeveloped and low-income countries.
Producer-consumer dialogues – Enable producer-consumer dialogues towards moderating oil
prices. The Indian government has, for example,suggested the concept of a price band negotiated between cartels of oil exporters andimporters. The idea would be to allow the freeplay of market forces within a negotiated priceband outside of which either exporters orimporters, or both, would suffer beyond theirdesired levels of tolerance.
Proposal for a regional compensatoryoil finance facility
A key finding of this report is that high oil priceswill affect the least developed countries and lowincome countries (LDCs and LICs) of the regionthe most.These countries have modest economicgrowth, high indebtedness, low foreign reservesand balance of payments at the margin. If oilprices remain high or rise further, these countrieswill struggle to finance their growing oil importbills. Prolonged liquidity problems will forcemany countries to resort to external borrowings,the rise in debt and debt service costs squeezingtheir capacity to invest in critical economic, socialand infrastructural development. All this, in turn,can only worsen the plight of their poor and critically undermine their prospects for achievingthe MDGs.
The high financial vulnerability of Asia-PacificLDCs is evidenced by a more than six-fold worsening of their average current accountdeficits from -2 percent in 2003, the beginning of the oil price rise, to -13 percent in 2007 (Figure 6-4). In comparison, the current account
Chapter 6: Policies for an era of uncertain oil prices 111
Figure 6-4 Average current account balances of Asia-Pacific developing countries,2003-2007
-13.10
-2.06
0.76
2.1
-14.00
-12.00
-10.00
-8.00
-6.00
-4.00
-2.00
0.00
2.00
4.00
2003 2007
Cu
rren
t ac
cou
nt
bal
ance
as
% o
f GD
P
Asia-Pacific LDCs Other Asia-Pacific developing countries
Source: IMF 2007
surpluses of other developing countries in theregion declined at only half the rate. Between2003 and 2006, current account deficits worsened in eight of the twelve LDCs, with thePacific Island Countries (Kiribati and SolomonIslands in particular), Maldives and Lao PDR theworst affected.
The prospect of persistent oil price highs, and thecontinued financial woes of poorer countries, isheightened by global economic imbalancescaused by a massive US current account deficitrunning in excess of US$800 billion annually, andthe corresponding surpluses and build-up of foreign reserves among oil exporters and emerging Asian economies. Oil plays a crucial rolein these imbalances due to the US dollar’s twinstatus as a denominator of oil prices (thepetrodollar) and as the global reserve currency inwhich most economic transactions among countries take place. An abrupt fall in oil pricescan have the effect of undermining globaldemand for the dollar and lead to its precipitousfall, provoking an upheaval in the global financialsystem, the so-called ‘disorderly adjustment.’There are thus factors at play in favour of high oilprices to help prevent such a development.
Poorer countries of the region are besieged bythese mega-trends outside of their control.Assisting them to cope with a high oil price futureis a collective imperative for the internationalcommunity since these countries are forced tobear the consequences of the actions of developed and fast developing countries.This invokes the notion of ‘compensation’,whereby those who benefit from high oil prices(oil exporters) or bear substantial responsibilityfor them (large importers with the ability to pay)help those who are disadvantaged by the phenomenon. The rationale for a financing mechanism to facilitate this consists of the following factors:
• The present oil price rise has lasted for anextraordinary length of time, with little indica-tion of subsiding in the foreseeable future. Itcan well stabilize at an unsustainable level orrise even more.
• Even if oil prices come down in the short-term,there is no assurance that a new uptrend will not occur subsequently.The uncertainties and attendant financial risks for oil-importing LDCs and LICs are, therefore, high.
• Poorer countries of the region are already suffering from high oil prices. The financial impacts on them are acquiring a non-
temporary characteristic, with potentially deeper structural implications, which is a matter of serious concern.
• Without focused external assistance, these countries will find their economic and social development prospects dimming further in an era of protracted high oil prices. Their progress toward the MDGs will be retarded as long-term development investment capacity shrinks in the face of current financial shortfalls.
• The economic, social and political repercussions of maldevelopment in poorer countries can spill over national boundaries in unpredictable ways. It is essential to minimize the chances of this happening.
Several financing facilities aimed at externalshocks, such as an oil price shock, have been setup over the years by the IMF and the EuropeanUnion (EU). The IMF’s Compensatory FinancingFacility (CFF) and the EU’s grant funds (STABEX,SYSMIN and FLEX) have assisted developingcountries in dealing with trade-related shocks,but their primary focus has been on abrupt fallsin the prices of commodities exported by developing countries. The CFF, which was mostrelevant to an oil price shock, has fallen into disuse. Other international facilities belonging toIMF and the World Bank that can potentially offerrelief against the present oil price shock includethe Poverty Reduction and Growth Facility(PRGF), the Exogenous Shock Facility (ESF), theHeavily Indebted Poor Countries (HIPC) Initiativeand the Multilateral Debt Relief Initiative (MDRI).None of these facilities, however, wholly or substantially matches the financing needs ofAsia-Pacific LDCs and LICs under the present climate of protracted high oil prices. Their maindrawbacks are:
• The lack of an explicit focus on oil price shocks, which limits the volume of financing available against an oil price shock.
• Unavailability of assistance, with both immediate liquidity problems and financing for longer-term structural changes essential against the present protracted oil price shock.
• Stringent eligibility criteria, preventing many LDCs and LICs from accessing available financing.
• Insufficient duration of assistance against the present oil price shock, of which impacts could spread over five years or more.
112 Overcoming Vulnerability to Rising Oil Prices: Options for Asia and the Pacific
Even if oil prices come
down in the short-term,
there is no assurance that a
new uptrend will not occur
A regional Compensatory
Oil Finance Facility can
assist least developed and
low-income countries
• Complex conditions that undermine timeliness of financing add to delays and uncertainties in disbursement, and can generate new social and political problems.
• Preference to loans, which could worsen the indebtedness of countries already heavily in debt.
• Insufficient funds against potential needs of affected countries – for instance, against the estimated US$60 billion required by oil-importing developing countries, the ESF plans to raise only US$2.9 billion in total funds until 2009 and a maximum of US$11.5 billion (PREM 2005).
It is, therefore proposed that an Asia-PacificCompensatory Oil Finance Facility (AP-COIL) bedeveloped to assist regional LDCs and LICs byway of (a) enhancing their liquidity to overcomebalance of payments and fiscal deficits, and (b)financing essential structural changes in theirenergy economies to reduce their dependenceon oil. The underlying intent is to guide themtowards a low oil-intensive future through technological innovation and the expanded useof alternatives to oil, such that their long-termdevelopment prospects are built on a more sustainable energy base. The intent is not toadvocate that they abstain from oil, but rather tohelp them limit consumption to those activitiesfor which there are no viable alternatives at present. The guiding principles of the facility andways to operationalize them may be the following:
Assistance provided to qualifying LDCs primarily inthe form of grants and, for LICs, a blend of grantsand highly concessional loans.
• All LDCs and LICs experiencing a significant worsening of balance of payments deficit in a climate of high oil prices and agreeing to implement measures to reduce oil intensity to be considered eligible for assistance
• Grants to heavily indebted LDCs with a foreign debt of more than 80 percent of their GNI or a debt service outflow of more than1
10 percent of their annual government revenue
• Blend of grants and zero-percent-interest loans to other LDCs
• Low-interest loans (0.25 to 0.50 percent2) to LICs, with grants to finance or lower costs of investments to reduce oil intensity
• Deferred loan repayments beginning five years after disbursement, with repayment volumes and durations set initially subject to annual reviews and adjustment
Adequate assistance to ensure financial liquidity ofaffected governments over the estimated durationof a shock’s impacts, with provisions to assess thepersistence of impacts without a prior ceiling onduration.
• Volume of assistance not less than the amountof increase in a country’s balance of payments deficit from base year of a shock
• Assistance to include cost of servicing additional debt incurred to meet such deficits
• Assistance provided for structural changes to reduce oil intensity determined by a time-bound oil intensity reduction target
An automatic mechanism established to measureand determine the occurrence of a shock to minimize subjectivity, establishing eligibility toreceive assistance.
• Occurrence of an oil price shock linked to price bands or percentage increases over a previous period of 12 months
• Countries experiencing a worsening of current account deficit by 15 percent a year for two successive years are automatically eligible
• Eligibility for continued financial assistance for more than three years depending on a country’s progress with oil intensity-reducing measures
Oil intensity targets determined mutually betweenthe facility and concerned governments based onclear criteria.
• Current per capita oil consumption
• Ratio of national oil consumption to GDP in base year (base year oil intensity)
• Country-specific trajectories of future per capita oil consumption and oil intensity of GDP, allowing for initial increases in oil consumption among poor and low-income populations with very low levels of such consumption
• Annual targets of per capita oil consumption and oil intensity of GDP, in conjunction with parallel targets for per capita energy
Chapter 6: Policies for an era of uncertain oil prices 113
Funds for AP-COIL could be
mobilized through bonds
issued in regional and
international capital
markets
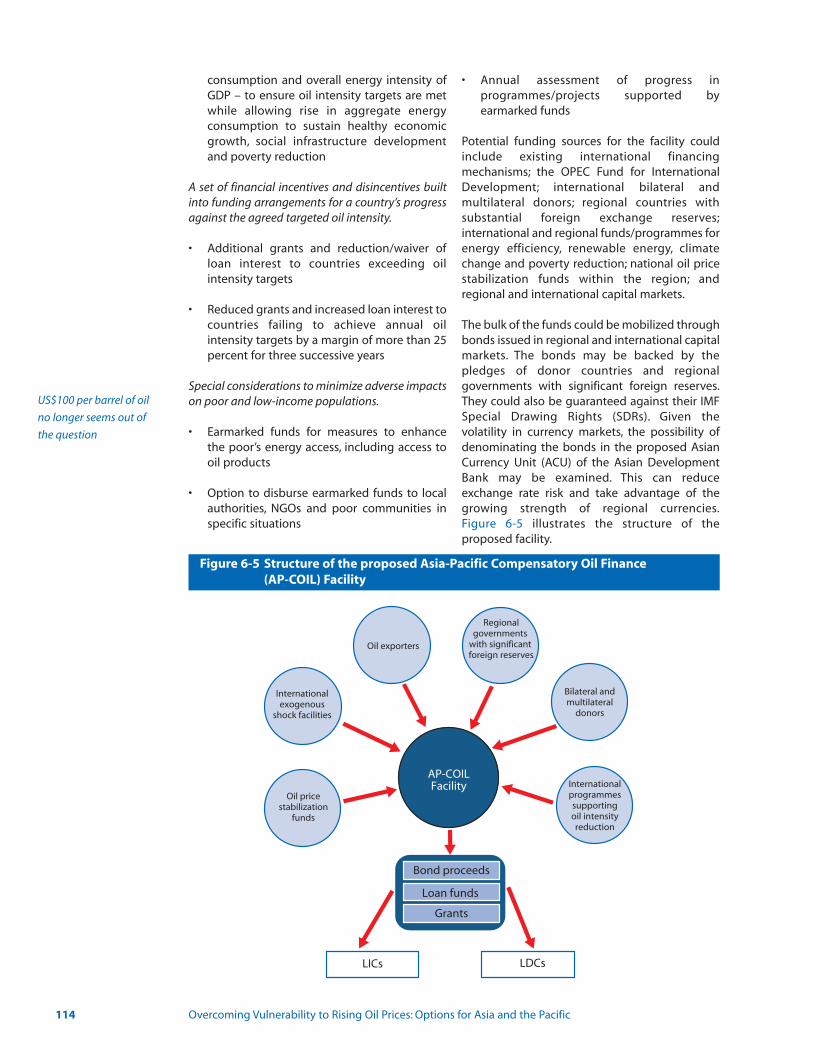
consumption and overall energy intensity of GDP – to ensure oil intensity targets are met while allowing rise in aggregate energy consumption to sustain healthy economic growth, social infrastructure development and poverty reduction
A set of financial incentives and disincentives builtinto funding arrangements for a country’s progressagainst the agreed targeted oil intensity.
• Additional grants and reduction/waiver of loan interest to countries exceeding oil intensity targets
• Reduced grants and increased loan interest to countries failing to achieve annual oil intensity targets by a margin of more than 25 percent for three successive years
Special considerations to minimize adverse impactson poor and low-income populations.
• Earmarked funds for measures to enhance the poor’s energy access, including access to oil products
• Option to disburse earmarked funds to local authorities, NGOs and poor communities in specific situations
• Annual assessment of progress in programmes/projects supported by earmarked funds
Potential funding sources for the facility couldinclude existing international financing mechanisms; the OPEC Fund for InternationalDevelopment; international bilateral and multilateral donors; regional countries with substantial foreign exchange reserves;international and regional funds/programmes forenergy efficiency, renewable energy, climatechange and poverty reduction; national oil pricestabilization funds within the region; and regional and international capital markets.
The bulk of the funds could be mobilized throughbonds issued in regional and international capitalmarkets. The bonds may be backed by thepledges of donor countries and regional governments with significant foreign reserves.They could also be guaranteed against their IMFSpecial Drawing Rights (SDRs). Given the volatility in currency markets, the possibility ofdenominating the bonds in the proposed AsianCurrency Unit (ACU) of the Asian DevelopmentBank may be examined. This can reduceexchange rate risk and take advantage of thegrowing strength of regional currencies.Figure 6-5 illustrates the structure of the proposed facility.
114 Overcoming Vulnerability to Rising Oil Prices: Options for Asia and the Pacific
Bond proceeds
LICs
Oil pricestabilization
funds
Internationalexogenous
shock facilities
Oil exporters
Regionalgovernments
with significant foreign reserves
Bilateral andmultilateral
donors
Internationalprogrammessupportingoil intensityreduction
LDCs
Loan funds
Grants
AP-COILFacility
US$100 per barrel of oil
no longer seems out of
the question
Figure 6-5 Structure of the proposed Asia-Pacific Compensatory Oil Finance (AP-COIL) Facility
Where do we go from here?
Along with the rest of the world, developingcountries of the Asia-Pacific region face an uncertain oil future. While no one can predictwith confidence how oil prices will move in thecoming years, most signs seem to point upward.The situation is confounded by the extremevolatility in price movements. After surging to arecord US$77 per barrel in July 2006, the price ofcrude plummeted close to US$50 per barrel inJanuary 2007, only to take off again in the nexteight months and enter uncharted territory,beyond US$80 per barrel in September 2007. Aprice of US$100 per barrel no longer seems out ofthe question. Even if prices subside, against theodds, toward their 2002 level of around US$22per barrel, they might have a very short stay there.
Developing countries of the region need to cometo terms with the possibility that oil prices mayhave entered an irreversible trend, as opposed tothe short, cyclical spikes of the past. The reasonsfor this, as set out in this report, are varied. But inthe final analysis, they converge on a single point,which is that the world's finite oil resources willone day or another be exhausted, and that daymight arrive sooner rather than later. The realquestion is: Where do we go from here?
After five long years of high oil prices, developingcountries of the region have reached a fork intheir energy development road. On the one hand,most have been able to withstand the shock ofthe oil price rise without suffering permanentdamage to their economies. GDP growth rates have not declined seriously, inflationremains manageable and other macroeconomic indicators are not yet flashing red. The mainimpact has been on their poor, but this may notbe an insurmountable problem, because theamount of oil products consumed by them is asmall part of the big picture. So long as countrieshave their own oil resources, or have other goodsand services that they can trade in return for oil,there may be no need to panic. Economies maycontinue to expand and, as a part of the process,poverty may continue to decline and eventuallybe eradicated.
On the other hand, poorer countries of the regionhave not fared so well. High oil prices have translated into worsening trade deficits, decliningliquidity and growing debt. The prices of alternatives to oil like gas, coal, electricity andeven biomass, the fuel of last resort, have beenpulled higher by rising oil prices, creating
broader pressure on their economies. In a number of countries like Bangladesh, Myanmarand Nepal, people are finding the costs of foodand essential commodities and services going upas well. What is happening to the economies ofthe poorer countries may well be a portent ofwhat can happen to those of other developingcountries, regardless of their current resilience.Not all countries in the bottom half of the OPVIrankings presented in this report are LDCs.
Which way, then, should developing countriesturn? What is the way forward?
Poverty has no borders, not when it comes to oilwhich, in a globalized market, goes to the highestbidder. For the poor to rise above poverty, theirconsumption of electricity and modern fuelsneeds to increase, including the consumption ofoil for those uses for which there are, as yet, nosubstitutes. Otherwise, the poor will remain poor,and they will be joined by those who live in astate of borderline poverty. Millions will slip backto relying on biomass fuels and human labour,back to eking out subsistence-level incomeswhile the rest of the population in their own societies moves farther ahead in social status andeconomic affluence.
This report has presented a range of scenarios forthe world’s future oil price outlook. These by nomeans exhaust the possibilities. The future couldpresent a mixture of one or more of these scenarios, or an entirely different set of circumstances. The menu of potential responsesis also necessarily incomplete, based partly onpast experience, current thinking and a degree ofspeculation about likely trends or events.
While each country will doubtless weigh solutions in the light of its own circumstances, thebroad direction should be clear: a dual track inenergy policy. Policy and institutional response torising oil prices is not only about ‘national’ energysecurity. This supply-side approach, so far rampant in developing country policy models, isusually based upon grid-based energy suppliesthrough generation of electricity (nuclear,coal-based, oil-/gas-fired plants) or pipedgas/LPG for cooking.Yet national energy security,the first track of a national energy policy, is a necessary condition for enabling the poor tomove up the household energy ladder.
But to bridge the ever-increasing gap betweenthose at the top of the ladder (urban consumerswho are middle-class and above), who are the
Chapter 6: Policies for an era of uncertain oil prices 115
main beneficiaries of policies aimed at nationalenergy security, and those at the bottom, a dual-track energy security strategy is essential.The second track would help generate theincome for the poor that will feed the demand fornon-traditional energy products (improved cooking stoves) and services (RETs such as micro-hydro, biogas, solar PV), thereby creating avirtuous cycle that can sharply reduce povertythrough the use of modern energy.
Thus, all developing countries must alleviate thesuffering of their poor in the immediate presentwhile adopting strategies to secure the future oftheir economies. This means providing the poorwith essential relief, by way of focused subsidies,compensation and direct cash transfers, againstrising fuel prices. Simultaneously, a concertedeffort is needed to shift the future trajectory ofenergy consumption, not only of the poor butalso of whole economies, away from its reliance
on oil. Reducing the oil intensity of developmentis no longer a matter of choice. It is the onlycourse.
Other events unfolding on the global arena pointin the same direction. Increasing physical evidence of climate change – the rise in naturaldisasters, changes in weather patterns, decliningbiodiversity – is also making it more and more difficult to ignore calls to reduce emissions fromfossil fuel consumption. Financial markets aroundthe world are convulsing as excesses of the pastcatch up with them, posing the spectre of a global economic slowdown that can sap the newfound economic strength of many developing countries and move oil supplies outof the reach of their poor citizens.
The time to act is now, before affordable oilbecomes a distant memory.
116 Overcoming Vulnerability to Rising Oil Prices: Options for Asia and the Pacific
Endnotes1 Cutoffs are based on World Bank’s classification of HIPCs and IMF’s target for reducing unsustainable debt among HIPCs.
2 IMF’s PRGF loans carry an interest rate of 0.5 percent.

Appendix A
Appendix A.1: Country Profiles
Table A-1: Energy poverty profile of North-East Asia
Countries Energy Poverty and inequity
Oil consumption Oil imports as a Traditional Natural gas Percentage of Gini indexg
(thousand barrels percentage of oil fuel usage, consumption populationper day)a consumptiona,d,# percentage of (billion cubic feet)a below US$1
total energy (PPP) a dayf
usagee
1995 2000 2004 1990 2002 2004 1997 2002 1995 2000 2004 1990 Latest 1990 - Latest 2000 year
China 3363.2 4795.7 6400.0 47** 5.7 5.3 581.5 902.4 1350.5 33.0 17 35.7 44.9
(2001) (1990) (2003)
Cambodia 3.4 3.5 3.8 100** 89.3 92.3 0 0 0 … 34 46 40
(1997) (1994) (1997)
Mongolia 11.5 8.5 11.0 100** 4.3 2.1 0 0 0 13.9 27 33.2 44
(1998) (1995) (1998)
Viet Nam 94.3 175.7 230.0 104.5 99.1 94.2* 37.8 25.3 25.0 41.0 106.0 14.6 <2 34.4 37.3
(2002) (1993) (1998)
Lao PDR 2.3 2.7 3.0 100** 88.7 77.3 0 0 0 7.8 26 29.9 36.5
(1997) (1992) (1997)
Countries Geophysical Economic
Gross domesticOil reserves Forest area product growth rate
(billion barrels)a (percentage)b (percentage)c
1995 2000 2006 1990 2000 2005 1995 2000 2005China 24.0 24.0 18.3 16.9 18 21.2 1.9 8.4 9.6Cambodia 0 0 0 73.3 53 59.2 6.5 8.4 6.3Mongolia 0 0 0 7.3 7 6.5 2.4* 1.1 6Viet Nam 0.5 0.6 0.6 28.8 30 39.7 9.5 6.8 8.4Lao PDR 0 0 0 75 54 69.9 7 5.7 7.2
* 1996 data**2003 data# Computations based on data from IEA and EIA; figures may be incompatible with those derived from national data sources
Sources:a: EIA 2006 b: World Bank 2005a, World Bank 2006 c: UNESCAP 2006 d: Oil Information (2006 edition), IEA e: UNDP 2005 f: http://mdgs.un.org/unsd/mdg/News.aspx?ArticleId=13 g: http://www.wider.unu.edu/, last accessed on 15 December 2006
Socioeconomic and energy profiles
Appendix A:
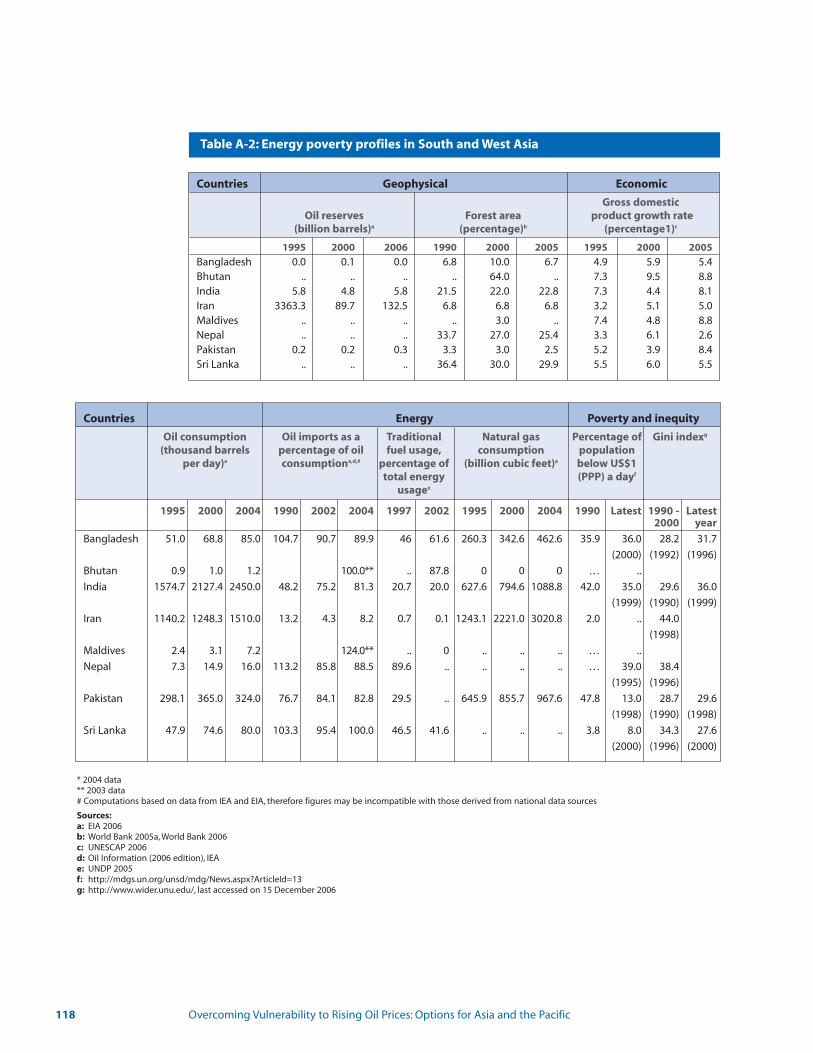
118 Overcoming Vulnerability to Rising Oil Prices: Options for Asia and the Pacific
Countries Geophysical Economic
Gross domesticOil reserves Forest area product growth rate
(billion barrels)a (percentage)b (percentage1)c
1995 2000 2006 1990 2000 2005 1995 2000 2005Bangladesh 0.0 0.1 0.0 6.8 10.0 6.7 4.9 5.9 5.4Bhutan .. .. .. .. 64.0 .. 7.3 9.5 8.8India 5.8 4.8 5.8 21.5 22.0 22.8 7.3 4.4 8.1Iran 3363.3 89.7 132.5 6.8 6.8 6.8 3.2 5.1 5.0Maldives .. .. .. .. 3.0 .. 7.4 4.8 8.8Nepal .. .. .. 33.7 27.0 25.4 3.3 6.1 2.6Pakistan 0.2 0.2 0.3 3.3 3.0 2.5 5.2 3.9 8.4Sri Lanka .. .. .. 36.4 30.0 29.9 5.5 6.0 5.5
Countries Energy Poverty and inequity
Oil consumption Oil imports as a Traditional Natural gas Percentage of Gini indexg
(thousand barrels percentage of oil fuel usage, consumption populationper day)a consumptiona,d,# percentage of (billion cubic feet)a below US$1
total energy (PPP) a dayf
usagee
1995 2000 2004 1990 2002 2004 1997 2002 1995 2000 2004 1990 Latest 1990 - Latest 2000 year
Bangladesh 51.0 68.8 85.0 104.7 90.7 89.9 46 61.6 260.3 342.6 462.6 35.9 36.0 28.2 31.7
(2000) (1992) (1996)
Bhutan 0.9 1.0 1.2 100.0** .. 87.8 0 0 0 … ..
India 1574.7 2127.4 2450.0 48.2 75.2 81.3 20.7 20.0 627.6 794.6 1088.8 42.0 35.0 29.6 36.0
(1999) (1990) (1999)
Iran 1140.2 1248.3 1510.0 13.2 4.3 8.2 0.7 0.1 1243.1 2221.0 3020.8 2.0 .. 44.0
(1998)
Maldives 2.4 3.1 7.2 124.0** .. 0 .. .. .. … ..
Nepal 7.3 14.9 16.0 113.2 85.8 88.5 89.6 .. .. .. .. … 39.0 38.4
(1995) (1996)
Pakistan 298.1 365.0 324.0 76.7 84.1 82.8 29.5 .. 645.9 855.7 967.6 47.8 13.0 28.7 29.6
(1998) (1990) (1998)
Sri Lanka 47.9 74.6 80.0 103.3 95.4 100.0 46.5 41.6 .. .. .. 3.8 8.0 34.3 27.6
(2000) (1996) (2000)
* 2004 data** 2003 data# Computations based on data from IEA and EIA, therefore figures may be incompatible with those derived from national data sources
Sources:a: EIA 2006b: World Bank 2005a, World Bank 2006c: UNESCAP 2006d: Oil Information (2006 edition), IEAe: UNDP 2005 f: http://mdgs.un.org/unsd/mdg/News.aspx?ArticleId=13g: http://www.wider.unu.edu/, last accessed on 15 December 2006
Table A-2: Energy poverty profiles in South and West Asia
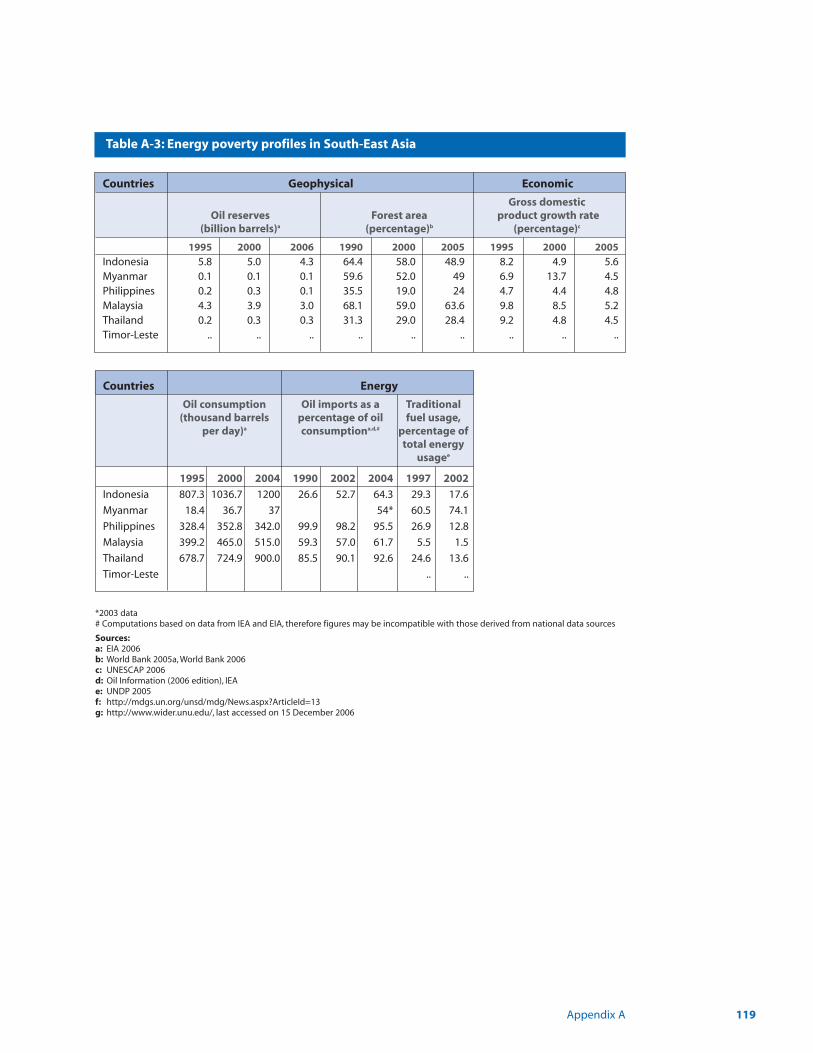
Appendix A 119
Table A-3: Energy poverty profiles in South-East Asia
Countries Geophysical Economic
Gross domesticOil reserves Forest area product growth rate
(billion barrels)a (percentage)b (percentage)c
1995 2000 2006 1990 2000 2005 1995 2000 2005Indonesia 5.8 5.0 4.3 64.4 58.0 48.9 8.2 4.9 5.6Myanmar 0.1 0.1 0.1 59.6 52.0 49 6.9 13.7 4.5Philippines 0.2 0.3 0.1 35.5 19.0 24 4.7 4.4 4.8Malaysia 4.3 3.9 3.0 68.1 59.0 63.6 9.8 8.5 5.2Thailand 0.2 0.3 0.3 31.3 29.0 28.4 9.2 4.8 4.5Timor-Leste .. .. .. .. .. .. .. .. ..
Countries Energy
Oil consumption Oil imports as a Traditional(thousand barrels percentage of oil fuel usage,
per day)a consumptiona,d,# percentage oftotal energy
usagee
1995 2000 2004 1990 2002 2004 1997 2002
Indonesia 807.3 1036.7 1200 26.6 52.7 64.3 29.3 17.6
Myanmar 18.4 36.7 37 54* 60.5 74.1
Philippines 328.4 352.8 342.0 99.9 98.2 95.5 26.9 12.8
Malaysia 399.2 465.0 515.0 59.3 57.0 61.7 5.5 1.5
Thailand 678.7 724.9 900.0 85.5 90.1 92.6 24.6 13.6
Timor-Leste .. ..
*2003 data# Computations based on data from IEA and EIA, therefore figures may be incompatible with those derived from national data sources
Sources:a: EIA 2006b: World Bank 2005a, World Bank 2006c: UNESCAP 2006d: Oil Information (2006 edition), IEAe: UNDP 2005 f: http://mdgs.un.org/unsd/mdg/News.aspx?ArticleId=13g: http://www.wider.unu.edu/, last accessed on 15 December 2006

120 Overcoming Vulnerability to Rising Oil Prices: Options for Asia and the Pacific
Table A-4: Energy poverty profiles in Pacific Island countries
Countries Geophysical Economic
Gross domesticOil reserves Forest area product growth rate
(billion barrels)a (percentage)b (percentage)c
1995 2000 2006 1990 2000 2005 1995 2000 2005Fiji .. .. .. .. 45.0 .. 2.5 -2.8 1.7Federated States of Micronesia .. .. .. .. .. ..PapuaNew Guinea 0.2 0.3 0.2 69.6 68.0 65.0 -3.4 -1.2 3.0Samoa .. .. .. .. 37.0 .. 6.6 6.1 5.6SolomonIslands .. .. .. .. 91.0 .. -14.3 2.9Tonga .. .. .. .. 6.0 .. 4.6 5.6 2.8Vanuatu .. .. .. .. 37.0 .. -0.03 2.7 2.9
Countries Energy Poverty and inequity
Oil consumption Oil imports as a Natural gas Percentage of Gini indexg
(thousand barrels percentage of oil consumption populationper day)a consumptiona,d,# (billion cubic feet)a below US$1
(PPP) a dayf
1995 2000 2004 2003 1997 2002 1995 2000 2004 Latest year Latest year
Fiji 5.7 5.4 10.0 122.0 .. .. 25.5 (1990-91) 43.4 (1977)
Federated States of Micronesia .. .. .. .. .. .. 27.9 (1998)
Papua New Guinea 15.2 14.9 28.0 100.0 62.5 61.9 4.0 4.0 5.0 37.5 (1996) 50.4 (1996)
Samoa 0.9 1.0 1.0 100.0 .. .. 20.3 (2002)
SolomonIslands 1.2 1.2 1.3 100.0 .. .. ..
Tonga 0.8 0.9 0.9 100.0 .. .. 23.1 (2000-01)
Vanuatu 0.4 0.6 0.6 100.0 .. .. ..
# Computations based on data from IEA and EIA, therefore figures may be incompatible with those derived from national data sources
Sources:a: EIA 2006;b: World Bank 2005a, World Bank 2006c: UNESCAP 2006d: Oil Information (2006 edition), IEAe: UNDP 2005 f: http://mdgs.un.org/unsd/mdg/News.aspx?ArticleId=13g: http://www.wider.unu.edu/, last accessed on 15 December 2006

Appendix A 121
Table A-5: Sectoral oil consumption, percentage of total sectoral energy consumption, 2002
Industry Transport Agriculture Residential
North-East Asia and Mekong
China* 17 92 51 5
Viet Nam 32 99 85 2
South and West Asia
Bangladesh 5 100 92 7
India* 30 98 2 11
Iran 38 100 74 31
Nepal 12 100 96 4
Pakistan* 9 96 25 2
Sri Lanka 25 100 100 4
South-East Asia
Indonesia* 31 100 100 20
Myanmar 19 100 100 1
Philippines 27 100 100 19
Malaysia 36 100 100 21
Thailand 34 100 99 20
Note: * China, India, Indonesia and Pakistan data points are for 2003
Source: IEA 2006
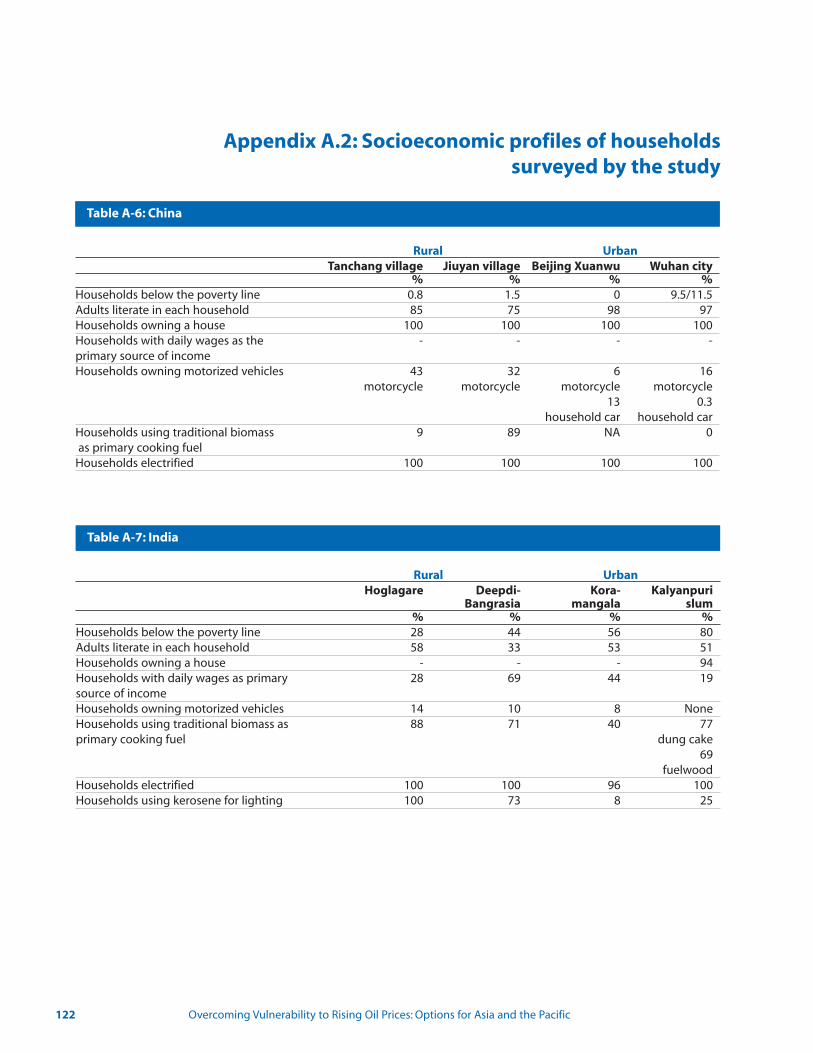
122 Overcoming Vulnerability to Rising Oil Prices: Options for Asia and the Pacific
Table A-6: China
Rural UrbanTanchang village Jiuyan village Beijing Xuanwu Wuhan city
% % % %Households below the poverty line 0.8 1.5 0 9.5/11.5Adults literate in each household 85 75 98 97Households owning a house 100 100 100 100Households with daily wages as the - - - -primary source of incomeHouseholds owning motorized vehicles 43 32 6 16
motorcycle motorcycle motorcycle motorcycle13 0.3
household car household carHouseholds using traditional biomass 9 89 NA 0as primary cooking fuel
Households electrified 100 100 100 100
Table A-6: China
Table A-6: China
Rural UrbanHoglagare Deepdi- Kora- Kalyanpuri
Bangrasia mangala slum% % % %
Households below the poverty line 28 44 56 80Adults literate in each household 58 33 53 51Households owning a house - - - 94Households with daily wages as primary 28 69 44 19source of incomeHouseholds owning motorized vehicles 14 10 8 NoneHouseholds using traditional biomass as 88 71 40 77primary cooking fuel dung cake
69 fuelwood
Households electrified 100 100 96 100Households using kerosene for lighting 100 73 8 25
Table A-7: India
Appendix A.2: Socioeconomic profiles of households surveyed by the study
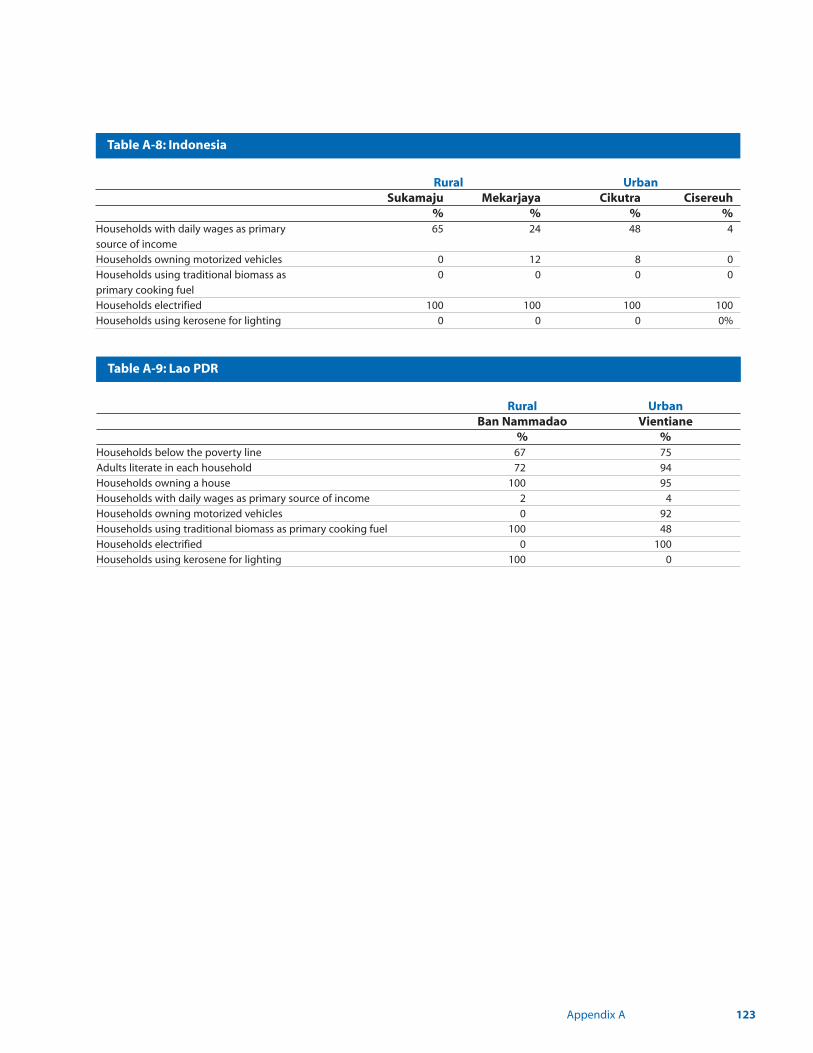
Appendix A 123
Table A-6: China
Rural UrbanSukamaju Mekarjaya Cikutra Cisereuh
% % % %Households with daily wages as primary 65 24 48 4
source of income
Households owning motorized vehicles 0 12 8 0
Households using traditional biomass as 0 0 0 0
primary cooking fuel
Households electrified 100 100 100 100
Households using kerosene for lighting 0 0 0 0%
Table A-8: Indonesia
Table A-6: China
Rural UrbanBan Nammadao Vientiane
% %Households below the poverty line 67 75
Adults literate in each household 72 94
Households owning a house 100 95
Households with daily wages as primary source of income 2 4
Households owning motorized vehicles 0 92
Households using traditional biomass as primary cooking fuel 100 48
Households electrified 0 100
Households using kerosene for lighting 100 0
Table A-9: Lao PDR
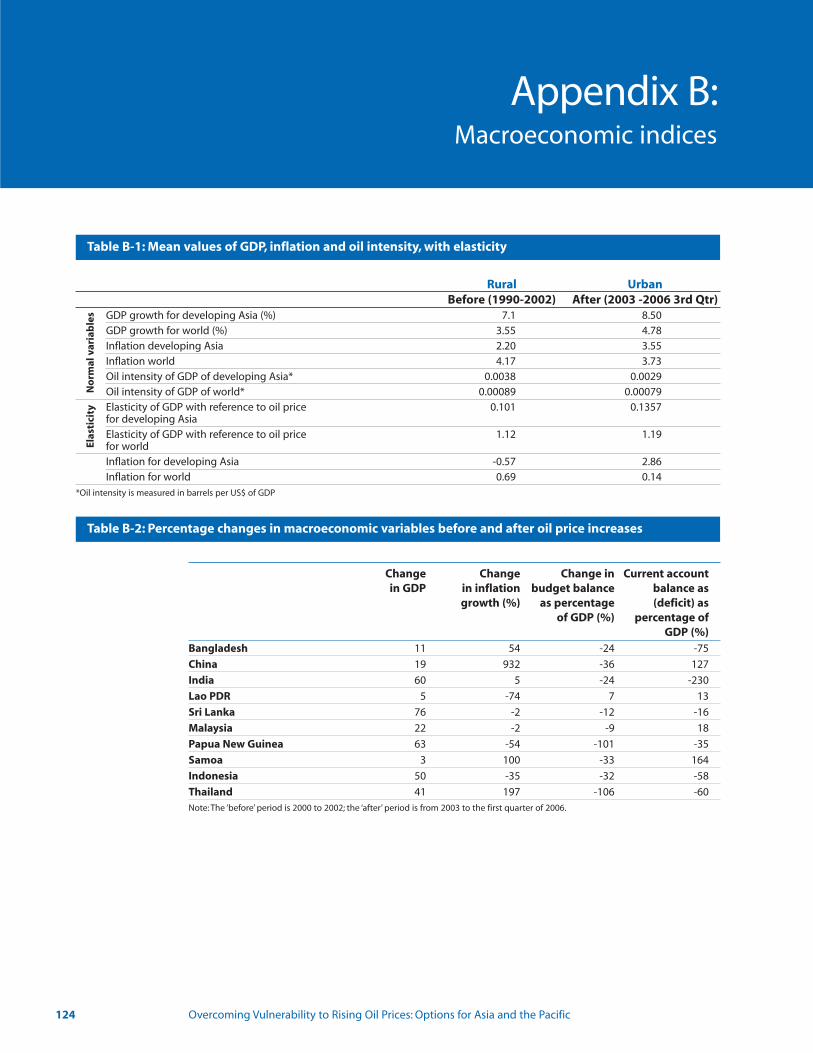
124 Overcoming Vulnerability to Rising Oil Prices: Options for Asia and the Pacific
Rural UrbanBefore (1990-2002) After (2003 -2006 3rd Qtr)
GDP growth for developing Asia (%) 7.1 8.50
GDP growth for world (%) 3.55 4.78
Inflation developing Asia 2.20 3.55
Inflation world 4.17 3.73
Oil intensity of GDP of developing Asia* 0.0038 0.0029
Oil intensity of GDP of world* 0.00089 0.00079
Elasticity of GDP with reference to oil price 0.101 0.1357for developing Asia
Elasticity of GDP with reference to oil price 1.12 1.19for world
Inflation for developing Asia -0.57 2.86
Inflation for world 0.69 0.14
*Oil intensity is measured in barrels per US$ of GDP
Table B-1: Mean values of GDP, inflation and oil intensity, with elasticity
No
rmal
var
iab
les
Elas
tici
ty
Table B-2: Percentage changes in macroeconomic variables before and after oil price increases
Change Change Change in Current accountin GDP in inflation budget balance balance as
growth (%) as percentage (deficit) asof GDP (%) percentage of
GDP (%)Bangladesh 11 54 -24 -75
China 19 932 -36 127
India 60 5 -24 -230
Lao PDR 5 -74 7 13
Sri Lanka 76 -2 -12 -16
Malaysia 22 -2 -9 18
Papua New Guinea 63 -54 -101 -35
Samoa 3 100 -33 164
Indonesia 50 -35 -32 -58
Thailand 41 197 -106 -60
Note: The ‘before’ period is 2000 to 2002; the ‘after’ period is from 2003 to the first quarter of 2006.
Macroeconomic indices
Appendix B:
Appendix C 125
C-1: AN OIL PRICE VULNERABILITY INDEX
Is it possible to quantify the extent of this vulnerability? The degree of vulnerability willdepend on many other factors such as the GDPgrowth rate, for example, and on the extent of foreign exchange reserves. And the extent towhich poor people are vulnerable will varyaccordingly, for example, to the types of energythey use. Factors and variables that influence acountry's vulnerability to oil price changes,particularly in terms of impacts on poor households, are multiple and varied. These factors could be macroeconomic variables, suchas GDP growth and foreign exchange reservesposition, to more micro-level indicators, such asdominance of traditional fuels in the energy mixand incidence of poverty. This paper discussessuch an attempt to develop a composite Oil PriceVulnerability Index (OPVI) for the 24 developingcountries of the Asia-Pacific region.
As a first level of classification, it may be possibleto say that three kinds of factors (albeit not comprehensive) that can influence oil price vulnerability are economy-related, energy-relatedand social-related. Broadly, however, most ofthese major factors can be subsumed under twocategories: economy-related and energy-related.With this preliminary understanding, a set of 15 variables have been identified to be influencingthe oil price vulnerability level of a country. Thedata required for measuring these variables havebeen obtained from various secondary sources(Table C-1). Among the 15 variables, the variableslike real GDP growth rate, GDP per capita, balance
of payments (current account), budget balance,import cover, share of net oil fuel subsidy/tax revenue in GDP, contribution of food and beverages to inflation, trade as % of GDP, the Giniindex and Human Development Index could bebroadly classified under economic variables andthe variables like oil intensity of GDP, oil importdependence, share of oil in primary energy consumption, oil reserves to production ratio andshare of transport in oil consumption could beclassified under energy-related variables.
Among these variables (Table C-1), the first fiveeconomic variables (real GDP growth rate, GDPper capita, balance of payments – currentaccount, budget balance and import cover) areexpected to have positive influence in negatingthe vulnerability levels.The values of the variablesdetermine the level of the influence (higher orlower) in negating the vulnerability levels.However, if these variables have negative values(e.g. negative balance of payments), even thenthey positively contribute to an increase in the vulnerability levels. On the other hand, the fourenergy-related variables (oil intensity of GDP, oilimport dependence, share of oil in primary energy consumption and share of transport in oilconsumption) are expected to have negativeinfluence by contributing to the increase invulnerability levels. As the values of the variablesincrease, there is a chance of experiencing higher vulnerability. Only the variable ‘oil reservesto production ratio’ has opposite influence compared to the other four variables.
Methodology for Oil Price VulnerabilityIndex calculation
Appendix C:
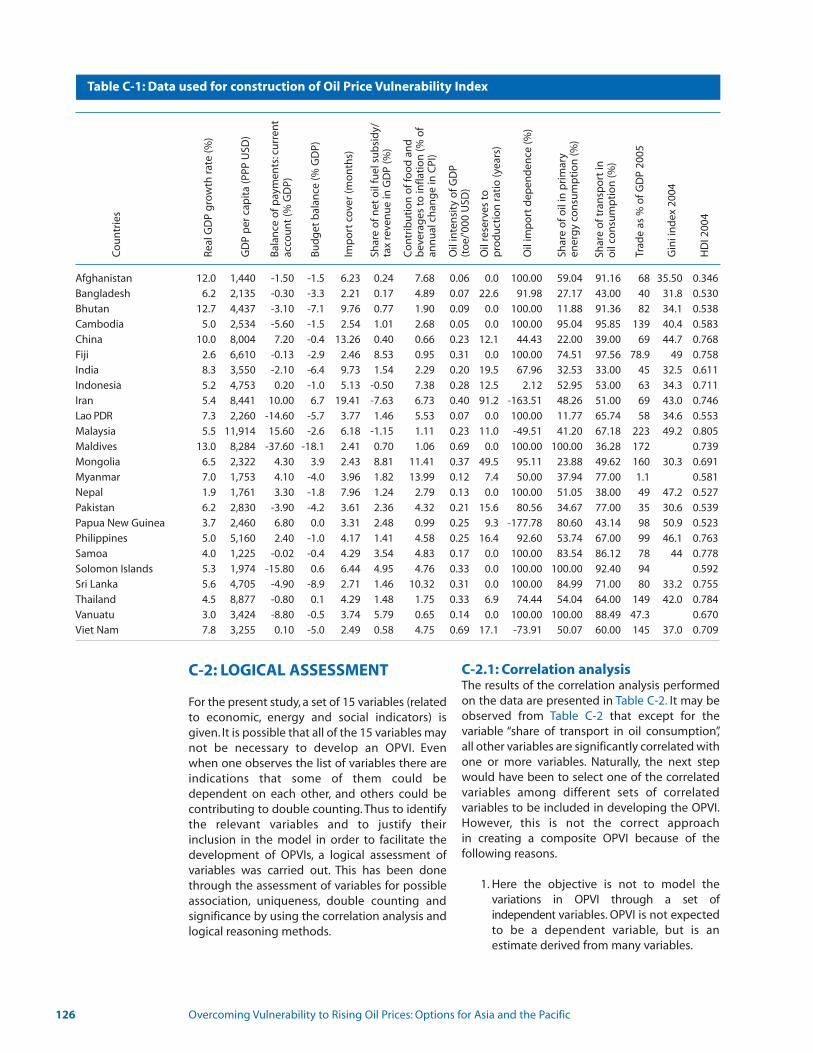
126 Overcoming Vulnerability to Rising Oil Prices: Options for Asia and the Pacific
Afghanistan 12.0 1,440 -1.50 -1.5 6.23 0.24 7.68 0.06 0.0 100.00 59.04 91.16 68 35.50 0.346
Bangladesh 6.2 2,135 -0.30 -3.3 2.21 0.17 4.89 0.07 22.6 91.98 27.17 43.00 40 31.8 0.530
Bhutan 12.7 4,437 -3.10 -7.1 9.76 0.77 1.90 0.09 0.0 100.00 11.88 91.36 82 34.1 0.538
Cambodia 5.0 2,534 -5.60 -1.5 2.54 1.01 2.68 0.05 0.0 100.00 95.04 95.85 139 40.4 0.583
China 10.0 8,004 7.20 -0.4 13.26 0.40 0.66 0.23 12.1 44.43 22.00 39.00 69 44.7 0.768
Fiji 2.6 6,610 -0.13 -2.9 2.46 8.53 0.95 0.31 0.0 100.00 74.51 97.56 78.9 49 0.758
India 8.3 3,550 -2.10 -6.4 9.73 1.54 2.29 0.20 19.5 67.96 32.53 33.00 45 32.5 0.611
Indonesia 5.2 4,753 0.20 -1.0 5.13 -0.50 7.38 0.28 12.5 2.12 52.95 53.00 63 34.3 0.711
Iran 5.4 8,441 10.00 6.7 19.41 -7.63 6.73 0.40 91.2 -163.51 48.26 51.00 69 43.0 0.746
Lao PDR 7.3 2,260 -14.60 -5.7 3.77 1.46 5.53 0.07 0.0 100.00 11.77 65.74 58 34.6 0.553
Malaysia 5.5 11,914 15.60 -2.6 6.18 -1.15 1.11 0.23 11.0 -49.51 41.20 67.18 223 49.2 0.805
Maldives 13.0 8,284 -37.60 -18.1 2.41 0.70 1.06 0.69 0.0 100.00 100.00 36.28 172 0.739
Mongolia 6.5 2,322 4.30 3.9 2.43 8.81 11.41 0.37 49.5 95.11 23.88 49.62 160 30.3 0.691
Myanmar 7.0 1,753 4.10 -4.0 3.96 1.82 13.99 0.12 7.4 50.00 37.94 77.00 1.1 0.581
Nepal 1.9 1,761 3.30 -1.8 7.96 1.24 2.79 0.13 0.0 100.00 51.05 38.00 49 47.2 0.527
Pakistan 6.2 2,830 -3.90 -4.2 3.61 2.36 4.32 0.21 15.6 80.56 34.67 77.00 35 30.6 0.539
Papua New Guinea 3.7 2,460 6.80 0.0 3.31 2.48 0.99 0.25 9.3 -177.78 80.60 43.14 98 50.9 0.523
Philippines 5.0 5,160 2.40 -1.0 4.17 1.41 4.58 0.25 16.4 92.60 53.74 67.00 99 46.1 0.763
Samoa 4.0 1,225 -0.02 -0.4 4.29 3.54 4.83 0.17 0.0 100.00 83.54 86.12 78 44 0.778
Solomon Islands 5.3 1,974 -15.80 0.6 6.44 4.95 4.76 0.33 0.0 100.00 100.00 92.40 94 0.592
Sri Lanka 5.6 4,705 -4.90 -8.9 2.71 1.46 10.32 0.31 0.0 100.00 84.99 71.00 80 33.2 0.755
Thailand 4.5 8,877 -0.80 0.1 4.29 1.48 1.75 0.33 6.9 74.44 54.04 64.00 149 42.0 0.784
Vanuatu 3.0 3,424 -8.80 -0.5 3.74 5.79 0.65 0.14 0.0 100.00 100.00 88.49 47.3 0.670
Viet Nam 7.8 3,255 0.10 -5.0 2.49 0.58 4.75 0.69 17.1 -73.91 50.07 60.00 145 37.0 0.709
C-2: LOGICAL ASSESSMENT
For the present study, a set of 15 variables (relatedto economic, energy and social indicators) isgiven. It is possible that all of the 15 variables maynot be necessary to develop an OPVI. Even when one observes the list of variables there areindications that some of them could be dependent on each other, and others could becontributing to double counting. Thus to identifythe relevant variables and to justify their inclusion in the model in order to facilitate the development of OPVIs, a logical assessment ofvariables was carried out. This has been donethrough the assessment of variables for possibleassociation, uniqueness, double counting andsignificance by using the correlation analysis andlogical reasoning methods.
C-2.1: Correlation analysisThe results of the correlation analysis performedon the data are presented in Table C-2. It may beobserved from Table C-2 that except for the variable “share of transport in oil consumption”,all other variables are significantly correlated withone or more variables. Naturally, the next stepwould have been to select one of the correlatedvariables among different sets of correlated variables to be included in developing the OPVI.However, this is not the correct approach in creating a composite OPVI because of the following reasons.
1. Here the objective is not to model thevariations in OPVI through a set of independent variables. OPVI is not expectedto be a dependent variable, but is an estimate derived from many variables.
Rea
l GD
P g
row
th r
ate
(%)
Co
un
trie
s
GD
P p
er c
apit
a (P
PP U
SD)
Bal
ance
of p
aym
ents
:cu
rren
tac
cou
nt
(% G
DP)
Bu
dg
et b
alan
ce (%
GD
P)
Shar
e o
f net
oil
fuel
su
bsi
dy/
ta
x re
ven
ue
in G
DP
(%)
Imp
ort
cov
er (m
on
ths)
Co
ntr
ibu
tio
n o
f fo
od
an
d
bev
erag
es t
o in
flati
on
(% o
fan
nu
al c
han
ge
in C
PI)
Oil
inte
nsi
ty o
f GD
P (t
oe/
'000
USD
)
Oil
rese
rves
to
p
rod
uct
ion
rat
io (y
ears
)
Oil
imp
ort
dep
end
ence
(%)
Shar
e o
f oil
in p
rim
ary
ener
gy
con
sum
pti
on
(%)
Shar
e o
f tra
nsp
ort
in
oil
con
sum
pti
on
(%)
Trad
e as
% o
f GD
P 20
05
Gin
i in
dex
200
4
HD
I 200
4
Table C-1: Data used for construction of Oil Price Vulnerability Index
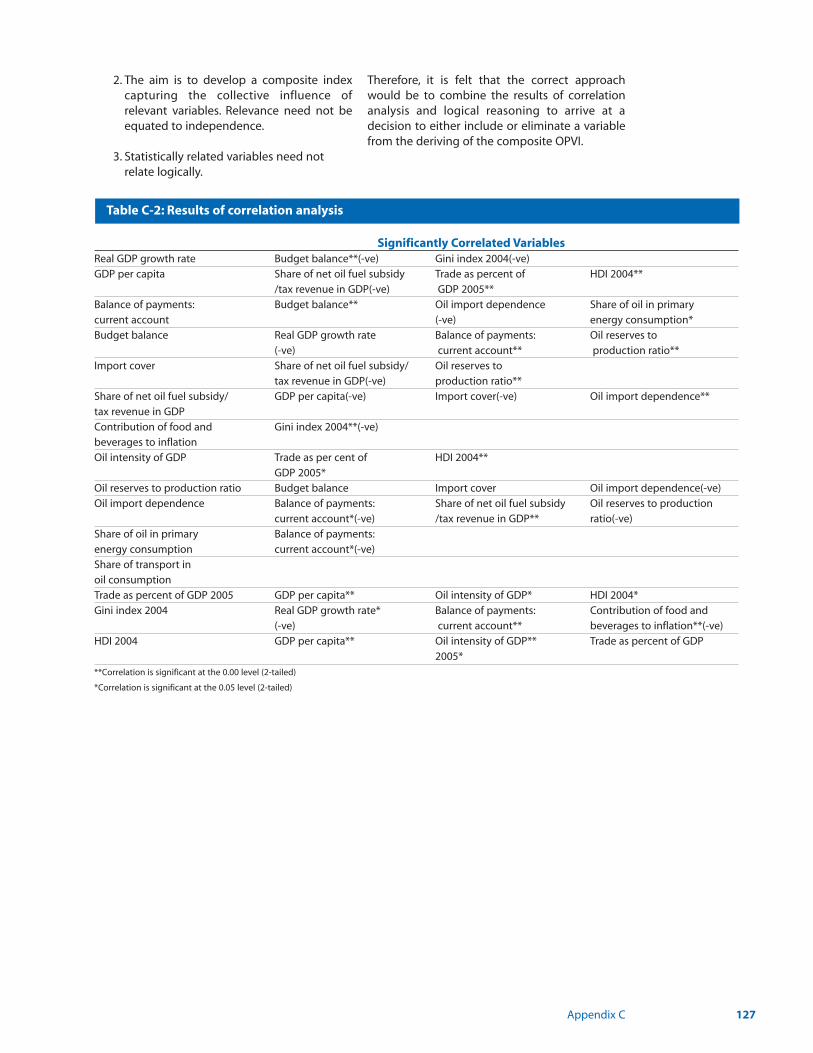
Appendix C 127
2. The aim is to develop a composite index capturing the collective influence of relevant variables. Relevance need not beequated to independence.
3. Statistically related variables need not relate logically.
Therefore, it is felt that the correct approachwould be to combine the results of correlationanalysis and logical reasoning to arrive at a decision to either include or eliminate a variablefrom the deriving of the composite OPVI.
Table C-2: Results of correlation analysis
Significantly Correlated VariablesReal GDP growth rate Budget balance**(-ve) Gini index 2004(-ve)
GDP per capita Share of net oil fuel subsidy Trade as percent of HDI 2004**
/tax revenue in GDP(-ve) GDP 2005**
Balance of payments: Budget balance** Oil import dependence Share of oil in primary
current account (-ve) energy consumption*
Budget balance Real GDP growth rate Balance of payments: Oil reserves to
(-ve) current account** production ratio**
Import cover Share of net oil fuel subsidy/ Oil reserves to
tax revenue in GDP(-ve) production ratio**
Share of net oil fuel subsidy/ GDP per capita(-ve) Import cover(-ve) Oil import dependence**
tax revenue in GDP
Contribution of food and Gini index 2004**(-ve)
beverages to inflation
Oil intensity of GDP Trade as per cent of HDI 2004**
GDP 2005*
Oil reserves to production ratio Budget balance Import cover Oil import dependence(-ve)
Oil import dependence Balance of payments: Share of net oil fuel subsidy Oil reserves to production
current account*(-ve) /tax revenue in GDP** ratio(-ve)
Share of oil in primary Balance of payments:
energy consumption current account*(-ve)
Share of transport in
oil consumption
Trade as percent of GDP 2005 GDP per capita** Oil intensity of GDP* HDI 2004*
Gini index 2004 Real GDP growth rate* Balance of payments: Contribution of food and
(-ve) current account** beverages to inflation**(-ve)
HDI 2004 GDP per capita** Oil intensity of GDP** Trade as percent of GDP
2005*
**Correlation is significant at the 0.00 level (2-tailed)
*Correlation is significant at the 0.05 level (2-tailed)
C-2.2: Logical reasoningAn attempt is made here to logically reason outthe justification for the inclusion or elimination ofa variable to develop a composite OPVI by takingthe following aspects in to consideration.
1. The variables are independent, as far as possible, in the sense that each one measuresa unique aspect of a system performance(economic or social).
2. Double counting or two or more variablesmeasuring the same aspect should be avoided.
3. The variables significantly influence the levels of vulnerability.
It is possible to argue that the variables can influence the vulnerability levels in two ways:
1. Positive influence: Higher observed values will reduce the vulnerability levels (economic variables).
2. Negative influence: Higher observed values will enhance the vulnerability levels (energy variables).
As explained earlier, among the 15 variables, thefirst five are economic variables that are expectedto have positive influence in negating the vulnerability levels. The values of the variablesdetermine the level of the influence (higher orlower) in negating the vulnerability levels.However, even if these variables have negativevalues (e.g., negative balance of payments), theypositively contribute to an increase in the vulnerability levels. On the other hand, the fourenergy-related variables are expected to havenegatives influences by contributing to anincrease in vulnerability levels. The higher the values of the variables, the greater the chance of experiencing a higher vulnerability. Only one variable, oil reserves to production ratio, hasopposite influence compared to the other fourvariables.
1. Real GDP growth rate: This represents a country’s “dynamic ability to cope” with priceincrease. If we can assume that the currentrate of growth is a reasonable indicator ofimmediate past and expected future growthrates of real GDP, this variable can have a positive influence in determining the vulnerability levels. Countries experiencinghigher growth rates can be expected to beless vulnerable than those experiencing lowergrowth rates. For example, a country like Chinawill be significantly less vulnerable thanNepal. Afghanistan is an exception because ofpast poor performance.
2. GDP per capita: This represents a country’s “inherent capability to cope” with oil priceincrease. This basically represents the economicstrength of a country. In other words, it determines a country’s affordability levelswith the price increase. The higher the GDPper capita, the greater is its ability to be lessvulnerable. For example, Malaysia is far lessvulnerable than Samoa.
3. Balance of payments - current account: The current account is the sum of net sales frominternational trade in goods and services, netfactor income (such as interest paymentsfrom abroad), and net unilateral transfersfrom abroad. This can be termed to representa country’s “capability to pay in FOREX”. A positive and higher (as a share of GDP) balanceof payments on current account represents acomfortable position in terms of paying forthe imported oil (especially to take care of anoil price rise). Most importantly, this will be the surplus generated in terms of foreignexchange. Countries with negative balance ofpayments will be more vulnerable to an oilprice rise. Oil-importing counties like Chinawill be less vulnerable compared to Maldives.
4. Budget balance: This represents a country’s “capability to pay from internal sources” totackle the problem of oil price rises. Anybudget surplus can act as a cushion at thetime of crisis, especially in regulating the oilprices to reduce the burden on consumers.Among the oil-importing countries, Mongoliais best placed with respect to this aspect,whereas Maldives appears most vulnerable.
5. Import cover: This basically suggests the amount of time a country can manage itsmonthly imports bills through accumulatedforeign exchange reserves.For an oil- importingcountry, the major portion of the import billwill be on account of oil imports. A higherimport cover means the country will be morecomfortable in tackling the price rise. Thisvariable can be equated to a country’s “capability to sustain”the impact of oil price risein terms of duration. In other words, how longcan a country sustain the oil price rise? Chinais less vulnerable compared to Bangladesh.
6. Share of net oil fuel subsidy/tax revenue in GDP: This ratio gives the degree of oil subsidy burden on the economy.Because tax revenue isthe most important component of governmentincome, it is relevant to establish how much ofit goes for subsidizing oil prices. If it accounts
128 Overcoming Vulnerability to Rising Oil Prices: Options for Asia and the Pacific
Appendix C 129
for a small or negligible share, then there isscope for increasing it to tackle the impact ofoil price rise. Countries with smaller shares willbe less vulnerable than those with highershares. At the outset, this variable appears notto be relevant, because both the componentsof oil fuel subsidy and tax revenue are part ofbudget estimates. Already, there is a variable“budget balance” that captures the position ofa country in terms of vulnerability levels.Logically, we may state that this particularvariable is redundant; however, this is not corroborated by the correlation analysisresults, indicating no significant correlationbetween the two variables. The reason couldbe a negligible share of net oil subsidy in taxrevenue, resulting in negligible contributionsto overall variations. Again logically, this variable can be eliminated from the index determination model.
7. Contribution of food and beverages to inflation: This basically indicates how developed a country is. A country with highercontributions from agricultural commoditiesin the overall inflation is stated to be at the initial stages of development. Thus, one couldconclude that a country having higher contributions of food and beverages to inflation would be more vulnerable to an oilprice rise. However, this type of influence hasalready been captured through two variables,“real GDP growth rate” and “GDP per capita,”making this variable redundant. Even so, thisis an indirect measure of influence on vulner-ability levels. Instead of this variable, a bettervariable could have been “contribution of oilprice changes to inflation.” This can beexpected to capture both the direct and indirect impact of oil price changes on theeconomy, and would have enabled obtaininga better indicator for arriving at a vulnerabilityindex.
8. Oil intensity of GDP: This determines the oil dependency levels of a country. The higherthe intensity, the greater is the vulnerability ofa country to the oil price increase. Cambodiais less vulnerable compared to Maldives.
9. Oil reserves to production ratio: This basicallyindicates a country's level of ownership of oilreserves and rate of exploitation. The higherthe ratio, the greater is the comfort level of acountry. Indigenous production of oil can actas an insurance cover for the international oilprice rise. This indicator is more relevant forlong-term vulnerability index. Countries thatdo not have any reserves are more vulnerable.
10. Oil import dependence:This is the most criticalvariable determining a country's vulnerabilitylevel.Those countries that depend 100 percenton imported oil are the most vulnerable tothe oil price rise. Logically, those who do nothave any oil reserves will be forced to import100 percent of oil requirement. This may indicate that one of the two variables “oilreserves to production ratio” and “oil importdependence” is redundant in deriving theOPVI. That does not mean that a country that has oil reserves cannot have high importdependence. This is a possible situation forcountries keeping their oil stock as strategicreserves and relying on imports for currentrequirements. In other words, it is possible to have countries with high oil import dependence as well as a high reserves to production ratio that exhibit less vulnerabilityto oil price shocks. Logically, both the variables are necessary for determining theOPVI; however, the data state the opposite.The correlation analysis shows that both thevariables are highly correlated, and it is significant. Thus, it may be advisable to retain“oil import dependence” and eliminate “oilreserves to production ratio,” at least in thepresent context.
11. Share of oil in primary energy consumption:This variable indicates how important oil is inrelation to other energy sources.The countrieswith a higher share will be more vulnerablethan those with a lower share.
12. Share of transport in oil consumption: Justthis variable alone would be inadequate toassess the linkage to vulnerability levels. Italso is important to know how much the transport sector is important to the economy.It may be possible that most of the oil is consumed by the transport sector (this typically happens in less industrialized countries), but it need not be critical. With this variable alone, it may not be possible tostate the relationship to vulnerability level.It cannot be true if one states that the countries with a higher share of transport inoil consumption will be more vulnerable to oil price shocks. It is necessary to include variable/s assessing the importance of transport. A derived variable capturing theessence of the two would be an ideal replacement.
13. GDP as % of trade: Much cannot be interpretedfrom this. Typically, smaller countries with relatively small domestic markets will havesignificantly higher international trade

compared to the country's GDP. It is logicallydifficult to assess the influence of this variableon vulnerability. Even the observed trendbased on the data provided does not appearto provide much insight on vulnerability levels.Thus, it may be eliminated from the basket ofvariables included for estimating OPVI.
14. Gini index: This is a measure of incomeinequality ranging from 0 (perfect equality) to100 (perfect inequality). Higher values exhibithigher inequality. This may not be an appropriate variable for assessing the vulnerability levels. Income equality orinequality can happen at both extremes. Apoor country can exhibit high equality, andthe same might be the case for a rich country. Even the opposite can be true. Forexample, Afghanistan (35.5) exhibits higherequality compared to Malaysia (49.2), whereasNepal, with a Gini index of 47.2, shows highinequality in comparison to Indonesia (34.3).We cannot state that countries with a higherGini index are more vulnerable or vice versa.Mere observation of the data related to theGini index of different Asian countries indicatethat countries with higher Gini index values(higher inequality) are less vulnerable to an oilprice rise. This variable may be eliminatedbecause it may not have much influence indetermining the vulnerability index.
That countries with a higher Gini index are lessvulnerable to an oil price rise can be logicallyargued in the case of India. On the basis of acomposite index derived from the macro indicators, countries like India at the outsetmight look more vulnerable to the oil pricerise. However, the reality may be different.Thisis due to the fact that a large majority of thepopulation is not part of the energy mainstream (depending on modern energycarriers) and their role in oil economy is negligible. They hardly get impacted directlyby the oil price rise. Even the indirect effectsmay be marginal because they are not a partof the mainstream market system. However,the macro indicators that are being used toarrive at the composite vulnerability index arederived, taking into consideration even thissection of the population (e.g., per capita GDP with and without this section of the population).
15. Human Development Index: This is a socioeconomic indicator of well-being of acountry that represents the overall social
capacity of the population to respond toadversities. The countries with higher HDI values tend to be less vulnerable to the oilprice rise. It may be possible that HDI can besignificantly correlated with “GDP per capita”and “oil intensity of GDP,” because both ofthese variables are part of the indicators thatare used to determine HDI. However, logicalconsiderations necessitate inclusion of allthree variables in the model determining thecomposite index because the three variablesmeasure different aspects of economic system. Though HDI includes economic indicators, the advantage is that it also captures the influence of social indicators.However, in the present analysis, the HDI hasbeen excluded because of the following reasons:
• It is a relative index (across countries) unlike other variables included in the analysis.Other variables either indicate exact measurements or are relative to sectors/segments within the country.
• The main objective here is to develop a country’s vulnerability index. All thevariables facilitate this except the HDI. TheHDI goes beyond this and attempts to capture the “social empowerment” levels,which are people-driven.
C-2.3: ConclusionBased on the logical reasoning and statisticalanalysis, the following are the possible final statusof the variables:
Included Variables:1. Real GDP growth rate 2. GDP per capita 3. Balance of payments-current account4. Budget balance5. Import cover 6. Oil intensity of GDP 7. Oil import dependence 8. Share of oil in primary energy consumption
Excluded Variables:1. Share of net oil fuel subsidy/tax revenue
in GDP 2. Contribution of food and beverages to
inflation 3. Oil reserves to production ratio 4. Share of transport in oil consumption 5. GDP as % of trade 6. Gini index7. Human Development Index
130 Overcoming Vulnerability to Rising Oil Prices: Options for Asia and the Pacific
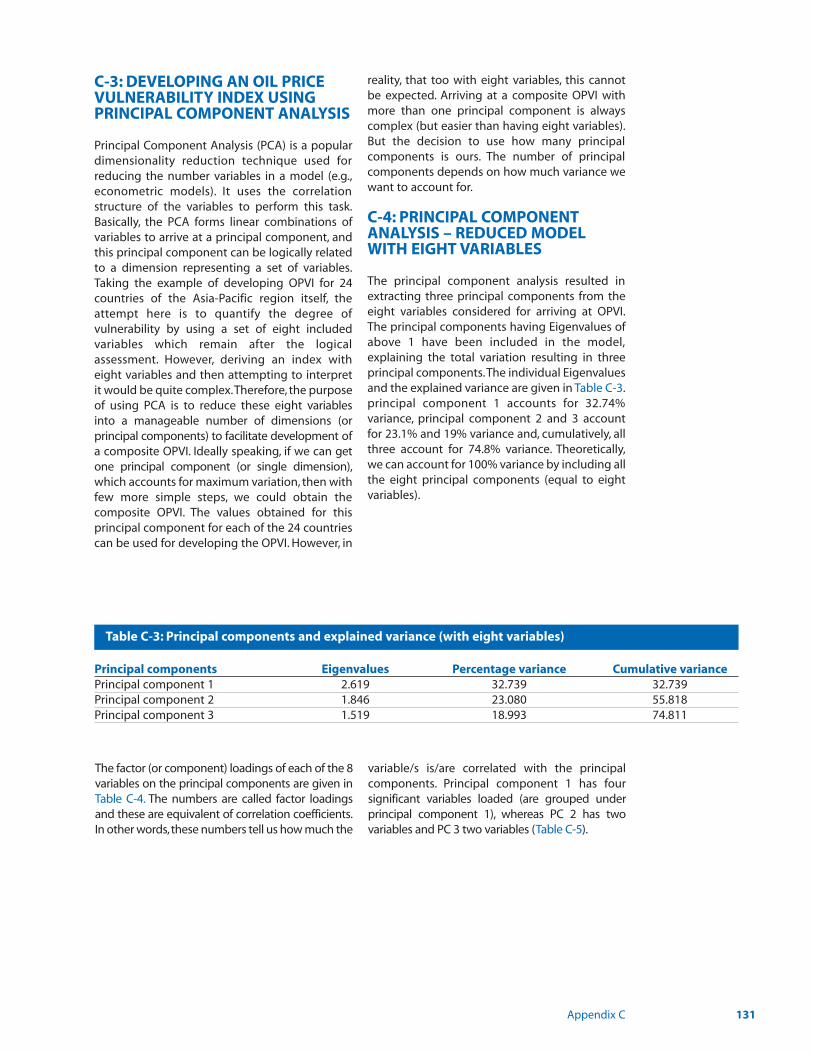
Appendix C 131
C-3: DEVELOPING AN OIL PRICEVULNERABILITY INDEX USINGPRINCIPAL COMPONENT ANALYSIS
Principal Component Analysis (PCA) is a populardimensionality reduction technique used forreducing the number variables in a model (e.g.,econometric models). It uses the correlationstructure of the variables to perform this task.Basically, the PCA forms linear combinations ofvariables to arrive at a principal component, andthis principal component can be logically relatedto a dimension representing a set of variables.Taking the example of developing OPVI for 24countries of the Asia-Pacific region itself, theattempt here is to quantify the degree of vulnerability by using a set of eight included variables which remain after the logical assessment. However, deriving an index witheight variables and then attempting to interpretit would be quite complex.Therefore, the purposeof using PCA is to reduce these eight variablesinto a manageable number of dimensions (or principal components) to facilitate development ofa composite OPVI. Ideally speaking, if we can getone principal component (or single dimension),which accounts for maximum variation, then withfew more simple steps, we could obtain the composite OPVI. The values obtained for this principal component for each of the 24 countriescan be used for developing the OPVI. However, in
reality, that too with eight variables, this cannotbe expected. Arriving at a composite OPVI withmore than one principal component is alwayscomplex (but easier than having eight variables).But the decision to use how many principal components is ours. The number of principalcomponents depends on how much variance wewant to account for.
C-4: PRINCIPAL COMPONENTANALYSIS – REDUCED MODELWITH EIGHT VARIABLES
The principal component analysis resulted inextracting three principal components from theeight variables considered for arriving at OPVI.The principal components having Eigenvalues ofabove 1 have been included in the model,explaining the total variation resulting in threeprincipal components.The individual Eigenvaluesand the explained variance are given in Table C-3.principal component 1 accounts for 32.74% variance, principal component 2 and 3 accountfor 23.1% and 19% variance and, cumulatively, allthree account for 74.8% variance. Theoretically,we can account for 100% variance by including allthe eight principal components (equal to eightvariables).
Table C-3: Principal components and explained variance (with eight variables)
Principal components Eigenvalues Percentage variance Cumulative variance937.23937.23916.21 tnenopmoc lapicnirP818.55080.32648.12 tnenopmoc lapicnirP118.47399.81915.13 tnenopmoc lapicnirP
The factor (or component) loadings of each of the 8variables on the principal components are given inTable C-4. The numbers are called factor loadingsand these are equivalent of correlation coefficients.In other words,these numbers tell us how much the
variable/s is/are correlated with the principal components. Principal component 1 has four significant variables loaded (are grouped underprincipal component 1), whereas PC 2 has two variables and PC 3 two variables (Table C-5).
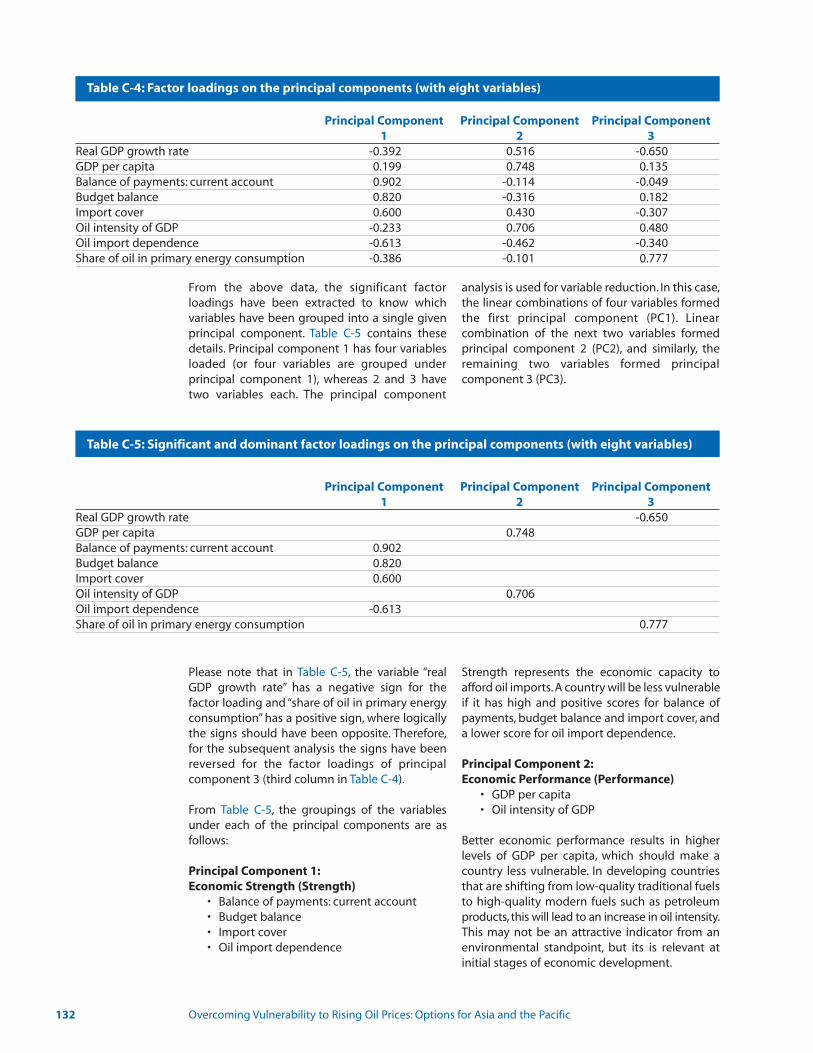
From the above data, the significant factor loadings have been extracted to know whichvariables have been grouped into a single givenprincipal component. Table C-5 contains thesedetails. Principal component 1 has four variablesloaded (or four variables are grouped under principal component 1), whereas 2 and 3 havetwo variables each. The principal component
analysis is used for variable reduction. In this case,the linear combinations of four variables formedthe first principal component (PC1). Linear combination of the next two variables formedprincipal component 2 (PC2), and similarly, theremaining two variables formed principal component 3 (PC3).
132 Overcoming Vulnerability to Rising Oil Prices: Options for Asia and the Pacific
Table C-4: Factor loadings on the principal components (with eight variables)
Principal Component Principal Component Principal Component321
056.0-615.0293.0-etar htworg PDG laeR531.0847.0991.0atipac rep PDG
Balance of payments: current account 0.902 -0.114 -0.049281.0613.0-028.0ecnalab tegduB703.0-034.0006.0revoc tropmI084.0607.0332.0-PDG fo ytisnetni liO043.0-264.0-316.0-ecnedneped tropmi liO
Share of oil in primary energy consumption -0.386 -0.101 0.777
Table C-5: Significant and dominant factor loadings on the principal components (with eight variables)
Principal Component Principal Component Principal Component321
056.0-etar htworg PDG laeR847.0atipac rep PDG
Balance of payments: current account 0.902028.0ecnalab tegduB006.0revoc tropmI
607.0PDG fo ytisnetni liO316.0-ecnedneped tropmi liO
777.0noitpmusnoc ygrene yramirp ni lio fo erahS
Please note that in Table C-5, the variable “realGDP growth rate” has a negative sign for the factor loading and “share of oil in primary energyconsumption” has a positive sign, where logicallythe signs should have been opposite. Therefore,for the subsequent analysis the signs have beenreversed for the factor loadings of principal component 3 (third column in Table C-4).
From Table C-5, the groupings of the variablesunder each of the principal components are as follows:
Principal Component 1:Economic Strength (Strength)
• Balance of payments: current account • Budget balance• Import cover • Oil import dependence
Strength represents the economic capacity toafford oil imports.A country will be less vulnerableif it has high and positive scores for balance ofpayments, budget balance and import cover, anda lower score for oil import dependence.
Principal Component 2:Economic Performance (Performance)
• GDP per capita • Oil intensity of GDP
Better economic performance results in higherlevels of GDP per capita, which should make acountry less vulnerable. In developing countriesthat are shifting from low-quality traditional fuelsto high-quality modern fuels such as petroleumproducts, this will lead to an increase in oil intensity.This may not be an attractive indicator from anenvironmental standpoint, but its is relevant atinitial stages of economic development.

Appendix C 133
Principal Component 3:Economic Growth with low share of oil in primary energy (Low-oil-growth)
• Real GDP growth rate• Share of oil in primary energy consumption
(Reducing share)
Many countries initially base their developmenton primary energy sources other than oil,including traditional fuels or, as in the cases ofChina and India, coal and hydro. But they are likely to become increasingly oil-dependent. A
country will be less vulnerable if it can combine ahigh GDP growth rate with a low share of oil inprimary energy consumption.
The values of these three principal componentsare called factor scores. As mentioned earlier, theprincipal components are derived based on thelinear combination of the variables. In otherwords, the values of the principal componentscan be derived from these linear combinations.The equation for this is as follows:
mPCn = � ∑ajnnj, for all ‘n’
j = 1
Where,PCn = The factor score for principal component “n” (here, n = 1, 2, …, 5)aj = Factor loading of variable 'j' on principal component “n” (here j = 1, 2, …, 15)Xj = Standardized variable ‘j’ (here j = 1, 2, …, 15)
In expanded form for principal component 1, the equation will be
PC1 = a11X1 + a21X2 + a31X3 + ….. + a151X15
The factor scores for different countries are estimated using the factor loadings (Table C-4) and standardized values1 of the original data (given in Table C-1). Table C-6 contains the factor scores forthe 24 countries of the Asia-Pacific region.
1 Standardized Value = (Original Value - Mean Value)Standard Deviation

134 Overcoming Vulnerability to Rising Oil Prices: Options for Asia and the Pacific
Table C-6: Factor scores (with eight variables)
Strength Performance Low-oil-growthAfghanistan -0.73 -0.85 1.98
Bangladesh -0.25 -1.79 1.28
Bhutan -0.61 1.08 3.69
Cambodia -1.11 -2.31 -0.83
China 2.65 2.19 2.10
Fiji -0.38 -0.47 -1.65
India -0.08 0.59 1.75
Indonesia 0.97 0.11 -0.57
Iran 6.61 3.42 -0.77
Lao PDR -1.67 -1.07 2.11
Malaysia 3.24 2.22 -0.40
Maldives -8.42 4.68 -0.84
Mongolia 1.04 -0.99 0.37
Myanmar 0.23 -1.16 1.04
Nepal 1.25 -2.05 -0.03
Pakistan -0.67 -0.75 0.72
Papua New Guinea 2.48 -0.29 -2.35
Philippines 0.43 -0.55 -0.28
Samoa -0.15 -2.22 -0.90
Solomon Islands -1.60 -0.86 -1.51
Sri Lanka -2.46 -0.02 -0.96
Thailand 0.70 0.74 -0.92
Vanuatu -0.92 -1.95 -1.67
Viet Nam 0.17 2.78 0.05
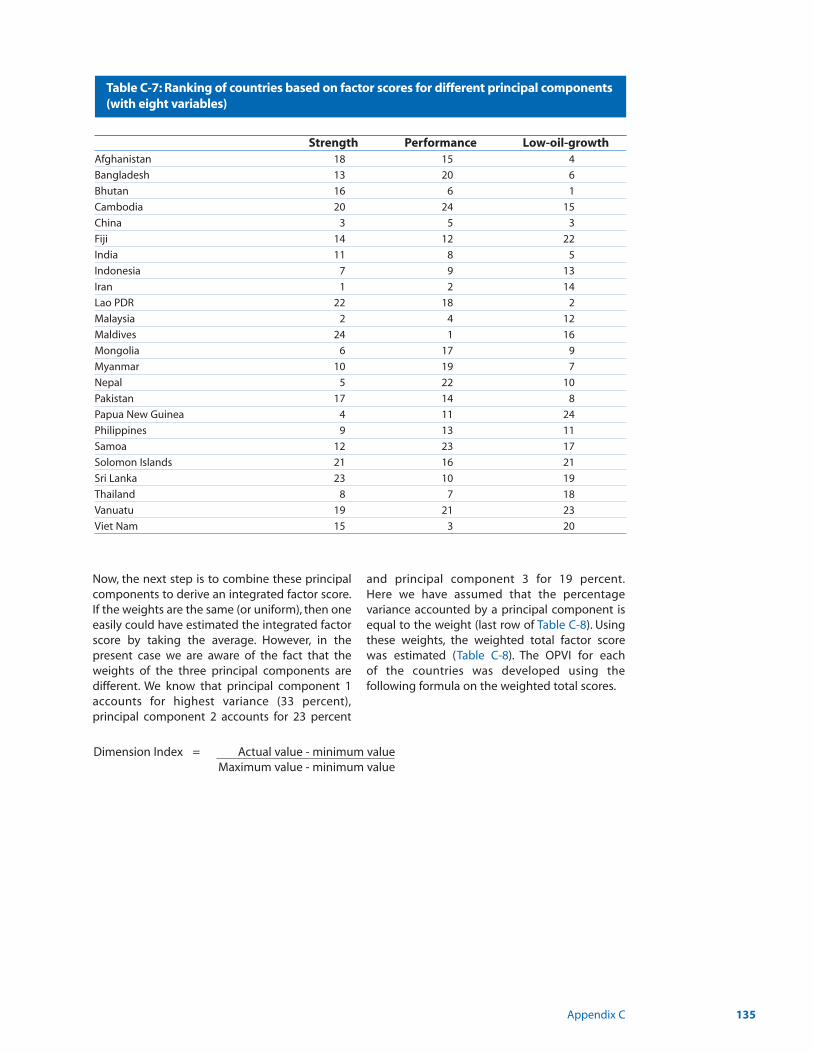
Appendix C 135
Now, the next step is to combine these principalcomponents to derive an integrated factor score.If the weights are the same (or uniform), then oneeasily could have estimated the integrated factorscore by taking the average. However, in the present case we are aware of the fact that theweights of the three principal components aredifferent. We know that principal component 1accounts for highest variance (33 percent),principal component 2 accounts for 23 percent
and principal component 3 for 19 percent.Here we have assumed that the percentage variance accounted by a principal component isequal to the weight (last row of Table C-8). Usingthese weights, the weighted total factor scorewas estimated (Table C-8). The OPVI for each of the countries was developed using the following formula on the weighted total scores.
Table C-7: Ranking of countries based on factor scores for different principal components(with eight variables)
Strength Performance Low-oil-growthAfghanistan 18 15 4
Bangladesh 13 20 6
Bhutan 16 6 1
Cambodia 20 24 15
China 3 5 3
Fiji 14 12 22
India 11 8 5
Indonesia 7 9 13
Iran 1 2 14
Lao PDR 22 18 2
Malaysia 2 4 12
Maldives 24 1 16
Mongolia 6 17 9
Myanmar 10 19 7
Nepal 5 22 10
Pakistan 17 14 8
Papua New Guinea 4 11 24
Philippines 9 13 11
Samoa 12 23 17
Solomon Islands 21 16 21
Sri Lanka 23 10 19
Thailand 8 7 18
Vanuatu 19 21 23
Viet Nam 15 3 20
Dimension Index = Actual value - minimum valueMaximum value - minimum value

136 Overcoming Vulnerability to Rising Oil Prices: Options for Asia and the Pacific
Table C-8: Weighted factor scores, OPVI and ranking based on OPVI (with eight variables)
Strength Performance Low-oil- Weighted OPVI Rankgrowth total score
Afghanistan -0.24 -0.20 0.38 -0.06 0.38 13
Bangladesh -0.08 -0.41 0.24 -0.25 0.34 15
Bhutan -0.20 0.25 0.70 0.75 0.56 4
Cambodia -0.36 -0.53 -0.16 -1.05 0.17 22
China 0.87 0.50 0.40 1.77 0.78 2
Fiji -0.12 -0.11 -0.31 -0.55 0.28 18
India -0.03 0.14 0.33 0.44 0.49 5
Indonesia 0.32 0.03 -0.11 0.23 0.45 7
Iran 2.16 0.79 -0.15 2.81 1.00 1
Lao PDR -0.55 -0.25 0.40 -0.39 0.31 17
Malaysia 1.06 0.51 -0.08 1.50 0.72 3
Maldives -2.76 1.08 -0.16 -1.84 0.00 24
Mongolia 0.34 -0.23 0.07 0.18 0.43 9
Myanmar 0.08 -0.27 0.20 0.01 0.40 11
Nepal 0.41 -0.47 -0.01 -0.07 0.38 14
Pakistan -0.22 -0.17 0.14 -0.25 0.34 16
Papua New Guinea 0.81 -0.07 -0.45 0.30 0.46 6
Philippines 0.14 -0.13 -0.05 -0.04 0.39 12
Samoa -0.05 -0.51 -0.17 -0.73 0.24 19
Solomon Islands -0.52 -0.20 -0.29 -1.01 0.18 21
Sri Lanka -0.81 0.00 -0.18 -0.99 0.18 20
Thailand 0.23 0.17 -0.18 0.22 0.44 8
Vanuatu -0.30 -0.45 -0.32 -1.07 0.17 23
Viet Nam -0.18 0.53 -0.26 0.10 0.42 10
Weights based on variance 32.739 23.08 18.993accounted (%)
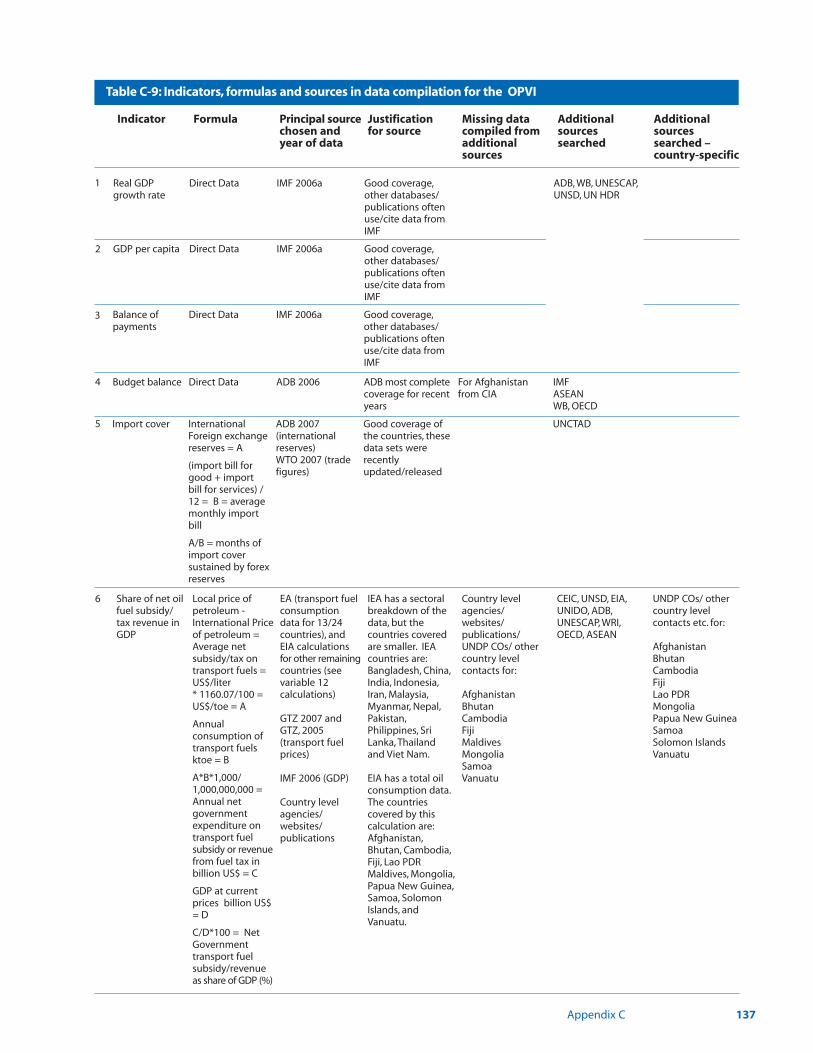
Appendix C 137
Indicator Formula Principal source Justification Missing data Additional Additional chosen and for source compiled from sources sourcesyear of data additional searched searched –
sources country-specific
Table C-9: Indicators, formulas and sources in data compilation for the OPVI
Share of net oilfuel subsidy/tax revenue inGDP
Local price ofpetroleum -International Priceof petroleum =Average net subsidy/tax ontransport fuels =US$/liter * 1160.07/100 =US$/toe = A
Annual consumption oftransport fuelsktoe = B
A*B*1,000/1,000,000,000 =Annual net governmentexpenditure ontransport fuelsubsidy or revenuefrom fuel tax inbillion US$ = C
GDP at currentprices billion US$= D
C/D*100 = NetGovernmenttransport fuelsubsidy/revenueas share of GDP (%)
EA (transport fuelconsumptiondata for 13/24countries), andEIA calculationsfor other remainingcountries (seevariable 12 calculations)
GTZ 2007 andGTZ, 2005 (transport fuelprices)
IMF 2006 (GDP)
Country levelagencies/websites/publications
IEA has a sectoralbreakdown of thedata, but the countries coveredare smaller. IEAcountries are:Bangladesh, China,India, Indonesia,Iran, Malaysia,Myanmar, Nepal,Pakistan,Philippines, SriLanka, Thailandand Viet Nam.
EIA has a total oilconsumption data.The countries covered by this calculation are:Afghanistan,Bhutan, Cambodia,Fiji, Lao PDRMaldives, Mongolia,Papua New Guinea,Samoa, SolomonIslands, andVanuatu.
Country level agencies/websites/publications/UNDP COs/ othercountry level contacts for:
AfghanistanBhutanCambodiaFijiMaldivesMongoliaSamoaVanuatu
CEIC, UNSD, EIA,UNIDO, ADB,UNESCAP, WRI,OECD, ASEAN
UNDP COs/ othercountry level contacts etc. for:
AfghanistanBhutanCambodiaFijiLao PDRMongoliaPapua New GuineaSamoaSolomon IslandsVanuatu
6
Real GDPgrowth rate
Direct Data IMF 2006a Good coverage,other databases/publications oftenuse/cite data fromIMF
ADB, WB, UNESCAP,UNSD, UN HDR
GDP per capita Direct Data IMF 2006a Good coverage,other databases/publications oftenuse/cite data fromIMF
2
1
Balance of payments
Direct Data IMF 2006a Good coverage,other databases/publications oftenuse/cite data fromIMF
Budget balance Direct Data ADB 2006 ADB most completecoverage for recentyears
For Afghanistanfrom CIA
IMFASEANWB, OECD
Import cover InternationalForeign exchangereserves = A
(import bill forgood + importbill for services) /12 = B = averagemonthly importbill
A/B = months ofimport cover sustained by forexreserves
ADB 2007 (internationalreserves)WTO 2007 (tradefigures)
Good coverage ofthe countries, thesedata sets wererecentlyupdated/released
UNCTAD
4
3
5
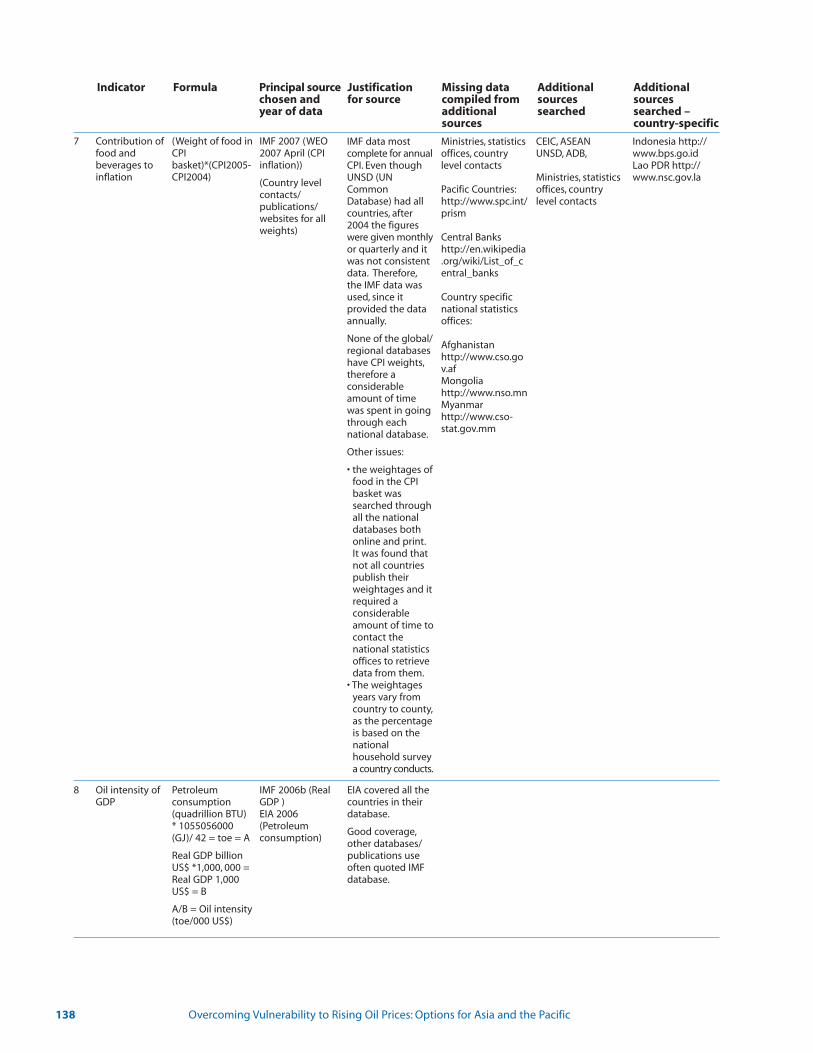
138 Overcoming Vulnerability to Rising Oil Prices: Options for Asia and the Pacific
Indicator Formula Principal source Justification Missing data Additional Additional chosen and for source compiled from sources sourcesyear of data additional searched searched –
sources country-specific
Indonesia http://www.bps.go.idLao PDR http://www.nsc.gov.la
Oil intensity ofGDP
Petroleum consumption(quadrillion BTU)* 1055056000(GJ)/ 42 = toe = A
Real GDP billionUS$ *1,000, 000 =Real GDP 1,000US$ = B
A/B = Oil intensity(toe/000 US$)
8 EIA covered all thecountries in theirdatabase.
Good coverage,other databases/publications useoften quoted IMFdatabase.
IMF 2006b (RealGDP )EIA 2006(Petroleum consumption)
IMF data mostcomplete for annualCPI. Even thoughUNSD (UNCommonDatabase) had allcountries, after2004 the figureswere given monthlyor quarterly and itwas not consistentdata. Therefore,the IMF data wasused, since it provided the dataannually.
None of the global/regional databaseshave CPI weights,therefore a considerableamount of timewas spent in goingthrough eachnational database.
Other issues:
• the weightages of food in the CPIbasket wassearched throughall the nationaldatabases bothonline and print.It was found thatnot all countriespublish theirweightages and itrequired a considerableamount of time tocontact thenational statisticsoffices to retrievedata from them.
• The weightages years vary fromcountry to county,as the percentageis based on thenational household surveya country conducts.
Contribution offood and beverages toinflation
(Weight of food inCPIbasket)*(CPI2005-CPI2004)
7 IMF 2007 (WEO2007 April (CPIinflation))
(Country levelcontacts/publications/websites for allweights)
CEIC, ASEANUNSD, ADB,
Ministries, statisticsoffices, countrylevel contacts
Ministries, statisticsoffices, countrylevel contacts
Pacific Countries:http://www.spc.int/prism
Central Bankshttp://en.wikipedia.org/wiki/List_of_central_banks
Country specificnational statisticsoffices:
Afghanistanhttp://www.cso.gov.afMongoliahttp://www.nso.mnMyanmarhttp://www.cso-stat.gov.mm

Appendix C 139
Indicator Formula Principal source Justification Missing data Additional Additional chosen and for source compiled from sources sourcesyear of data additional searched searched –
sources country-specific
Share of transport in oilconsumption
Share of oil inprimary energyconsumption
Oil importdependence
Oil reserves toproductionratio
Proved Crude OilReserves billionbarrels*1,000 =million barrels = A
(Production ofCrude Oil, NGPLand other liquidsand refinerypressing gainthousand barrels/day)*365)/1000 = million barrels/ year = B
A/B = oil reservesto productionration in years
Oil consumptionbarrels/day = A
Oil Productionbarrels/day = B
(A-B)/ A * 100 =Oil Importdependence
PetroleumConsumption(quadrillionBTU/quad) *1055056000/42/1,000 = A
Primary EnergyConsumption(quadrillionBTU/quad)*1055056000/42/1,000 = BA/B*100 =Calculated Shareof oil in totalenergy consumption (%)
Direct Data fromIEA
((Total oil consumptionThousandBarrels/Day)*365*159)= (litres/day)/1160.70)/1000 =Total oil consumptionktoe = A
(((Total ElectricityThermalGeneration Billionkwh*1,000,000,000)*3.6 ) /1,000=kilojoules/42 =Oil consumptionfor power generation inktoe = B
A-B = Share oftransport in oilconsumption
9
10
11
12 IEA has a sectoralbreakdown of thedata, but the countries coveredare smaller. IEAcountries are:Bangladesh, China,India, Indonesia,Iran, Malaysia,Myanmar, Nepal,Pakistan,Philippines, SriLanka, Thailandand Viet Nam.
EIA has a total oilconsumption data.The countries covered by this calculation are:Afghanistan,Bhutan, Cambodia,Fiji, Lao PDRMaldives,Mongolia, PapuaNew Guinea,Samoa, SolomonIslands, andVanuatu.
For Cambodia, PNGfrom APEC;
Country levelagencies/websites/publications/UNDP COs/ othercountry level contacts for:AfghanistanBhutanFijiMaldivesMongoliaSamoaVanuatu
EIA, ADB, OECD,WEC, Petrol journalCountry level publications/ websites
IEA, ADB, CEIC www.ceicdata.com ISI EmergingMarkets CEIC, UNSD, EIA,ADB, UNIDO,UNESCAP, WRI,OECD, ASEAN, WEC
UNDP COs/ othercountry level contacts for:AfghanistanBhutanCambodiaFijiLao PDRMaldivesMongoliaPapua New GuineaSamoaSolomon IslandsVanuatu
EIA coverage bestEIA 2004IEA 2006; EIA2004
CIA 2007 CIA coverage good,most recent data,reliable when confirmed fromother sources
For Bangladeshfrom EIA
CEIC, ASEANUNSD, ADB
Ministries, statisticsoffices, countrylevel contacts
BP, 2006, BPStatistical Reviewof World Energy2006, July 2006,British Petroleum,London
Nicolau & Scheiner,2005, Oil in Timor-Leste,Guteriano Nicolauand CharlesScheiner, La’oHamutuk,September 2005, athttp://www.lao-hamutuk.org/Oil/curse/OilInTLOilwatch.htm
CIA 2007 CIA coverage good,most recent data,reliable when confirmed fromother sources
140 Overcoming Vulnerability to Rising Oil Prices: Options for Asia and the Pacific
Following the ranking of countries on the basis of overall oil price vulnerability, they have been categorized as shown in Table 3-3. The categorization of countries into low, medium and high OPVIgroups has been done using the mean (0.396) and standard deviation (0.215) combination on the estimated OPVI:
Low OPVI countries OPVI value ≥ Mean + Standard deviationHigh OPVI countries OPVI value ≤ MeanMedium OPVI countries All the countries between the two limits
1. Low OPVI countries: High economic capacity (or strength) to absorb oil price shocks, perform better with high per capita GDP and economic growth rate, and have either low reliance on oil or are net exporters of oil
2. Medium OPVI countries: Medium economic capacity (or strength) to absorb oil price shocks,perform better with high or medium per-capita GDP and economic growth rate, and have either low reliance on oil or are net exporters of oil
3. High OPVI countries: Low economic strength, lower economic performance and high oil dependency
Oil Price Vulnerability Index:country grouping
Appendix D:

Appendix E 141
The assumptions used in the comparative analysisof generation costs were based on the results andassumptions of a 2005 study undertaken jointly byenergy research institutions and power generatingcompanies under the direction of the World Bank.2 The study covered whether renewable energy technologies for off-grid and mini-grid applications are competitive with gasoline anddiesel generation sets. The study shows:
• Renewable energy is more economical than conventional generation for off-grid (less than5 kW) applications. Renewable energy technologies – wind, mini-hydro and biomass-electric – are the least-cost option (on a levelizedbasis) for off-grid electrification applications,assuming availability of the renewableresource. Pico-hydro, small wind, and PV-windhybrid technologies, in particular,are projectedto be in the range of 15-25 cents/kWh, lessthan half the 30-40 cents/kWh for gasolineand diesel engine generators. The mostexpensive renewable energy technology(solar PV) is comparable in levelized electricitycosts to the projected costs for gasoline ordiesel engine generators, especially for smallpower applications (50-300W).
• Several renewable energy technologies arepotentially the least-cost option for mini-gridapplications.Mini-grid applications are village-and district-level networks with loadsbetween 5 kW and 500 kW that are not connected to a national grid. The assessmentindicates that numerous renewable energytechnologies (biomass, biogas, geothermal,wind and micro-hydro) are the potential least-cost generating option for mini-grids,
assuming a sufficient renewable energyresource is available.Two biomass technologies– biogas digesters and biomass gasifiers –seem particularly promising, due to their highcapacity factors and availability in size rangesmatched to mini-grid loads. Geothermal alsoappears economical, recognizing that it isrestricted to only those developing economieswith easy-to-tap hydrothermal resources andno large field development costs. Because somany renewable energy sources are viable inthis size range, mini-grid planners should thoroughly review their options to make thebest selection.
The levelized cost of energy was used to examinethe relative costs of individual technologies compared to oil-based technologies.3 The economicassessment was performed for different operatingconditions (full-time and limited operating hoursin mini-grid and off-grid configurations) and different time periods (2004, 2010 and 2015) inorder to incorporate projected cost reductionsfrom the scaling up of emerging technologies.The study results make it possible to compare the levelized economic costs of electricity technologiesover a broad range of deployment modes anddemand levels, both at present and in the future.The forecast value of the future price in 2010 and2015 is calculated by considering the decrease ofthe future price as a result of both technologicalinnovation and mass production. A forecastdecrease in capital cost is done for each generationtechnology group, as shown in Table E-1, reflectingthe relative maturity of each technology. Thus, a“lower-range cost,” a “most probable cost” and a “higher-range cost” were estimated for eachtechnology. 4
Assumptions used in the comparative analysis of the generation costs of
renewable energy technologies vs oil-basedpower generation
Appendix E:
2Techno-Economic Assessment of Off-Grid, Mini-Grid and Grid Power Generation Technologies, World Bank , 2005 (WB Toolkit Website - http://web.worldbank.org/ 3Ibid.“Levelization” involves calculating a stream of equal cash flows whose “Net Present Value,” or NPV, is equal to a given stream of variable cash flows. Levelized cost is usually calculated in constant dollars. If a project's levelized annual cash flow is divided by the annual amount of energy produced, the result is called the levelized cost of energy. The result can be used to compare the given projectwith other projects or energy sources for which the costs also have been levelized.4Ibid.
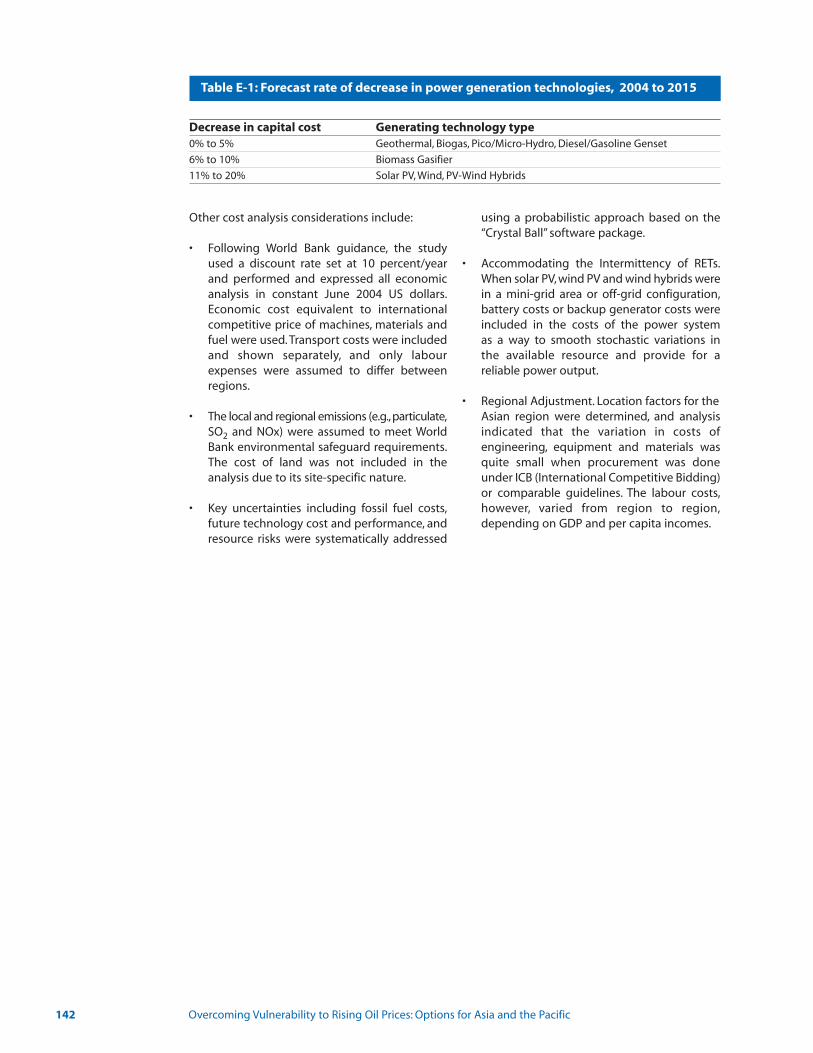
142 Overcoming Vulnerability to Rising Oil Prices: Options for Asia and the Pacific
Table E-1: Forecast rate of decrease in power generation technologies, 2004 to 2015
Decrease in capital cost Generating technology type0% to 5% Geothermal, Biogas, Pico/Micro-Hydro, Diesel/Gasoline Genset
6% to 10% Biomass Gasifier
11% to 20% Solar PV, Wind, PV-Wind Hybrids
Other cost analysis considerations include:
• Following World Bank guidance, the study used a discount rate set at 10 percent/yearand performed and expressed all economicanalysis in constant June 2004 US dollars.Economic cost equivalent to internationalcompetitive price of machines, materials andfuel were used. Transport costs were includedand shown separately, and only labourexpenses were assumed to differ betweenregions.
• The local and regional emissions (e.g.,particulate,SO2 and NOx) were assumed to meet WorldBank environmental safeguard requirements.The cost of land was not included in theanalysis due to its site-specific nature.
• Key uncertainties including fossil fuel costs,future technology cost and performance, andresource risks were systematically addressed
using a probabilistic approach based on the“Crystal Ball” software package.
• Accommodating the Intermittency of RETs.When solar PV, wind PV and wind hybrids werein a mini-grid area or off-grid configuration,battery costs or backup generator costs wereincluded in the costs of the power system as a way to smooth stochastic variations inthe available resource and provide for a reliable power output.
• Regional Adjustment. Location factors for the Asian region were determined, and analysisindicated that the variation in costs of engineering, equipment and materials wasquite small when procurement was doneunder ICB (International Competitive Bidding)or comparable guidelines. The labour costs,however, varied from region to region,depending on GDP and per capita incomes.

Appendix F 143
The methodology adopted for obtaining the ranking was two-pronged:
1. Capturing the perceptions of the group of energy experts in a brainstorming session on the classification of strategies from the perspective of various objectives. The three objectives considered are overall effectiveness (combining all the objectives listed above), cost of implementation and time required for implementation. Three classification levels – high, medium and low – were used. Through a consensus, each of the strategies were classified as high,medium or low.
2. Again through a consultative process and with a consensus, the weights for the three objectives were obtained. The weights assigned were 0.50 for overall effectiveness, 0.30 for cost of implementation (since all the countries are developing countries and cost is an important consideration), and 0.20 for time required for implementation.
Methodology of sub-strategy priorities
Appendix F:
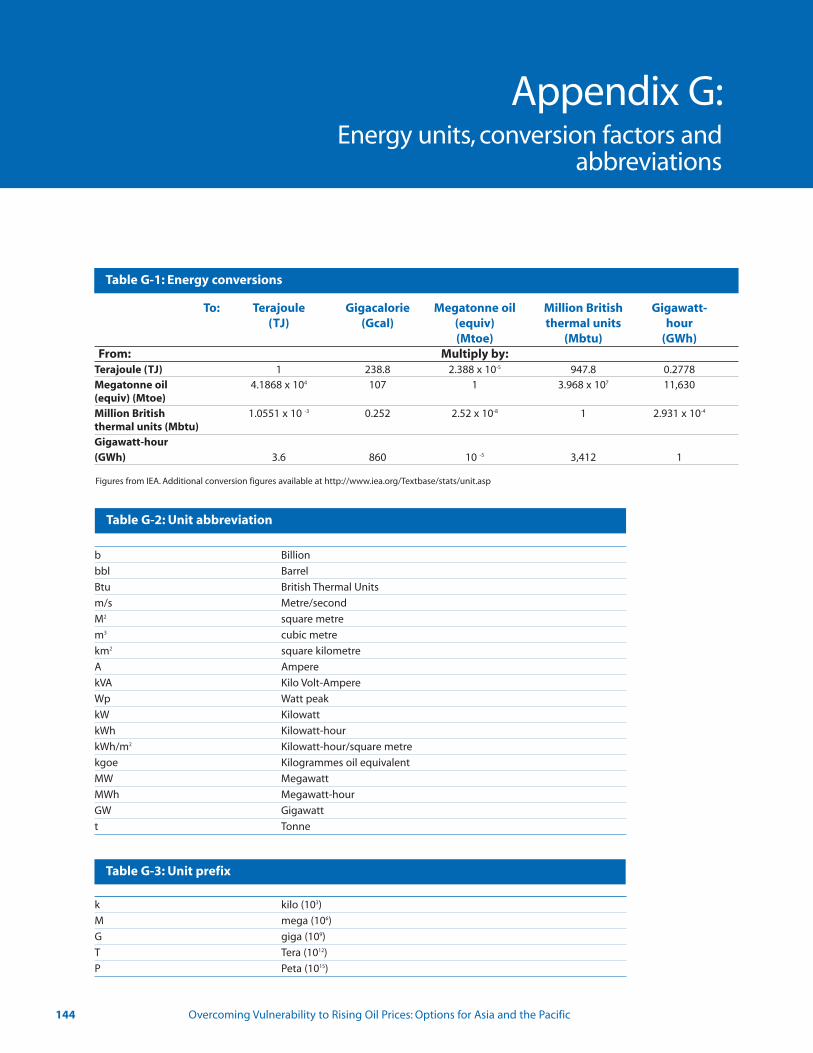
144 Overcoming Vulnerability to Rising Oil Prices: Options for Asia and the Pacific
Table G-1: Energy conversions
To: Terajoule Gigacalorie Megatonne oil Million British Gigawatt-(TJ) (Gcal) (equiv) thermal units hour
(Mtoe) (Mbtu) (GWh)From: Multiply by:
Terajoule (TJ) 1 238.8 2.388 x 10⁻⁵ 947.8 0.2778
Megatonne oil 4.1868 x 10⁴ 107 1 3.968 x 10⁷ 11,630(equiv) (Mtoe)Million British 1.0551 x 10 -3 0.252 2.52 x 10⁻⁸ 1 2.931 x 10⁻⁴
thermal units (Mbtu)Gigawatt-hour(GWh) 3.6 860 10 -5 3,412 1
Table G-2: Unit abbreviation
b Billion
bbl Barrel
Btu British Thermal Units
m/s Metre/second
M2 square metre
m3 cubic metre
km2 square kilometre
A Ampere
kVA Kilo Volt-Ampere
Wp Watt peak
kW Kilowatt
kWh Kilowatt-hour
kWh/m2 Kilowatt-hour/square metre
kgoe Kilogrammes oil equivalent
MW Megawatt
MWh Megawatt-hour
GW Gigawatt
t Tonne
Table G-3: Unit prefix
k kilo (103)
M mega (106)
G giga (109)
T Tera (1012)
P Peta (1015)
Energy units, conversion factors and abbreviations
Appendix G:
Figures from IEA. Additional conversion figures available at http://www.iea.org/Textbase/stats/unit.asp

References 145
ReferencesADB (Asian Development Bank). 2005. The Challenges of Higher Oil Prices. Asian Development Outlook.2005 Update. Manila: ADB.
--------. 2006. Asian Development Outlook 2006. Manila: ADB.
--------. 2007. Asian Development Outlook 2007 Manila: ADB.
APERC (Asia Pacific Energy Research Centre). 2000. Emergency Oil Stocks and Energy Security in theAPEC Region. Tokyo: APERC.
--------. 2003. Energy Security Initiative: some aspects of oil security. Tokyo: APERC.
Anderson, M. 1992.‘Hidden fires: improving kitchens and stoves together with users’. Lund University.
Barkat, A., Khan, S.H., Rahman, M., Zaman, S., Poddar, A., Halin, S., Ratna, N.N., Majid, M., Maksud, A.K.M.,Karim, S. and Islam, S. 2002. Economic and Social Impact Evaluation Study of the Rural ElectrificationProgram in Bangladesh. Human Development Research Centre (HDRC), undertaken for NRECAInternational Ltd., partners with the Rural Electrification Board of Bangladesh and USAID for the RuralPower for Poverty Reduction (RPPR) Program. Dhaka: NRECA International Ltd.
BP (British Petroleum). 2005. Statistical Review of World Energy 2005.[http://www.deutschebp.de/genericarticle.do?categoryId=9003692&contentId=7006980] Lastaccessed 25 September 2007.
--------. 2006. Statistical Review of World Energy 2006.[http://www.deutschebp.de/genericarticle.do?categoryId=9003692&contentId=7020393] Lastaccessed 25 September 2007.
--------. 2007. Statistical Review of World Energy 2007.[http://www.bp.com/productlanding.do?categoryId=6848&contentId=7033471] Last accessed 25September 2007.
Cecelski, E. 2002.‘Social Benefits, Constraints, and Participation Strategies’. GEF/FAO Workshop onProductive Uses of Renewable Energy: Experiences, Strategies and Project Development, 18-20 June2002.
Central Intelligence Agency (CIA). 2007. The World Fact Book. 15 March 2007. Washington D.C.: USCentral Intelligence Agency.
Cloin, J. 2007. Liquid Biofuels in Pacific Island Countries. SOPAC Miscellaneous Report 628. Suva:Secretariat of the Pacific Islands Applied Geoscience Commission (SOPAC).
COCO (The Cogeneration Public Company Ltd). 2000. The Evolution of Energy Supply for ThaiIndustries. Bangkok: The Cogeneration Public Company Ltd.
EIA (Energy Information Agency). 2004. International Energy Outlook 2004.[http://tonto.eia.doe.gov/FTPROOT/forecasting/0484(2004).pdf ] Last accessed 27 September 2007.
--------. 2006. International Data.[http://www.eia.doe.gov/emeu/international/contents.html] Last accessed 24 September 2007.
--------. 2007a. Selected Crude Oil Prices.[http://www.eia.doe.gov/pub/international/iealf/table71.xls] Last accessed 24 September 2007. Lastaccessed 24 September 2007.
146 Overcoming Vulnerability to Rising Oil Prices: Options for Asia and the Pacific
--------. 2007b. Petroleum Navigator: World Crude Oil Prices.[http://tonto.eia.doe.gov/dnav/pet/pet_pri_wco_k_w.htm] Last accessed 24 September 2007.
--------. 2007c. Petroleum Navigator: Mont Belvieu, TX Propane Spot Price FOB.[http://tonto.eia.doe.gov/dnav/pet/hist/rprousgM.htm] Last accessed 24 September 2007.
--------. 2007d. International Petroleum (Oil) Consumption Tables. [http://www.eia.doe.gov/emeu/international/oilconsumption.html] Last accessed 24 September 2007.
--------. 2007e. [http://www.eia.doe.gov/emeu/international/Crude1.xls] Last accessed 25 September2007.
Economist Intelligence Unit. 2006. World Energy: EIU’s 2006 Oil Intensity Index.
ENERDATA 2006. [http://www.enerdata.fr/enerdatauk/index.html]
ESMAP (Energy Sector Management Assistance Programme). 2003. Household Energy Use inDeveloping Countries: A Multi-country Study. Joint UNDP/World Bank/ESMAP.
--------. 2005. Potential of Biofuels for Transport in Developing Countries. By Kojima, M. and Johnson,T. Washington D.C.: World Bank/ESMAP. [http://www.esmap.org/filez/pubs/31205BiofuelsforWeb.pdf ]
--------.2006a. Coping with Higher Oil Prices. By Bacon, R. and Kojima, M.Washington D.C.:The World Bank.
--------. 2006b. ‘Phasing out Subsidies: Recent experiences with fuel in developing countries’. By Bacon,R. and Kojima, M. In Public Policy for the Private Sector, Note Number 310, August 2006. Washington,D.C.: The World Bank Group.
FAO (Food and Agriculture Organization of the United Nations). 2006. FAO-UNEP-GEF ProjectProposal: Bioenergy for Heat Applications to Reduce GHG Emissions. Bangkok: FAO/RAP. (Unpublished)
Fusaro, P. 2003. 'Why Oil Trading and Paper Markets are Different in Asia Pacific’.[http://www.global-change.com/articles/asianoil.pdf ] Last accessed 1 February 2007.
Giragosian, R. 2004. 'East Asia Tackles Energy Security’. August 2004.[http://www.atimes.com/atimes/Asian_Economy/FH24Dk01.html]
Goldemberg, J. and Johansson, T.B. , editors. 1995. Energy as an Instrument for Socio-EconomicDevelopment. New York: United Nations Development Programme.
GTZ (Deutsche Geshellschaft fur Technische Zusammenarbeit). 2005. International Fuel Prices 2005.
--------. 2007. International Fuel Prices 2007. Fifth Edition - More than 170 countries.[www.gtz.de/de/dokumente/en-international-fuelprices-part1-2007.pdf ]
Heruela, C. 2001.‘Bioenergy Opportunities in Developing Countries’. Paper presented in InternationalWorkshop on Implementation Strategies for Biomass Utilization in Europe & Developing Countries,19-21 November 2001, Eskilstuna, Sweden. (Unpublished)
ICF (ICF Consulting). 2005. The Emerging Oil Refinery Capacity Crunch: a global clean products outlook.[http://wwwicfconsultingcom/Markets/Energy/Marketing/refinery-capacity.pdf ] Last accessed 16January 2006.
IEA (International Energy Agency). 2002a. World Energy Outlook. Paris: IEA.
--------. 2002b. Energy Prices and Taxes. Quarterly Statistics. Paris: IEA.
References 147
--------. 2003. Renewables for Power Generation - Status and Prospects. Paris: IEA.[www.iea.org/textbase/nppdf/free/2000/renewpower_2003.pdf ]
--------. 2004a. Analysis of the Impact of High Oil Prices on the Global Economy. USA: IEA.
--------. 2004b. World Energy Outlook. Paris: IEA.[http://www.iea.org/textbase/nppdf/free/2004/weo2004.pdf ] Last accessed 27 September 2007.
--------. 2006. Energy Prices and Taxes. Quarterly Statistics. Paris: IEA.
--------. 2007a. Energy Statistics. [www.iea.org] Last accessed 15 August 2007.
--------. 2007b. Renewables in Global Energy Supply: An IEA Fact Sheet, January, pages 9-10. Paris: IEA.[http://www.iea.org/textbase/papers/2006/renewable_factsheet.pdf ]
--------. 2007c. Good Practice Guidelines: Bioenergy Project Development & Biomass Supply. Paris: IEA.[http://www.iea.org/textbase/nppdf/free/2007/biomass.pdf ]
IMF (International Monetary Fund). 2000. World Economic Outlook Database. September 2000 edition.Washington D.C.: IMF.
--------. 2003.‘Real and Distributive Effects of Petroleum Price Liberalization: The Case of Indonesia’. ByClements, B., Jung, H. and Gupta, S. IMF working paper. (WP/03/204).[http://lnweb18.worldbank.org/ESSD/sdvext.nsf/81ByDocName/RealandDistributiveEffectsofPetrleumPriceLiberalizationthecaseofIndonesia/$FILE/IMF+Working+Paper+Petrol+Price+Lib,+Clements+Oct+03.pdf#search=%22petroleum%20pricing%20and%20taxation%20in%20Indonesia%22]. Last accessed 4 September 2006.
--------. 2005.‘Will the Oil Market Continue to Be Tight?’. World Economic Outlook. Globalization andExternal Imbalances, Chapter IV. April 2005.[http://www.imf.org/external/pubs/ft/weo/2005/01/pdf/chapter4.pdf ]
--------. 2006a.‘World Crude Oil Markets: monetary policy and the recent oil shock’. IMF working paper(WP/06/62), African Department. Washington D.C.: IMF.
--------. 2006b. World Economic Outlook Data Base. September 2006 edition. Washington D.C.: IMF.
--------. 2006c. International Financial Statistic July 2006. Washington D.C.: IMF.
--------. 2006d.‘The Magnitude and Distribution of Fuel Subsidies: evidence from Bolivia, Ghana, Jordan,Mali and Sri Lanka’. By Coady, D., El-Said, M., Gillingham, R., Kpodar, K., Medas, P. and Newhouse, D. IMFWorking Paper WP/06/247.
--------. 2007. Time Series Data on International Reserves and Foreign Currency Liquidity: Official ReserveAssets. Washington D.C.: IMF.
Koyama, K. 2005. The Recent High Oil Price: Its background and future prospects, Executive Summary.Japan: Energy Strategy Unit, Institute of Energy Economics.
Liu, H. 1992.‘We have never felt so enjoyable to cook’. Boiling Point 27. April 1992.
Mahat, I. 2004.‘Implementation of Alternative Energy Technologies in Nepal: Towards theAchievement of Sustainable Livelihoods’. Energy for Sustainable Development 8(2): 9-16.
Matly, M. 2003. Rural electrification in Indonesia and Sri Lanka: From social analysis to reform of thepower sector. International Bank for Reconstruction and Development/The World Bank.
Mande, S. 2005.‘Bioenergy for Heating Applications’. Background document prepared for FAO SecondExperts Group Meeting on Bioenergy for Heating Applications, 29 August to 1 September 2005. NewDelhi, India: TERI-RETREAT. (Unpublished)
Modi, V.S. 2005.‘Energy Services for the Poor’. Paper commissioned by the UN Millennium Project TaskForce. New York: Earth Institute, Columbia University.[ http://www.unmillenniumproject.org/documents/MDGEnergyPaper.pdf ]
Modi, V. S., McDade, D., Lallement and Saghir, J. 2005. Energy Services for the Millennium DevelopmentGoals. ESMAP, UNDP, UN Millennium Project, and World Bank.
OECD/IEA (Organisation for Economic Co-operation and Development/International Energy Agency).2004. World Energy Outlook 2004. France: OECD/IEA.
Oelert, G., Auer, F., Pertz, K., Lepp, A. and Lowe, P. 1987. Economic Issues of Renewable Energy System -AGuide to Project Planning. Eschborn: GTZ.
Palz, W. 2006.‘The Challenge of Renewable Energy Market Deployment’. March 2006.[http://www.wcre.de/en/index.php?option=com_content&task=view&id=59&Itemid=17] Lastaccessed 26 September 2007.
PREM. 2005.‘Preliminary Estimates of the Financing, Growth, and Poverty Implications of the OilShock on Developing Nation’. Note prepared by PREM. Washington D.C.: The World Bank.
Ramani, K. V. 2003.‘Evaluation of Poverty Alleviation Impacts of MMS Options for DecentralizedRenewable Electricity Systems’. Analysis of the Feasibility of Decentralised Renewable Electricity into aMandated Market Share Mechanism. For the World Bank and UK Department for InternationalDevelopment. Petten: Energy Research Centre of the Netherlands.
REN21 (Renewable Energy Policy Network for the 21st Century). 2006a. Renewable Energy GlobalStatus Report 2006 Update. Paris: REN21 Secretariat and Washington D.C.: World Watch Institute.[http://www.ren21.net/pdf/RE_GSR_2006_Update.pdf ]
--------. 2006b. Energy for Development: The Potential of Renewable Energy for Meeting the MDGs. Paris:REN21 Secretariat. [http://www.ren21.net/pdf/REN21Report%20RETs%20for%20MDGs.pdf ]
Sawin, J. 2004. 'Mainstreaming Renewable Energy in the 21st Century'. Worldwatch Paper 169.Washington D.C.: Worldwatch Institute.
Sakhuja, V. 2005. 'A regional approach to strategic oil reserves?'. December 2005. [http://www.opin-ionasia.org/Aregionalapproachtostrategicoilreserves]
UNCTAD (United Nations Conference On Trade And Development). 2006. The Exposure of AfricanGovernments to the Volatility of International Oil Prices and What to do about it. AU ExtraordinaryConference of Ministers of Trade on African Commodities, Arusha, Tanzania, 21-24 November 2005.Geneva: UNCTAD.
UNDESA (United Nations Department of Economic and Social Affairs). 2002. World UrbanizationProspects: The 2001 Revision Data Tables and Highlights. New York: UNDESA.
--------. 2005. Increasing Global Renewable Energy Market: Recent Trends and Perspectives: BackgroundReport. Beijing International Renewable Energy Conference. New York: UNDESA.[http://www.un.org/esa/sustdev/sdissues/energy/op/beijing_re_egm/beijing_re_report.pdf ]
Overcoming Vulnerability to Rising Oil Prices: Options for Asia and the Pacific148

References 149
UNDP (United Nations Development Programme). 2003. Human Development Report 2003.[http://hdr.undp.org/reports/global/2003/]
--------. 2005. Regional Energy Programme for Poverty Reduction. Pacific Rapid Assessment and GapAnalysis. Final Report. Bangkok. (Unpublished)
--------. 2006. Human Development Report 2006. [http://hdr.undp.org/hdr2006/]
UN-Energy 2005. The Energy Challenge for Achieving the Millennium Development Goals.[http://esa.un.org/un-energy/pdf/UN-ENRG%20paper.pdf ][http://www.unhabitat.org/downloads/docs/920_88725_The%20Energy%20challenge%20for%20achieving%20the%20millenium%20development%20goals.pdf ]
UNEP Risoe 2007. CDM/JI Pipeline Analysis and Database. [http://cdmpipeline.org/] Last accessed 24September 2007.
UNESCAP (United Nations Economic and Social Commission for Asia and the Pacific). 2003. Guidelineson the Integration of Energy and Rural Development Policies and Programmes. Bangkok: UNESCAP.
--------. 2005. Millennium Development Goals Report 2005. Bangkok: UNESCAP.
--------. 2006. Economic and Social Survey of Asia and the Pacific 2006 - Energizing the global economy.Bangkok: UNESCAP.
--------. 2007. Economic and Social Survey of Asia and the Pacific 2007. Bangkok: UNESCAP.
UNFCCC (United Nations Framework Convention on Climate Change) 2007. CDM Registration.[http://cdm.unfccc.int/Statistics/Registration/RegisteredProjByScopePieChart.html] Last accessedJuly 2007.
USAID (United States Agency for International Development). 2007. From Ideas to Action. Clean EnergySolutions for Asia to Address Climate Change. Bangkok: USAID.
Verleger, P. K. Jr. 2005.‘Energy: a gathering storm?’. The United States and the World Economy: ForeignEconomic Policy for the Next Decade. Edited by Bergsten, C.F. and the Institute for InternationalEconomics, pp 209-246, Chapter 7. Washington D.C.. [http://www.iie.com/publications/chapters_pre-view/388/7iie3802pdf ]
World Bank. 2005a. World Development Indicators 2005. CD-rom. Washington D.C.: The World Bank.
--------. 2005b. Technical and Economic Assessment: Off-Grid, Mini-Grid and Grid ElectrificationTechnologies. Washington D.C.: The World Bank Energy Unit, Energy & Water Department.[http://iris37.worldbank.org/domdoc/PRD/Other/PRDDContainer.nsf/WB_ViewAttachments?ReadForm&ID=85256D2400766CC7852570FF007CE78D&]
--------. 2006. World Development Indicators 2006. CD-rom. Washington D.C.: The World Bank.
--------. 2007a. Understanding Poverty in Indonesia/Poverty Dianostics. The Indonesia Poverty AnalysisProgram Web Site. Washington D.C.: The World Bank. [http://indopov.org/poverty.html]
--------. 2007b. World Development Indicators 2007. [www.worldbank.org]
WTO. (World Trade Organization). 2007 Statistics Database. Geneva: World Trade Organization.
WWI (Worldwatch Institute). 2006. Biofuels for Transportation: Global Potential and Implications forSustainable Agriculture and Energy in 21st Century. Washington D.C.: WWI.