Embed Size (px)
Citation preview

Oracle White Paper— Overcoming the Management Challenges of Portal, SOA, and Java EE Applications
An Oracle White Paper
April 2010
Overcoming the Management Challenges of Portal, SOA, and Java EE Applications
Oracle White Paper— Overcoming the Management Challenges of Portal, SOA, and Java EE Applications
Disclaimer
The following is intended to outline our general product direction. It is intended for information
purposes only, and may not be incorporated into any contract. It is not a commitment to deliver
any material, code, or functionality, and should not be relied upon in making purchasing
decisions. The development, release, and timing of any features or functionality described for
Oracle’s products remains at the sole discretion of Oracle.
Oracle White Paper— Overcoming the Management Challenges of Portal, SOA, and Java EE Applications
Executive Overview ............................ Error! Bookmark not defined.
Introduction ........................................ Error! Bookmark not defined.
Increasing Complexity of Composite ApplicationsError! Bookmark not defined.
Intelligent Application Performance ManagementError! Bookmark not defined.
Service-Oriented Views Across Heterogeneous EnvironmentsError! Bookmark not defined.
Minimized Involvement from Java EE ExpertsError! Bookmark not defined.
Eliminate Repetitive Do-It-Yourself Manual ProcessesError! Bookmark not defined.
Conclusion ......................................... Error! Bookmark not defined.
Oracle White Paper— Overcoming the Management Challenges of Portal, SOA, and Java EE Applications
4
INTRODUCTION
For several years, industry analysts have highlighted the advantages of composite applications and, at
the same time, pointed out various challenges that information technology (IT) organizations must
overcome to reap the benefits. The business benefits—such as improved responsiveness to business
change (or flexibility), the use of resources, and cost savings—have prompted IT executives to invest in
this new type of development paradigm. However, unresolved challenges, like a lack of expertise,
increased complexity, and immature management tools significantly increase the risks associated with
these projects.
As IT organizations roll out their first generation composite applications into production, they will
quickly recognize that a lack of expertise, tools, and methodologies are preventing them from properly
managing their composite applications and complex software infrastructure.
UNDERSTANDING THE MANAGEMENT CHALLENGES FOR
SOA-BASED COMPOSITE APPLICATIONS
The loosely coupled nature of SOA lets IT organizations combine new code with existing applications
to develop composite applications that can respond quickly to changes in the business. With SOA,
existing software modules or applications are encapsulated and exposed publicly as services. Composite
application developers then use these services to create new applications. Unfortunately, this shift in
the application development paradigm also creates new management challenges.
The three most significant of these management challenges are:
How can organizations deal with the changes and increased complexity of composite
applications and SOA infrastructures?
How can organizations accurately characterize application performance so they can monitor
production 24/7?
How can organizations quickly diagnose and resolve problems?
This white paper highlights the management challenges of SOA-based composite applications, explains
why conventional management approaches do not properly address these challenges, and highlights
Oracle’s unique approach to meeting these challenges.
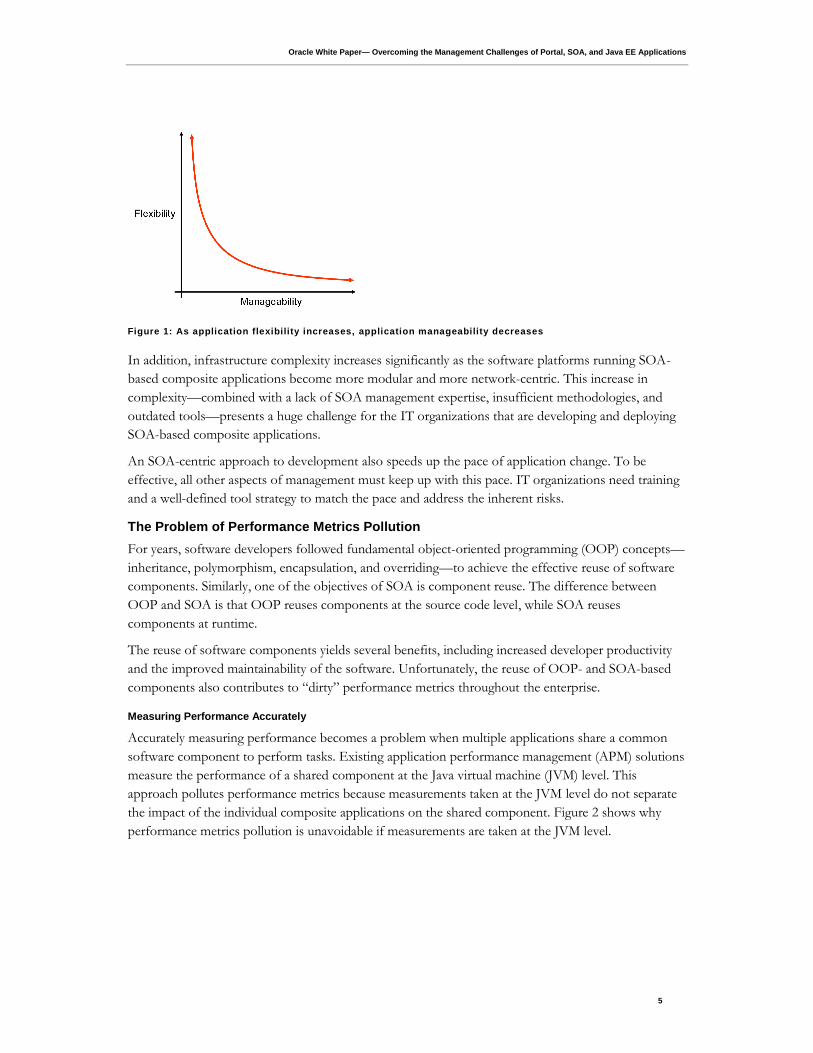
The Correlation Between Flexibility and Manageability
There is an inherent inverse correlation between flexibility and manageability. For example, as an
automobile company increases the number of options offered on its vehicles, the difficulty associated
with managing the inventory and manufacturing process increases. The same logic applies to SOA-
based composite applications: as IT organizations adopt technology platforms and develop paradigms
to gain agility, managing the SOA-based composite applications becomes increasingly difficult.
Oracle White Paper— Overcoming the Management Challenges of Portal, SOA, and Java EE Applications
5
Figure 1: As application flexibility increases, application manageability decreases
In addition, infrastructure complexity increases significantly as the software platforms running SOA-
based composite applications become more modular and more network-centric. This increase in
complexity—combined with a lack of SOA management expertise, insufficient methodologies, and
outdated tools—presents a huge challenge for the IT organizations that are developing and deploying
SOA-based composite applications.
An SOA-centric approach to development also speeds up the pace of application change. To be
effective, all other aspects of management must keep up with this pace. IT organizations need training
and a well-defined tool strategy to match the pace and address the inherent risks.
The Problem of Performance Metrics Pollution
For years, software developers followed fundamental object-oriented programming (OOP) concepts—
inheritance, polymorphism, encapsulation, and overriding—to achieve the effective reuse of software
components. Similarly, one of the objectives of SOA is component reuse. The difference between
OOP and SOA is that OOP reuses components at the source code level, while SOA reuses
components at runtime.
The reuse of software components yields several benefits, including increased developer productivity
and the improved maintainability of the software. Unfortunately, the reuse of OOP- and SOA-based
components also contributes to “dirty” performance metrics throughout the enterprise.
Measuring Performance Accurately
Accurately measuring performance becomes a problem when multiple applications share a common
software component to perform tasks. Existing application performance management (APM) solutions
measure the performance of a shared component at the Java virtual machine (JVM) level. This
approach pollutes performance metrics because measurements taken at the JVM level do not separate
the impact of the individual composite applications on the shared component. Figure 2 shows why
performance metrics pollution is unavoidable if measurements are taken at the JVM level.
Oracle White Paper— Overcoming the Management Challenges of Portal, SOA, and Java EE Applications
6
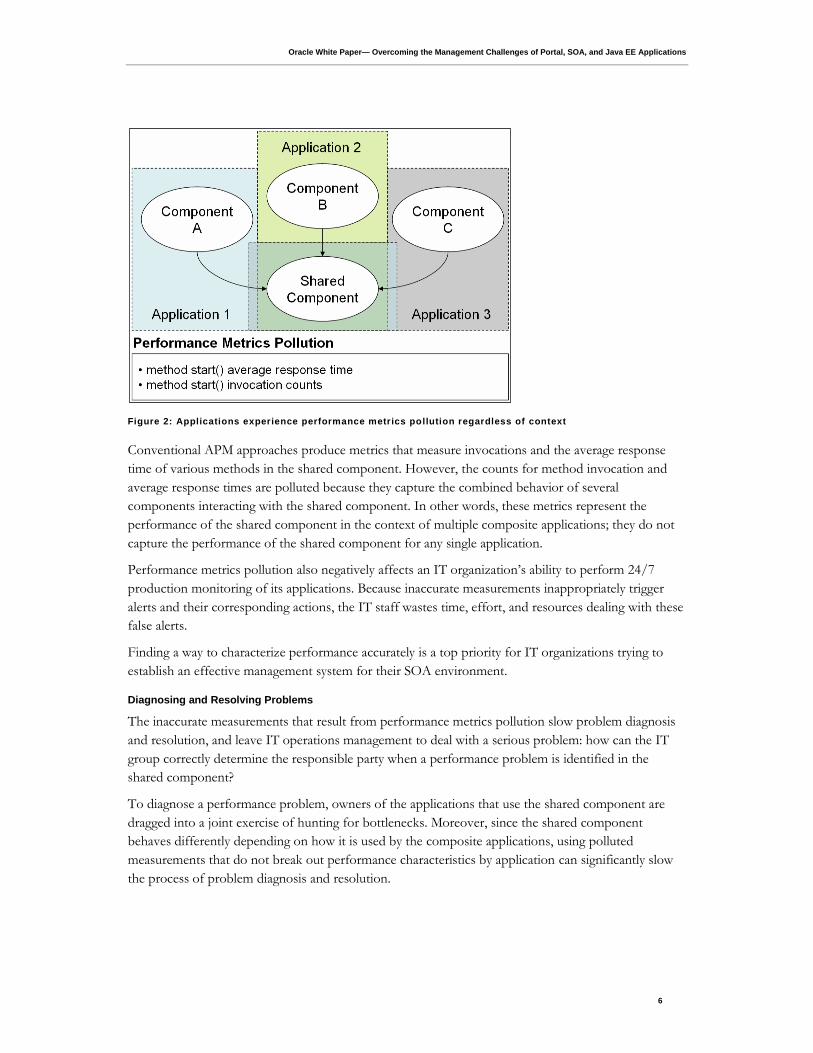
Figure 2: Applications experience performance metrics pollution regardless of context
Conventional APM approaches produce metrics that measure invocations and the average response
time of various methods in the shared component. However, the counts for method invocation and
average response times are polluted because they capture the combined behavior of several
components interacting with the shared component. In other words, these metrics represent the
performance of the shared component in the context of multiple composite applications; they do not
capture the performance of the shared component for any single application.
Performance metrics pollution also negatively affects an IT organization’s ability to perform 24/7
production monitoring of its applications. Because inaccurate measurements inappropriately trigger
alerts and their corresponding actions, the IT staff wastes time, effort, and resources dealing with these
false alerts.
Finding a way to characterize performance accurately is a top priority for IT organizations trying to
establish an effective management system for their SOA environment.
Diagnosing and Resolving Problems
The inaccurate measurements that result from performance metrics pollution slow problem diagnosis
and resolution, and leave IT operations management to deal with a serious problem: how can the IT
group correctly determine the responsible party when a performance problem is identified in the
shared component?
To diagnose a performance problem, owners of the applications that use the shared component are
dragged into a joint exercise of hunting for bottlenecks. Moreover, since the shared component
behaves differently depending on how it is used by the composite applications, using polluted
measurements that do not break out performance characteristics by application can significantly slow
the process of problem diagnosis and resolution.

Oracle White Paper— Overcoming the Management Challenges of Portal, SOA, and Java EE Applications
7
Eliminating performance metrics pollution and getting accurate performance measurements in the
context of specific-calling composite applications are key to diagnosing and resolving problems quickly.
ADDRESSING MANAGEMENT CHALLENGES WITH CONVENTIONAL APPROACHES
Conventional approaches to APM—such as source code (hand) instrumentation and byte code
instrumentation—cannot completely address the management challenges of SOA-based composite
applications. Unfortunately, conventional manual approaches are also problematic; they are slow and
cannot keep up with the pace of changing business needs.
The limitations of conventional APM solutions mean that the process of implementing and
maintaining an effective APM environment remains a manual process. This also means that IT
organizations must do all APM tasks—including determining relevant performance metrics, deriving
useful information, creating operational dashboards, and entering context relationships—manually.
Many of these activities involve participation from multiple functional groups, requiring significant
investment and coordination. In short, the manual APM process is labor intensive, time consuming,
and error prone.
When using conventional APM approaches, IT organizations must ask the following questions:
Is it possible that some critical metrics were not captured in this process?
Can the manual APM process keep up with the pace of application change?
What happens if the APM process is not followed completely?
To maintain an effective APM system, IT organizations must follow the manual process completely,
and then continue to make modifications to the environment when changes occur to the SOA
infrastructure or composite applications. A breakdown anywhere in the manual APM process affects
the entire system. One consequence of this breakdown is that the IT group will not be able to monitor
an application’s performance in production. A more common and more serious consequence is the
increase in calls from end users complaining about the unacceptable availability and performance of an
application. These calls—symptoms of an ineffective APM system—indicate that the application is
negatively affecting your business. Unfortunately, it is impossible to eliminate the calls without
spending significant time, money, and resources to resolve the problem.
Addressing Performance Metrics Pollution
Conventional methods of APM fail to address performance metrics pollution. Before measuring the
performance of shared components, polluted performance metrics must be “purified” with additional
contextual information. The goal is to provide metrics that will accurately measure the performance of
shared components in the context of the various composite applications.
With some conventional purification processes, users must manually specify contextual relationships
between the applications and the performance metrics in the shared components. However, a manual
approach can be both inefficient and error-prone.
Other conventional purification approaches automatically inject performance metrics into the Java
Platform, Enterprise Edition (Java EE) application-centric archive files (enterprise archive (EAR), Web
archive (WAR), and Java archive (JAR) files) at the contextual information level. While this approach

Oracle White Paper— Overcoming the Management Challenges of Portal, SOA, and Java EE Applications
8
has its merits, it lacks the ability to capture contextual information from an SOA-centric point of view.
For example, this approach cannot accurately capture the context of a composite application involving
multiple WARs and EARs.
Even though this conventional purification approach associates some contextual information with
various performance metrics, the metrics are still inaccurate because they lack comprehensive
contextual information.

Oracle White Paper— Overcoming the Management Challenges of Portal, SOA, and Java EE Applications
9
In addition, conventional methods do not adequately address the 24/7 production monitoring issues.
Since polluted performance metrics characterize the behaviors of shared components in the context of
multiple applications, it is extremely difficult to determine how to set performance thresholds
appropriately. Too often, the lowest possible values are used as thresholds for polluted performance
metrics. This results in many false alarms and leads to inefficient performance. As a result, setting low
performance thresholds for polluted metrics only monitors ineffectiveness.
This problem is highlighted in Figure 3. In this example, the user is forced to set a high threshold
based on a single polluted performance metric. Since there is no way to break out performance
measurements of the shared component by specific application context, users must use the lowest
possible value—in this case, the threshold value for Application 1.
Figure 3: Using the lowest threshold value on polluted metrics increases the risk of
false alarms
Setting the performance threshold low enough to accommodate all applications creates excessive false
alarms. The false alarms are not specific enough to alert the responsible team, and—because a single
polluted performance metric measures the performance of a component in the context of multiple
applications—all application owners are alerted. This approach is highly ineffective and creates an
unnecessary drain on resources.
A NEW APPROACH TO MANAGING COMPOSITE APPLICATIONS
As explained in the previous section, conventional methods do not eliminate performance metrics
pollution. As a result, IT organizations using conventional approaches to manage SOA-based
composite applications will have to address the issue of using polluted performance measurements to
diagnose and resolve problems. Because measurements collected using conventional approaches do
not properly break out performance behavior, this is not the best approach for managing complex,
ever-changing, SOA-based composite applications.
Until recently, no tool has properly addressed the management challenges of SOA-based composite
applications. Oracle Enterprise Manager is a next-generation APM tool designed from the ground up
to address these challenges. The APM process automation in Oracle Enterprise Manager and its ability

Oracle White Paper— Overcoming the Management Challenges of Portal, SOA, and Java EE Applications
10
to collect performance measurements in the context of specific composite applications make it the best
management solution for SOA-based composite applications.
To overcome SOA management challenges, Oracle Enterprise Manager uses semantic modeling as its
core technology. This patent-pending technology automatically analyzes SOA-based composite
applications, gains architectural insights, and creates semantic models to capture these insights. The
semantic models—sometimes referred to as “application blueprints”—enable Oracle Enterprise
Manager to select performance metrics automatically, and then appropriately track contextual
relationships among software components and composite applications. The use of semantic modeling
significantly differentiates Oracle Enterprise Manager from conventional APM solutions.
Automating Manageability and Improving Performance
Oracle Enterprise Manager’s automatic approach requires significantly less time and effort to set up
and maintain than do conventional methods. Automation also eliminates many errors associated with
manual processes. Breakthrough technology lets Oracle Enterprise Manager automatically gain insights
into the structure of deployed applications. With this knowledge, Oracle Enterprise Manager can
automate the following APM activities:
Gain visibility
Select relevant metrics
Derive useful information
Track contextual relationships
The following table shows a side-by-side comparison between the manual and automated APM
approaches to 24/7 monitoring.

Oracle White Paper— Overcoming the Management Challenges of Portal, SOA, and Java EE Applications
11
Key APM Activity Manual Approach Automated Approach
Select relevant performance metrics.
Requires outside consultants and customer resources to determine what to monitor.
ORACLE ENTERPRISE MANAGER automatically discovers and analyzes the application to figure out what to monitor.
Derive useful information. Must use low-level technology metrics to calculate high-level functional metrics. This is very difficult and sometimes impossible.
ORACLE ENTERPRISE MANAGER is designed to collect both technology and functional metrics. No manual calculation is needed.
Map context relationships between software services and composite applications.
Requires hand mapping of contextual relationships using a tool. Not able to capture all relationships.
ORACLE ENTERPRISE MANAGER understands the make- up of composite applications and automatically keeps track of contextual relationships.
Define and monitor service-level objectives (SLOs) at correct levels.
Thresholds can only be set for technology metrics.
ORACLE ENTERPRISE MANAGER allows threshold settings for both technology and functional metrics.
Maintain monitoring environment.
To keep pace with business changes, a significant amount of maintenance work is needed to keep the APM system up to date.
ORACLE ENTERPRISE MANAGER automatically updates the monitoring environment as it continuously discovers changes to existing applications and deployments of new applications.
Oracle’s unique drill-down application modeling technology lets IT organizations automatically
establish and maintain an effective environment for monitoring application performance. This essential
automation enables management systems to keep pace with the rapid changes associated with SOA-
based composite applications.
Solving the Problem of Performance Metrics Pollution
Solving the problem of performance metrics pollution requires an entirely different approach to metric
selection and collection. Oracle Enterprise Manager’s next-generation approach uses a semantic model
to determine contextual relationships and uses built-in performance metrics purification mechanisms
to purify the metrics. As the performance of shared components is measured, the context of the calling
application is added at the same time. The resulting metrics provide an accurate measurement of
performance in the context of appropriate calling composite applications.
Oracle White Paper— Overcoming the Management Challenges of Portal, SOA, and Java EE Applications
12
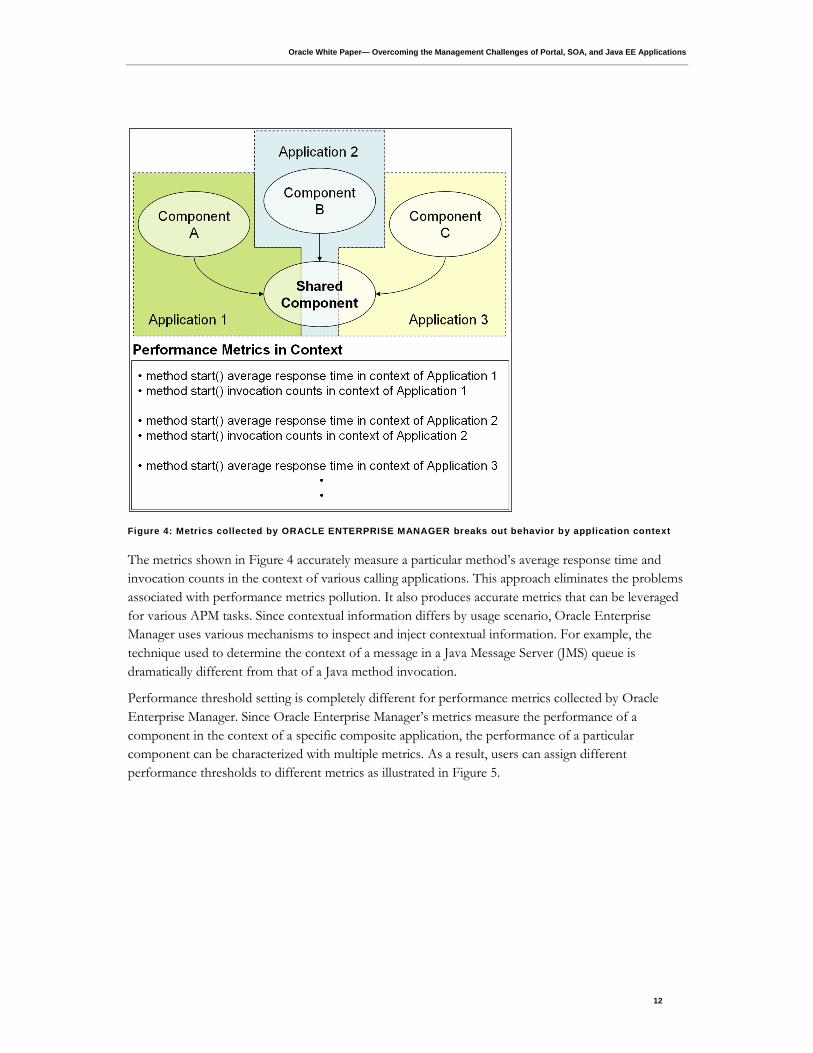
Figure 4: Metrics collected by ORACLE ENTERPRISE MANAGER breaks out behavior by application context
The metrics shown in Figure 4 accurately measure a particular method’s average response time and
invocation counts in the context of various calling applications. This approach eliminates the problems
associated with performance metrics pollution. It also produces accurate metrics that can be leveraged
for various APM tasks. Since contextual information differs by usage scenario, Oracle Enterprise
Manager uses various mechanisms to inspect and inject contextual information. For example, the
technique used to determine the context of a message in a Java Message Server (JMS) queue is
dramatically different from that of a Java method invocation.
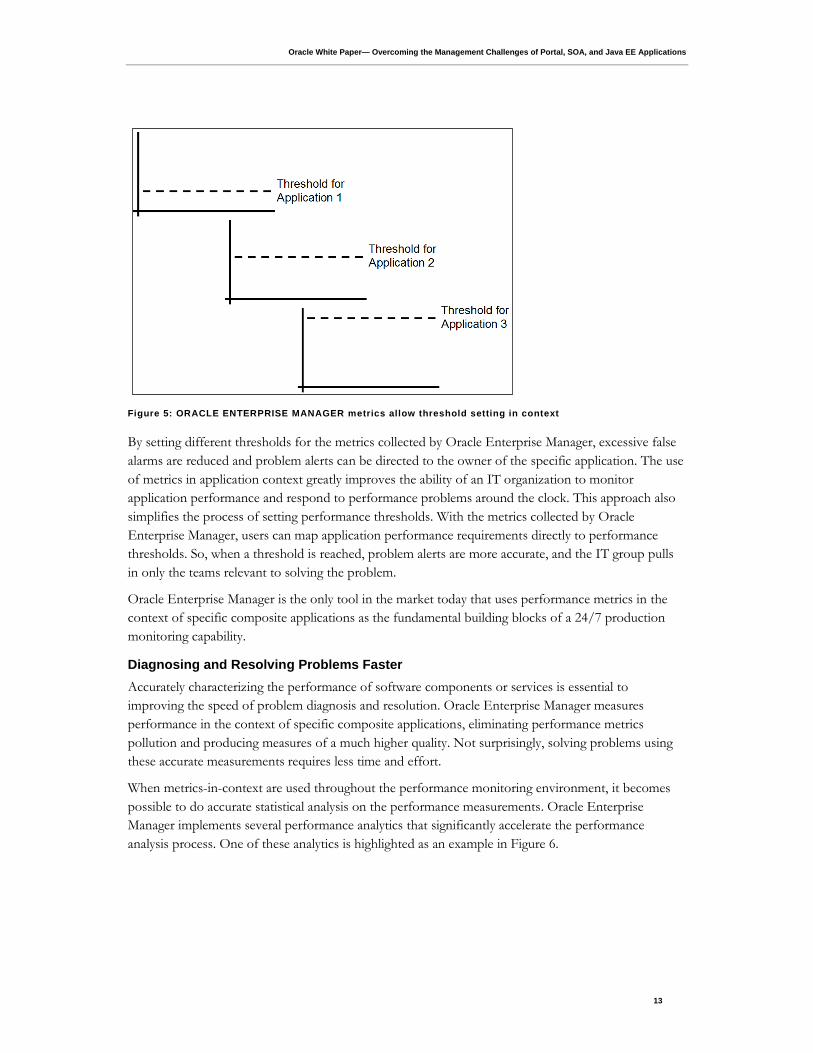
Performance threshold setting is completely different for performance metrics collected by Oracle
Enterprise Manager. Since Oracle Enterprise Manager’s metrics measure the performance of a
component in the context of a specific composite application, the performance of a particular
component can be characterized with multiple metrics. As a result, users can assign different
performance thresholds to different metrics as illustrated in Figure 5.
Oracle White Paper— Overcoming the Management Challenges of Portal, SOA, and Java EE Applications
13
Figure 5: ORACLE ENTERPRISE MANAGER metrics allow threshold setting in context
By setting different thresholds for the metrics collected by Oracle Enterprise Manager, excessive false
alarms are reduced and problem alerts can be directed to the owner of the specific application. The use
of metrics in application context greatly improves the ability of an IT organization to monitor
application performance and respond to performance problems around the clock. This approach also
simplifies the process of setting performance thresholds. With the metrics collected by Oracle
Enterprise Manager, users can map application performance requirements directly to performance
thresholds. So, when a threshold is reached, problem alerts are more accurate, and the IT group pulls
in only the teams relevant to solving the problem.
Oracle Enterprise Manager is the only tool in the market today that uses performance metrics in the
context of specific composite applications as the fundamental building blocks of a 24/7 production
monitoring capability.
Diagnosing and Resolving Problems Faster
Accurately characterizing the performance of software components or services is essential to
improving the speed of problem diagnosis and resolution. Oracle Enterprise Manager measures
performance in the context of specific composite applications, eliminating performance metrics
pollution and producing measures of a much higher quality. Not surprisingly, solving problems using
these accurate measurements requires less time and effort.
When metrics-in-context are used throughout the performance monitoring environment, it becomes
possible to do accurate statistical analysis on the performance measurements. Oracle Enterprise
Manager implements several performance analytics that significantly accelerate the performance
analysis process. One of these analytics is highlighted as an example in Figure 6.
Oracle White Paper— Overcoming the Management Challenges of Portal, SOA, and Java EE Applications
14
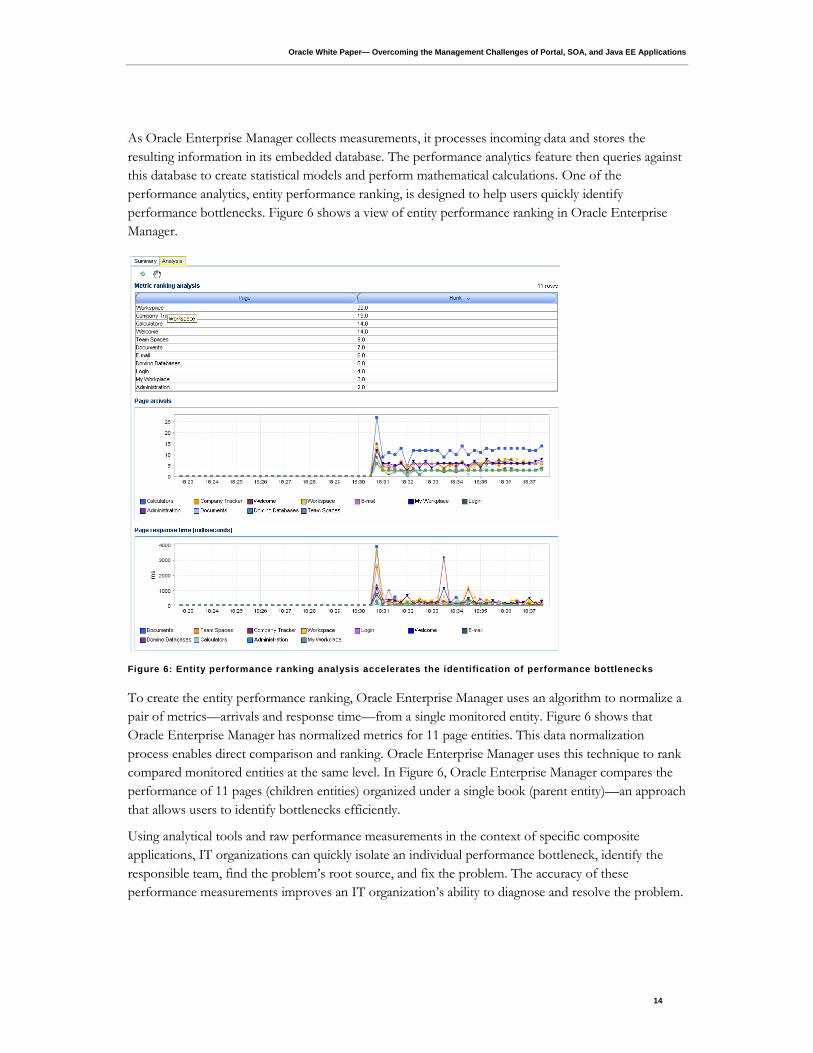
As Oracle Enterprise Manager collects measurements, it processes incoming data and stores the
resulting information in its embedded database. The performance analytics feature then queries against
this database to create statistical models and perform mathematical calculations. One of the
performance analytics, entity performance ranking, is designed to help users quickly identify
performance bottlenecks. Figure 6 shows a view of entity performance ranking in Oracle Enterprise
Manager.
Figure 6: Entity performance ranking analysis accelerates the identification of performance bottlenecks
To create the entity performance ranking, Oracle Enterprise Manager uses an algorithm to normalize a
pair of metrics—arrivals and response time—from a single monitored entity. Figure 6 shows that
Oracle Enterprise Manager has normalized metrics for 11 page entities. This data normalization
process enables direct comparison and ranking. Oracle Enterprise Manager uses this technique to rank
compared monitored entities at the same level. In Figure 6, Oracle Enterprise Manager compares the
performance of 11 pages (children entities) organized under a single book (parent entity)—an approach
that allows users to identify bottlenecks efficiently.
Using analytical tools and raw performance measurements in the context of specific composite
applications, IT organizations can quickly isolate an individual performance bottleneck, identify the
responsible team, find the problem’s root source, and fix the problem. The accuracy of these
performance measurements improves an IT organization’s ability to diagnose and resolve the problem.
Oracle White Paper— Overcoming the Management Challenges of Portal, SOA, and Java EE Applications
15
CONCLUSION
To realize the business benefits of SOA-based composite applications, IT organizations must address a
variety of management challenges that come with this new development paradigm. SOA-based
composite applications present three significant challenges:
Dealing with change and complexity
Accurately measuring and monitoring applications
Quickly diagnosing and resolving problems
Conventional approaches to managing applications cannot properly address these challenges with their
inefficient manual processes and polluted performance metrics. A new generation of APM solutions is
needed for SOA-based composite applications.
Oracle Enterprise Manager is a next-generation solution designed to handle the complexity and pace of
change involved with a powerful new generation of SOA applications. Oracle Enterprise Manager’s
automated setup and maintenance of the 24/7 application monitoring environment helps IT
organizations address the complexity of SOA systems. This unprecedented automation also addresses
the lack of expertise and methodologies available today for managing SOA-based composite
applications. In addition, the ability of Oracle Enterprise Manager to measure performance in the
context of various composite applications provides significantly improved performance metrics. This
helps IT organizations diagnose and resolve problems faster and lets them manage their composite
application environment more effectively.
As IT organizations transition to SOA-based composite applications, they must consider the
management challenges that accompany the move. Those who are serious about SOA must consider
Oracle Enterprise Manager as a solution for successfully managing the performance and availability of
their composite applications.

Overcoming the Management Challenges of
Portal, SOA, and Java EE Applications
April 2010
Oracle Corporation
World Headquarters
500 Oracle Parkway
Redwood Shores, CA 94065
U.S.A.
Worldwide Inquiries:
Phone: +1.650.506.7000
Fax: +1.650.506.7200
oracle.com
Copyright © 2010, Oracle and/or its affiliates. All rights reserved.
This document is provided for information purposes only and the contents hereof are subject to change without notice. This
document is not warranted to be error-free, nor subject to any other warranties or conditions, whether expressed orally or implied in
law, including implied warranties and conditions of merchantability or fitness for a particular purpose. We specifically disclaim any
liability with respect to this document and no contractual obligations are formed either directly or indirectly by this document. This
document may not be reproduced or transmitted in any form or by any means, electronic or mechanical, for any purpose, without our
prior written permission.
Oracle and Java are registered trademarks of Oracle and/or its affiliates. Other names may be trademarks of their respective
owners.
AMD, Opteron, the AMD logo, and the AMD Opteron logo are trademarks or registered trademarks of Advanced Micro Devices. Intel
and Intel Xeon are trademarks or registered trademarks of Intel Corporation. All SPARC trademarks are used under license and are
trademarks or registered trademarks of SPARC International, Inc. UNIX is a registered trademark licensed through X/Open
Company, Ltd. 0110