Embed Size (px)
Citation preview

Overcoming the Improvement Paradox
Elizabeth K. Keating1
Rogelio Oliva2
Nelson P. Repenning1
Scott Rockart1
John D. Sterman1
European Management Journal , Vol. 17, No. 2, pp. 120-134, 1999
This work has been supported by the National Science Foundation (Grant SBR-9422228),Analog Devices, AT&T, Ford Motor Company, Harley-Davidson, Lucent Technologies Inc., and
National Semiconductor Corporation. We are grateful to the people of these firms for theiroutstanding help in this research. They generously provided financial support, their data and
considerable amounts of their most precious resource – their time.
Please direct correspondence to John Sterman, MIT Sloan School of Management, CambridgeMA 02142 or [email protected]. Further information is available throughhttp://web.mit.edu/jsterman/www.
1 MIT Sloan School of Management, Cambridge, MA2 Harvard Business School, Boston, MA
Abstract
Despite the demonstrated benefits of improvement programs such as total quality management
and reengineering, most improvement programs end in failure. Companies have found it
extremely difficult to sustain even initially successful process improvement programs. Even
more puzzling, successful improvement programs sometimes worsen business performance,
triggering layoffs, low morale, and the collapse of commitment to continuous improvement. We
term this phenomenon the “Improvement Paradox.” For the last four years, we have worked with
a variety of firms to understand the paradox and design policies to overcome it. Our findings
suggest that the inability to manage an improvement program as a dynamic process is the main
determinant of program failure. Improvement programs are tightly coupled to other functions
and processes in the firm, and to the firm’s customers, suppliers, competitors and capital
markets. Failure to account for the feedbacks among these tightly coupled activities leads to
unanticipated and often harmful side effects. We describe these dynamics and offer some
guidance for managers seeking to design sustainable process improvement programs.
Keywords:
Improvement initiatives, Process Improvement, TQM, Quality, Reengineering, System
Dynamics.
1
Introduction
Process improvement has become an imperative for businesses seeking competitive advantage,
yet it is disturbing how few organizations make lasting and successful use of process
improvement tools such as total quality management and reengineering. These tools should help
to raise productivity, boost quality and enhance competitiveness. However, quality programs
often struggle to gain initial acceptance and to sustain continuous improvement (US General
Accounting Office, 1991; Young, 1991a; Young, 1991b). Despite the demonstrated benefits of
many improvement techniques, most attempts by companies to use them have ended in failure
(Easton and Jarrell, 1998). In fact, companies have found it extremely difficult to sustain even
initially successful process improvement programs. Even more puzzling, successful
improvement programs have sometimes led to declining business performance, causing layoffs,
low morale, and the collapse of commitment to continuous improvement. We term this
phenomenon the “Improvement Paradox.”
If improvement tools were ineffective it would be easy to explain their low use. The evidence,
however, does not support that explanation. Firms that win quality awards have higher share-
holder returns (Hendricks and Singhal, 1996). Easton and Jarrell (1998) found that among the top
1,000 publicly held companies in the United States, firms with well developed quality programs
significantly outperform their counterparts in profitability, share price and return on assets.
These large sample results are consistent with our own findings. In hundreds of hours of
interviews with our partner companies, discussing both successful and unsuccessful programs,
we rarely heard “the program was just no good.” Typical comments on stalled or abandoned
programs were “I believe [a particular program] is a good process. Some day I’d really like to

2
work on a project that actually follows it” and “We've left a lot on the table by letting this
program go.” Our findings suggest that the inability to manage an improvement program as a
dynamic process – one tightly coupled to other processes in the firm and to the firm’s customers,
suppliers, competitors and capital markets–is the main determinant of program failure. Failure to
account for feedback from these tightly coupled activities leads to unanticipated, and often
harmful, side effects that can cause the premature collapse and abandonment of otherwise
successful improvement programs. We describe these dynamics and offer some guidance for
managers seeking to design sustainable process improvement programs.
For the last four years we have worked with managers at Ford Motor Company, Harley-
Davidson, Lucent Technologies, and National Semiconductor Corporation to understand why
improvement programs often fail, and how practitioners can design sustainable improvement
programs (Jones et al., 1996; Sterman et al., 1996). This work extends earlier research on the
paradoxically poor financial performance experienced by Analog Devices shortly after a highly
successful manufacturing improvement program (Sterman, Repenning, and Kofman, 1997). Our
research involved detailed field studies with our partner organizations. We stressed multiple data
sources including extensive interviews and archival data on the various metrics of quality, product
histories, internal company materials, and financial results. We used the system dynamics
method (Forrester, 1961) to understand the multiple feedback mechanisms that affect the
implementation of improvement programs, and to formulate integrative formal models to test our
hypotheses.
3
Our findings span both the internal dynamics of an improvement program and the interactions of
a program with forces outside the intended area of improvement focus. We first describe the
internal dynamics of an improvement program and the managerial challenges they create. We
then examine how an improvement program interacts with other improvement initiatives, other
organizational units, and with customers. Other improvement programs, organizational practices,
and market response have a profound influence on whether programs can be sustained and
contribute to the improved performance of the entire company.
Internal Dynamics of Improvement Programs
Well-functioning quality programs cannot be bought, like a machine tool. No one can go out and
purchase a fully functioning 6-sigma quality program. A competence in improvement must be
grown organically. To do so management must grapple with three central issues. First, managers
need to address the fundamental trade-off between current and future performance levels.
Second, managers need to make sure that the source of commitment to ongoing improvement
effort shifts from managerial actions to employee initiative. Finally, as a program succeeds, and
so-called low-hanging fruit is harvested, managers need to adapt their improvement tools and
manage expectations for continued gains.
Fundamental improvement trade-off
Process improvement theorists assert that the employees doing a job are the best-informed
experts and should be responsible for identifying improvement opportunities and implementing
changes (Deming, 1986; Ishikawa, 1985; Juran, 1969). Accordingly, most improvement
initiatives rely on the employees who perform the day-to-day work to both guide the
improvement program and make the actual improvements. The rationale behind this strategy is
4
two-fold. First, employees already understand their process, reducing data collection and
diagnosis time. Second, employees have a strong interest in implementing changes when they
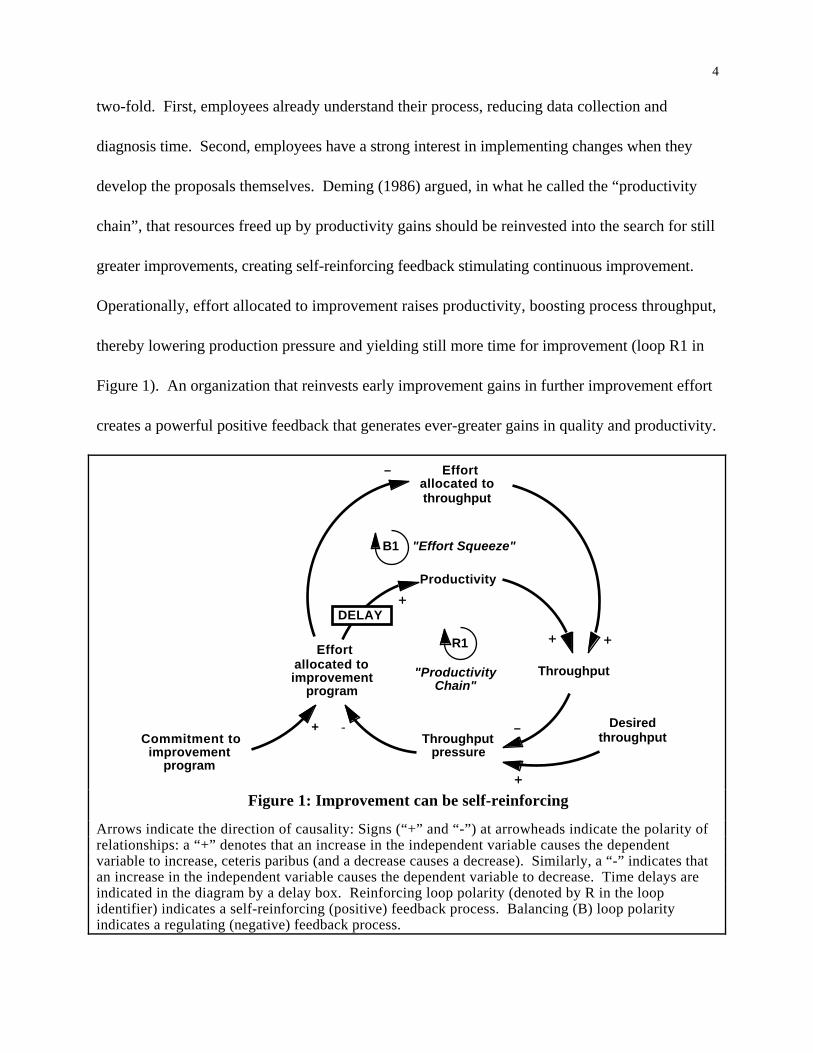
develop the proposals themselves. Deming (1986) argued, in what he called the “productivity
chain”, that resources freed up by productivity gains should be reinvested into the search for still
greater improvements, creating self-reinforcing feedback stimulating continuous improvement.
Operationally, effort allocated to improvement raises productivity, boosting process throughput,
thereby lowering production pressure and yielding still more time for improvement (loop R1 in
Figure 1). An organization that reinvests early improvement gains in further improvement effort
creates a powerful positive feedback that generates ever-greater gains in quality and productivity.
Effortallocated tothroughput
Throughput
Throughputpressure
Productivity
Desiredthroughput
-
+
+
+
+
-
DELAY
"ProductivityChain"
R1
B1 "Effort Squeeze"
Effortallocated toimprovement
program
Commitment toimprovement
program
+ -
Figure 1: Improvement can be self-reinforcing
Arrows indicate the direction of causality: Signs (“+” and “-”) at arrowheads indicate the polarity ofrelationships: a “+” denotes that an increase in the independent variable causes the dependentvariable to increase, ceteris paribus (and a decrease causes a decrease). Similarly, a “-” indicates thatan increase in the independent variable causes the dependent variable to decrease. Time delays areindicated in the diagram by a delay box. Reinforcing loop polarity (denoted by R in the loopidentifier) indicates a self-reinforcing (positive) feedback process. Balancing (B) loop polarityindicates a regulating (negative) feedback process.

5
However, reliance on operating employees to guide and implement improvement can limit the
reinforcing process of the productivity chain. Imagine a quality program designed to reduce
defects and boost usable output. It takes time for improvement effort to bear fruit. Therefore,
the first effect of an increase in improvement effort is a reduction in the time employees can
devote to throughput. The short run effect of improvement effort is a decline in output, exactly
the opposite of the goal. As throughput falls, pressure to work harder builds. Employees faced
with high pressure to meet throughput goals will be forced to cut back the time devoted to
improvement, boosting output but stalling productivity and quality growth (the “effort squeeze”
loop B1 in Figure 1). A manager in one plant we studied captured the dilemma clearly:
In the minds of the [operations team leaders] they had to hit their pack counts [dailyquotas]. This meant if you were having a bad day and your yield had fallen... you had torun like crazy to hit your target. You could say “you are making 20% garbage, stop theline and fix the problem”, and they would say, “I can’t hit my pack count withoutrunning like crazy.” They could never get ahead of the game (Repenning and Sterman1997).
To overcome the quandary, process improvement advocates discourage numerical throughput
quotas and encourage employees to allocate a portion of their normal workday to improvement
effort (Deming, 1986). Managers can also reduce throughput pressure by adding more resources,
thereby allowing sufficient time for both throughput and improvement, or by lowering desired
throughput (perhaps by increasing prices or reducing the number of new projects undertaken).
Managers must, however, be prepared for a period when throughput will drop or costs rise.
While throughput drops immediately at the start of an improvement effort, productivity only
rises after the substantial delay in organizing and deploy improvement efforts. The delay

6
between allocating time to improvement and obtaining results, combined with the immediate drop
in throughput, implies that performance will follow a ‘worse-before-better’ pattern.
Du Pont's efforts to improve maintenance and equipment availability (Carroll, Sterman, and
Marcus, 1998; Sterman, Banaghan, and Gorman, 1992) provide a clear example of this worse-
before-better pattern (Figure 2). After a worldwide benchmarking study, Du Pont managers
found that their plants had maintenance expenditures considerably higher than best practices,
while machine reliability and equipment availability were considerably lower. Further diagnosis
showed that most maintenance effort was reactive, with insufficient effort devoted to preventive
maintenance (PM), training, spare part quality, and design improvements. Over time, cost
cutting had slashed training and PM. Less preventive maintenance increased the breakdown rate,
pulling still more resources out of PM and causing a still greater increase in breakdowns: the
productivity chain (loop R1) operated as a vicious cycle. The high breakdown rate meant the
cost of maintenance was higher, and equipment availability lower, than before the cost cutting
began.
Escaping from the reactive maintenance trap requires a large increase in PM. But the first impact
of an increase in PM is a decline in equipment availability and an increase in maintenance costs.
Only after some time will the benefits of PM start to show up in reduced breakdown rates.
Many prior improvement programs had failed because management could not understand or
tolerate the initial drop in availability and rise in costs.
Stimulated by a system dynamics model, Du Pont created a training program designed to break
out of the reactive maintenance trap. A key part of the program was helping people understand

7
the worse-before-better tradeoff. Figure 2 shows the cost savings for a typical plant following
introduction of the improvement program. As expected, the initial impact of the intervention
was a rise in costs. Once the mean time between failures (MTBF) of equipment began to rise,
there were fewer breakdowns to repair, freeing up still more time for PM and boosting reliability.
Equipment availability rose while maintenance costs fell: the productivity chain now operated as
a virtuous cycle. Plants adopting the program experienced sharp increases in the rate of
improvement. Mean time between failure for pumps rose about 15% with each doubling of
cumulative experience, and costs ultimately fell by an average of about 20%. Comparable plants
pursuing traditional approaches saw learning rates of only about 5% and a 7% rise in
maintenance costs (Carroll et al., 1998).
-40
-20
0
20
40
60
80
-60
12/90 4/93
Cumulative CostSavings
Figure 2: Cost savings at a typical Du Pont plant after implementing a preventivemaintenance program. Vertical Scale disguised.
While some Du Pont facilities overcame the short-run deterioration in performance caused by
improvement programs, many firms do not. Short-term performance goals tempt managers to
8
harvest productivity gains by cutting costly resources or raising throughput targets. These
actions intensify throughput pressure and shift effort away from improvement. Managers who
fail to allocate enough resources find improvement efforts stall as workers devote their time to
short-term throughput goals.
The tendency to harvest initial productivity gains by downsizing or increasing throughput
objectives is strong. Anticipated productivity gains are often factored into equipment and labor
planning. In several of the firms we studied, expected productivity gains from improvement
efforts were assumed in projecting future labor and capital requirements. But goals based on
unrealized productivity gains will be a source of throughput pressure and “effort squeeze” (loop
B1 in Figure 1). In one case, the staff allocated to a critical activity was cut based on projected
productivity gains from the improvement program. But the reduction in resources ensured that
throughput pressure remained high, preventing the workforce from devoting sufficient time to
improvement. The anticipated gains were never realized. Long lead times for new capacity and
training delays for new employees meant that even after management realized their error it was
too late to compensate. The improvement program failed.
To sustain a program, managers must support the reinforcing nature of improvement by limiting
the effect of throughput pressure on effort allocation. An improvement program is more likely to
succeed if managers facilitate a shift of employee time from throughput to improvement and limit
opportunities for employees to shift effort back toward throughput. For example, in Ford's
electronics division, managers prevented assembly workers from stealing time from improvement
to boost short-run output by limiting the release of materials to the production floor. Once the

9
materials allocated for the shift were used, operators could not run their machines and turned
their attention to improvement opportunities.
Initiating and sustaining employee commitment to improvement
Freeing employees to improve processes is essential but insufficient. Successful improvement
requires the enthusiastic commitment of employees since improvement activity is less structured
and less easily monitored than throughput. Shiba et al. (1993) distinguish between two sources
of commitment for improvement programs: managerial push and employee pull. Managerial push
refers to efforts to promote improvement effort or mandate participation. These actions range
from inspirational speeches about the importance of improvement to mandatory participation in
training and improvement teams to financial incentives and performance review criteria based on
improvement. Employee pull arises when workers come to understand the benefits of
improvement for themselves and commit themselves to improvement effort independent of (and
sometimes despite) management attitudes and support (Schaffer and Thomson, 1992). Our
fieldwork suggests that developing employee pull is essential to sustaining improvement efforts.
Programs brought in by a high-level champion require a certain amount of management push to
begin building commitment. Push techniques include providing training, demonstrating support,
championing the value of the program, providing incentives, and clarifying the need to improve.
For example, when Lucent Technologies launched the “Achieving Process Excellence” (APEX)
initiative to reduce product development time, the efforts and persistence of project leader Al
Hofmann and others served as an initial push for participation. Lucent (while still part of
AT&T) had attempted several times to apply various quality management tools to its product
10
development process. These initiatives had failed, and many engineers in the organization were
highly skeptical of the quality movement. To overcome this initial resistance, Hofmann lobbied
his peers and his superiors to secure funding and release time from other responsibilities for the
team members. He regularly sent notes of appreciation to participants and encouraged managers
to recognize their staff members for APEX work. One team member recalled:
At first, people were ‘volunteered’ for teams by their managers, and people felt thatAPEX was a ‘flavor of the month’ project ... Hofmann put in a huge amount of personaltime. He was committed to spend one-third of his time, but he often spent more. Heworked hard to show that management cared. People then believed that management wasserious (Keating and Oliva, forthcoming).
Managerial push often creates temporary excitement, but must be replaced by other sources of
motivation when that excitement begins to fade. Even the most enthusiastic manager cannot
personally contact everyone in a large organization, so as improvement activity spreads, the
impact of individual leaders declines. Command-and-control structures are dependent on
managerial supervision. They are unlikely to work in settings where employee participation and
contributions are difficult to monitor and assess. Participants in failed efforts commonly report
being unable or unwilling to continue after the program champion was promoted or reassigned.
Employees accustomed to command-and-control management may never fully comprehend the
program’s underlying logic or embrace its goals. Participation becomes a matter of compliance to
minimize conflict with superiors. When the push to participate is removed, compliance fades.
All successful initiatives we observed were driven by another self-reinforcing feedback. Initial
commitment to a program, perhaps stimulated by management push, motivates improvement
effort. With some delay, that effort leads to results. As employees see that the improvement
process actually works, they start to believe it has some value, increasing commitment further in

11
a self-reinforcing feedback (the “employee pull” loop R2 in Figure 3). At Lucent, this feedback
soon took off:
As a result of the growing success of APEX, people started to “self-identify” themselvesfor teams. These folks were really motivated; they generally came to the team with ideasthat they were eager to implement. They were the ones who actively got things done.
No amount of management push can substitute for the self-reinforcing feedback created as results
motivate more people to participate, thus generating more results. Management reshuffling
regularly strips away program champions and replaces them with managers who may not share
the interests or the skills of those who initiated existing programs. In these cases, it is the
commitment of a stable set of employees that maintains the improvement efforts over time.
Commitment toimprovement
program
Improvementresults
Effortallocated toimprovement
program
Employeeperception of
program value
+
+
+
+
Managementpush
+ R2
"Employee Pull"
Job security
Effectiveness ofimprovement
effort
Adequacy ofmethodology
Improvementhalf-life
+
+
-
+
Scope ofimprovement
efforts
Adequacyof training
and support
+-
DELAY
Figure 3: Self-reinforcing feedback drives employee commitment to improvement

12
The employee pull feedback can function as a virtuous cycle (improvement boosts commitment,
stimulating still more effort and improvement), or as a vicious cycle (poor results lead to less
effort, ensuring still worse results).
As shown in figure 3, a variety of factors can interfere with the employee pull feedback raising
the odds of a vicious cycle. First, complex processes are more difficult to improve (a complex
process has a long “improvement half-life” – the time required to cut defects in half), intensifying
the worse-before-better tradeoff and slowing the growth of commitment through employee pull.
Second, the effectiveness of any improvement effort depends on the scope of the initiative and
the adequacy of the chosen improvement methodology. Quality and reengineering tools are more
highly developed for manufacturing and operations than for complex processes like product
development, customer-vendor partnering, and senior management functions. Third, inadequate
support infrastructure or training in improvement techniques limits the effectiveness of
improvement effort. Finally, low job security can destroy commitment to improvement –
workers may shun improvement activity if they believe productivity gains will lead to layoffs.
Each of these factors must be managed appropriately to generate the self-reinforcing commitment
required for continuous improvement. We consider each constraint in turn.
Employee Perception of Benefits
Employee commitment to improvement increases when workers and line managers perceive that
improvement effort works. In making the judgment that a program works, people compare the
rate of progress they observe to their expectations. Commitment rises if progress is high relative
to aspirations and falls when progress is disappointing. The dependence of commitment on
observed progress means aggressive managerial push can adversely affects program success. For
13
example, managers often set aggressive “stretch objectives”, or so-called “BHAG’s” (Big Hairy
Aggressive Goals) to encourage participation in improvement programs (Hamel and Prahalad,
1989; Collins and Porras, 1994). For example, a senior manager in a large manufacturing firm set
an aggressive goal to reduce manufacturing cycle time for the firm’s plants from 18 days to 1 day
in five years. He explained his rationale:
I didn't know if we could get to one day, and, to be honest, I really didn't care. If afacility was at 18 days and I set an objective of 16.5 days, everybody would have justsqueezed a little bit. This way everybody knew they had to make big improvements. Ifthey only made it to two days or three day that still would have been a lot better than16.5 (Repenning and Sterman 1997).
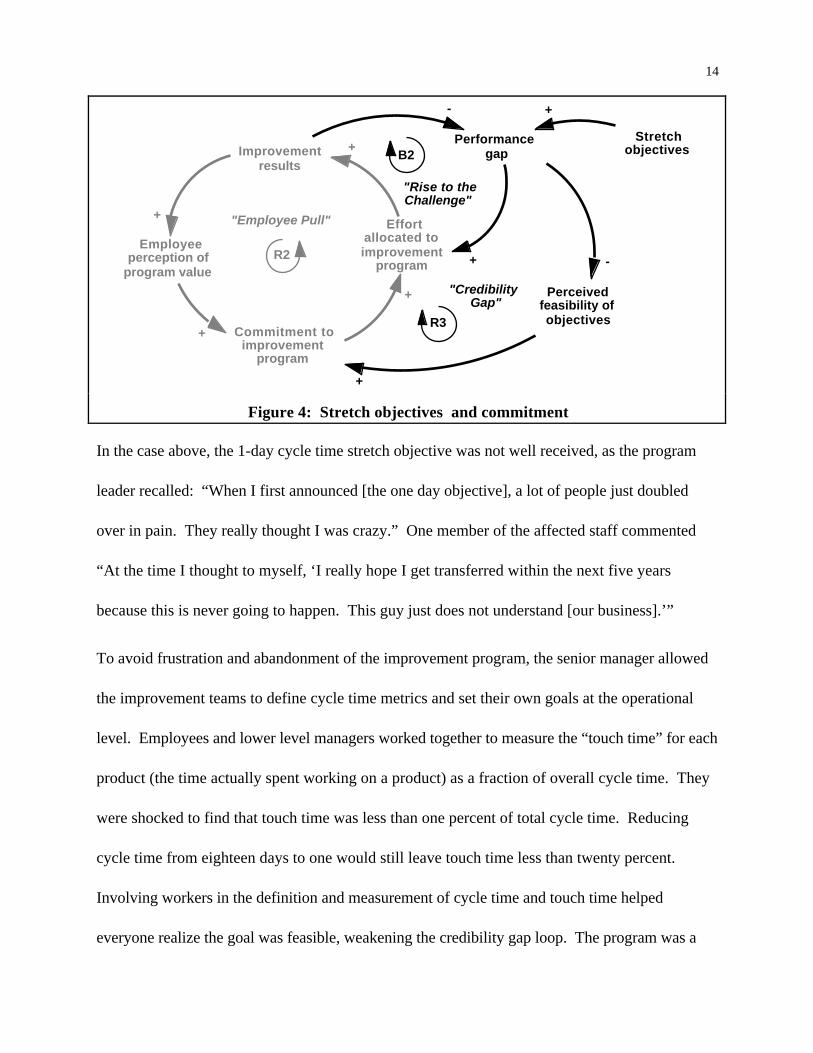
While aggressive objectives may be helpful in creating initial push, they can undermine the
development of long-term employee-pull effects. When objectives are set too high, expectations
outstrip observed benefits and commitment falls, weakening the employee pull feedback. As
shown in figure 4, stretch objectives can motivate greater effort by increasing people’s
aspirations as people “Rise to the Challenge” (loop B2 in Figure 4), but create a “Credibility
Gap” that undermines effort when set too high (loop R3). As effort falls, performance suffers,
confirming people’s belief that the goal was infeasible. A vicious cycle of goal erosion and
cynicism can set in. Few organizations undertaking ambitious change programs know what
feasible rates of improvement in key metrics might be. It is all too easy for managers, themselves
under pressure to meet the expectations of Wall Street or catch up to competitors, to set
objectives far beyond the feasible range, leading to frustration and eroding their credibility.
14
Commitment toimprovement
program
Improvementresults
Effortallocated toimprovement
program
+
+
Performancegap
Stretchobjectives
+-
+
Perceivedfeasibility ofobjectives
-
+
Employeeperception of
program value
+
+
R2
"Employee Pull"
B2
R3
"Rise to theChallenge"
"CredibilityGap"
Figure 4: Stretch objectives and commitment
In the case above, the 1-day cycle time stretch objective was not well received, as the program
leader recalled: “When I first announced [the one day objective], a lot of people just doubled
over in pain. They really thought I was crazy.” One member of the affected staff commented
“At the time I thought to myself, ‘I really hope I get transferred within the next five years
because this is never going to happen. This guy just does not understand [our business].’”
To avoid frustration and abandonment of the improvement program, the senior manager allowed
the improvement teams to define cycle time metrics and set their own goals at the operational
level. Employees and lower level managers worked together to measure the “touch time” for each
product (the time actually spent working on a product) as a fraction of overall cycle time. They
were shocked to find that touch time was less than one percent of total cycle time. Reducing
cycle time from eighteen days to one would still leave touch time less than twenty percent.
Involving workers in the definition and measurement of cycle time and touch time helped
everyone realize the goal was feasible, weakening the credibility gap loop. The program was a

15
major success as initial results led to greater commitment and still lower cycle time throughout
the division (Repenning and Sterman 1997).
Complexity and the Improvement Half-Life
Objective setting requires an answer to the question of “when” the goal will be achieved as well
as to the question of “what” the goal is in absolute terms. Careful analysis of a firm's processes
and benchmarking of other firm’s processes can help to set aggressive yet realistic “what” goals
for performance. These techniques do not, however, provide a sense of how long it will take to
move from current to desired performance. People commonly underestimate the scope and
difficulty of tasks (Kahneman and Lovallo, 1993) and expect benefits sooner than is reasonable.
Thus even when the absolute goal (e.g. a one day cycle time) is set appropriately, the time
provided to reach the goal is often far too short.
Reasonable estimates of the time required to improve are needed to allocate sufficient resources
to improvement. An organization that continually underestimates the time required to realize
results develops a demoralized and skeptical workforce that discounts managerial promises and
will rely more heavily on tangible benefits. In one firm we studied, the workers had been through
so many quality programs that they described each new one by the acronym “AFP” – Another
‘Fine’ Program.
One helpful concept in developing program objectives is the improvement half-life.
Schneiderman (1988) found that in a wide variety of firms, “any defect level, subjected to
legitimate QIP [quality improvement processes], decreases at a constant [fractional] rate.” The
16
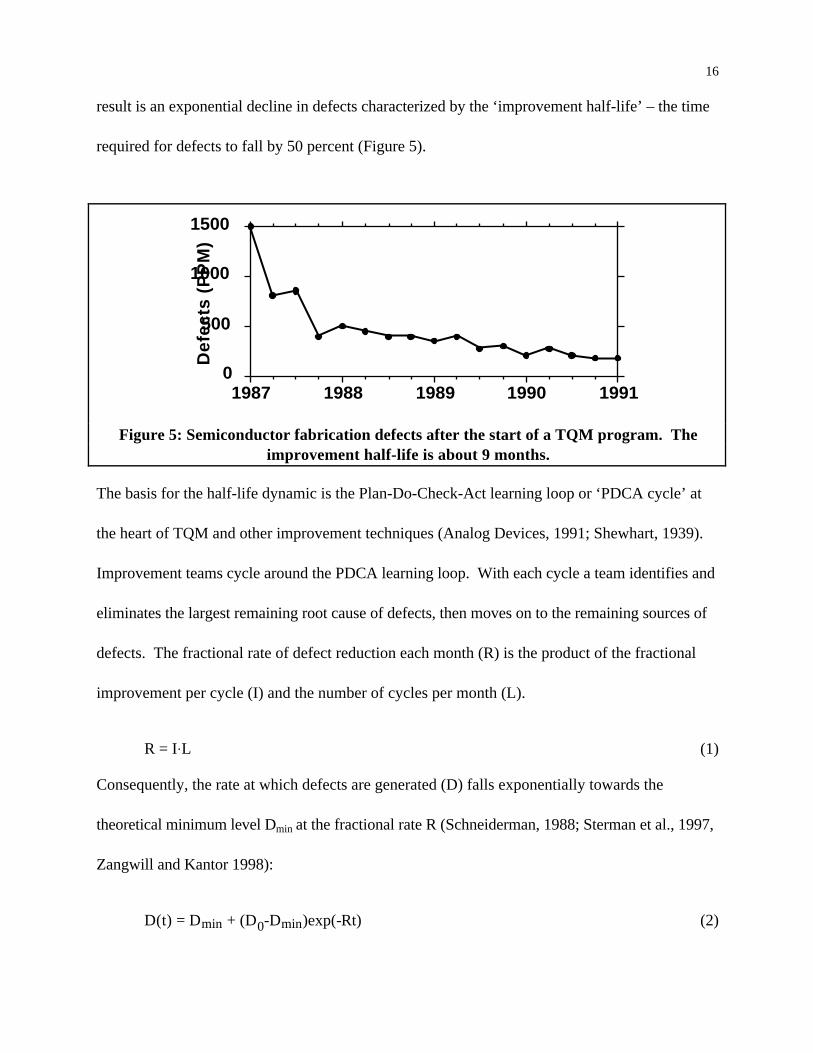
result is an exponential decline in defects characterized by the ‘improvement half-life’ – the time
required for defects to fall by 50 percent (Figure 5).
0
500
1000
1500
1987 1988 1989 1990 1991
Def
ects
(P
PM
)
Figure 5: Semiconductor fabrication defects after the start of a TQM program. Theimprovement half-life is about 9 months.
The basis for the half-life dynamic is the Plan-Do-Check-Act learning loop or ‘PDCA cycle’ at
the heart of TQM and other improvement techniques (Analog Devices, 1991; Shewhart, 1939).
Improvement teams cycle around the PDCA learning loop. With each cycle a team identifies and
eliminates the largest remaining root cause of defects, then moves on to the remaining sources of
defects. The fractional rate of defect reduction each month (R) is the product of the fractional
improvement per cycle (I) and the number of cycles per month (L).
R = I.L (1)
Consequently, the rate at which defects are generated (D) falls exponentially towards the
theoretical minimum level Dmin at the fractional rate R (Schneiderman, 1988; Sterman et al., 1997,
Zangwill and Kantor 1998):
D(t) = Dmin + (D0-Dmin)exp(-Rt) (2)
17
The faster the rate of improvement R, the shorter the improvement half-life will be (the half-life
is given by ln(2)/R). Improvement half-lives vary across processes and functions. Simple
processes like a single piece of equipment in a manufacturing cell were found to have half-lives on
the order of a few months. Complex processes, like product development, have half lives on the
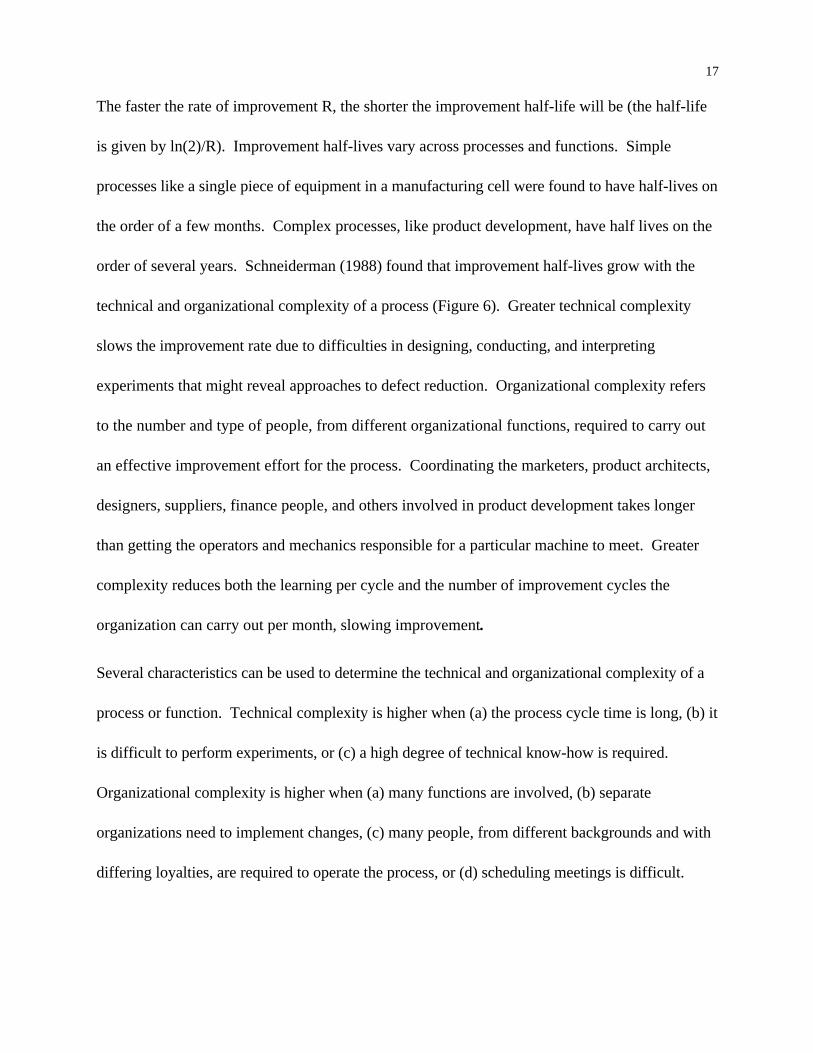
order of several years. Schneiderman (1988) found that improvement half-lives grow with the
technical and organizational complexity of a process (Figure 6). Greater technical complexity
slows the improvement rate due to difficulties in designing, conducting, and interpreting
experiments that might reveal approaches to defect reduction. Organizational complexity refers
to the number and type of people, from different organizational functions, required to carry out
an effective improvement effort for the process. Coordinating the marketers, product architects,
designers, suppliers, finance people, and others involved in product development takes longer
than getting the operators and mechanics responsible for a particular machine to meet. Greater
complexity reduces both the learning per cycle and the number of improvement cycles the
organization can carry out per month, slowing improvement.
Several characteristics can be used to determine the technical and organizational complexity of a
process or function. Technical complexity is higher when (a) the process cycle time is long, (b) it
is difficult to perform experiments, or (c) a high degree of technical know-how is required.
Organizational complexity is higher when (a) many functions are involved, (b) separate
organizations need to implement changes, (c) many people, from different backgrounds and with
differing loyalties, are required to operate the process, or (d) scheduling meetings is difficult.
18
MultipleOrganizations
Technical Complexity
Org
aniz
atio
nal
Co
mp
lexi
ty
SingleFunction
Simple Complex
CrossFunctional
Increasing Half-Lives
Incr
easi
ng
Hal
f-L
ives
IndividualMachine
(6 months)
ProductDevelopment
(36-48 months)
Manufacturing(12-24 months)
Enterprise WideChange
(> 60 months)
Figure 6: Improvement half-lifeSource: Adapted from Schneiderman (1991)
The half-life concept provides a reality check on program goals. For example, a product
engineering group in a research partner company was charged with cutting warranty costs in half
by the year 2000. The group met in October 1997, and working backwards from the target date,
realized that the needed changes would have to be completed by the summer of 1998, leaving less
than one year to redesign a wide range of parts and associated tooling and develop new
procedures and training materials. After locating their process in the upper right-hand corner of
technical and organizational complexity, suggesting a half-life of several years, the group revised
their goals. With less pressure, the engineers’ morale and commitment to the effort improved,
and their faith in their leadership rose.

19
Success and increasing complexity
The half-life concept has also proven helpful in revising objectives over time. Early efforts tend
to focus on relatively simple problems, low in technical and organizational complexity, for which
known techniques can be easily applied – the famous “low hanging fruit” discussed in the quality
literature. As the simpler problems are solved, the program must focus on problems with greater
technical and organizational complexity, causing the improvement half-life to rise (the “tougher
challenges” loop B3 in Figure 7). As the rate of improvement slows, the self-reinforcing
employee pull process (loop R2) weakens, and programs can falter.
Commitment toimprovement
program
Improvementresults
Effortallocated toimprovement
program
Employeeperception of
program value
++
+
+
R2
"Employee Pull"
Effectiveness ofimprovement
effort
Adequacy ofmethodology
Organizationaland technical
complexity
Improvementhalf-life
+
-
+
+
+
-
Tangibilityand proximity
of results
B4B3
B5
"NewChallenges"
"TougherChallenges"
"DiffuseBenefits"
-
+
Figure 7: Increasing technical and organizational complexity

20
The APEX initiative at Lucent Technologies faced this challenge (Keating and Oliva,
forthcoming). Initially, Lucent decomposed the product development process into smaller sub-
processes. Individual improvement teams tackled each activity in isolation. Focusing on the
pieces of the process reduced organizational complexity and led to a short improvement half-life
– at Lucent this process was described as “catching the fat rabbits.” With a short half-life,
product development time fell rapidly at first, demonstrating the value of the improvement
program and boosting participation through the employee pull loop R2. Product development
times fell from about 40 months to 20 in just two years.
However, the improvement teams soon exhausted opportunities within the sub-processes,
threatening progress. The APEX leadership refocused their efforts on the interactions of the sub-
processes. These issues – for example, the coupling between marketing, product definition, and
engineering, or the linkages among different technology and product platforms – created tougher
challenges involving greater technical complexity and much greater organizational complexity,
slowing the rate of improvement (loop B3 in Figure 7). Improvement teams also found that the
improvement methodologies that had worked so well at first became less and less adequate for
the new challenges arising from the couplings among phases and activities (loop B4).
The APEX leadership responded to these challenges by investing in the development of new
improvement tools more appropriate for the interactions across organizational units (requiring
additional time be diverted from design work to training in improvement techniques). They
revised their aspirations for future development time reduction to be more consistent with the

21
growing complexity and difficulty of the task. Over the next two years, they cut product
development times another 40%.
Eventually, as the organizational scope and breadth of the improvement effort grew, it became
harder to attribute results to particular individuals or teams. The rewards of participation fell,
and people were less willing to tackle the problems (the “diffuse benefits” loop B5 in Figure 7).
An APEX leader commented:
The integration effort was not an easy task to sell to management. The project was reallytough to keep going since the benefits were for so many people. If you looked at it, thenear term benefit to any one person was zero, so no one would work on it or pay for it.It is a common good, like clean water. It is too much to everyone’s benefit.
Lucent’s strategy in the successful APEX initiative highlights important lessons for the
management of improvement programs. First, the rate of improvement of any process depends
on its technical and organizational complexity. Objectives, and time frames for achieving them,
need to be ambitious but consistent with the improvement half-lives of the process. However,
the improvement half-life is not an immutable constant. Lucent's decision to focus initially on
individual pieces of the product development process reduced organizational and technical
complexity, lowering the half-life and speeding results. Given the history of failed improvement
efforts, demonstrating that the new program worked was important to overcome initial resistance
from the engineers. Lucent also recognized that initial improvement rates were high while the
easy problems were solved, and adapted both their aspirations and their improvement
methodology to keep pace with increasing technical and organizational complexity.
Skill Dilution
Generating enthusiasm among employees and reducing throughput pressure so they have time for
22
improvement is far from sufficient. The employees involved require training and support.
Training, like improvement itself, cannot be bought and delivered instantly. It takes considerable
time to develop training and support infrastructure (the “capacity building” loop R4). Training
capacity includes qualified instructors, well versed in the specific set of techniques and the
specifics of the organization, and customized materials. Active improvement teams also require
support in the form of experienced people they can turn to for help, libraries of past projects and
tools, and resources to implement their improvement ideas. Improvement programs can falter as
aggressive push and pull effects that expand the demand for training and support far faster than
capacity and support infrastructure (the “skill dilution” loop B6 in Figure 8). One organization
we studied aggressively promoted a new improvement program, overwhelming the training
organization. The initially enthusiastic participants then stumbled in applying the tools, causing
them to question the methodology and, ultimately, abandon the program.
Scope Creep
A successful program can attract too much attention and lose focus. Initially successful
programs attract the interest of more senior people in the organization and in other functions and
departments. The program is then applied to problems far outside the scope of issues for which
it was designed. Such “scope creep” (loop B7 in Figure 8) causes a successful program to be
expanded to all sorts of problems for which it is ill suited, reducing the benefits obtained and
further diluting worker skills and support infrastructure. In several organizations we studied,
overzealous application of quality tools led to declining effectiveness and a backlash that
damaged even the effective programs.

23
Commitment toimprovement
program
Improvementresults
Effortallocated toimprovement
program
Employeeperception of
program value
+
+
+
+
"EmployeePull"
Effectiveness ofimprovement
effort+
Scope ofimprovement
efforts
Adequacyof training
and support
+
-
Trainingand support
needed
-
+
+
Trainingand support
capacity
+
+
B7
B6
R4
"ScopeCreep"
"SkillDilution"
"CapacityBuilding"
R2
DELAY
Figure 8: Scope creep and skill dilution
External Interactions
So far we have treated improvement programs in isolation. But improvement programs affect,
and are affected by, other initiatives and other functions and organizations in the firm. One of
our partner companies initiated an average of two new improvement program initiatives each year
for the past fifteen years. Many programs were carried out simultaneously by overlapping
groups in overlapping areas of focus (Oliva, Rockart, and Sterman, 1998). In other firms,
improvement initiatives in manufacturing had profound effects on product development, pricing,
human resources, inventory management, and even the financial markets. Many of these
interactions were unexpected and harmful.
Interactions with other initiatives
24
Few organizations rely on only a single improvement effort. More often a stream of programs is
implemented concurrently. Even when they address different issues, these programs are linked
through shared resources including human effort, funding, information, and senior management
attention. These interconnections can create substantial synergies across programs as well as
damaging competition.
Multiple programs can lead to synergies. Successful programs help focus organizational
awareness on the potential for improvement and the availability of improvement tools.
Successful programs also generate commitment to improvement that can be transferred from one
program to another. The techniques learned to support one program (e.g. process mapping)
often carry over to other programs, shortening the time required to build competence and achieve
results in subsequent initiatives. In many cases, the substantive knowledge built in one program
helps to identify the specific organizational elements most in need of improvement and the skills
needed for future improvement.
An example of these synergistic interactions is the use of Theory of Constraints (TOC)
(Goldratt, 1990) and Total Productive Maintenance (TPM) (Nakajima, 1988) at one of the wafer
fabrication plants of National Semiconductor Corporation. TOC is a method for improving
throughput, lowering expenses, and managing material flow. The TOC program required
managers to determine the capacity of each process step, then focus improvement on those
processes that constrained throughput – the bottlenecks in the production flow. TPM focuses
on increasing the capacity of individual process steps by encouraging machine operators to focus
on preventive and predictive maintenance rather than reactive repairs. Armed with the results of

25
the TOC analysis, TPM effort was focused on the bottleneck processes where increased
capacity would boost factory throughput the most.
Interactions across programs can be detrimental. For example, a cycle time reduction effort in the
electronics division of Ford led to dramatic improvements in manufacturing productivity.
Initially, the improvement relieved throughput pressure and allowed line workers to dedicate
even more time to improvement – the self-reinforcing productivity chain loop operated as a
virtuous cycle. The program was so successful, however, that soon the plants developed excess
capacity. The leader of the effort realized that if the excess capacity could not be used, a lay-off
would be inevitable. “Empty plants,” he said, “meant unaffordable plants.”
To fill its underutilized manufacturing facilities the division launched a new initiative aimed at
improving the throughput of the product development process. Getting new products into
production faster would generate more demand and solve the excess capacity problem. The
effort led to a new and superior product development process, involving better design and
management tools (CAD/CAM, project management, a library of reusable, documented designs,
and so on). While millions were spent, the program did not achieve its objectives. The initiative
failed because product development engineers also face the fundamental trade-off – they can
either spend their time on improvement or spend their time developing new products. Excess
capacity in manufacturing led the organization to initiate the development of many new products.
These new projects intensified the pressure on the development engineers at the same time they
were being asked to implement the new process. A senior manager said,

26
There was tremendous pressure to grow....We would get ourselves in situations where wewould have a success...which translated into a resource problem for the engineers. Wetypically never said no (Repenning and Sterman 1997).
Under intense pressure to get new products into production, the engineers had no choice but to
cut back the time they spent learning to use the tools and methods of the improved product
development process. One engineer noted “the only thing they shoot you for is missing product
launch. Everything else is negotiable.” Many never learned to use the new multi-million dollar
CAD/CAM system, and skimped on documentation, so the library of reusable designs never
materialized. Because product development did not improve significantly, new products could
not be launched fast enough to utilize the excess manufacturing capacity, and the division had to
reduce headcount.
Interactions with other organizational units
Improvement programs interact with one another and with existing decision rules and
organizational routines. Though subtle, these interactions can have dramatic effects, as the
experience of Analog Devices shows. Over a period of three years, a spectacularly successful
quality program at Analog Devices roughly doubled the manufacturing yield and slashed the
defect rate of outgoing product. With lower production costs, higher yield, and better products,
Analog should have realized dramatic improvement in financial results. Instead, the company's
profits and stock price sank. The company's performance dropped not only in absolute terms,
but relative to competitors who had not adopted TQM practices as quickly.
Dramatic improvements in yield, cycle time, and quality effectively doubled production capacity,
outstripping improvement in other areas. Decision rules for production starts did not adjust as

27
fast as yield improved, leading to excess inventory. Capacity grew much faster than demand,
leading to fear of layoffs that undermined commitment to further improvement (the “fear of
layoffs” loop B8 in figure 9). Excess capacity could be absorbed if higher quality and lower costs
led to market share gains (the “better products” loop R5 in figure 9), or if new products could be
brought to market faster (the “more products” loop R6). But Analog’s market share did not rise
appreciably because it was already the dominant firm in many markets and because competitors
sought to preserve their market share by cutting prices. New product introduction could not rise
fast enough due to its greater complexity and longer half-lives compared to manufacturing.
Effortallocated toimprovement
program
Commitmentto program
Improvementresults
Employeeperceptionof program
value
+
+
+
+
R2
B8
Quality,productivity
Excesscapacity
Demand
Jobsecurity
+
Capacity
++
+
-
Marketshare
Industrydemand
Economicgrowth
New productdevelopment
++
++
+
+
-
R5
R6
"BetterProducts"
"MoreProducts"
"EmployeePull"
"Fear ofLayoffs"
DELAY
DELAY
DELAY
Figure 9: Interactions with the market and job security
Most important, rapid improvement in manufacturing caused a large decrease in unit direct costs.
However, indirect costs per unit, driven by R&D and general, administrative, and selling
expenses, did not improve as quickly due to their greater organizational and technical complexity.

28
Thus while lowering costs overall, the TQM initiative also changed the traditional relationship
between direct and indirect costs, a relationship embedded in organizational norms for pricing.
Analog, like many firms with extensive product lines, used markup pricing. Unit direct costs
were marked up by a standard ratio to yield a base price level, which was then adjusted on the
margin to respond to market conditions. The traditional markup ratio, a little over 200%, was
initially sufficient to cover indirect costs and provide a reasonable return (Table 1). The
traditional markup changed only slowly. Between 1985 and 1989, the success of the TQM
program led to a drop of about 16% in unit direct costs, and average selling prices fell by about
the same ratio. However, indirect costs per unit fell less than 9%. Analog’s traditional gross
margins were no longer sufficient, and operating income fell by 45% (Table 1). The precipitous
drop in profit lowered stock prices, and Analog responded by laying off 10% of the workforce,
the first layoff in its history. Commitment to improvement plummeted as the “fear of layoffs”
loop dominated the system (Sterman et al., 1997). Thus Analog’s success in improving
operations triggered unanticipated side effects that fed back to harm the firm and undercut
continued improvement.
While Analog eventually rebounded, and a new crop of quality efforts eventually grew, the
unanticipated side effects of rapid and unbalanced improvements damaged morale, disrupted
continuous improvement, and threatened the survival of the firm.

29
Historical Data, Analog Devices
$/unit 1 9 8 5 1 9 8 9
Ave. Selling Price 16.32 13.51 -17.2- Cost of Goods Sold 7.61 6.41 -15.8
= Gross Profit 8.71 7.10 -18.5- Indirect Costs 6.35 5.80 -8.7
= Operating Income 2.36 1.30 -44.7
Markup Ratio (%)= 100*(ASP/COGS) 214 211 -1.7
Table 1. Changes in cost structure caused by TQM interacted withpricing policy to yield lower profit (all data expressed per unit sold).
Source: Sterman, Repenning and Kofman 1997.
The Iron Law of Layoffs
As the previous examples show, successful quality programs, by increasing yield and slashing
scrap, defects, and cycle time, can lead to rapid growth in capacity. Unless demand grows
rapidly as well, the result is excess capacity and pressure for layoffs. Excess capacity is common
since processes with low complexity and short improvement half-lives (e.g. scrap and cycle time
reduction) tend to be capacity-augmenting, while demand-generating activities (e.g. new product
development, customer needs assessment, and supply chain integration) have long improvement
half-lives and involve long delays (figure 9).
A simple calculation reveals how fast productivity can grow before creating excess labor and
pressure for layoffs. The labor requirements of any firm are given by sales divided by labor
productivity. The fractional rate of change of labor requirements, l*, is thus equal to the
fractional growth in sales, s, less the fractional rate of productivity growth, p:
l* = s - p (3)
Given the fractional attrition rate of the labor force (denoted ‘a’), the maximum rate of
30
productivity growth consistent with a no-layoff policy is thus:
p ≤ s + a (4)
This is the “Iron Law of Layoffs”: Productivity improvement greater than the rate of sales
growth plus the labor attrition rate necessarily creates excess capacity. The more successfully an
organization improves its manufacturing operations, the more intense the pressure for layoffs. In
Analog’s case, sales growth averaged 27% /year from its founding through 1985 and labor
turnover was also high (10-20%/year) as employees readily found new opportunities in the
expanding electronics industry. Analog could have absorbed productivity growth of 40 to
50%/year. However, as growth faltered and unemployment rose in the late 1980s and early ’90s,
voluntary quits fell below 5% per year. With negligible attrition and sales growth less than
10%/year, even small rates of improvement led to excess capacity.
The Iron Law of Layoffs provides several policy insights. Deming (1986) exhorts management
to “drive out fear” by guaranteeing job security to workers who participate in improvement
programs. But the Iron Law of Layoffs means that such commitments are often not credible. In
mature, slow growth industries, or times of recession when voluntary attrition is low, it can be
difficult to sustain commitment to improvement. Yet slow demand growth and weak economic
conditions motivate firms to undertake ambitious improvement programs. Many firms launch
improvement initiatives precisely when they are least able to absorb productivity gains without
downsizing.
There are several policies a firm can use to resolve this dilemma. First, firms can sometimes
convince workers that while improvement may cost some jobs, failure to improve will cost all
31
jobs. This strategy, reversing Deming to “Drive in Fear”, enables firms to credibly demonstrate
that participation in improvement programs is in the employees’ best interests despite the threat
of job losses (Repenning, 1988). Second, improvement efforts can be directed at the slow-
improving processes first, so that the rate of improvement in demand and capacity is more
balanced.
Interactions with the market
Successful improvement can also create the opposite problem: too much demand. Improvement
initiatives at one of our partner companies improved product quality dramatically. Prior to the
quality program, the firm’s products often had multiple defects requiring substantial maintenance
and frequent repairs. Through an aggressive improvement program, quality rose dramatically,
attracting large numbers of new customers.
The resulting market growth has been profound. Over a recent five-year period revenues grew at
nearly 30%/year, much faster than production capacity. Huge backlogs meant many customers
waited more than 18 months for delivery. The company struggled to meet the booming demand
by reengineering manufacturing lines and aggressively hiring new workers. Production capacity
doubled, but quality began to suffer:
In [one year], we moved four hundred machines [to double capacity in an existing plant]...ripping [them] up, moving [them] to a new location, setting them up and going. Qualityis at risk when you are doing all of that.
The effect of growth on quality is that you get your new bodies for making parts from theassembly line, [and] they are the less experienced workers.
The high workload threatened commitment to continued improvement. Workers throughout the
organization, from the assembly line to product development, felt strong pressure to reduce the

32
time devoted to improvement to boost near-term production (the “effort squeeze” loop in Figure
1). Interviews with line workers and engineers showed how the pressure to “get the iron out” –
deliver product to customers – eroded their commitment to quality:
Sometimes we use junk because management doesn't want us to shut the line down.
Sometimes you will take a part that is cosmetically defective – [with] a slight nick orscratch. They'll take that piece [and] say it is a reject [but when] the next day comes upand they are really short of those pieces, they'll take a few of those pieces back, and say,well it is not that bad.
Thus initial success in boosting quality fed back through the market to increase demand making it
difficult to maintain the quality levels that led to their success.
Conclusion
The failure of promising programs is a symptom of the organizational and economic challenges
involved in making them work. Managers are often unprepared for the interactions of
improvement programs with processes outside the programs’ apparent focus. The improvement
paradox arises because it is difficult to anticipate the wide-ranging effects of improvement,
especially when the intended changes are so clearly beneficial and the unintended adverse effects
are delayed or occur in other functions or organizations.
Companies can strengthen the self-reinforcing processes that can lead to sustained improvement
by actively managing the feedbacks that limit program success. Managers must carefully plan the
roll-out of a new program to ensure demand for participation does not outstrip training and
support infrastructure. Staffing, resources, and goals must be consistent with the improvement
half-life of the process to prevent effort squeeze. If employees are free to allocate time to
improvement, are adequately trained, and program scope remains focused, initial results will build
33
commitment. By activating the virtuous cycle of employee pull early in the process, rapid
productivity gains will follow, sustaining the program without command-and-control
management.
However, managers should anticipate a slowdown in improvement results as the complexity of
the problems addressed increases. Managers may need to adopt new process improvement
techniques to reduce complexity. Management must also recognize the feedbacks arising from
other improvement programs, organizational units and the market. Decision rules and procedures
throughout the organization should be reviewed even if they do not appear to be affected by the
improvement program. In short, managers must become adept in understanding their
organization as a dynamic system.
At our partner companies this process is currently under way. We have developed a
management flight simulator and learning environment addressing the issues discussed here.
These tools allow managers to manage simulated improvement programs, experience the long-
term and distant side effects of their actions, and design new strategies for the improvement
programs they are leading. Our current research focuses on evaluating and improving the learning
laboratory and assessing its impact as a catalyst for the change in organizations.

34
References
Analog Devices (1991) TQM at ADI . Analog Devices, Norwood, MA.
Carroll, J., Sterman, J., and Marcus, A. (1998). Playing the maintenance game: How mental
models drive organizational decisions. In Halpern, J. and Stern, R. (Eds.), Debating
rationality: Nonrational elements of organizational decision making (pp. 99-121). Ithaca,
NY: Cornell University Press.
Collins, J., and Porras, J. (1994) Build to last: Successful habits of visionary companies. Harper
Business, New York.
Deming, W.E. (1986) Out of the crisis. MIT Press, Cambridge, MA.
Easton, G., and Jarrell, S. (1998) The effects of total quality management on corporate
performance: An empirical investigation. Journal of Business, 71(2), 253-307.
Forrester, J.W. (1961) Industrial Dynamics. The MIT Press, Cambridge, MA.
Goldratt, E.M. (1990) What is this thing called theory of constraints and how should it be
implemented. North River Press, Croton on Hudson, NY.
Hamel, G., and Prahalad, C. (1989) Strategic Intent. Harvard Business Review, 67(3), 63-77.
Hendricks, K., and Singhal, V. (1996) Quality awards and the market value of the firm: An
empirical investigation. Management Science, 43(3), 415-436.
Ishikawa, K. (1985) What is total quality control? Prentice Hall, Englewood Cliffs, NJ.
Jones, A., Krahmer, E., Oliva, R., Repenning, N., Rockart, S., and Sterman, J. (1996).
Comparing improvement programs for product development and manufacturing: Results
from field studies. Paper presented at the Proceedings of the 1996 International System
Dynamics Conference, Boston, MA.
Juran, J. (1969) Managerial breakthrough: A new concept of the manager's job. McGraw Hill,
New York.
35
Kahneman, D., and Lovallo, D. (1993) Timid choices and bold forecasts: A cognitive perspective
on risk-taking. Management Science, 39(1), 17-31.
Keating, E., and Oliva, R. (forthcoming). A dynamic theory for sustaining process improvement
teams in product development. In Beyerlein, M. and Johnson, D. (Eds.), Advances in
interdisciplinary studies of teams: Product development teams (Vol. 5, ). Greenwich, CT:
JAI Press.
Nakajima, S. (1988) Introduction to TPM: Total productive maintenance. Productivity Press,
Cambridge, MA.
Oliva, R., Rockart, S., and Sterman, J. (1998). Managing multiple improvement efforts: Lessons
from a semiconductor manufacturing site. In Fedor, D. and Ghosh, S. (Eds.), Advances in
the Management of Organizational Quality (Vol. 3, pp. 1-55). Greenwich, CT: JAI Press.
Repenning, Nelson (1998). Drive out Fear (Unless You Can Drive it In): The role of agency and
job security in process improvement. Working paper, available from author.
Repenning, N. and Sterman, J. (1997). Getting Quality the Old-Fashioned Way: Self-confirming
attributions in the dynamics of process improvement. Forthcoming in Scott, R. and Cole, R.,
The quality movement in America: Lessons for theory and research. (Working paper
available from authors.)
Schaffer, R., and Thomson, H. (1992) Successful change programs begin with results. Harvard
Business Review, 70(1), 80-89.
Schneiderman, A. (1988) Setting quality goals. Quality Progress, April, 55-57.
Shewhart, W. (1939) Statistical Method from the Viewpoint of Quality Control . U.S.
Department of Agriculture, Washington, DC.
Shiba, S., Graham, A., and Walden, D. (1993) A new American TQM: Four practical revolutions
in management. Productivity Press and the Center for Quality Management, Cambridge,
MA.
36
Sterman, J., Banaghan, E., and Gorman, E. (1992) Learning to stitch in time: Building a proactive
maintenance culture at E.I. Du Pont de Nemours and Co. Case study available from author.
MIT, Sloan School of Management, Cambridge, MA 02142.
Sterman, J., Repenning, N., and Kofman, A. (1997) Unanticipated side effects of successful
quality programs: Exploring a paradox of organizational improvement. Management Science,
43(4), 503-521.
Sterman, J., Repenning, N., Oliva, R., Krahmer, E., Rockart, S., and Jones, A. (1996). The
improvement paradox: Designing sustainable quality improvement programs. Paper
presented at the Proceedings of the 1996 International System Dynamics Conference,
Boston, MA.
US General Accounting Office (1991) US companies improve performance through quality
efforts 9-190. GAO/NSIAD.
Young, E. (1991a) International quality study – Best practices report . Ernst & Young/American
Quality Foundation, Milwaukee, WI.
Young, E. (1991b) International quality study – Top line findings . Ernst & Young/American
Quality Foundation, Milwaukee, WI.
Zangwill, W., and Kantor, P. (1998) Toward a theory of continuous improvement and the
learning curve. Management Science, 44(7), 910-920.