Embed Size (px)
Citation preview
OVERCOMING PUBLIC AND POLITICAL CHALLANGES
FOR NATURAL HAZARD RISK INVESTMENT DECISIONS
by
HOLLY BONSTROM
B.S., University of Central Florida, 2008
A thesis submitted to the
Faculty of the Graduate School of the
University of Colorado in partial fulfillment
of the requirement for the degree of
Masters of Science
Department of Civil, Environmental, and Architectural Engineering
2011
This thesis entitled:
Overcoming Public and Political Challenges for Natural Hazard Risk Investment Decisions
written by Holly Bonstrom
has been approved for the Department of Civil and Environmental Engineering
Professor Ross Corotis, Ph.D., P.E.
Professor Keith Porter, Ph.D., P.E.
Professor Abbie Liel, Ph.D., P.E.
Date
The final copy of this thesis has been examined by the signatories, and we
find that both the content and the form meet acceptable presentation standards
of scholarly work in the above mentioned discipline.
iii
Bonstrom, Holly (M.S. Civil and Environmental Engineering)
Overcoming Public and Political Challenges for Natural Hazard Risk Investment Decisions
Thesis directed by Professor Ross Corotis and Associate Research Professor Keith Porter
The cost of natural disasters continues to rise around the world, in part due to the direct
and indirect effects of population growth, urbanization, and the pressures they place on land use.
To reduce the vulnerability of infrastructure, especially existing infrastructure, will require that
engineers bring more than technical capabilities to bear. Engineers also need to know which
measures of risk are most meaningful or relevant to decision makers, and then be able to
communicate those risks, and the costs and benefits of mitigation, in concise, credible,
meaningful terms. A major challenge in developing a plan to retrofit under-designed structures
is demonstrating a need to the public and their political leaders, who may have difficulty
extrapolating un-experienced low-probability, high-consequence events. Many issues must be
addressed which all play a role in the tension between short-term rewards to decisions and long-
term sustainable actions. Review of current knowledge along with a reassessment offering new
understanding and communication tools will be presented focusing on the issues of: (1) public
risk perception, (2) public participation in hazard mitigation planning, (3) incorporation of
community values, (4) incompatibility of political motivation and long-term planning, and (5)
finances of risk and return. A case study reviewing the work done by the San Francisco
Community Action Plan for Seismic Safety (CAPSS) team will be presented as an example that
effectively implements methods presented in this thesis.
iv
Table of Contents
CHAPTER
I. INTRODUCTION ................................................................................................1
1.1 Background ...............................................................................................1
1.2 Scope of Thesis .........................................................................................2
II. LITERATURE REVIEW .....................................................................................4
2.1 Public Risk Perception..............................................................................4
2.2 Public Involvement .................................................................................10
2.3 Focus on Community Values..................................................................14
2.4 Overcoming Incompatibility of Lifetimes ..............................................17
2.5 Cost Presentation Methods .....................................................................21
III. REASSESSMENT OF THE ISSUES.................................................................28
2.1 Public Risk Perception............................................................................28
2.2 Public Involvement .................................................................................35
2.3 Focus on Community Values..................................................................43
2.4 Overcoming Incompatibility of Lifetimes ..............................................49
2.5 Cost Presentation Methods .....................................................................54
VI. CAPSS CASE STUDY.......................................................................................63
V. CONCLUSION...................................................................................................79
5.1 Concluding Remarks and Agenda ..........................................................79
5.2 Thesis Limitations...................................................................................82
5.3 Future Research ......................................................................................83
REFERENCES ........................................................................................................................86
v
APPENDIX
A. Earthquake Retrofitting Questionnaire ...............................................................92
B. Risk Perception Questionnaire: Versions A-D ...................................................98
C. Financial-based Methods Discussion Questions and Reponses........................103
vi
List of Figures
FIGURE
2.1 Present discounted value for a future unit value benefit utilizing the
psychological adjustment to annual discount rate. .............................................24
3.1 Study participants who personally experienced a California Earthquake. .........30
3.2 Study participants who are well informed about a California Earthquake. ........31
3.3 Study participants who highly support retrofit due to the knowledge of a
California Earthquake. ........................................................................................31
3.4 Bay Bridge east span construction. .....................................................................45
4.1 Multi-unit, wood-frame soft-story buildings that collapsed in the 1989 Loma
Prieta Earthquake. ...............................................................................................63
vii
List of Tables
TABLE
3.1. Study Results for Experimental Manipulation on Risk Perception ....................34
3.2 Sample Infrastructure RATE Card Required at Time of Elections. ...................53
4.1 Estimated Damage to San Francisco’s Housing after M7. 2 San Andreas Fault
Scenario...............................................................................................................68
4.2 Expected Damage Before and After Three Retrofit Schemes for a Sample of
2,800 Multi-Unit, Wood-Frame Soft-Story Buildings in Four Scenario
Earthquakes.........................................................................................................75
4.3 Direct Construction Costs Estimated for Four Representative Multi-unit Wood-
Frame Soft-Story Buildings for each Retrofit Scheme.......................................76
4.4 Average Loss Avoided Through Retrofit per Residential Unit in a Magnitude
7.2 Earthquake on the San Andreas Fault ...........................................................77
Page |
1
Chapter 1 Introduction
1.1 Background
Humanity is becoming more vulnerable to natural disasters, largely as a consequence of
population growth and urbanization. According to the EM-DAT International Disaster Database
(2005), the number of weather-related disasters has increased over nine-fold and geological
disasters such as earthquakes have quadrupled since the 1950’s. In 2005, the United States
ranked third among countries most often hit by natural disasters, and it led the world in the cost
of these events (EM-DAT, 2005). One of the primary factors contributing to the rise in US
disaster losses is the steady increase in the population of high-hazard areas, such as the US
hurricane-prone Gulf and Atlantic coasts, and the earthquake-prone west coast. For example,
between 1980 and 2009, the US population increased by 35%, but the populations of California
and Florida increased by 56% and 90%, respectively (US Census Bureau).
Within these areas, the largest population growth has been in developed urban regions,
where construction has increased already high densities and led to building on more vulnerable
lands. While the US population has been growing by an average of 12% each decade since
1950, 89% of the population growth has been in urban areas (Olshansky, 1999). Unfortunately,
rapid urban growth can outpace prudent planning and the realistic assessment and management
of hazards. This can be attributed to a fundamental principle illuminated by Kathleen Tierney,
Director of the Natural Hazards Research and Applications Information Center at the University
of Colorado, who explains “Human settlements are based on the principles of short-term growth
and profits for privileged segments of the population instead of safety and sustainability for the
society as a whole” (quoted in Corotis, 2010).
Page |
2
Addressing this incompability between short-term growth and long-term sustainability
may facilitate the implementation of essential hazard mitigation actions in current and future
planning. Adding to this conflict is the difficulty in demonstrating a need to the public and
public decision makers for reducing hazard risk. Since the occurrence of most high-consequence
hazards is characterized by uncertainty and low probability, many people have difficulty
understanding the need to take action. Furthermore, this gap between long-term, low probability
natural hazards and short-term decision making is exacerbated by the political rationale of
getting re-elected. As a result of recognition from his or her constituents, the motivation behind
political actions is often driven by low risk decisions that offer immediate, recognizable benefits
to society. Often, actions that offer immediate benefits may not align with optimal long-term
policies for a community (Tversky and Bar-Hillel 1983).
To reverse the vulnerability of infrastructure, changes must be made in hazard mitigation
and land use planning that overcomes these fundamental incompatibilities. The consequences of
previous natural disasters have shown that it is important to focus on anticipated needs and
preparedness for future hazards instead of responding to yesterday’s events. In the future,
natural hazards may no longer be viewed as uncertain events that society responds to after the
disaster hits, but rather, must be incorporated into a community’s future long-term planning as if
they will occur.
1.2 Scope of Thesis
Many of the tools necessary to mitigate natural hazard risk are known, but their
implementation is met with political and public challenges. These challenges include but are not
limited to psychological biases in natural hazard risk perception, difficulties with public
participation mechanisms, the frequent disconnect between political rationale and long-term
Page |
3
sustainability, as well as difficulties in using financial based methods to quantify risk and risk
mitigation actions. To overcome these challenges, it has become essential for engineers to
increase their accountability for the security of society, and to integrate engineering solutions
within the social challenges of the risk decision making process. New understanding and
communication tools that will be presented in this thesis focus on the issues of: (1) public risk
perception, (2) public participation in hazard mitigation planning, (3) incorporation of
community values, (4) incompatibility of political motivation and long-term planning, and (5)
finances of risk and return. It is hoped that developing effective risk communication strategies
based on an understanding of the framework of these issues will promote optimal long-term
sustainable policy with recognizable benefits to society.
Chapter 2 of this thesis will present the current state of the knowledge with respect to the
above mentioned five important issues in communicating and implementing retrofit. Chapter 3
will present analysis, suggested approaches and model case studies that are hoped to add
additional insight to the literature review presented. In Chapter 4, a case study will be presented
on a project developed for the City of San Francisco called the Community Action Plan for
Seismic Safety and analyzed on the framework of the five previously mentioned issues. Finally,
Chapter 5 presents conclusions, limitations, and recommendations for future research.
Page |
4
Chapter 2 Literature Review
2.1 Public Risk Perception
While California cities have recently incorporated seismic safety into development plans,
there has been limited success in convincing communities to integrate natural hazards issues into
their planning for future growth (Burby, 1998). Reluctance to plan ahead can be attributed at
least in part to the lack of effective risk communication on natural hazard risk. If engineering
professionals are to be effective in communicating risk, they will need to understand the basis by
which the public at large and elected officials in particular, make decisions with respect to risk
management (Corotis, 2003). Effectively educating the public must address the inherent conflict
between short-term needs and optimizing long-term sustainability. This conflict is related to the
inability for individuals and society as a whole to fully understand the risk of low-probability,
high-consequence events of which many have not personally experienced (Kahneman and
Tversky, 2000). There are specific psychological barriers and biases related to this issue that
may cause both decision makers and the public to ignore or underestimate the likelihood and
potential consequences associated with a natural disaster. In the domain of earthquake risks,
participants often underestimate the risks with which they are faced (Viscusi & Zeckhauser,
2006). Underestimating and ignoring the risk creates issues in not only public safety, but also in
allocating optimal financial support towards public safety measures. Therefore, raising risk
awareness and support for mitigation is a goal in risk communication (Keller et al., 2006).
According to Keller et al. (2006), a first step in risk communication is to gain people’s
attention on natural hazard risk by increasing their risk perception, or in other words, increasing
the perceived likelihood that an individual will experience the effect of a danger. Some of the
Page |
5
decisions made by the public are due to a lack of understanding and often underestimation of the
true probabilities of occurrence (Kahneman and Tversky, 2000). Current research proposes that
the affect heuristic, where subjective impressions or emotions influence perceived judgments,
can be used as a framework for risk perception (Slovic et al. 2004). In the affect heuristic, two
modes of thinking are distinguished, the experiential system and the analytical system (Slovic et
al., 2004). The analytical system is based on probabilities, logical reasoning, and evidence. The
experiential system relies on images, metaphors and narratives. It is thought that people use the
affect and feelings related to a hazard as a cue for estimating the probability of a hazard (Keller
et al., 2006). Slovic et al. (2004) suggest that strong emotional experiences with hazards (the
affect) may be important for increasing the perception of risks.
Kahneman and Tversky (2000) propose the availability heuristic as an explanation for the
biases associated with probability judgments. According to the availability heuristic, people use
the ease with which examples of a hazard can be brought to mind as a measure of estimating the
probability of a hazard (Keller et al., 2006). However, Slovic (2004) suggests that the ease of
imaginability associated with an event may be influenced by the affect and feelings related to
those images. Therefore, it is possible that both the affect and availability heuristic are closely
related when influencing perceived risk.
Past experience is an important factor in people’s perception of natural hazard risk
(Keller et al., 2006). More specifically, Jackson (1981) concluded that past experience with
earthquakes influenced the adoption of seismic hazard policies. Kunreuther (2010) explains that
this delayed perception of risk has become a general problem in disaster mitigation, since
“Decision makers often regard catastrophic events as below their threshold of concern until they
occur.” Therefore, the affect and impressions that arise from experiencing a natural hazard play
Page |
6
a large role in increased risk perception of an event. The availability of these emotions when
confronted with a similar event, provide a bias when making judgments. For example, the affect
and availability heuristic can be related to the purchasing of flood insurance. Many property
owners decide to buy flood insurance only after their houses are under water (Kunreuther and
Michel-Kerjen, 2010). As a result of the emotions and affect from the flood, homeowners who
experienced the flood perceived a higher flood risk than homeowners who did not. However, the
affect from past experiences may fade as time passes, which also implies the availability of these
emotions decrease (Kunreuther and Michel-Kerjan, 2010). Kunreuther and Michel-Kerjan
(2010) suggest that there is a tendency to reduce the impact of past, unpleasant experiences over
time. Emotions run high when one experiences a natural disaster, but as time passes the initial
affect may fade and it may be difficult to recall such concerns for the catastrophe. This explains
why years after a flood, many people end up canceling their flood insurance if they have not
experienced any further flood damage (Kunreuther and Michel-Kerjan, 2010). While the
probability that the flood will occur may be the same when homeowners buy the insurance as it
is years later when they cancel, the high emotions associated with a current catastrophic event
increase the mental availability and hence the assessed risk of the flood event.
In communicating risk effectively, another challenge arises due to the fact that the public
has difficulty thinking in probabilistic terms (Patt and Schrag, 2003). According to Kahneman
and Tversky (2000), small probabilities (which are frequently associated with natural hazard
events) are often underestimated. For events with probabilities of occurrence of less than a few
percent, many people classify them as equally unlikely, and often even consider that they have
no chance of occurring (Kahneman and Tversky, 2000). This issue is increasingly noticeable in
the political arena, where a politician’s career may be measured over a period of just a few years.
Page |
7
Since the event’s small probability is viewed as almost impossible, measures taken to prevent it
may go unrewarded.
There have been various proposed approaches for communicating low-probability risks to
maximize risk perception. Most methods rely on the biases of imaginability and past
experiences associated with the affect and availability heuristics. Past research by Keller and
colleagues (2006) has shown that when problems are formulated in terms of frequencies rather
than probabilities, the perceived threat of the risk is increased. In a study by Slovic et al. (2000),
clinicians who received risk information about a person’s violence in a frequency format judged
the patient to be more dangerous than did the clinicians who received the identical information in
a probability format. In the arena of natural hazards, frequency formats can be used to quantify
risk. For example, if there is a 1% probability of a flood each year, this may also be expressed as
“on average, there is one flood every 100 years.” While this may open the door to some
confusion (i.e., some may think only one flood can occur every 100 years), Keller et al. (2006)
believe the frequency format may evoke frightening or emotional images which probabilities are
unable to stimulate.
The time periods for which a risk is given also have an influence on how a particular risk
is perceived (Keller et al., 2006). For example, Keller et al. (2006) showed that presenting the
risk of flooding over a time period of 80 years increased the homeowners’ perceived risk, as
opposed to presenting the corresponding probability of risk over a time period of one year. This
result of time period manipulation also falls within the influence of the affect and availability
heuristic. Small probabilities of natural hazards associated with shorter time periods may not
induce large emotions or negative images while higher probabilities over longer time periods
may evoke a more vivid, fearful response.
Page |
8
On the other hand, eliminating the probability and frequency of an event altogether when
communicating risk may increase risk perception (Taleb, 2010). According to Taleb (2010),
instead of forcing the understanding of the probabilities associated with a rare event which may
be beyond people’s mental capacity, it is advantageous to focus on the payoff and benefits of an
event if it were to take place. According to Taleb, “We can have a clear idea of the
consequences of an event, even if we do not know how likely it is to occur.” For example,
individuals may not know the exact probability that an earthquake will occur in San Diego, but
they do know that it could cause extensive damage if it did occur. Taleb (2010) proposes that
focusing on the consequences of an event to make a decision rather than the probability can
influence the perceived risk associated with a natural hazard as well as the decision making to
reduce such a risk.
Many studies and reports have been based on the concept of focusing on the tragic
outcome of an event as opposed to the low probability. In the CAPSS case study presented later
in this thesis, probabilities of scenario earthquakes are presented, but ignored in the analysis.
Instead, the study focuses on the consequences of various scenarios of earthquakes, presenting
the potential disaster as if the earthquake occurred today. According to Samant (2011), “By
eliminating probability, which is a confusing concept for a lot of people, the [risk] becomes way
more impactful for the average person. You can imagine: if this happens, this is the result.”
Many authors believe the scenario approach may also impact the emotions associated with an
event. Kerjan and Slovic (2010) explain that when low-probability risks give rise to dread, they
are likely to trigger a larger behavioral response than statistically identical comparisons
involving less feared possibilities. As discussed earlier, when a situation provokes emotion,
probabilities may get neglected or skewed and as a result, people often exaggerate the benefits of
Page |
9
risk mitigation (Kerjan and Slovic, 2010). Therefore, it is not surprising that public leaders and
other communicators describe risk in terms of its tragic outcome rather than the probability of
occurrence.
By describing risk in terms of a tragic outcome, fear and dread for the event produce an
enhanced emotion. This produces a heightened imaginability and availability of the event in
one’s mind which is similar to that associated with negative past experiences. According to
Slovic et al. (2004), availability may work because concrete and imagined images come tagged
with affect. Keller et al. (2006) hypothesizes that the manipulations of such images should
evoke emotions which result in a greater perceived risk. Keller and colleagues believe that this
can be done by presenting participants with negative images associated with an event prior to
gauging the participant’s perceived risk. While participants may not have the availability of past
experience with a specific event to draw a negative affect from, the presentation of negative
images may induce such an affect.
The research described above proposes that the manner in which risks are presented can
influence the level of perceived risk. However, all approaches suggest that evoking a negative
affect associated with an event results in greater perceived risk. In addition to past experience,
the negative affect associated with natural hazards may also be aroused through experimental
manipulation. A study will be presented later in this thesis which tests the hypothesis that
manipulating the time period associated with an event probability as well as manipulating a
negative affect with images will influence the level of perceived risk. A second study will be
discussed which evaluates the relationship between past experience and knowledge of a hazard
event with risk perception for a future, similar natural hazard.
Page |
10
2.2 Public Involvement
Public involvement of various forms has been a fundamental feature of politics in the
United States since before independence. While it has been popular in many political arenas, it
has recently become very important in environmental decision-making processes as a means of
increasing public accountability for long-term decisions (NRC, 2010, McDaniels, 1999 and
Beierle, 1999), improving decision-making processes (Beierle, 1999 and Gamper and Turcanu,
2009), and avoiding opposition to such risk mitigation decisions (Beierle, 1999).
According to Beierle (1999), the national environmental focus has been shifting from
immediate large point sources of environmental catastrophe, to more distributed long-term
disaster issues. Such issues may not be suitable for hierarchal political decision making but
instead may require the commitment, knowledge, and involvement of the government and
general public over time (Beierlre, 1999). McDaniels et al. (1999) consider that the objective of
public involvement should be, “To provide insight that will foster widely supported policy
choices reflecting public values, and to build lasting support for those choices.” With a political
focus on long-term environmental issues, public involvement requires building collaboration
between community organizations, special interest groups, and other public groups which are all
affected by such issues. The authors of a report by the National Research Council (2010) believe
it is important for those engaged in collaboration to share a commitment to the greater goal of the
continuity of the community, as opposed to pursuing only parochial interests. It is important not
only to identify common issues related to natural hazard risk reduction, but also identify how risk
reduction is a part of a broader community building effort. According to Ron Carlee, a previous
County Manager for Arlington County, New York, “A community most likely to survive disaster
Page |
11
is one that actively commits to social equity and inclusion and creates a vision to which all its
residents and institutions can relate” (National Research Council, 2010).
Another reason public involvement is becoming more popular in environmental decision
making is due to the fact that experts and the general public bring very different and unique
perspectives to the risk decision-making process (Beierle, 1999). While experts may have a
narrow specialized view on a topic, the general public may present varying insight since they are
affected differently by a decision. Given the uncertainty and variability of risk reduction
decisions, even the most technical analytical methods for making decisions are met with large
subjectivity. According to Gamper and Turcanu (2009), participation is essential in public
issues, particularly highly conflicting situations with a significant degree of uncertainty. Direct
representation of public preference in risk reduction decision making can complement views of
experts, and develop support for a decision maker’s final choices (Gamper and Turcanu, 2008).
Risk perception and communication literature contains numerous examples of the differences
between public and expert opinions on environmental issues. For example, in a 1987 study by
the U.S. Environmental Protection Agency (EPA), various environmental issues were ranked and
assigned a priority based on the risk to the public. The order the EPA authors ranked the issues
was found to be entirely opposite to the ranking the public reported in the opinion polls (Davies
and Masurek, 1998). According to the National Research Council (1996), even the most
technical aspects of environmental policy analysis including risk assessment and cost-benefit
analysis, often require “unacknowledged value judgments.”
Finally, if public opinion is left out of a decision-making process, it is possible that the
effectiveness of a project or policy may be affected. According to James and Blamey (1999), the
quality of a project design and stakeholder support for the project will be reduced if effective
Page |
12
participation has not occurred. Beierle (1999) believes that public opposition is often an
indicator of the public’s mistrust of the willingness and ability of government to manage risks
appropriately. According to Slovic (1993), active public involvement may be one of the few
ways to start resolving issues of mistrust. When the public is involved in decision making,
people are more likely to understand the issue at hand, and develop a sense of accountability for
the issue. Without public involvement, people may develop opposition to risk-related issues as a
result of lacking education and accountability for the issue.
For these and many other reasons, the National Research Council argued in its 1996 book
“Understanding Risk” that it is imperative to incorporate “…the perspectives and knowledge of
the spectrum of interested and affected parties from the earliest phases of the effort to understand
the risks.” According to the NRC (1996), “If it is desired to communicate risk as credible and
relevant to the interested parties, it must address what these parties believe may be at risk in the
particular situation, and it must incorporate their specialized knowledge. Often, the best way to
do this is by the active involvement or representation of the parties affected.”
As a result, public participation in local plan making is increasingly a requirement by
federal, state, and local laws. While public involvement in local policy decisions theoretically
sounds ideal, there is an underlying reality that people are not always interested in participating.
This may be due to pure disinterest or poor planning efforts aimed to gain public attention
(Godschalk et al., 2003). According to Burby (2003), despite substantial evidence of risks
associated with flood, hurricane, and earthquake catastrophes, it has been particularly difficult to
generate participation in decision making to reduce natural hazard risks. The question is, if
people know they are at risk to natural hazards, why would they lack a desire to participate in the
decision making to reduce such risk?
Page |
13
In a 2002 study, Godschalk et al. (2003) examined evidence from case studies in Florida
and Washington to suggest the causes of disinterest in public participation in natural hazard
decision making. The authors studied five different jurisdictions, all with differences in planning
approaches and types of natural hazards. While each jurisdiction had comprehensive planning
mandates with participation requirements, each lacked interest from the public in issues relating
to natural hazard decision making. Godschalk and colleagues identified common factors in each
case study which led to a decrease in public interest in natural hazard reductions. To begin with,
the authors observed that communities and government parties perceived hazard mitigation
planning to involve technical issues most effectively addressed by trained experts. They explain,
“Citizens generally felt that they lacked the ability to provide input on issues related to
engineering and building codes” (Godschalk et al., 2003). Citizens were also most interested in
concerns with neighborhood issues and did not feel as compelled to focus on city or county wide
natural hazard issues. In areas of Florida where relative newcomers lacked experience with
natural hazards, Godschalk and colleagues also noted there was little interest in natural hazard
risk reduction since they did not feel it to be a direct concern. Since people did not believe that
natural hazard reduction would impact their daily lives and what was important to them, they did
not feel it to be necessary to focus on such issues.
While research has shown that public involvement in risk decision making is both vital
and beneficial to achieving support for risk mitigation policy, effective methods must overcome
the disconnect between public involvement and natural hazards. The observed separation
between natural hazard mitigation and community concerns is of great importance in overcoming
such challenge. It should be noted that there are also drawbacks to the use of public participation
in risk investment policy making. Due to the time and resources necessary to achieve public
Page |
14
understanding and a general consensus on a project, delay of project deliveries and higher costs
may be expected. Also, unless properly educated on options and alternatives, the public may be
concerned with different issues and want to allocate funds and focus in many different directions.
This is why a clear understanding of what must be done and what can be done is essential to
achieve a public participatory program where everyone is working towards the same goal.
2.3 Focus on Community Values
As explained by the National Research Council (1996), risk communication must address
what affected parties believe may be at risk in the particular situation. In other words, people
want to know how they will be directly affected. In research involving various case studies in
natural hazard risk reduction, Olshansky (2003) has shown that it is important to personalize a
particular issue to each party affected.
Most communities share general physical, environmental, and social assets, including
safety, land value, education, etc. In addition to this, each community also has specific assets
which they value more than others. For example, San Francisco, California may be more
concerned about rent control and neighborhood character while Orlando, Florida may focus more
on tourism and landscape. In their research on public participation in various Florida and
Washington jurisdictions, Godschalk et al. (2003) concluded that people were more concerned
with neighborhood issues as opposed to wide natural hazard risk reduction policies. According
to Godschalk and colleagues (2003), “Stepping down from the general community scale to the
local neighborhood scale creates opportunities to involve citizens directly in land use policy and
decision making.” By personalizing the benefits of a larger-scale risk mitigation issue to a
neighborhood level, a community will see how they are directly affected based on their specific
values.
Page |
15
According to Tobin (2011), who served ten years as Executive Director of the California
Seismic Safety Commission, “It is important to identify what a community values, and speak to
those values”. Focusing on assets specific to communities will elevate the understanding of risk
to a direct and personal level, and create the ambiance of immediacy for the taking of action. A
prime example of specific community assets can be found in San Francisco which is one of the
most vulnerable American cities to natural disasters (Paxton, 2004). As a result, effective
communication to mitigate a potential disaster is crucial. Instead of communicating the potential
seismic risk through probabilities and other technical terms which the average person may not
relate to, Tobin (2011) notes that it is beneficial to personalize an issue in relation to the specific
community values. For example, the older housing stock of San Francisco is held in high regard,
and according to Paxton (2004), “Exudes the quintessential charm and character of the city.”
Without retrofitting these structures to current seismic codes, these historic buildings are among
the most vulnerable to damage. An earthquake could easily threaten a large percentage of this
housing stock, and the valued essence of the city could be in jeopardy.
Personalizing an issue to the intended audience may also mean focusing on the social and
physical make-up of a community. For example, San Francisco often has relatively low
residential vacancy rates. An earthquake could conceivably render so many buildings unsafe that
more people are made homeless than there is space for them in the vacant residential buildings
that remain. If those people work in the City, but cannot live there, they may be forced to leave
the area. This could adversely affect the city’s economy, as happened in New Orleans after
Hurricane Katrina in 2005 caused widespread damage to the city’s housing stock, resulting in a
diaspora of city residents. Concerning the physical framework of San Francisco, most of the
housing stock is constructed of wood. As a result, fire may create greater damage than the initial
Page |
16
earthquake. While this claim is up for dispute due to much uncertainty, Paxton (2004) notes that
ninety percent of the building loss in the 1906 San Francisco Earthquake was caused by fire.
Effective risk communication may also focus on the future value of assets to a
community (Tobin, 2011). Since major earthquakes have a relatively low occurrence
probability, it is possible that the benefits of mitigating now may be seen 50 years later. These
benefits from risk mitigation may not be assessed accurately in light of current community
values, but instead may need to be compared to the future value of assets. For example, another
significant attribute of San Francisco communities is their effort toward “green living.” As part
of the City’s “Zero Waste Plan”, San Francisco is working to achieve a recycling rate of 100%
by 2020, which will also dramatically reduce carbon emissions (SFO, 2010). All of the debris
and destruction which accompany seismic activity would not only set back the community value
of “green living” today, but would also set back a large community goal of becoming 100%
recyclable in the future.
In addition to communicating the consequences of natural hazards in light of specific
community assets, hazard mitigation can be piggy-backed on other pertinent issues at hand such
as transportation, zoning, and development (Godschalk et al., 2003). For example, natural
hazards often affect large numbers of low income housing. Hazard mitigation may be
intertwined into disadvantaged neighborhood upgrading programs. Additional examples of
incorporating hazard mitigation into issues involving community values will be presented later in
this thesis. Incorporating hazard mitigation into additional prominent issues at an early stage
can set a precedent for building mitigation into policy making.
Page |
17
2.4 Overcoming Incompatibility of Lifetimes
Over the years, views of natural hazards have been increasingly transformed from
emergency response to risk mitigation. While pre-disaster measures are necessary to protect
against natural hazard destruction, local governments are sometimes reluctant in adopting risk
reduction policies (Corotis, 2010).
Prater and Lindell (2003) offer three explanations for this reluctance in developing risk
mitigation plans. To begin with, they believe residents and local governments tend to discount
the risks associated with developing hazardous areas unless a disaster has recently been
experienced. This theory complements the concept of affect and availability bias, as well as
Kunruether’s (2010) claim, mentioned, earlier that decision makers often regard hazardous
events as below their threshold of concern until they occur. Secondly, Prater and Lindell believe
that the pressure associated with moving to highly hazardous areas, including the scenic beauty
and therefore prime real estate, makes hazard mitigation difficult and costly. The authors also
explain that more short-term local government issues such as crime and education usually absorb
more attention, time, and money rather than future risk reduction issues (Prater and Lindell,
2000).
Corotis (2009) claims that focus on short-term decision making as opposed to long-term
sustainability may be due to not effectively showing a need for hazard risk reduction to the
public and their political leaders. The motivating rationale of decision makers is dictated by low-
risk decisions with direct and recognizable benefits to the public. Pennsylvania Governor Ed
Rendell explains “It [was] easy, especially in tough economic times, to push aside infrastructure
initiatives, including basic maintenance and repair, in favor of issues that seem more pressing or
more appealing” (Herbert, 2010).
Page |
18
There are basic pressures and often incompatibility between the motivating rationale of
an elected decision maker and optimal policies for long-term sustainability (Corotis, 2009). The
political system is based on lifetime cycles of approximately 4-8 years, whereas the lifetime of
infrastructure, and similarly, the return period of a low-probability, high-consequence natural-
hazard events may be 100 years of more. Therefore, the probability of a major disaster occurring
during a specific elected official’s term in office is low. As a result, a political leader may
rightfully conclude that spending resources on definite decisions with immediate effects instead
of investments in long-term sustainability is the best way to satisfy his or her constituents. While
such justification may work for a particular decision maker, Tversky and Bar-Hillel (1983) note
that consecutive short-term decision making may not result in what is best for the long term. For
example, five consecutive, four-year terms held by different elected public leaders may not equal
20 years of efficient decision making. If each politician holds the same rationale that short-term,
immediate benefit decisions will promote re-election, the necessary decisions for the long-term
sustainability of a community may be overlooked. Without an increase in public accountability
in risk mitigation, it is unreasonable to expect elected public leaders to sacrifice immediate
benefits for their constituencies in order to develop long-term sustainability.
In a study using data on natural disasters, election returns, and government spending,
Healy and Malhotra (2010) examine how the public responds to political decisions on natural
hazards. Their studies show that the public often reward politicians for delegating disaster relief
spending only after the disaster occurred, but not for investing in disaster preparedness. By not
providing any acknowledgment or reward to government entities for preparing for disasters
before they occur, politicians lack accountability for such issues, and community sustainability is
Page |
19
in jeopardy. Politicians are instead incentivized to respond post-disaster, after most damage has
occurred and lives have been lost.
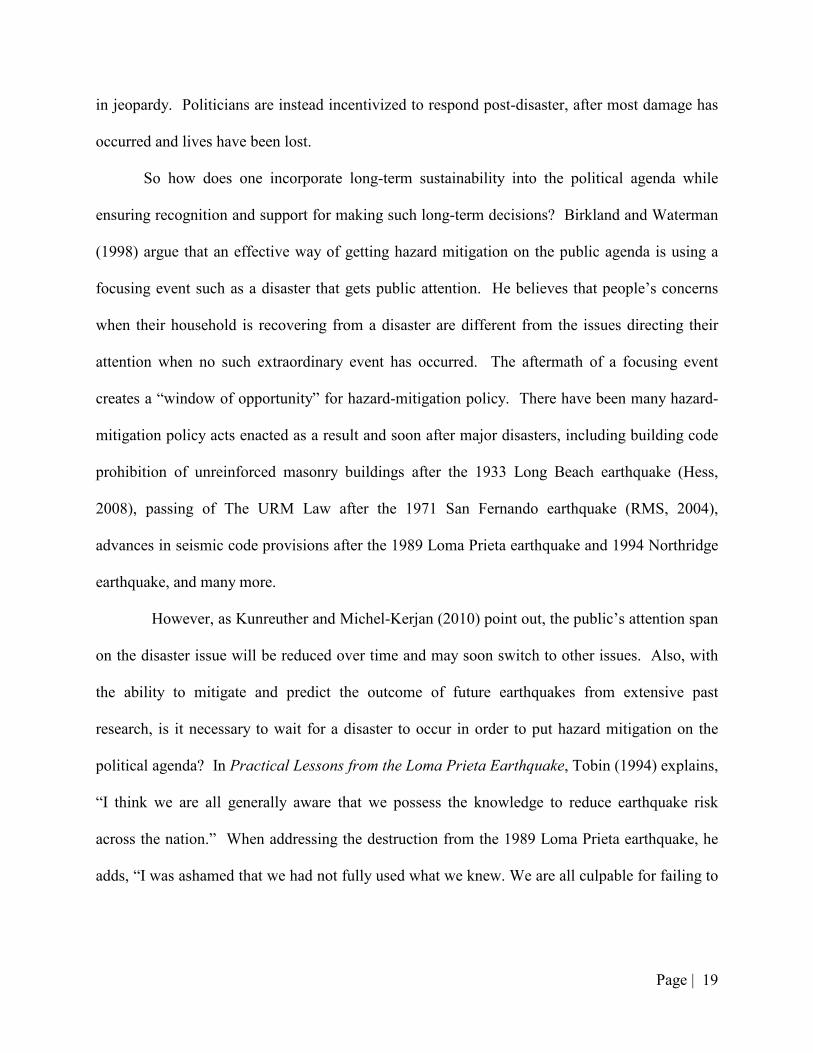
So how does one incorporate long-term sustainability into the political agenda while
ensuring recognition and support for making such long-term decisions? Birkland and Waterman
(1998) argue that an effective way of getting hazard mitigation on the public agenda is using a
focusing event such as a disaster that gets public attention. He believes that people’s concerns
when their household is recovering from a disaster are different from the issues directing their
attention when no such extraordinary event has occurred. The aftermath of a focusing event
creates a “window of opportunity” for hazard-mitigation policy. There have been many hazard-
mitigation policy acts enacted as a result and soon after major disasters, including building code
prohibition of unreinforced masonry buildings after the 1933 Long Beach earthquake (Hess,
2008), passing of The URM Law after the 1971 San Fernando earthquake (RMS, 2004),
advances in seismic code provisions after the 1989 Loma Prieta earthquake and 1994 Northridge
earthquake, and many more.
However, as Kunreuther and Michel-Kerjan (2010) point out, the public’s attention span
on the disaster issue will be reduced over time and may soon switch to other issues. Also, with
the ability to mitigate and predict the outcome of future earthquakes from extensive past
research, is it necessary to wait for a disaster to occur in order to put hazard mitigation on the
political agenda? In Practical Lessons from the Loma Prieta Earthquake, Tobin (1994) explains,
“I think we are all generally aware that we possess the knowledge to reduce earthquake risk
across the nation.” When addressing the destruction from the 1989 Loma Prieta earthquake, he
adds, “I was ashamed that we had not fully used what we knew. We are all culpable for failing to
Page |
20
use our knowledge to effect change. We spend too little time using what we know to change
public policy.”
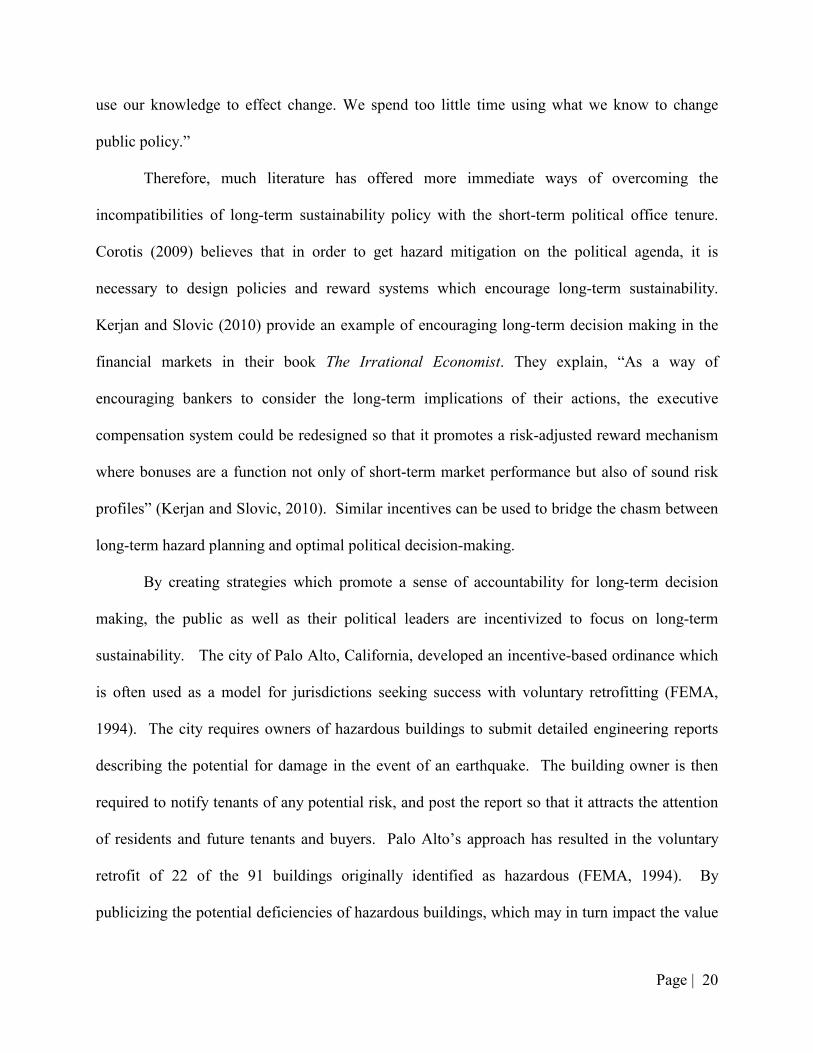
Therefore, much literature has offered more immediate ways of overcoming the
incompatibilities of long-term sustainability policy with the short-term political office tenure.
Corotis (2009) believes that in order to get hazard mitigation on the political agenda, it is
necessary to design policies and reward systems which encourage long-term sustainability.
Kerjan and Slovic (2010) provide an example of encouraging long-term decision making in the
financial markets in their book The Irrational Economist. They explain, “As a way of
encouraging bankers to consider the long-term implications of their actions, the executive
compensation system could be redesigned so that it promotes a risk-adjusted reward mechanism
where bonuses are a function not only of short-term market performance but also of sound risk
profiles” (Kerjan and Slovic, 2010). Similar incentives can be used to bridge the chasm between
long-term hazard planning and optimal political decision-making.
By creating strategies which promote a sense of accountability for long-term decision
making, the public as well as their political leaders are incentivized to focus on long-term
sustainability. The city of Palo Alto, California, developed an incentive-based ordinance which
is often used as a model for jurisdictions seeking success with voluntary retrofitting (FEMA,
1994). The city requires owners of hazardous buildings to submit detailed engineering reports
describing the potential for damage in the event of an earthquake. The building owner is then
required to notify tenants of any potential risk, and post the report so that it attracts the attention
of residents and future tenants and buyers. Palo Alto’s approach has resulted in the voluntary
retrofit of 22 of the 91 buildings originally identified as hazardous (FEMA, 1994). By
publicizing the potential deficiencies of hazardous buildings, which may in turn impact the value
Page |
21
the building offers to a customer, tenant or prospective buyer, the building owner is held
accountable for the seismic risk. Many cities have implemented various incentive programs that
increase public accountability for seismic safety, but at the same time reduce the need for
political decision-makers to set mandatory retrofit ordinances which may be met with hostility.
Kerjan and Slovic (2010) suggest a method to increase the political accountability for
long-term risk mitigation decisions based on increased public involvement and observation in the
decision-making process. They explain, “If a decision maker knows he or she is being observed
while making a decision, this will have predictable effects on the process and outcomes of
decision making.” For example, if the public is involved and educated concerning issues of
natural hazard risk, a political leader may be more likely to put additional efforts in decision
making to retrofit structures. This logic of accountability will be seen in the CAPSS case study
presented later.
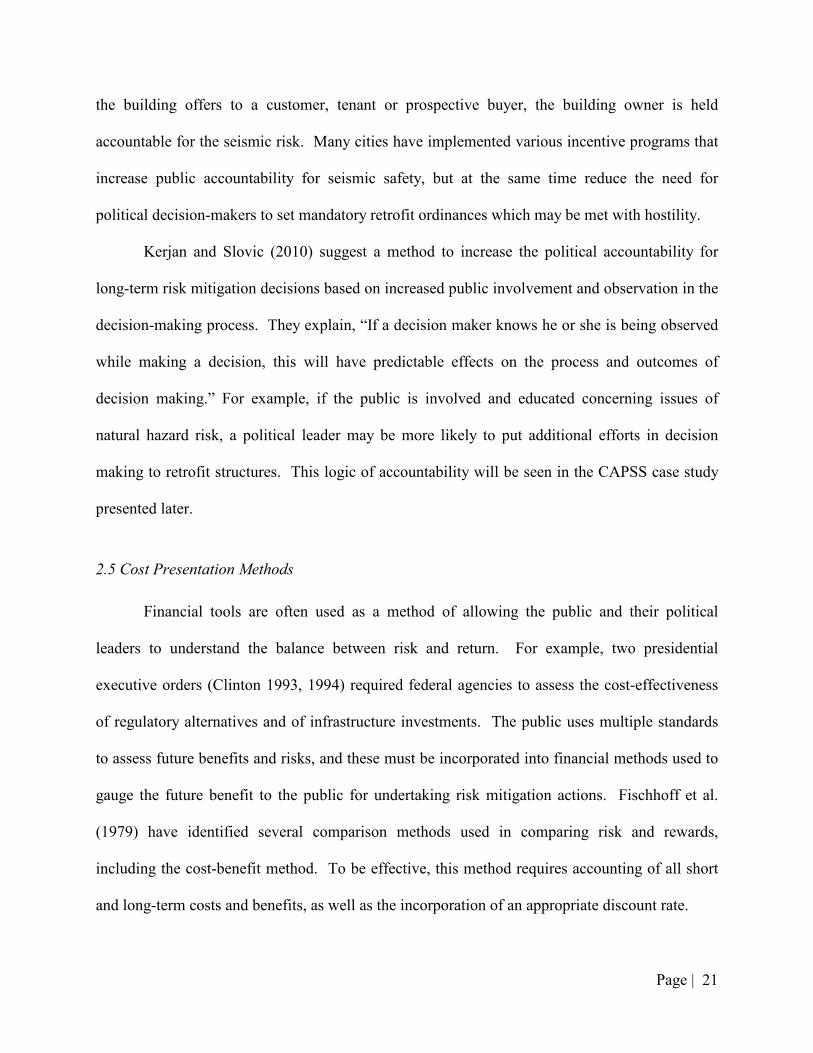
2.5 Cost Presentation Methods
Financial tools are often used as a method of allowing the public and their political
leaders to understand the balance between risk and return. For example, two presidential
executive orders (Clinton 1993, 1994) required federal agencies to assess the cost-effectiveness
of regulatory alternatives and of infrastructure investments. The public uses multiple standards
to assess future benefits and risks, and these must be incorporated into financial methods used to
gauge the future benefit to the public for undertaking risk mitigation actions. Fischhoff et al.
(1979) have identified several comparison methods used in comparing risk and rewards,
including the cost-benefit method. To be effective, this method requires accounting of all short
and long-term costs and benefits, as well as the incorporation of an appropriate discount rate.
Page |
22
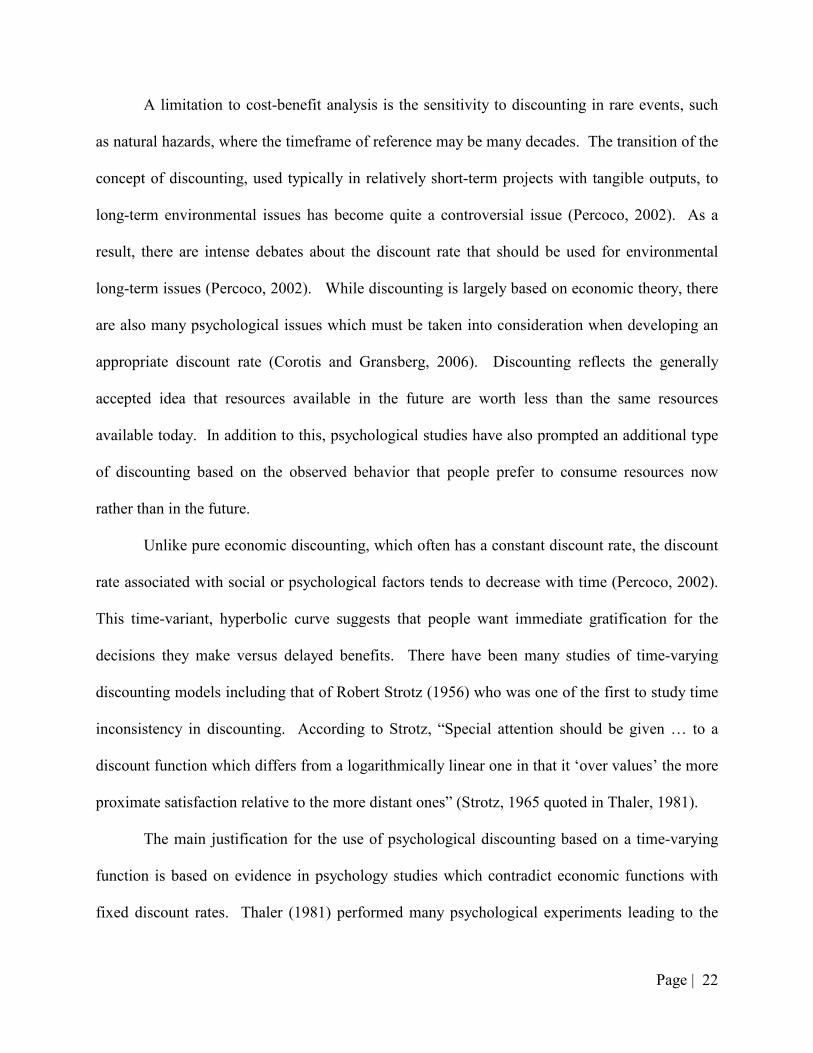
A limitation to cost-benefit analysis is the sensitivity to discounting in rare events, such
as natural hazards, where the timeframe of reference may be many decades. The transition of the
concept of discounting, used typically in relatively short-term projects with tangible outputs, to
long-term environmental issues has become quite a controversial issue (Percoco, 2002). As a
result, there are intense debates about the discount rate that should be used for environmental
long-term issues (Percoco, 2002). While discounting is largely based on economic theory, there
are also many psychological issues which must be taken into consideration when developing an
appropriate discount rate (Corotis and Gransberg, 2006). Discounting reflects the generally
accepted idea that resources available in the future are worth less than the same resources
available today. In addition to this, psychological studies have also prompted an additional type
of discounting based on the observed behavior that people prefer to consume resources now
rather than in the future.
Unlike pure economic discounting, which often has a constant discount rate, the discount
rate associated with social or psychological factors tends to decrease with time (Percoco, 2002).
This time-variant, hyperbolic curve suggests that people want immediate gratification for the
decisions they make versus delayed benefits. There have been many studies of time-varying
discounting models including that of Robert Strotz (1956) who was one of the first to study time
inconsistency in discounting. According to Strotz, “Special attention should be given … to a
discount function which differs from a logarithmically linear one in that it ‘over values’ the more
proximate satisfaction relative to the more distant ones” (Strotz, 1965 quoted in Thaler, 1981).
The main justification for the use of psychological discounting based on a time-varying
function is based on evidence in psychology studies which contradict economic functions with
fixed discount rates. Thaler (1981) performed many psychological experiments leading to the
Page |
23
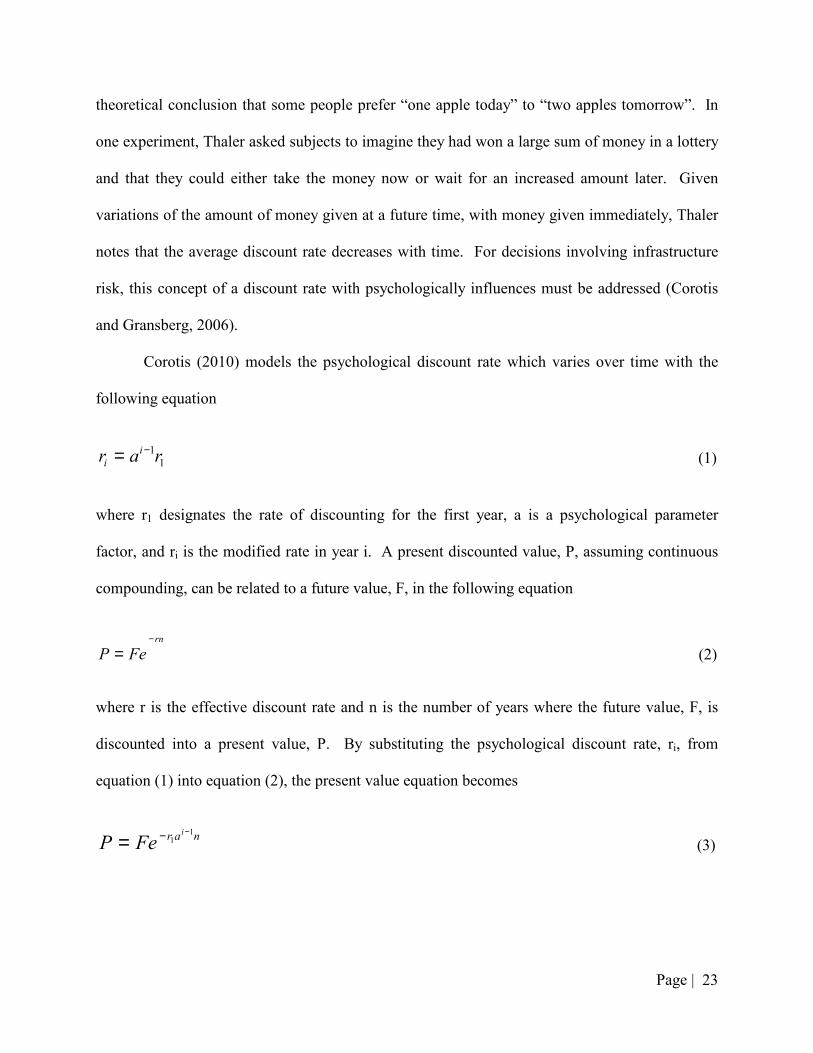
theoretical conclusion that some people prefer “one apple today” to “two apples tomorrow”. In
one experiment, Thaler asked subjects to imagine they had won a large sum of money in a lottery
and that they could either take the money now or wait for an increased amount later. Given
variations of the amount of money given at a future time, with money given immediately, Thaler
notes that the average discount rate decreases with time. For decisions involving infrastructure
risk, this concept of a discount rate with psychologically influences must be addressed (Corotis
and Gransberg, 2006).
Corotis (2010) models the psychological discount rate which varies over time with the
following equation
1
1rar i
i
−= (1)
where r1 designates the rate of discounting for the first year, a is a psychological parameter
factor, and ri is the modified rate in year i. A present discounted value, P, assuming continuous
compounding, can be related to a future value, F, in the following equation
rn
FeP−
= (2)
where r is the effective discount rate and n is the number of years where the future value, F, is
discounted into a present value, P. By substituting the psychological discount rate, ri, from
equation (1) into equation (2), the present value equation becomes
nar i
FeP1
1−−= (3)
Page |
24
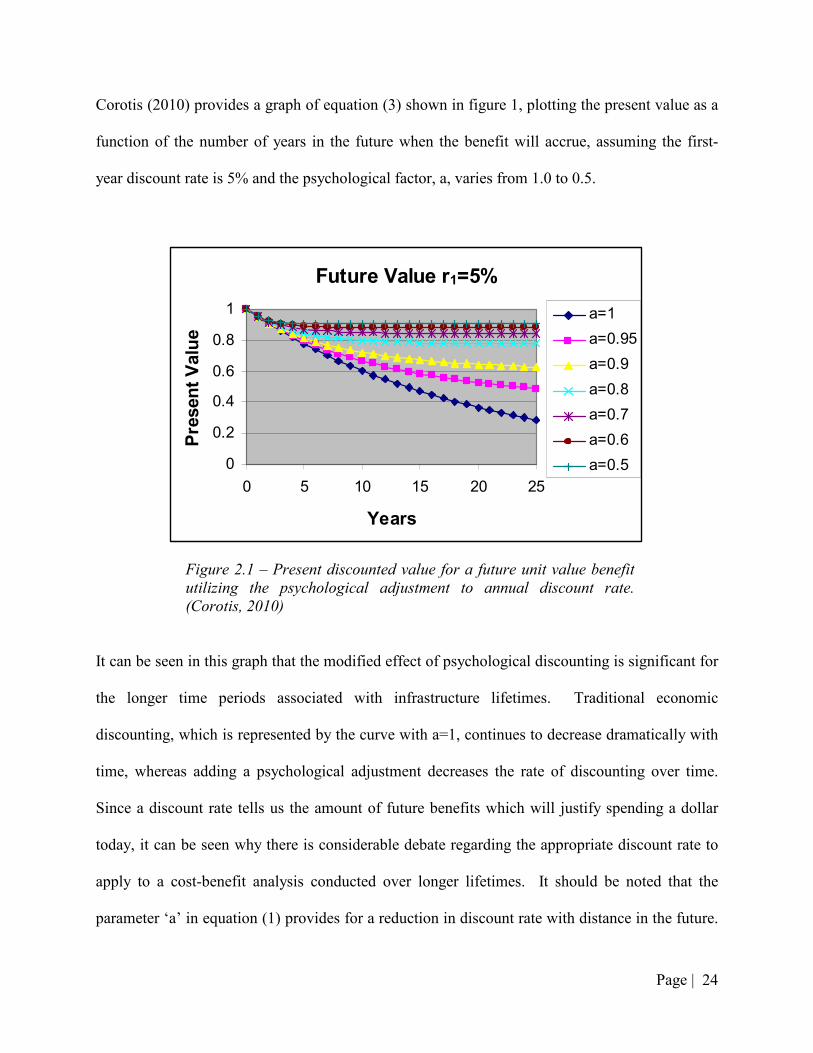
Corotis (2010) provides a graph of equation (3) shown in figure 1, plotting the present value as a
function of the number of years in the future when the benefit will accrue, assuming the first-
year discount rate is 5% and the psychological factor, a, varies from 1.0 to 0.5.
Future Value r1=5%
0
0.2
0.4
0.6
0.8
1
0 5 10 15 20 25
Years
Pre
sen
t V
alu
e
a=1
a=0.95
a=0.9
a=0.8
a=0.7
a=0.6
a=0.5
Figure 2.1 – Present discounted value for a future unit value benefit
utilizing the psychological adjustment to annual discount rate.
(Corotis, 2010)
It can be seen in this graph that the modified effect of psychological discounting is significant for
the longer time periods associated with infrastructure lifetimes. Traditional economic
discounting, which is represented by the curve with a=1, continues to decrease dramatically with
time, whereas adding a psychological adjustment decreases the rate of discounting over time.
Since a discount rate tells us the amount of future benefits which will justify spending a dollar
today, it can be seen why there is considerable debate regarding the appropriate discount rate to
apply to a cost-benefit analysis conducted over longer lifetimes. It should be noted that the
parameter ‘a’ in equation (1) provides for a reduction in discount rate with distance in the future.
Page |
25
An appropriate subject for future study would be the pursuit of a societal normative value for ‘a’
and an investigation as to whether it changes for different rewards and across different societies.
Newell and Pizer (2001) performed research examining the implications of using a
conventional discount rate versus one that is discounted at lower rates over time with respect to
the cost benefit ratio of climate change mitigation. Currently in climate mitigation economics, a
single rate is chosen, typically between 2 and 7 percent, and is held constant over the lifetime of
the model. Newell and Pizer argue that future rates are uncertain and demonstrate that
acknowledging uncertainty will lead to a higher value of future benefits regardless of the initial
rate one chooses. Their studies show that by including the effects of discount rate uncertainty,
the future value of risk mitigation decisions could be raised by as much as 95 percent relative to
conventional discounting (Newell and Pizer, 2001). The applications to this approach of
discounting may be utilized in infrastructure decision making to significantly increase projected
benefits for addressing natural hazard risk.
In addition to discount rate, an assumption must also be made with regard to the time
period associated with the costs and benefits when presenting a benefit-cost analysis for long-
term risk mitigation decisions. A widely shared public rationale during the course of decision
making is “what does it cost me now?” Solely focusing on the initial cost of risk mitigation does
not align properly with the objective of long-term sustainability. The large initial cost makes it
easy for some to ignore the probability of risk over the lifetime of a structure, and overlook the
need to reduce such risk. As discussed earlier, this is often the case in the political arena, where
politicians tend to be persuaded against long-term sustainability decisions due to the higher
initial costs. When presenting financial-based methods it is beneficial to focus on the total cost of
Page |
26
a hazard mitigation investment over the lifetime of infrastructure, and view it as investing money
now so that it can pay off in the long run.
There are many different presentation methods that can be used when presenting a cost-
benefit analysis. One option is using the present discounted value through an infrastructure risk
evaluation. The present discounted value includes the initial cost, along with all of the annual
costs of a structure including maintenance discounted to a present value. Unfortunately, using
the present discounted value is not easily comparable across different types of structures. Since
communities do not set aside funds to pay for future maintenance, the present discounted value
of infrastructure building or repair is not a realistic cost to society. Since the present discounted
value incorporates long-term repair and maintenance, it is much higher that the initial cost of a
structure, which may not be an effective way of presenting and justifying costs for public
spending.
A more effective option of presenting costs may be converting all costs to an equivalent
annual cost. Converting costs to an equivalent annual basis may help alleviate the issue of
incompatibility of lifetimes as discussed earlier. For example, it is much easier for a politician to
justify spending four to eight years of the annual cost of a structure than a large present
discounted value. An important issue in computing the annual cost associated with a project is
the selection of the appropriate design lifetime. When considering a traditional present
discounted value, a shorter design lifetime will minimize the present value of future maintenance
and future risk-related costs. On the other hand, when converting costs to an equivalent annual
cost, the amortization, or the “pay back” of initial costs favors a longer lifetime. For example, if
the initial cost of a structure along with the annual maintenance cost were equally divided over
“n” years with discounting, the annual equivalent cost would be much lower for a structure with
Page |
27
a 100-year lifetime than a similar structure with a 50-year lifetime. Corotis (2009) explains that
longer design lifetimes provide a political reward that is consistent with long-term sustainable
design. The use of infinite design lifetimes, or very long time periods which would seem infinite
in terms of a benefit-cost analysis, may be even more beneficial for a politician, because not only
does this decrease the annual equivalent cost, but also, building a structure with an infinite
lifetime provides a “permanent” reward to a community.
Assumptions of discount rate and time period associated with a cost-benefit analysis as
well as the presentation format of costs to a society will greatly affect the perceived benefit of
risk mitigation. With the ongoing debates over such issues, it is obvious that there are
disagreements over the set of values to be used for specific long-term risk mitigation activities.
Opinions on these controversial topics from current experts in the field of natural hazard risk
mitigation will be summarized and analyzed later in this thesis.
Page |
28
Chapter 3 Reassessment of the Issues
The intent of this chapter is to present a reassessment of the current knowledge presented
in the previous chapter. Further analysis, questionnaires, discussions, and case studies will be
utilized to provide additional insight to the literature review and develop conclusions with
respect to the five outlined issues in communicating risk and implementing retrofit.
3.1 Public Risk Perception
As discussed earlier, the way in which information about natural hazard risk is presented
influences the level of perceived risk. When promoting hazard mitigation, public and political
risk perception can drive the acceptance of long-term policies. Therefore, the details and
parameters of presenting risk can provide a challenge to gaining people’s attention and
promoting accurate risk perception. Many studies presented earlier have suggested that the
affect bias which is linked to the strong emotional feelings about a hazard may play an important
role in risk perception. Since negative images and emotions increase the availability of an event,
the availability bias suggested by many authors also influences risk perception. As discussed
earlier, the negative emotions and prevalent availability associated with an event can be largely
influenced by past experiences (Keller et al., 2006, Kunreuther and Michel-Kerjen, 2010). For
example, if an individual contracted food poisoning from a restaurant, they may be more
cautious about where they eat. If someone was in a serious car accident, they may become a
more cautious driver. The negative feelings associated with past experiences may impact an
individual’s perceived risk opposed to someone who did not have any related past experiences.
Page |
29
Two studies were performed in this research related to the influence this affect has on
risk perception. The first, which is in a form of a survey, focuses on the impact of past
experience and knowledge about an event in terms of the perceived risk. As previously
discussed, a general cause of people not taking action regarding a natural hazard is that they
really don’t think the event will occur, given the low probability of occurrence. This may be due
to lack of past experience. While mass media is changing this, Harris (2011) explains “One of
the big problems with earthquakes is that unless you live in an area where earthquakes are very
frequent, you and no one to whom you are related to that is living has ever been in a serious
earthquake. Because of this, it is difficult to think that you need to be planning for what might
happen.” Therefore, the question arises, how many people who live in earthquake prone regions
have experienced a severe earthquake? To what extent does this past experience heighten the
perceived risk of such an event? If one has not experienced an earthquake, does knowledge from
the mass media influence risk perception? To answer these queries, a questionnaire was
developed comprised of various questions focusing on whether the knowledge and/or
experiences with past earthquakes influences decisions made to mitigate risk against future
quakes. The questionnaire was distributed to approximately 11,000 people as an addition to the
2011 ShakeOut Registration Renewal email. The typical participants in the California ShakeOut
program live in California and are familiar with hazard risk.
Unfortunately, only 18 responses to this questionnaire were recorded on the survey
software. It is not known whether this is due to complications with the questionnaire link, errors
in the survey software, or pure disinterest in taking such a questionnaire. The 18 responses,
however, represent preliminary results to provide some insight into the influence of past
experience and knowledge on perceived risk and risk mitigation action. The complete
Page |
30
questionnaire titled “Earthquake Retrofitting Questionnaire” and results are located in Appendix
A.
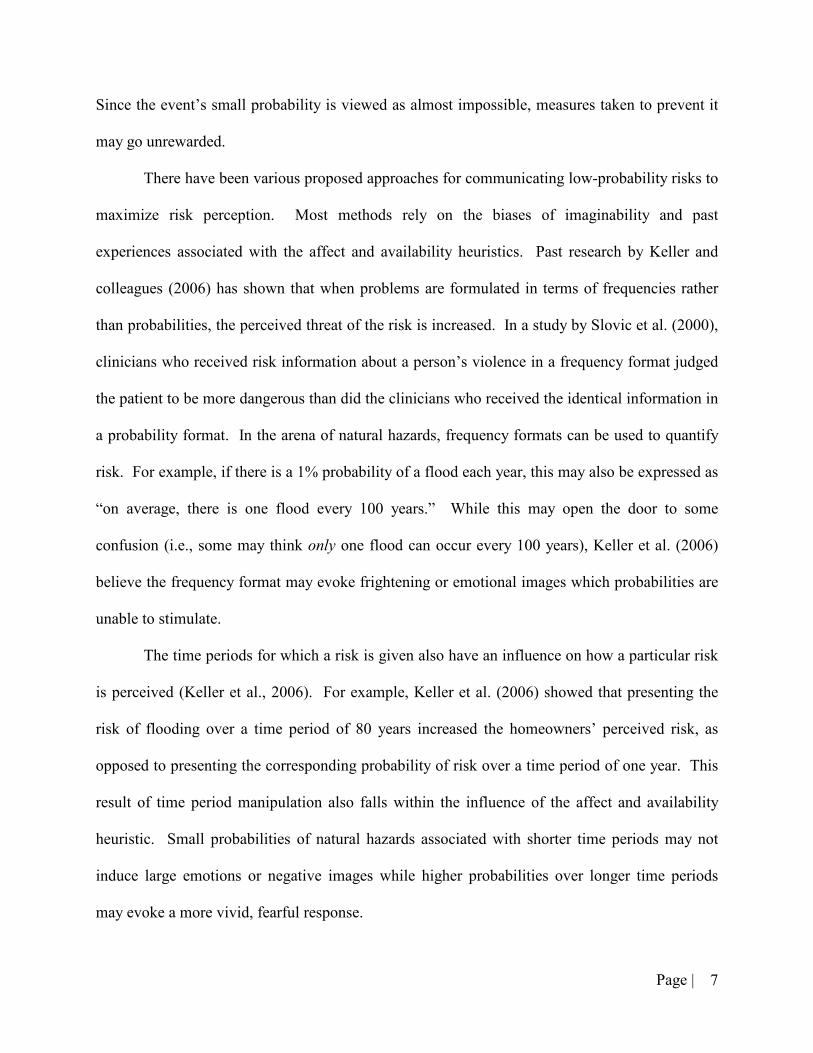
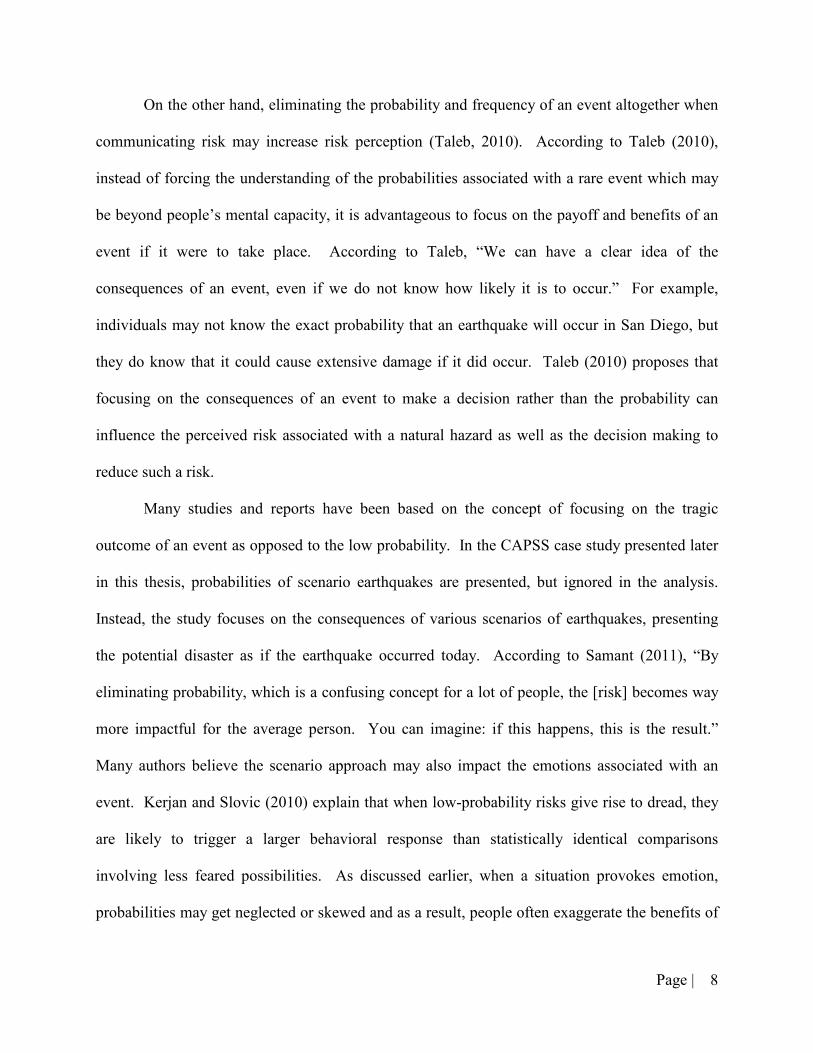
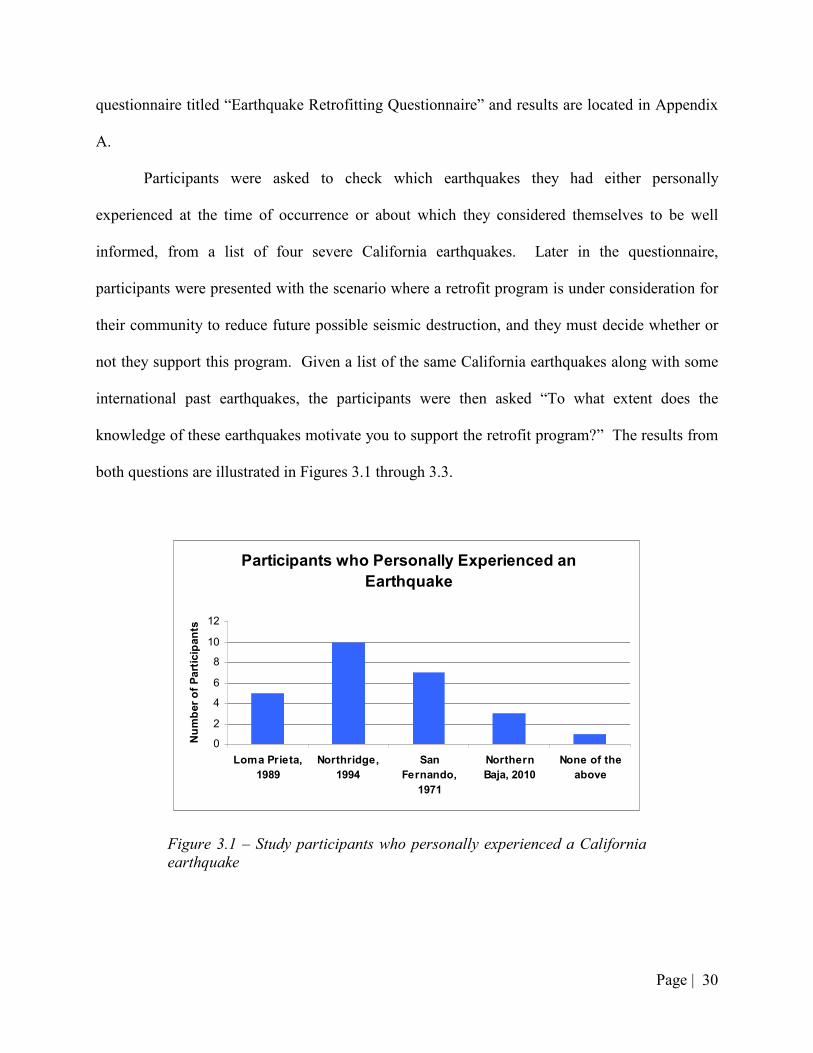
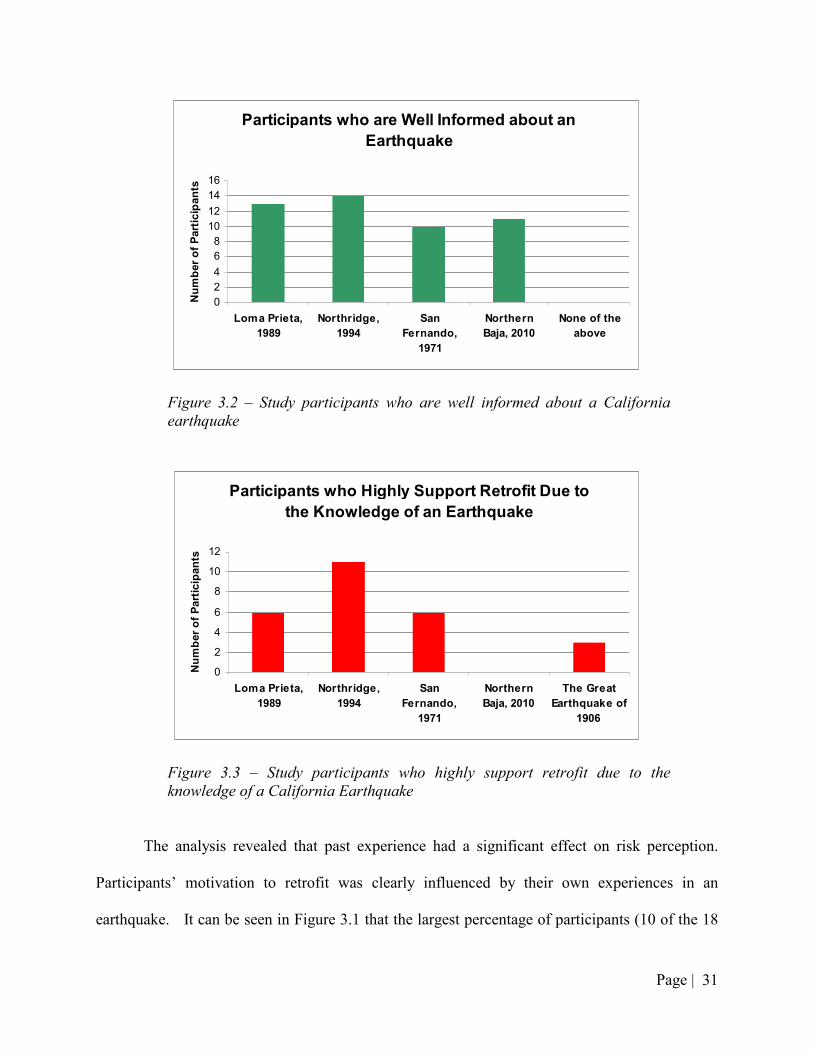
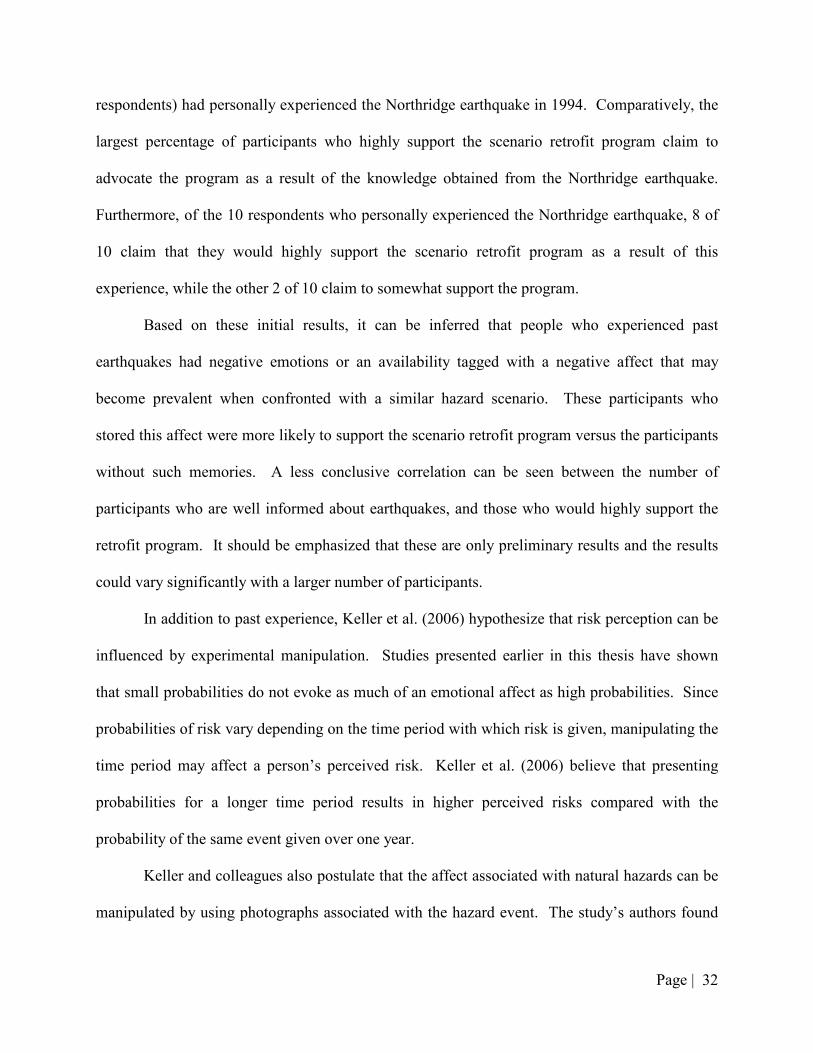
Participants were asked to check which earthquakes they had either personally
experienced at the time of occurrence or about which they considered themselves to be well
informed, from a list of four severe California earthquakes. Later in the questionnaire,
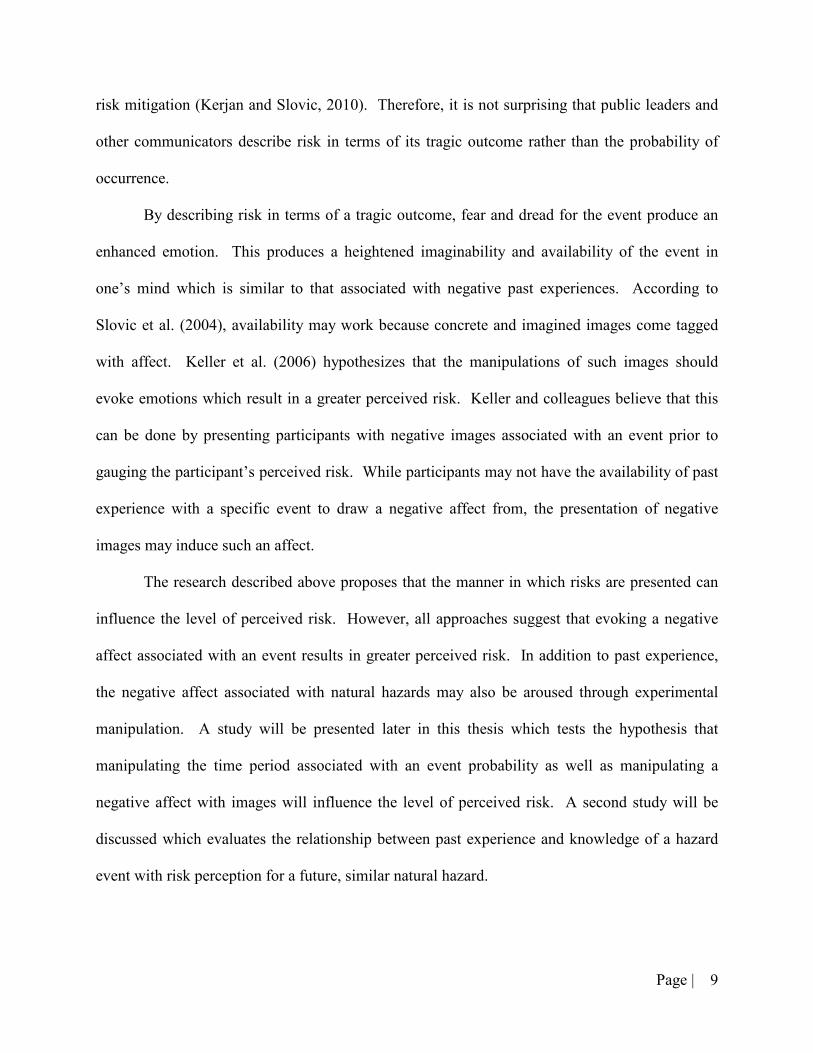
participants were presented with the scenario where a retrofit program is under consideration for
their community to reduce future possible seismic destruction, and they must decide whether or
not they support this program. Given a list of the same California earthquakes along with some
international past earthquakes, the participants were then asked “To what extent does the
knowledge of these earthquakes motivate you to support the retrofit program?” The results from
both questions are illustrated in Figures 3.1 through 3.3.
Participants who Personally Experienced an
Earthquake
0
2
4
6
8
10
12
Loma Prieta,
1989
Northridge,
1994
San
Fernando,
1971
Northern
Baja, 2010
None of the
above
Nu
mb
er
of
Part
icip
an
ts
Figure 3.1 – Study participants who personally experienced a California
earthquake
Page |
31
Participants who are Well Informed about an
Earthquake
0
2
4
6
8
10
12
14
16
Loma Prieta,
1989
Northridge,
1994
San
Fernando,
1971
Northern
Baja, 2010
None of the
above
Nu
mb
er
of
Part
icip
an
ts
Figure 3.2 – Study participants who are well informed about a California
earthquake
Participants who Highly Support Retrofit Due to
the Knowledge of an Earthquake
0
2
4
6
8
10
12
Loma Prieta,
1989
Northridge,
1994
San
Fernando,
1971
Northern
Baja, 2010
The Great
Earthquake of
1906
Nu
mb
er
of
Part
icip
an
ts
Figure 3.3 – Study participants who highly support retrofit due to the
knowledge of a California Earthquake
The analysis revealed that past experience had a significant effect on risk perception.
Participants’ motivation to retrofit was clearly influenced by their own experiences in an
earthquake. It can be seen in Figure 3.1 that the largest percentage of participants (10 of the 18
Page |
32
respondents) had personally experienced the Northridge earthquake in 1994. Comparatively, the
largest percentage of participants who highly support the scenario retrofit program claim to
advocate the program as a result of the knowledge obtained from the Northridge earthquake.
Furthermore, of the 10 respondents who personally experienced the Northridge earthquake, 8 of
10 claim that they would highly support the scenario retrofit program as a result of this
experience, while the other 2 of 10 claim to somewhat support the program.
Based on these initial results, it can be inferred that people who experienced past
earthquakes had negative emotions or an availability tagged with a negative affect that may
become prevalent when confronted with a similar hazard scenario. These participants who
stored this affect were more likely to support the scenario retrofit program versus the participants
without such memories. A less conclusive correlation can be seen between the number of
participants who are well informed about earthquakes, and those who would highly support the
retrofit program. It should be emphasized that these are only preliminary results and the results
could vary significantly with a larger number of participants.
In addition to past experience, Keller et al. (2006) hypothesize that risk perception can be
influenced by experimental manipulation. Studies presented earlier in this thesis have shown
that small probabilities do not evoke as much of an emotional affect as high probabilities. Since
probabilities of risk vary depending on the time period with which risk is given, manipulating the
time period may affect a person’s perceived risk. Keller et al. (2006) believe that presenting
probabilities for a longer time period results in higher perceived risks compared with the
probability of the same event given over one year.
Keller and colleagues also postulate that the affect associated with natural hazards can be
manipulated by using photographs associated with the hazard event. The study’s authors found
Page |
33
that negative photographs associated with an event (i.e. building damage from an earthquake)
evoke undesirable emotions in participants, which therefore heighten the negative feelings
people have for the event.
A questionnaire distributed to undergraduate and graduate students, as part of their
coursework, sheds light on Keller’s hypothesis that inducing a negative affect through
experimental manipulation results in an increased level of perceived risk. The study is intended
to gauge the influence of manipulating the time period of probability when communicating the
likelihood of a hazardous event as well as the availability of negative images in terms of
increases in risk perception. A total of 115 students from the University of Colorado at Boulder
participated in this activity. All students are enrolled in the Engineering College, which entails
some experience with probability and natural hazard risk perception. Participants include 74
junior and senior level undergraduate students and 41 graduate students within the Engineering
College.
This questionnaire focuses on the communication of seismic risk and uses the
experimental manipulation of both time period and photographs. Participants were asked to
imagine that they were planning to buy a house in the highly seismically active City of San
Francisco. It was emphasized that an earthquake would cause severe damage to their house,
which is only partly covered by insurance. Half of the participants received the risk information
based on one year and the other half received the risk information for a time period of 30 years.
Both represented identical probabilities based on a recent assessment of the seismicity of the San
Francisco Bay Area (WGCEP, 2008). That study’s authors estimated a 63% chance of at least
one magnitude 6.7 or greater earthquake in the Bay Area sometime between 2008 and 2038.
Page |
34
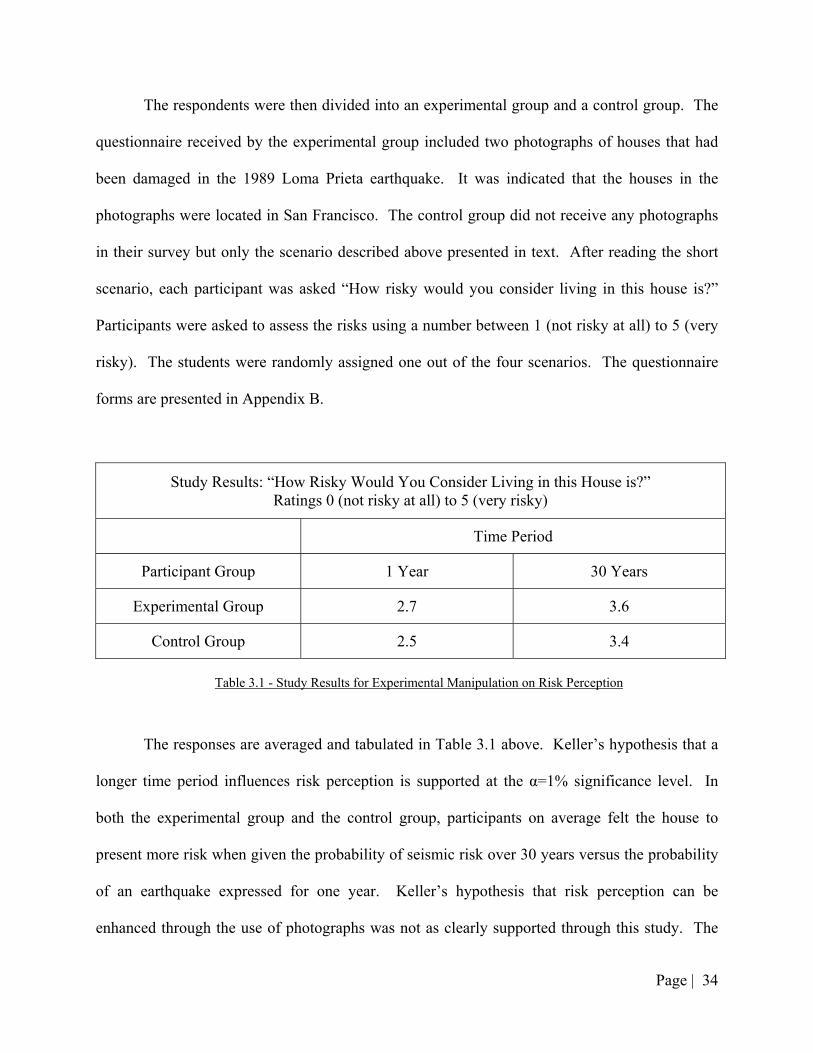
The respondents were then divided into an experimental group and a control group. The
questionnaire received by the experimental group included two photographs of houses that had
been damaged in the 1989 Loma Prieta earthquake. It was indicated that the houses in the
photographs were located in San Francisco. The control group did not receive any photographs
in their survey but only the scenario described above presented in text. After reading the short
scenario, each participant was asked “How risky would you consider living in this house is?”
Participants were asked to assess the risks using a number between 1 (not risky at all) to 5 (very
risky). The students were randomly assigned one out of the four scenarios. The questionnaire
forms are presented in Appendix B.
Study Results: “How Risky Would You Consider Living in this House is?” Ratings 0 (not risky at all) to 5 (very risky)
Time Period
Participant Group 1 Year 30 Years
Experimental Group 2.7 3.6
Control Group 2.5 3.4
Table 3.1 - Study Results for Experimental Manipulation on Risk Perception
The responses are averaged and tabulated in Table 3.1 above. Keller’s hypothesis that a
longer time period influences risk perception is supported at the α=1% significance level. In
both the experimental group and the control group, participants on average felt the house to
present more risk when given the probability of seismic risk over 30 years versus the probability
of an earthquake expressed for one year. Keller’s hypothesis that risk perception can be
enhanced through the use of photographs was not as clearly supported through this study. The
Page |
35
students who were confronted with images of damaged houses and given the probability of
seismic risk over a 30 year time period perceived an average level of risk of 3.6, while those who
were only presented with text recorded a 3.4 risk level. The averages were also very close for
the participants presented with risk expressed over one year. Based on these results, it is difficult
to conclude that the images had a large impact on the participants risk perception. However,
since the recorded risk levels increased slightly for both probability expressions, it is possible
that the images may have had a slight influence.
The results of both studies are consistent with the views of Kahneman and Tversky
(2000) and Slovic et al. (2004) presented earlier in this thesis. Based on these studies, it can be
concluded that the affect and availability bias increase the perception of risk.
3.2 Public Involvement
Policy makers and stakeholders widely accept that members of the public should be
involved in environmental planning (National Research Council, 1996). Not only is public
involvement the foundation for democratic ideals, but it is a growing strategy used by decision
makers to expedite the conformance and effectiveness of environmental decision making
(Beierle, 1999). Involving the public in environmental issues not only reduces public opposition
and obstruction to decision making but also acquires public resources and knowledge in
implementing such decisions. Regardless of the benefit of public involvement, an effective
method of how to involve the public remains controversial (Webler and Tuler, 2001).
Public participation and involvement has evolved over the years. In the past, public
participation meant having the ability to provide comments at public hearings, vote in public
polls, or participate in a social movement (Webler and Tuler, 2001). As pressures to increase
Page |
36
public participation in environmental policies grow, public involvement has transformed into
giving the public a voice and influence in such decision making. Various methods have been
developed that enable to public to be active participants in policy option deliberations and often
in policy decision making. Many of these efforts including focus groups, town-hall meetings,
open houses, advisory committees, and various surveys have been proven useful (Gregory,
2000). However, decision makers often show the intent of seeking and considering the views of
the public, but instead make decisions based on their own interpretation of the issue (Gregory,
2000). Therefore, it is not surprising that there is often public dissatisfaction with the quality and
credibility of stakeholder input in environmental risk-management decisions (Stave, 2002).
This thesis presents three case studies evaluated on the framework of three goals to
evaluate the success of public involvement extracted from the literature review presented
previously in this paper. These goals include:
1. Educating the public
2. Incorporating public values, and
3. Increasing the importance and credibility of public influence in decision-making.
The case studies involve varying levels of effectiveness in public involvement used in
decision making regarding environmental issues. The first case study involves successful public
participation in decision making to build hazardous waste facilities in Alberta, Canada. The
second presents a case where public involvement was initially ineffective, but subsequently
improved to ultimately be successful on a study of the cleanup and protection for the Tillamook
Bay in northwestern Oregon. The third case study illustrates ineffective community participation
in Papillion Creek watershed planning.
Page |
37
Case Study: Hazardous Waste Facilities in Canada
This case study involves proposals for siting hazardous waste facilities in Alberta,
Canada. Typically, any proposal to create hazardous waste facilities is met with community
opposition. According to Gray (1989), “One of the most difficult but potentially most promising
areas for the use of collaborative approaches is in the siting of hazardous waste facilities.” While
efforts to resolve siting of such facilities are often met with limited success (Gray 1989), this first
case study is evidence of successful waste facility placements in Alberta, Canada accredited to
the collaborative use of public involvement and education. The following summary of events is
taken from Barbara Gray’s 1989 book, “Collaborating: Finding Common Ground for Multiparty
Problems.”
To overcome the challenge of community opposition to the placement of hazard waste
facilities, the Canadian providence of Alberta developed a unique approach to involving local
communities in the siting process. In 1980, Alberta’s provincial government launched a
Province-wide public siting and education process. The education portion was composed of a
series of public forums that informed the public of the waste handling procedures along with
their own responsibility in preventing waste dumping. The siting portion involved multi-level
mapping which was opened to public comment via public meetings. The public was encouraged
to participate in further progress and improvement of the mapping process and volunteers were
requested to participate in government negotiations.
The Province elicited volunteer communities for the placement of a waste facility and
negotiated incentives in return focusing on important values to the community. The negotiated
incentives included “tax benefits, economic spin-offs, roadway improvements, employee
Page |
38
housing, and employment priority for local township residents” (Gray, 1989). By 1985, the
hazardous waste facilities were approved and constructed.
Gray (1989) believes that the siting process was successful due to the extensive public
education and site selection program. It was publicized from the beginning that facility siting
would not take place unless communities were in agreement with the location. Therefore,
community stakeholders may have felt their views and involvement held more credibility, since
the siting location was ultimately left at their digression. The fact that the provincial government
negotiated incentives for the community which volunteered to host the facility siting may have
also aided the success of public involvement. By focusing on specific community values and
assets, the Province was able to tailor incentives to promote community acceptance of the siting.
As a result of this unique and successful approach to voluntary public involvement, the Canadian
cabinet created a standard mechanism for establishing voluntary site selection processes in 1988
(Gray, 1989).
Case Study: Tillamook Bay Watershed
In 1998, a small team was funded by the U.S. Environmental Protection Agency (EPA)
and the National Estuary Program (NEP), to examine the use of a public participation process to
assess the cleanup and protection options for the Tillamook Bay watershed in northwestern
Oregon. The Bay supports fish and birds, and is an integral component to local economies based
on timber, agriculture, tourism, competitive fishing, and local dairy farming (Gregory, 2000).
The study, titled Tillamook Bay National Estuary Project (TBNEP), was given the task to
develop a science-based, community-supported management plan for the watershed. The
following project description is summarized from the research of Gregory (2000).
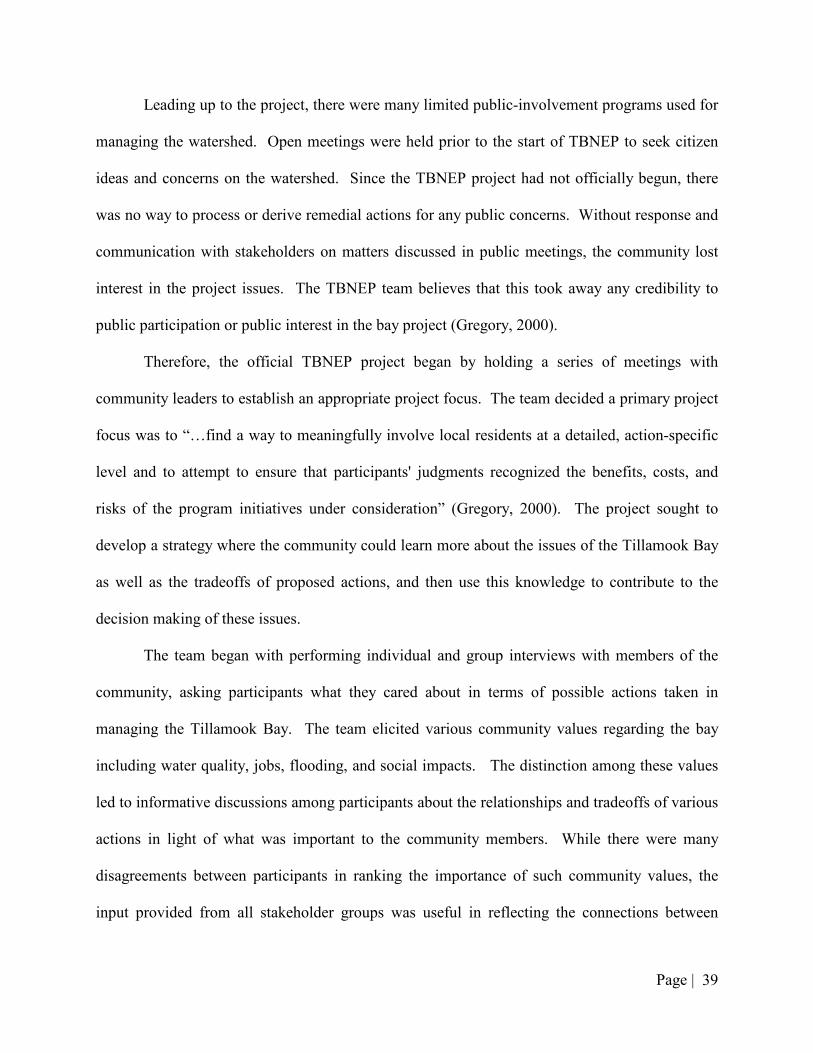
Page |
39
Leading up to the project, there were many limited public-involvement programs used for
managing the watershed. Open meetings were held prior to the start of TBNEP to seek citizen
ideas and concerns on the watershed. Since the TBNEP project had not officially begun, there
was no way to process or derive remedial actions for any public concerns. Without response and
communication with stakeholders on matters discussed in public meetings, the community lost
interest in the project issues. The TBNEP team believes that this took away any credibility to
public participation or public interest in the bay project (Gregory, 2000).
Therefore, the official TBNEP project began by holding a series of meetings with
community leaders to establish an appropriate project focus. The team decided a primary project
focus was to “…find a way to meaningfully involve local residents at a detailed, action-specific
level and to attempt to ensure that participants' judgments recognized the benefits, costs, and
risks of the program initiatives under consideration” (Gregory, 2000). The project sought to
develop a strategy where the community could learn more about the issues of the Tillamook Bay
as well as the tradeoffs of proposed actions, and then use this knowledge to contribute to the
decision making of these issues.
The team began with performing individual and group interviews with members of the
community, asking participants what they cared about in terms of possible actions taken in
managing the Tillamook Bay. The team elicited various community values regarding the bay
including water quality, jobs, flooding, and social impacts. The distinction among these values
led to informative discussions among participants about the relationships and tradeoffs of various
actions in light of what was important to the community members. While there were many
disagreements between participants in ranking the importance of such community values, the
input provided from all stakeholder groups was useful in reflecting the connections between
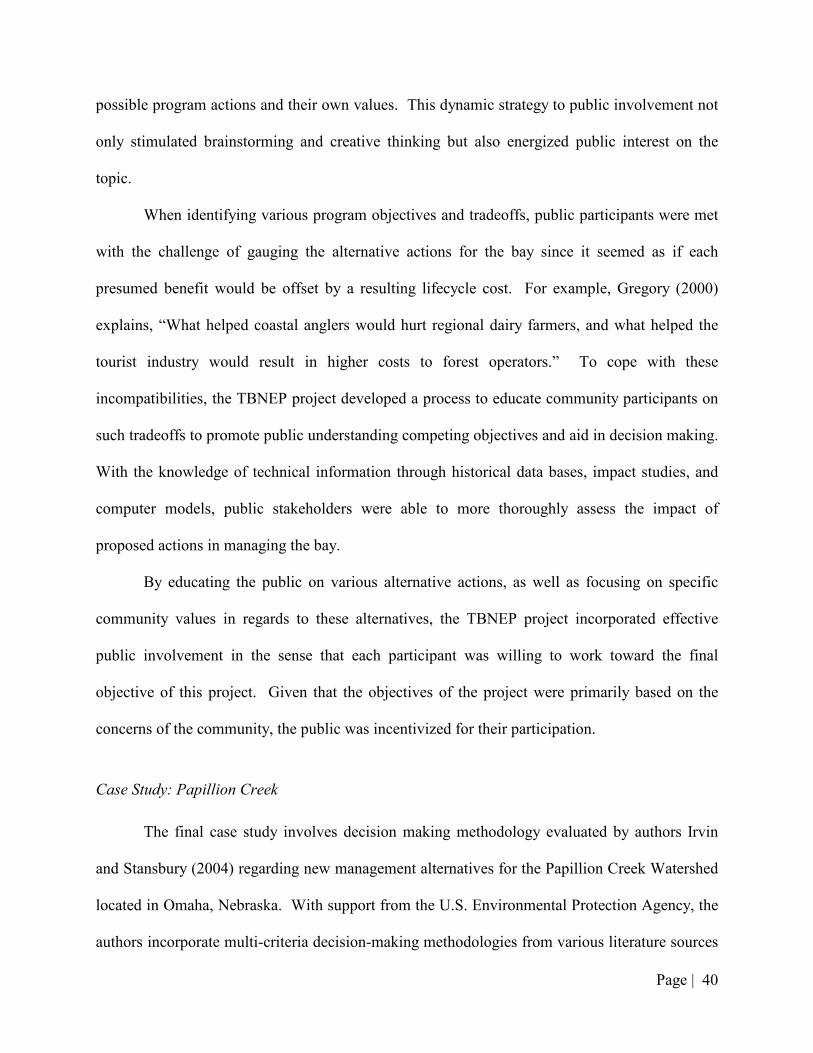
Page |
40
possible program actions and their own values. This dynamic strategy to public involvement not
only stimulated brainstorming and creative thinking but also energized public interest on the
topic.
When identifying various program objectives and tradeoffs, public participants were met
with the challenge of gauging the alternative actions for the bay since it seemed as if each
presumed benefit would be offset by a resulting lifecycle cost. For example, Gregory (2000)
explains, “What helped coastal anglers would hurt regional dairy farmers, and what helped the
tourist industry would result in higher costs to forest operators.” To cope with these
incompatibilities, the TBNEP project developed a process to educate community participants on
such tradeoffs to promote public understanding competing objectives and aid in decision making.
With the knowledge of technical information through historical data bases, impact studies, and
computer models, public stakeholders were able to more thoroughly assess the impact of
proposed actions in managing the bay.
By educating the public on various alternative actions, as well as focusing on specific
community values in regards to these alternatives, the TBNEP project incorporated effective
public involvement in the sense that each participant was willing to work toward the final
objective of this project. Given that the objectives of the project were primarily based on the
concerns of the community, the public was incentivized for their participation.
Case Study: Papillion Creek
The final case study involves decision making methodology evaluated by authors Irvin
and Stansbury (2004) regarding new management alternatives for the Papillion Creek Watershed
located in Omaha, Nebraska. With support from the U.S. Environmental Protection Agency, the
authors incorporate multi-criteria decision-making methodologies from various literature sources
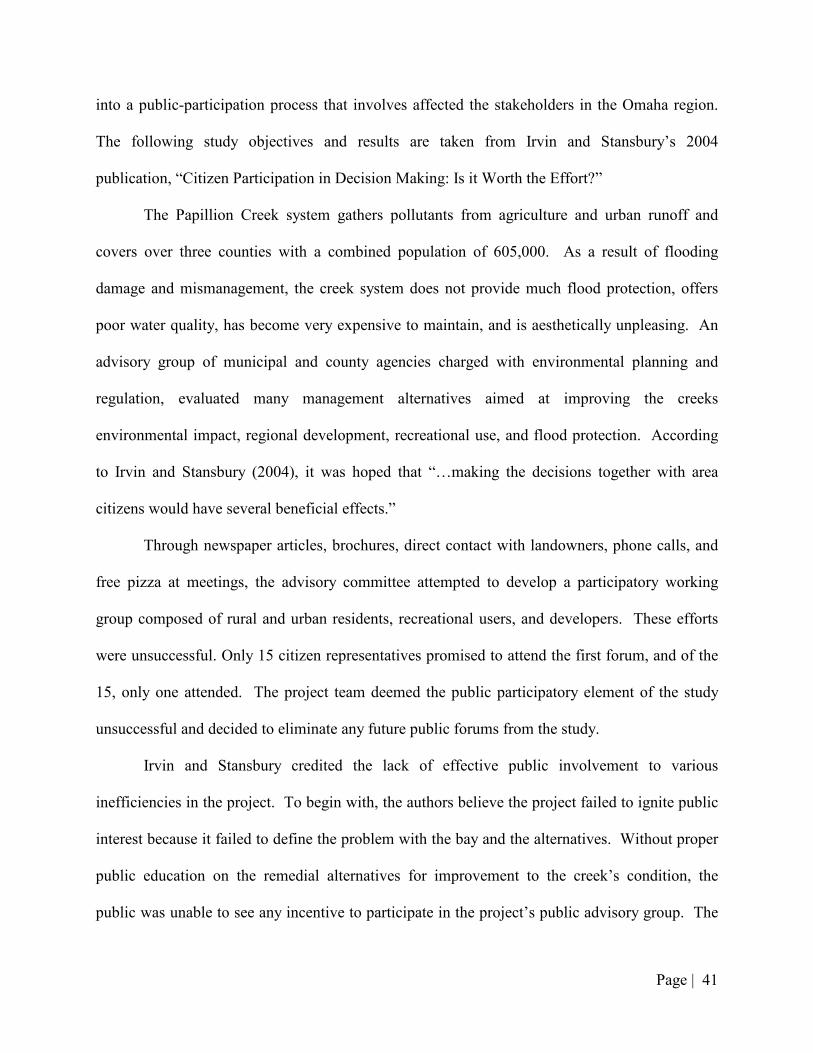
Page |
41
into a public-participation process that involves affected the stakeholders in the Omaha region.
The following study objectives and results are taken from Irvin and Stansbury’s 2004
publication, “Citizen Participation in Decision Making: Is it Worth the Effort?”
The Papillion Creek system gathers pollutants from agriculture and urban runoff and
covers over three counties with a combined population of 605,000. As a result of flooding
damage and mismanagement, the creek system does not provide much flood protection, offers
poor water quality, has become very expensive to maintain, and is aesthetically unpleasing. An
advisory group of municipal and county agencies charged with environmental planning and
regulation, evaluated many management alternatives aimed at improving the creeks
environmental impact, regional development, recreational use, and flood protection. According
to Irvin and Stansbury (2004), it was hoped that “…making the decisions together with area
citizens would have several beneficial effects.”
Through newspaper articles, brochures, direct contact with landowners, phone calls, and
free pizza at meetings, the advisory committee attempted to develop a participatory working
group composed of rural and urban residents, recreational users, and developers. These efforts
were unsuccessful. Only 15 citizen representatives promised to attend the first forum, and of the
15, only one attended. The project team deemed the public participatory element of the study
unsuccessful and decided to eliminate any future public forums from the study.
Irvin and Stansbury credited the lack of effective public involvement to various
inefficiencies in the project. To begin with, the authors believe the project failed to ignite public
interest because it failed to define the problem with the bay and the alternatives. Without proper
public education on the remedial alternatives for improvement to the creek’s condition, the
public was unable to see any incentive to participate in the project’s public advisory group. The
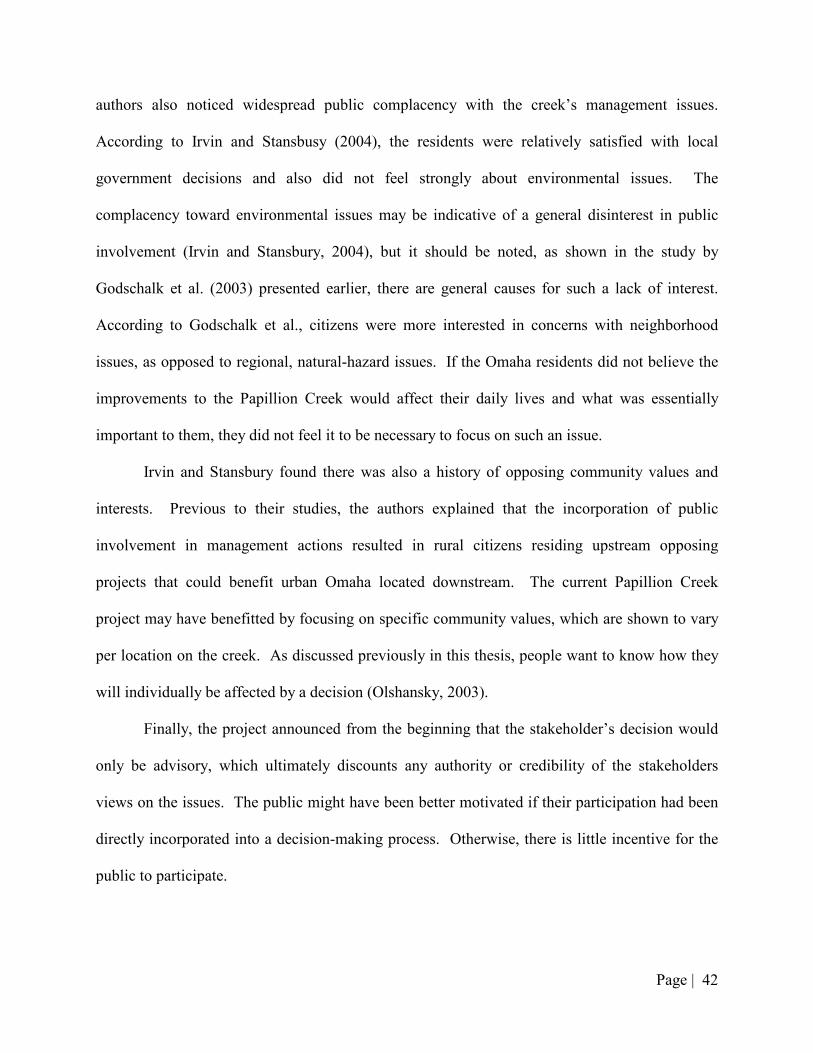
Page |
42
authors also noticed widespread public complacency with the creek’s management issues.
According to Irvin and Stansbusy (2004), the residents were relatively satisfied with local
government decisions and also did not feel strongly about environmental issues. The
complacency toward environmental issues may be indicative of a general disinterest in public
involvement (Irvin and Stansbury, 2004), but it should be noted, as shown in the study by
Godschalk et al. (2003) presented earlier, there are general causes for such a lack of interest.
According to Godschalk et al., citizens were more interested in concerns with neighborhood
issues, as opposed to regional, natural-hazard issues. If the Omaha residents did not believe the
improvements to the Papillion Creek would affect their daily lives and what was essentially
important to them, they did not feel it to be necessary to focus on such an issue.
Irvin and Stansbury found there was also a history of opposing community values and
interests. Previous to their studies, the authors explained that the incorporation of public
involvement in management actions resulted in rural citizens residing upstream opposing
projects that could benefit urban Omaha located downstream. The current Papillion Creek
project may have benefitted by focusing on specific community values, which are shown to vary
per location on the creek. As discussed previously in this thesis, people want to know how they
will individually be affected by a decision (Olshansky, 2003).
Finally, the project announced from the beginning that the stakeholder’s decision would
only be advisory, which ultimately discounts any authority or credibility of the stakeholders
views on the issues. The public might have been better motivated if their participation had been
directly incorporated into a decision-making process. Otherwise, there is little incentive for the
public to participate.
Page |
43
Case Study Comparison
While implementation of a successful public-participation approach in environmental
decision making can be challenging, the ultimate goals are to provide policy makers with
improved insight about the decision at hand and promote support from stakeholders. Through
these three case studies, it has been shown that educating the public on the issue and alternatives
is beneficial for drawing interest to the issue. Focusing an issue on the framework of community
values also promotes public interest, but more importantly, allows the public to see how they are
affected by an issue with the objective of promoting support for risk mitigation. Finally, these
case studies have shown that public involvement benefits from a clear acknowledgement of
stakeholder views and concerns. Without credibility and concern for public viewpoints, the
public lacks incentive to participate. Using the knowledge of stakeholder input, policy makers
are then able to advocate a specific project or decision with a complete understanding of possible
concerns as well as the ability to satisfy the views of constituents.
3.3 Focus on Community Values
At a Christmas function this past year, the author of this thesis was discussing the subject
of hazard mitigation with a friend’s mother who lives in San Francisco. When asked what her
thoughts were on a bill for mandatory retrofit of under-designed public and private buildings in
San Francisco, she responded “I would like to know what this means to me.” She explained that
beyond announcing such an action is mandatory and will make the City a safer place, she would
be interested in the specific benefits of mandatory retrofit to her family. For example, would her
children be safer at their school? How much safer would her family be in their house? Would
she see benefits with her job specific to the local economy? She explained that many of her
peers in San Francisco would not spend money and time on hazard mitigation and preparedness
Page |
44
without more understanding of how it would personally affect them. She believes people would
be more interested in hazard mitigation if the City’s seismic risk was assessed in light of the
values and actions that comprise a resident’s daily life (Rough, 2011).
Obviously it is neither expected nor reasonable for engineers or hazard mitigation policy
proponents to explain to each resident how retrofit would affect their individual lives.
Nonetheless, as the National Research Council (1996) explains risk communication must address
what interested and affected parties believe may be at risk. A high-level evaluation of the
possible financial loss or fatalities due to a natural hazard may not incorporate many values
important to a community. While some of the direct and indirect costs of natural hazard damage
are measurable, some are nonfinancial and/or difficult to quantify in dollars. As presented
previously in this thesis, these values may include community character, architecture, local
economy, rental property vacancy, etc.
This thesis presents two examples that illustrate successful hazard mitigation through the
retrofit or removal of public infrastructure. Both successes can be accredited to assessing the
benefits of risk reduction on the framework of specific community assets. A third example will
be presented where successful seismic safety was piggy-backed on more pertinent issues to
society involving regional values.
Case Study: Bay Bridge
After a 250-ton section of the Bay Bridge upper deck collapsed during the Loma Prieta
Earthquake of 1989, it was obvious that the peoples of the San Francisco Bay area had to
increase the seismic safety of the bridge. Even though the bridge opened within a month after
the collapse, San Francisco got a taste of what life was like without such a vital regional lifeline
structure. As one of the longest spans in the world, the Bay Bridge accommodates over 280,000
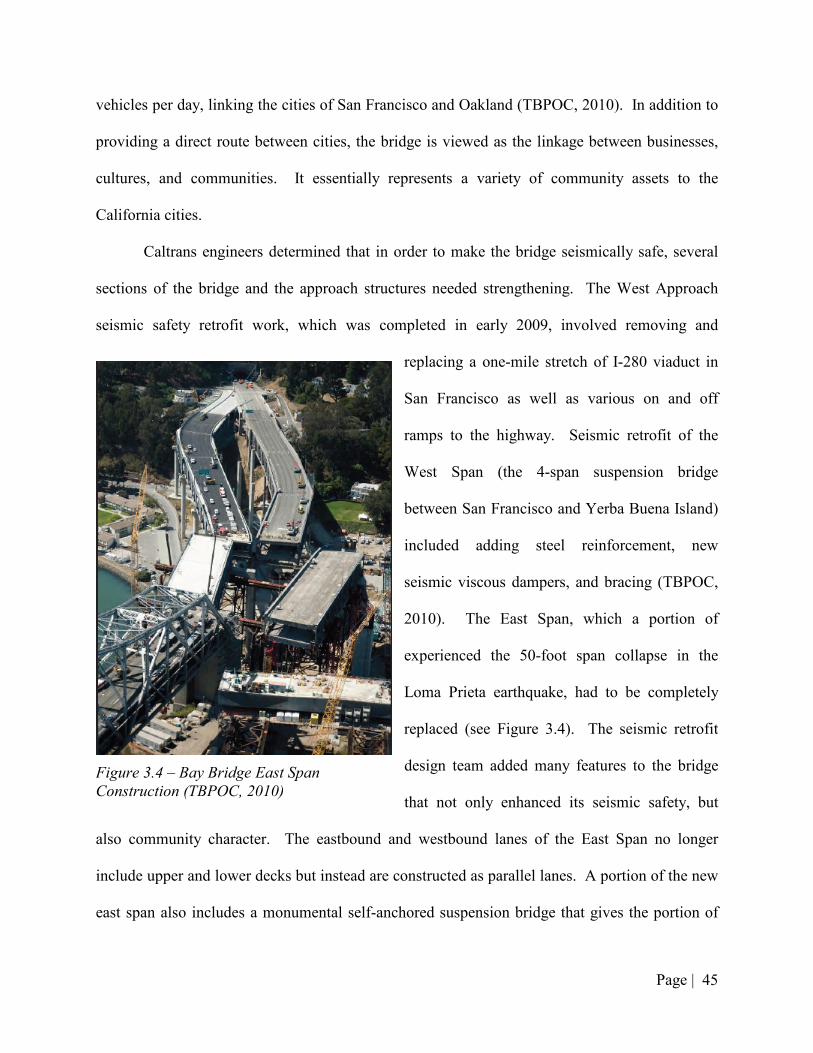
Page |
45
vehicles per day, linking the cities of San Francisco and Oakland (TBPOC, 2010). In addition to
providing a direct route between cities, the bridge is viewed as the linkage between businesses,
cultures, and communities. It essentially represents a variety of community assets to the
California cities.
Caltrans engineers determined that in order to make the bridge seismically safe, several
sections of the bridge and the approach structures needed strengthening. The West Approach
seismic safety retrofit work, which was completed in early 2009, involved removing and
replacing a one-mile stretch of I-280 viaduct in
San Francisco as well as various on and off
ramps to the highway. Seismic retrofit of the
West Span (the 4-span suspension bridge
between San Francisco and Yerba Buena Island)
included adding steel reinforcement, new
seismic viscous dampers, and bracing (TBPOC,
2010). The East Span, which a portion of
experienced the 50-foot span collapse in the
Loma Prieta earthquake, had to be completely
replaced (see Figure 3.4). The seismic retrofit
design team added many features to the bridge
that not only enhanced its seismic safety, but
also community character. The eastbound and westbound lanes of the East Span no longer
include upper and lower decks but instead are constructed as parallel lanes. A portion of the new
east span also includes a monumental self-anchored suspension bridge that gives the portion of
Figure 3.4 – Bay Bridge East Span
Construction (TBPOC, 2010)
Page |
46
the bridge between Yerba Buena Island and Oakland new character and architectural appeal
generally felt to be lacking in the heavy truss structure it replaces. The new bridge also provides
motorists with more expansive views of the Bay (TBPOC, 2010). Reconstruction plans also
include a new pedestrian and bike path, which adds another community asset for the surrounding
cities (TBPOC, 2010).
The values that accompany linking the two cities together gives much more value to the
Bay Bridge than simply a transportation route. By incorporated new aesthetic and functionality
features into the bridge reconstruction, the retrofit projects are also increasing the bridge’s value
to the neighboring communities.
Case Study: San Francisco City Hall
Built in the late 1800’s, the San Francisco City Hall is considered one of the finest
examples of classical architecture in the country (Malloy). The City Hall was rebuilt between
1913 and 1915, after being destroyed by the 1906 San Francisco earthquake. While the structure
remained standing after the 1989 Loma Prieta Earthquake, cracks in the structure’s walls and
slabs rendered it seismically unsafe. In June 1990, San Francisco voters passed a $332.4 million
general-obligation bond for repair and seismic retrofitting of 191 city buildings damaged in the
Loma Prieta Earthquake, including City Hall (SEAONC). In November 1995, San Francisco
voters approved a $63.5 million general obligation bond issue for funding for additional
improvements to City Hall (SEAONC).
Retrofits included the installation of 530 lead-rubber base isolators, making the San
Francisco City Hall the world’s largest base-isolated building at the time (Malloy). The
strengthening also included a new ground floor constructed above the isolators, additional
concrete shear walls with steel collectors to transfer seismic forces to the walls, additional
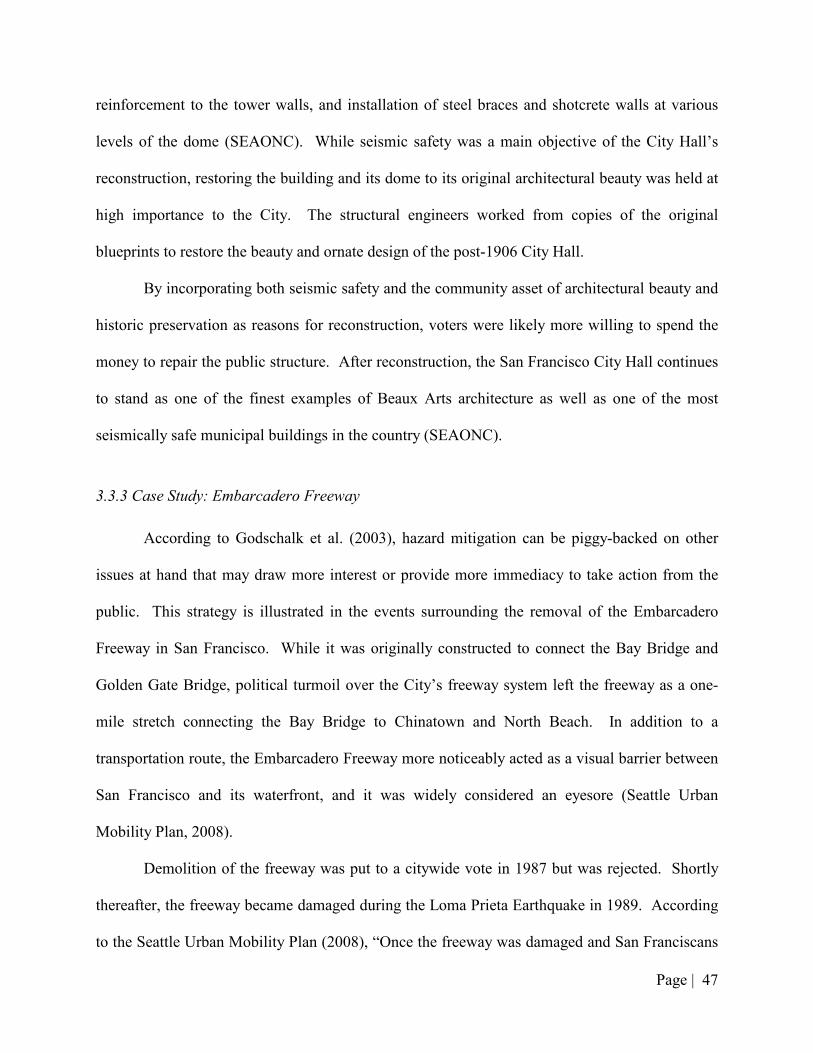
Page |
47
reinforcement to the tower walls, and installation of steel braces and shotcrete walls at various
levels of the dome (SEAONC). While seismic safety was a main objective of the City Hall’s
reconstruction, restoring the building and its dome to its original architectural beauty was held at
high importance to the City. The structural engineers worked from copies of the original
blueprints to restore the beauty and ornate design of the post-1906 City Hall.
By incorporating both seismic safety and the community asset of architectural beauty and
historic preservation as reasons for reconstruction, voters were likely more willing to spend the
money to repair the public structure. After reconstruction, the San Francisco City Hall continues
to stand as one of the finest examples of Beaux Arts architecture as well as one of the most
seismically safe municipal buildings in the country (SEAONC).
3.3.3 Case Study: Embarcadero Freeway
According to Godschalk et al. (2003), hazard mitigation can be piggy-backed on other
issues at hand that may draw more interest or provide more immediacy to take action from the
public. This strategy is illustrated in the events surrounding the removal of the Embarcadero
Freeway in San Francisco. While it was originally constructed to connect the Bay Bridge and
Golden Gate Bridge, political turmoil over the City’s freeway system left the freeway as a one-
mile stretch connecting the Bay Bridge to Chinatown and North Beach. In addition to a
transportation route, the Embarcadero Freeway more noticeably acted as a visual barrier between
San Francisco and its waterfront, and it was widely considered an eyesore (Seattle Urban
Mobility Plan, 2008).
Demolition of the freeway was put to a citywide vote in 1987 but was rejected. Shortly
thereafter, the freeway became damaged during the Loma Prieta Earthquake in 1989. According
to the Seattle Urban Mobility Plan (2008), “Once the freeway was damaged and San Franciscans
Page |
48
began to live without it, the barrier it created on the waterfront made it a stronger candidate for
demolition.” When the freeway was demolished in 1991, not only was the city asset of an
aesthetic waterfront view enhanced, but also seismic risk associated with motorists using the
bridge was reduced.
Reclamation of the waterfront view was likely a contributing factor to local industries
flourishing. San Francisco’s tourism industry grew following the freeway removal. Between
1995 and 2000, visitor spending citywide increased 39% (Seattle Urban Mobility Plan, 2008). In
2006, visitors to San Francisco spent $7.76 billion, the highest total in the city’s history (Seattle
Urban Mobility Plan, 2008). The double-deck freeway was soon replaced with a boulevard that
raised property values in the surrounding neighborhoods by 300 percent and stimulated
development dramatically (Boyd, 2010). Neighborhoods, retail centers, and recreational
facilities were rebuilt. The City’s main ferry terminal called the Ferry Building, which was
vacant for years preceding the Embarcadero Freeway removal, was redeveloped as a center for
gourmet and natural food (Boyd, 2010). The Embarcadero Center, a five-block commercial
district located between San Francisco's Financial and Waterfront Districts, explains on their
website that “The Embarcadero Roadway Project has led to an entire renewal of the Downtown
Waterfront District that is ensuring a bright future for the Embarcadero Center” (Embarcadero
Center).
The overwhelming dislike for the visual barrier that came along with the Embarcadero
Freeway left little need for promoting the removal of this bridge for seismic safety. However,
this example does illustrate that seismic safety can be achieved by focusing attention on other
community values. By incorporated hazard mitigation into more noticeable issues, communities
may be able to achieve seismic safety through future planning more easily.
Page |
49
3.4 Overcoming Incompatibility of Lifetimes
As discussed early, a major challenge with implementing a plan to retrofit inadequate
structures is the prevalent incompatibility between policies for long-term sustainability and the
political motivation for re-election. With a political term of around two to six years, the inherent
rationale of a decision maker is dictated by low risk decisions with immediate returns and
recognition from society. Without proper understanding of seismic risk, the public is less likely
to reward long-term risk reduction decisions that provide mitigation against future damages from
low-probability natural-hazard events. To bridge the gap between the future well-being of a
community and political decision making, it is necessary to develop communication tools which
allow a politician to make decisions that may sacrifice immediate benefits for their
constituencies but promote long-term sustainability.
With the goal of getting re-elected, the political rationale is primarily based on the public
response to his or her decisions. While public response is often dictated on perceived benefits, it
is necessary to develop tools which allow the public to see and gauge the benefits of both
immediate decisions but also decisions of a larger time scale. For example, while the public is
able to immediately see the benefits in investing in a spring carnival or other community events,
the benefits of retrofitting against an earthquake may go unnoticed for years or decades until an
earthquake occurs. Therefore, the challenge is to bring public recognition and accountability to
the election process in regard to long-term sustainability. By implementing strategies that
promote a sense of accountability for risk mitigation decisions of a larger time scale, the public
as well as their political leaders are incentivized to focus on long-term planning.
There have been many methods both implemented and suggested that promote public and
political accountability through quantifying various risks to society. One option is the use of a
Page |
50
public report of the seismic risk to infrastructure in a community. This report helps enables the
public to perceive the benefits associated with risk mitigation decision making and therefore
reward such political action. In this section, two different risk-reporting methods are presented
and compared. The first method consists of various infrastructure report cards and status updates
issued by the American Society of Civil Engineers (ASCE) since 1998. This rating system
presents the current state of infrastructure and provides potential solutions for improvement that
can be used as a guide for policy decisions. The second reporting technique is proposed by Ross
Corotis, a Professor at the University of Colorado at Boulder. This method incorporates a
similar strategy of quantifying current risk levels of existing infrastructure, but also quantifies the
risks, costs, and benefits associated with new or proposed structures or retrofit activity. In
contrast to the ASCE report card, Corotis’ proposed reporting would be published prior to local
jurisdiction elections, and is intended to rate infrastructure risk at a more local community level
(Corotis, 2010).
The concept of the ASCE report card to grade the nation’s infrastructure originated in
1988 as a reporting tool used by the commission titled the National Council on Public Works
Improvement. The commission released a report titled Fragile Foundations: A Report on
America’s Public Works where the council issued recommendations on how to improve the
nation’s infrastructure. As a method to guide the authors when evaluating the infrastructure, a
rating in the form of a report card was established that assigned letter grades based on
infrastructure performance and capacity.
Nearly a decade later, ASCE issued the first infrastructure rating titled the Report Card
for America’s Infrastructure. Unlike the 1988 report, the new reporting rates the current state of
infrastructure, and also provides solutions for improvement. To establish the grading system,
Page |
51
ASCE formed an advisory panel of the nation’s prominent civil engineers. The advisory panel
analyzes hundreds of studies, reports, and surveys thousands of engineers to determine the state
of infrastructure per region (ASCE). The national report card evaluates 14 categories of
infrastructure including the following (ASCE):
• Aviation • Bridges • Dams • Drinking Water • Energy • Hazardous Waste • Inland Waterways • Levees • Public Parks and Recreation • Rail • Schools • Solid Waste • Transit • Wastewater
Each state can focus on specific infrastructure categories that are of most importance, and
develop individual goals and objectives. While relevant for most states, the California
Infrastructure Report Card Committee states a short-term goal is to “Educate the public and
political leadership so that they will be supportive of developing, enacting and implementing the
practices and funding mechanisms needed to realize our long term vision” (ASCE California).
In addition to developing ways to improve the state’s infrastructure, the California Infrastructure
Report Card Committee explains that it is used to raise the public awareness of the risks and
challenges policy makers face in maintaining public infrastructure. By educating the public on
infrastructure risk, the desired outcome is to essentially raise public accountability for such risks
and increase support of infrastructure funding initiatives and fees (ASCE California).
Page |
52
When the Fragile Foundations report was released in 1988, the nation’s infrastructure
earned an overall grade of a C. Two decades later, the latest 2009 Report Card assigned an
overall D grade and estimated that it would take a $2.2 trillion investment from all levels of
government over the next five years to bring it into a state of good repair. Though some
infrastructure categories have achieved a higher grade over the past two decades, it is noteworthy
that the nation’s infrastructure has essentially deteriorated over the years. With the goal of
raising public risk perception, and guiding decision making to improve the nation’s
infrastructure, the reduction in infrastructure rating shows that there may be areas for
improvement in the overall implementation of the Report Card. The method proposed by
Corotis may provide insight into modifications to the ASCE reporting system.
Corotis (2010) suggests a similar reporting system in the form of a financial-based report
card for accounting infrastructure risk to society. On a regular basis, the proposed report would
include a present value analysis of public infrastructure within a region. This would include not
only the current risk levels and implied future costs of all existing infrastructure but also the
costs, risks, and benefits associated with new or proposed structures. Previous risk levels can be
compared with current levels of risks, as well as risk associated with proposed structures or
retrofit. According to Corotis (2010), “If nothing had been done to improve the efficiency and
lifetime safety of existing infrastructure, this would be reflected in the report.” Titled
Infrastructure Risk and Accountability Trust Evaluation card (Infrastructure RATE card), the
report would include the total risk and expected future maintenance and operation cost imposed
on the public.
While many aspects of the Infrastructure RATE card would need further examination, a
draft version of the reporting method is illustrated in the Table 3.2. The report system is set up
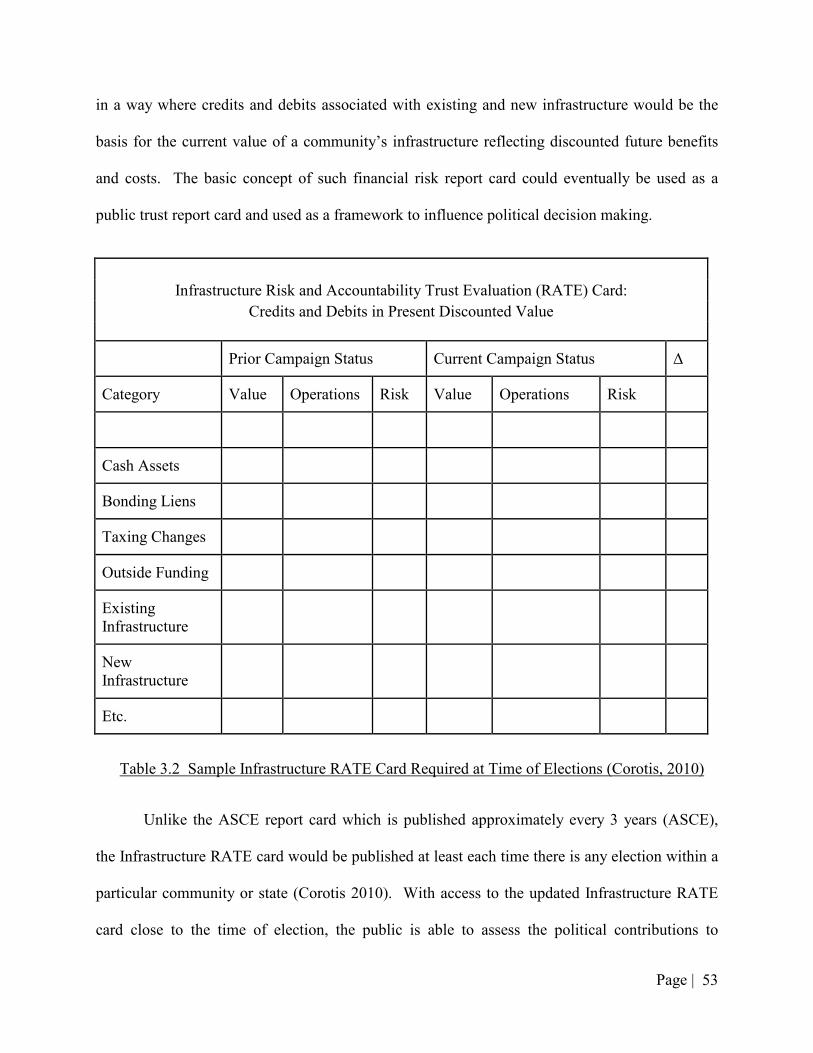
Page |
53
in a way where credits and debits associated with existing and new infrastructure would be the
basis for the current value of a community’s infrastructure reflecting discounted future benefits
and costs. The basic concept of such financial risk report card could eventually be used as a
public trust report card and used as a framework to influence political decision making.
Infrastructure Risk and Accountability Trust Evaluation (RATE) Card:
Credits and Debits in Present Discounted Value
Prior Campaign Status Current Campaign Status ∆
Category Value Operations Risk Value Operations Risk
Cash Assets
Bonding Liens
Taxing Changes
Outside Funding
Existing Infrastructure
New Infrastructure
Etc.
Table 3.2 Sample Infrastructure RATE Card Required at Time of Elections (Corotis, 2010)
Unlike the ASCE report card which is published approximately every 3 years (ASCE),
the Infrastructure RATE card would be published at least each time there is any election within a
particular community or state (Corotis 2010). With access to the updated Infrastructure RATE
card close to the time of election, the public is able to assess the political contributions to
Page |
54
infrastructure improvement. The reporting would also show if nothing has been done to reduce
infrastructure risk and therefore could serve as a guide to elect a more beneficial policy maker
for the sustainability of a community.
Another difference between the ASCE Report Card and the Infrastructure RATE card is
the community scale with which the risk is reported. The ASCE Report Card rates the condition
and capacity of infrastructure at a national and state level with only a handful of county ratings.
The Infrastructure RATE card is designed to quantify risk at larger scales but also at the
community level. It has been noted throughout this thesis that some communities may focus
their concerns on local policy issues to a greater degree than high level matters of a larger scale.
With a more personalized approach, the Infrastructure RATE card may increase a community’s
risk perception as they may feel more directly affected and accountable for infrastructure risk.
Perhaps if the ASCE Report Card identified infrastructure condition and capacity in more local
jurisdictions, public interest and awareness would increase, encouraging support for risk
mitigation policy making.
While the ASCE Report Card and Infrastructure RATE card differ in methods of risk
measurement, time period, and community scale of risk evaluation, both methods share the
objective of raising public awareness and improving the nation’s public infrastructure. These
reporting techniques provide a method of bringing public recognition and political accountability
to long-term policy decision making.
3.5 Cost Presentation Methods
A benefit-cost analysis (BCA) is a financial comparison method presented earlier in this
thesis for allowing the public and political leaders to understand the balance between risk and
return. Comparing the costs and benefits of a proposed action allows investors and stakeholders
Page |
55
to determine the economic return to potential risk mitigation interventions and to support
comparison between available alternatives. It should be noted that economic criteria are not the
only parameter by which projects are judged, however the ProVention Consortium states, “…in
the face of tight budgetary constraints and many competing demands for public resources, there
is widespread pressure to demonstrate that government funding and international aid resources
are well spent.”
As discussed earlier, the public uses multiple criteria and often varying measures to
assess the future benefits and risks associated with risk reduction (Corotis and Gransberg, 2006).
This provides many limitations to the cost-benefit analysis, including the increased sensitivity to
discounting in natural hazard events analyzed often over a timeframe of many decades. The
discount rate to be used for environmental long-term issues has become a controversial issue in
the engineering world, along with the incorporation of psychological time-variant influence into
an otherwise constant economic discount rate. Other key topics discussed which influence the
effectiveness of using financial based methods when communicating risk include present vs.
annual cost presentation methods and assumptions regarding time period.
Throughout this research, it has become apparent that these cost presentation topics have
been met with varying viewpoints. The controversy itself can reflect the psychological nature
behind these topics and the fact that people see these issues from different perspectives. In order
to explore these concepts more, discussions were held with four professional who are very
knowledgeable and highly educated on the concepts of natural hazard risk and risk mitigation.
The professionals who participated in this study were engineers Keith Porter, Research Professor
at the University of Colorado at Boulder, Jim Harris, Principal of J.R. Harris and Company,
Laura Samant, Associate Project Manager of the CAPSS project, and social scientist Kathleen
Page |
56
Tierney, Director of the Natural Hazards Research and Applications Information Center, Institute
of Behavioral Science. It is hoped that these discussions will provide insight into the differing
attitudes of engineering risk professionals and socialists alike on discounting and cost
presentation methods. The discussion questions and complete responses are located in Appendix
C.
As discussed previously in this paper, the use of a constant discount rate for
environmental consequences is controversial since over a longer time horizon, future monetary
and life safety benefits become trivial. The first question of the discussion elicits the
participants’ viewpoints on whether they believe using a constant discount rate to discount all
future benefits is appropriate for a benefit-cost analysis for natural hazard mitigation. Porter and
Harris agree with using a constant discount rate to discount monetary benefits. According to
Harris, “In controlling economic loss, one must pick a discount rate, but the discount rate used
could vary by the circumstances.” Harris explains that one may adopt different discount rates for
different kinds of physical elements. For instance, in Memphis where there are only a few
significant bridges, losing one bridge may severely impact the overall economy. For such
important public infrastructure, a lower tolerance for future loss must be taken into account in a
cost-benefit analysis. He explains a higher tolerance for loss may be incorporated in the analysis
of a bridge over a little creek that has four alternate routes within 2 miles where the significance
of the bridge not collapsing is much lower. Tierney’s response agreed with Harris in regard to a
varying discount rate per event, but also expanded on the fact that each individual may have his
or her own discount rate. She explains, “Perhaps the choice of weighting is individual. For
example, if the property in question is an historic family farm and the owner wants to give it to
his children, a much different discount rate may be used in a cost benefit analysis versus a typical
Page |
57
house.” Tierney adds that she has a difficult time with discount rates given there are multiple
costs and benefits that are both comparable and not comparable. According the Tierney, “In
light of the fact that there is a commensurability problem around benefits and costs, discount
rates should be used with caution.”
Professor Porter discusses the use of a constant discount rate further in respect to
discounting the benefits of life-safety. According to Porter, “Economists can offer rationale for
and against discounting human life, but the rationale only matters if I (or others like me) find it
compelling and integrate it into the value that we individually assign to a avoiding a statistical
fatality 100 years from now.” He explains that there is a difference between the price of
something and the perceived value. Since the value of a statistical fatality is a personal
judgment, it is difficult to assign a value, and even more an intergenerational value. Porter
believes the rationale offered by economists for intergenerational discounting of human life is
uncompelling, inconsistent, and fatally flawed, adding, “…if one accepts any positive discount
rate that applies perpetually, then at some point in the future, avoiding the fatalities of 1 million
people would be worth less to me now than the café mocha on my table.”
Previous discussion in this thesis introduced the incorporation of a psychological time
variant influence to a constant discount rate. Many authors believe that when discounting the
consequences of natural hazards, the discount rate should change with the time horizon (Percoco,
2002, Thaler, 1981, Corotis, 2010). When asked for her views on this topic, Tierney replied that
the topic of a time-variant discount rate is subject to much debate. She explains, “We must agree
what we are talking about as far as a time horizon goes. Often, a cost-benefit analysis is based
on a life expectancy that is shorter than the actual lifetime of a structure.”
Page |
58
Harris related a time varying discount rate to the factors of life safety built into safety
measures. For wind and snow loads, the importance factors that are applied to the loads have the
effect of reducing the probability of failure on some constant time basis. Harris adds, “This is
not accurate but it is a very rough approximation to think of risk categories for structure use.”
The building categories in ASCE range from Category 1 which is used for buildings which
present very little risk to human lives to Category 4 which is for buildings that pose the most risk
including facilities which contain hazardous materials. The time declining risk approximation
takes place in terms of people put at risk if the structure failed. Category 1 affects 100 people,
Category 2 affects 101 and 102, Category 3 affects 103 and Category 4 affects 104 people.
According to Harris, “If the potential life loss is a larger number, we’re going to design for a
higher level of safety, making failure a more rare event. That is like saying we are taking a time
discount on life safety.”
The next topic in the discussion dealt with the concept of presenting costs as a present
discounted value versus an equivalent annual value. As discussed previously, converting costs to
an equivalent annual cost versus a large present discounted value may provide justification for
political spending for long-term events (Corotis 2010). The participants in this study were
presented with a scenario of owning a commercial building with a 1% risk of significant damage
due to an earthquake each year. It was explained that it would cost $750,000 to retrofit the
building to dramatically increase its strength in an earthquake and the cost of damage without
retrofitting would be $4 million dollars. The participants were then presented with the cost and
benefits of retrofit using a present discounted value and an equivalent annual discounted value
and asked which they found to be most meaningful. Porter and Samant agreed that the method
of presentation depends on the user and the purpose of the cost benefit analysis. Porter explains,
Page |
59
“If I am responsible for institutional property, I would make my choice based on the presentation
I think will be most compelling or meaningful to … whoever I report to on capital investments.”
Porter believes the annual discounted value presentation to be more meaningful, particularly with
a loan involved, but would offer the present discounted value as another way to look at the
investment.
Tierney replied that she would likely not have a tendency to retrofit given either of the
cost presentation formats since her focus would be on the low 1% risk of a significant earthquake
each year. She comments that if the probability was expressed over a more effective time period,
her perception of risk may change. Porter agrees, adding, “If I am a real estate investor and plan
on holding the building for a normal investment period (3-10 years) … I find the investment
uncompelling in any case. Reason is that it is an investment with only a 3-10% chance of
producing any benefit. I do not believe the retrofit will have a market value when I sell the
building.”
The next discussion subject focused on the concept of a “scenario event”. Instead of
incorporating probabilities and discounting into a cost presentation analysis, many studies have
been basing there analysis on a particular earthquake scenario occurring at a specific time. For
example, the CAPSS study which will be presented in a case study later in the paper focuses
their analysis on the scenario that the earthquake will happen today. All participants in this study
agreed that this is simplification is beneficial for communicating risk to the general public and
policy decision makers. According to Harris, “When you are dealing with real risks in a time
frame that people can’t relate to, the scenario event tends to get around that.” Porter and Samant
agree that while statistically savvy groups such as insurance actuaries do prefer probabilistic
Page |
60
measures, a simpler approach is more effective to motivate public policy. Samant adds, “When
using a discount rate in general you’re losing a bunch of people.”
All of the participants did note the limitations of using a scenario event. According to
Samant, such a simple approach where one avoids the discount rate all together may present a
slightly inaccurate picture in terms of a cost-benefit comparison, but it provides an intrinsic sense
of risk to those who may not be familiar with probability and the time value of money. As a
caveat, Samant adds that earthquake and retrofit scenarios do make a lot of assumptions, which
may provide a range of error to a study. Tierney agrees, adding her own caveat that “Scenario
events are beneficial for the average decision maker, provided there is a range presented.”
It was also discussed that the way risk should be communicated would depend on the
specified audience. According to Samant, “For a sophisticated audience, like an insurance
company or staff of economists, risk can be communicated in a more complex and accurate
form” (Samant, 2011). Accuracy is particularly important during risk mitigation policy making
when finances, careers, and politics are involved. However, Samant adds, “When motivating
public policy where the public doesn’t think about discounting and probability on a daily basis,
go much simpler on your approach.” Therefore, the scenario approach is only appropriate in
certain circumstances.
The next discussion question elicited the participants’ thoughts on the use of an infinite
planning period versus a finite one. This question relates to previous discussion of Corotis’
(2009) hypothesis that longer design lifetimes provides additional political reward, and Keller et
al.’s (2006) notion that longer time periods provide increased risk perception. Discussion
participants were presented with the same previous scenario of owning a commercial building
and were presented with the discounted annual costs and benefits of retrofit given a structure
Page |
61
with a 50-year lifetime and one with an infinite lifetime. Samant and Porter agree that the use of
an extended lifetime is appropriate for large institutions. According to Samant, “For an
academic building, an infinite lifetime may make sense. But in the real world it may seem a little
unconnected.” Professor Porter discussed that he would tend to choose some middle ground
between 50 and infinite years for the lifetime of large institutions. He offers reference to the
lifetimes of various government institutions including the London County Hall which is nearly
90 years old and still in service as well as the Paris Hotel de Ville (its city hall) which is now 380
years old. Using these and others as reference, Porter explains that a 250-year lifetime seems to
be an appropriate compromise, which is long enough to be effectively infinite in a cost-benefit
analysis.
Harris and Tierney offer another direction when responding to this question, both
agreeing that people have difficulty thinking in terms of infinite years. According to Harris, “I
think that people who make decisions about cost-benefit ratios probably prefer to make decisions
on a deterministic time frame, not an amorphous time frame. It is similar to talking about a
fireproof or earthquake-proof building; there is no such thing.”
Finally, the last question in this study elicited any additional comments on cost
presentation methods. Porter provided a very interesting response, explaining that he does not
believe that a benefit-cost analysis is a sufficient basis for making natural-hazard risk-mitigation
decisions. According to Porter, “The most compelling reason is that it pays no attention to scale:
a 4:1 benefit-cost ratio means something very different when the absolute value of the benefit is
$4 at a cost of $1, versus when the benefit is $4 billion at a cost of $1 billion. The former is a
trivial issue, the latter very serious, but they both have a 4:1 benefit-cost ratio.” Porter also
explains that presenting benefits in a benefit-cost analysis does not offer a way to quantify the
Page |
62
existential threat some natural disasters can pose to a city or state. Porter offered the following
example: In the May 27th 1995 Sakhalin Island earthquake, the town of Neftegorsk was
effectively destroyed: approximately 2,000 of the 3,176 residents in the town were killed, and the
settlement has not been rebuilt (Ivashchenko et al., 1997). Porter explains that it is unclear how a
benefit-cost analysis can address such existential threats which are larger than the value of
avoiding the individual fatalities and property value loss.
While the responses to the discussion questions produced both similar and varying views
from the participants, this discussion does conclude that these topics remain controversial for a
reason. The engineering and social science professionals who participated in this study base
their responses on different views and experiences, which provide different insight into the cost
presentation topics discussed. Many professionals also added several caveats to their responses,
indicating the general open nature of such topics. For example, some participants support a
constant discount rate to discount monetary benefits in hazard mitigation benefit-cost analysis,
but the rate may vary per event and individual. Some participants support a time varying
discount rate, but there is debate on what is a proper time period. Perhaps an appropriate
conclusion to draw from this discussion is that there are no prescriptive definitions or rules when
using financial-based methods to communicate risk and return in risk mitigation decision
making. While the use of financial-based methods is essential in communicating risk, each cost
comparison method used in risk mitigation must take into account the various standards used to
assess future benefits and risks, specific to the decision making audience. As concluded in this
discussion, these standards may vary.
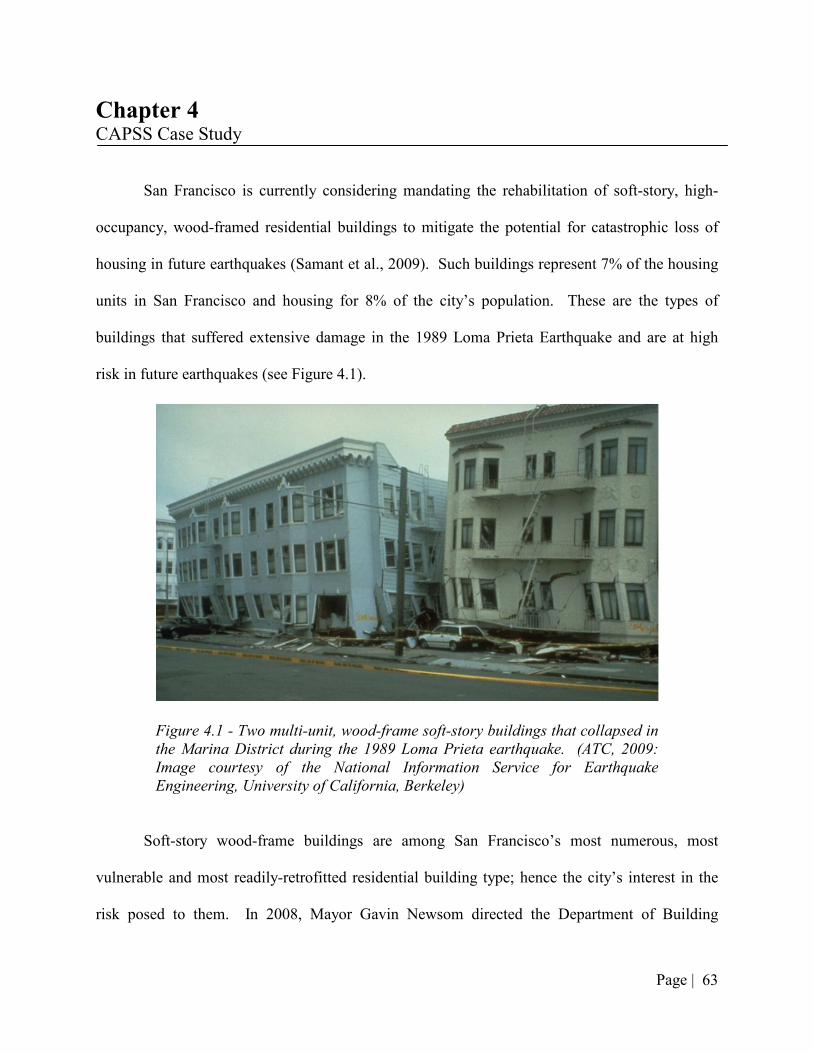
Page |
63
Chapter 4 CAPSS Case Study
San Francisco is currently considering mandating the rehabilitation of soft-story, high-
occupancy, wood-framed residential buildings to mitigate the potential for catastrophic loss of
housing in future earthquakes (Samant et al., 2009). Such buildings represent 7% of the housing
units in San Francisco and housing for 8% of the city’s population. These are the types of
buildings that suffered extensive damage in the 1989 Loma Prieta Earthquake and are at high
risk in future earthquakes (see Figure 4.1).
Figure 4.1 - Two multi-unit, wood-frame soft-story buildings that collapsed in
the Marina District during the 1989 Loma Prieta earthquake. (ATC, 2009:
Image courtesy of the National Information Service for Earthquake
Engineering, University of California, Berkeley)
Soft-story wood-frame buildings are among San Francisco’s most numerous, most
vulnerable and most readily-retrofitted residential building type; hence the city’s interest in the
risk posed to them. In 2008, Mayor Gavin Newsom directed the Department of Building
Page |
64
Inspection (DBI), through its project entitled The Community Action Plan for Seismic Safety
(CAPSS), to provide the City with a plan of action to reduce earthquake risks to this class of
building, and to produce guidelines for repair and rebuilding after an earthquake.
In order to develop a plan to reduce earthquake risks to soft-story buildings in San
Francisco, the CAPSS project team set the objective to identify how many multi-family wood-
frame soft-story residential buildings exist, in which neighborhoods, and how they are used. The
team then designed prototype structural retrofits to increase the structural safety of the soft-story
buildings to varying levels and calculated the costs of such retrofit options. The team studied
economic and safety implications of either retrofitting or not retrofitting and finally identified
various policy approaches to improve the seismic performance of such soft-story buildings in a
major earthquake. Details of the risk analysis can be found in Porter and Cobeen (2009).
Completed in January 2010, the soft-story portion of the CAPSS project was successful
in providing the City with a plan to reduce earthquake risks to soft-story buildings. While San
Francisco has yet to mandate the retrofit of seismically-deficient buildings as suggested by the
CAPSS team, the project was successful in showing that the suggested risk mitigation is
important to the City, and therefore encouraging change. In a CAPSS Advisory Committee
Meeting (2010), Laurence Kornfield, Chief Building Officer of San Francisco’s DBI, stated “The
CAPSS work was a groundbreaking step translating technical knowledge into new forms for
policymakers.” There were many strategies that led to the successful completion of the CAPSS
project with promising intentions to improve seismic safety and sustainability to the city San
Francisco. Such approaches implemented by the CAPSS team are discussed in light of the five
major strategies discussed in this paper: public education, public involvement, community
Page |
65
values, overcoming incompatibilities of lifetimes, and employing successful financial based
methods.
In a CAPSS Advisory Committee Meeting (2008), it was stated that one of the biggest
goals of the CAPSS project is to educate the public to the consequences of earthquake damage
and the meaning of resiliency. The team was able to achieve this goal by both involving the
public in most facets of the project as well as employing various communication strategies to
educate the public on San Francisco’s seismic risk.
As discussed earlier, a challenge in effectively communicating risk arises in the fact that
the general public has difficulty thinking in probabilistic terms (Patt and Schrag, 2003). Studies
have shown that since people often underestimate small probabilities, which are frequently
associated with natural hazards (Kahneman and Tversky, 2000), it is often advantageous to
simply focus on the consequences of an event as if it did occur as opposed to focusing on the
probability (Taleb, 2010). A similar approach was employed in the CAPSS soft-story study.
The CAPSS soft-story team decided to assess the benefits of the retrofitting by examining losses
to the entire stock of multifamily soft-story wood-frame dwellings, given the occurrence of four
scenario earthquakes, as opposed to performing a probabilistic risk assessment that would
consider all possible earthquakes and their likelihood of occurrence (ATC, 2010a). While the
analysis presentations to the public included mention of the likelihood of each earthquake
scenario under investigation, it was emphasized that each of the earthquakes had happened in the
past and could happen again at any time. The study was further simplified by focusing on the
costs and benefits of retrofitting against one scenario magnitude 7.2 earthquake on the San
Andreas Fault as if it did occur. By simplifying the presentation to one earthquake of a similar
magnitude to previous earthquakes, and explaining “this may happen tomorrow,” the
Page |
66
imaginability and “realness” of the event is likely to increase. This increase in availability often
correlates to a heightened risk perception (Slovic et al., 2004).
Past experience is an important factor in people’s perception of natural hazard risk
(Keller et al., 2006) and it has been shown that relating to past experiences has also influenced
the adoption of seismic hazard precautions (Jackson, 1981). The negative affect associated with
natural hazards may also be aroused through experimental manipulation (Keller et al., 2006). As
an aid to effectively communicate risk, the CAPSS presentations included images of the damage
to buildings similar to those existing in San Francisco today, from the 1906 San Francisco and
1989 Loma Prieta earthquakes. By including photos of the damage and collapse in previous
earthquakes and explaining that such an earthquake could happen again, the public is presented
with a negative affect that can influence their perception of risk.
Public involvement was widely used in the CAPSS project and as a result, increased
public education, addressed public concerns, and increased support for the program. The CAPSS
project was referred to as a community effort, and was guided by a volunteer Advisory
Committee, which included representatives from a number of neighborhood and community
groups, earthquake engineers, and officials of the City of San Francisco (CAPSS E-Newsletter
#2, 2009). The CAPSS Advisory Committee held monthly meetings open to the public where all
interested parties could provide input on the project and critical issues could be addressed. The
Committee also hosted various workshops, which were used to both educate the public and gain
public insight and concerns (CAPSS E-Newsletter #2, 2009). Local engineers, representatives
from neighborhood and community organizations, officials from the City of San Francisco and
members of the public participated in the extended discussions and many of the comments and
Page |
67
questions raised during the workshop were incorporated into the recommendations released in
various reports.
The options and analysis outcomes performed by the CAPSS team were presented to a
community group of building owners and tenants to consider what policy options ought to be
recommended to the City. While DBI officials, engineers, and other technical experts were in
attendance, the discussions and choice of policy recommendations were led by the community
group, not the technical personnel. The policy recommendations developed by the community
group were also strongly based on the framework of public education and involvement. In the
“Here Today Here Tomorrow: Community Action Plan Report” (2010) the CAPSS team
suggests the City of San Francisco inform the public of risks and ways to reduce risks through
focused education and outreach campaigns. The report says the campaigns should focus on
“…building owners, tenants, realtors, and others to improve their understanding of earthquake
risks and measures to manage the risks, and to facilitate the market for retrofitting” (ATC,
2010b).
A critical aspect of presenting the results of the CAPSS studies was consideration of
which metrics of seismic performance would be of greatest interest to the City. As discussed
earlier, people want to know how they will be directly affected by a decision. Accordingly, case
studies have shown that it is important to focus on what the affected parties believe to be at risk
in a particular situation (NRC, 1996; Olshansky, 2003; and Godschalk et al., 2003). Therefore
the question is: What community values matter most to the City of San Francisco? The CAPSS
soft-story team decided to focus analysis results on post-earthquake safety tag color (whether
residents would be allowed to re-enter their homes and businesses after the earthquake), whether
the dwellings would be repairable, and what the cost of repairs would be. The table below
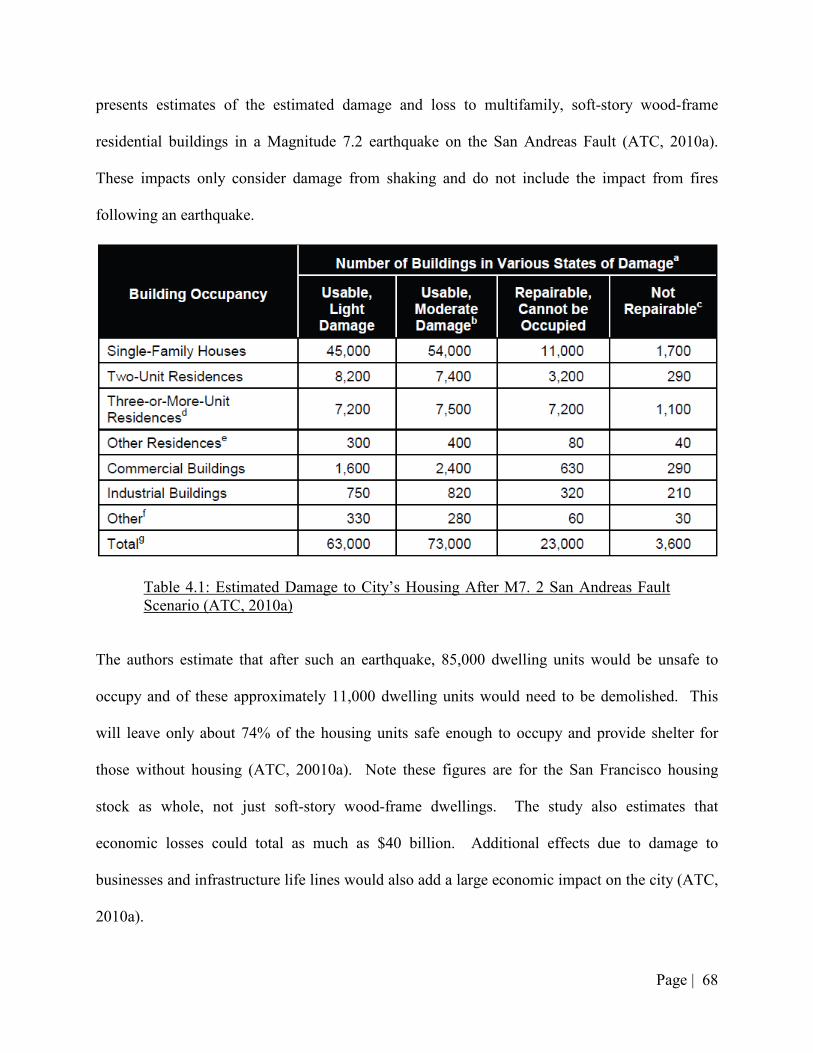
Page |
68
presents estimates of the estimated damage and loss to multifamily, soft-story wood-frame
residential buildings in a Magnitude 7.2 earthquake on the San Andreas Fault (ATC, 2010a).
These impacts only consider damage from shaking and do not include the impact from fires
following an earthquake.
Table 4.1: Estimated Damage to City’s Housing After M7. 2 San Andreas Fault Scenario (ATC, 2010a)
The authors estimate that after such an earthquake, 85,000 dwelling units would be unsafe to
occupy and of these approximately 11,000 dwelling units would need to be demolished. This
will leave only about 74% of the housing units safe enough to occupy and provide shelter for
those without housing (ATC, 20010a). Note these figures are for the San Francisco housing
stock as whole, not just soft-story wood-frame dwellings. The study also estimates that
economic losses could total as much as $40 billion. Additional effects due to damage to
businesses and infrastructure life lines would also add a large economic impact on the city (ATC,
2010a).
Page |
69
The study results also focus on more local community values, including the effects on
affordable housing, small businesses, historic buildings, and the overall unique character of the
city (ATC, 2009). In the first of four reports titled “Here Today-Here Tomorrow…Potential
Earthquake Impacts” the CAPSS team explains:
“The next major earthquake that strikes San Francisco will change the
City and its people. San Francisco is a world-class city with many special
attributes that draw businesses, innovative people who want to live here,
and visitors from around the world. In the long-term, San Francisco will
recover and thrive, but it will be a different San Francisco.”
Retrofitting vulnerable buildings would not only preserve the cultural and architectural
character of the city’s neighborhoods, but also affect housing affordability for low and middle
income residents (ATC, 2010b). After extensive earthquake damage, rent-controlled apartments
may no longer be under rent control once rebuilt. The study estimates that more than 900
commercial buildings and 500 industrial buildings would not be able to be occupied after a
Magnitude 7.2 San Andreas Fault scenario along with $4 to $11 billion in damage costs to
commercial buildings (ATC, 2010a). In addition to the property repair costs, the closing of
businesses creates direct and indirect business-interruption losses in the local economy across all
economic sectors. The CAPSS reports estimate the business-interruption losses due to a
Magnitude 7.2 San Andreas Fault earthquake would generate a loss of approximately $650
million in indirect activity, or business-to-business lost expenditures within the City of San
Francisco (ATC 2010b).
Page |
70
The presentations also included a socioeconomic analysis of who lived in the subject
buildings: residents’ ethnic, income, and other demographic characteristics; renter versus owner
occupancy; how many units are rent controlled; citywide residential vacancy rates; and other
relevant parameters. That is to say, the presentations focused on the concrete, specific,
accessible, and tangible parameters. In presentations, workshops, and reports including the
ATC-52-2 Report, A Community Action Plan for Seismic Safety, the CAPSS team explains that
much of this damage is preventable. Now that the risk of a major earthquake is presented in light
of the city’s values, it is up to San Franciscans to decide how much to invest in mitigation efforts
to reduce the consequences of future earthquakes.
In addition to focusing on public education and community values, overcoming the
incompatibility between political short-term goals and long-term planning is crucial in risk
mitigation decision making (Corotis, 2010). An interesting sequence of events unfolded in the
early stages of the CAPSS project that both increased political accountability and as a result,
helped overcome the chasm between political rewards and long-term sustainability. The CAPSS
project originally began work in 2000, but was suspended in early 2003 just before publication of
the study, reportedly due of a political rivalry unrelated to CAPSS. One of the rivals eventually
retired, and in 2006 the CAPSS project resumed. Some urgency was added in July 2008, shortly
after the May 2008 Sichuan, China earthquake. In an alarming news article in the San
Francisco’s major daily newspaper (Selna, 2008), a leading structural engineer shared his
opinions on the lack of risk mitigation in the City. As a result, Mayor Newsom issued an order
(Newsom, 2008) that directed CAPSS to quickly develop a mitigation policy for soft-story
residential buildings.
Page |
71
The mayor’s reaction may be viewed as an exigent political situation versus acting to
protect the public, but the notable aspect is that he took a proactive stance. This situation is an
example that decision-making outcomes are affected when the decision maker knows he or she is
being observed (Kerjan and Slovic, 2010). The Mayor was facing a public accusation of hiding
natural hazard risk, and he acted in a responsive manner.
Strategies in overcoming incompatibilities between political and infrastructure lifetimes
can also be seen in CAPSS final recommendations to the City of San Francisco. In the “Here
Today Here Tomorrow … Community Action Plan for Seismic Safety,” the CAPSS team
recommends important actions directed towards San Francisco’s government leaders to reduce
the consequences of future earthquakes. Many of these actions are intended to increase political
and public accountability in risk mitigation, and therefore encourage long-term planning.
According to the CAPSS authors, “Implementing earthquake mitigation measures needs
to be an ongoing concern of the City with standing equal to other programs” (ATC, 2010b). The
authors suggest that San Francisco establish a clear responsibility within city government for
preparing for and reducing the risk from earthquakes. The CAPSS team hopes that this will
clarify risk mitigation as a long-term effort and will not fade as people retire and other issues
emerge. The team recommends the City identify a single official within the Chief
Administrative Officer’s Office who will be responsible for achieving earthquake resilience by
carrying out current recommendations of the CAPSS project as well as working towards
additional risk mitigation strategies (ATC, 2010b). The report states that the office should also
work with an advisory committee comprised of neighborhood groups with varying interests.
Representative insights and concerns can provide valuable perspective and improved
accountability for the projects performance (ATC, 2010b).
Page |
72
Ideally the goal of the CAPSS project is to increase the number of seismic retrofits
voluntarily conducted by owners (ATC, 2010b). However, knowledge gained from the
Unreinforced Masonry Law (CSSC, 2006) indicates that many owners will not evaluate or
retrofit their buildings until required to do so. Under the Unreinforced Masonry Law, the
California Seismic Safety Commission recommended that the state legislature allow each
jurisdiction to establish its own loss-reduction program with the intentions of allowing each
jurisdiction to tailor the program to meet the community specific political, economic, and social
needs. Three main types of loss reduction programs emerged, including (1) mandatory
strengthening, (2) voluntary strengthening, and (3) notification only (CSSC, 2006). In the
California Seismic Safety Commission’s 2006 report on the status of the Unreinforced Masonry
Building Law, it was noted that 87% of the unreinforced masonry buildings in Mandatory
Strengthening Programs have either been retrofitted or demolished compared to 24% in
voluntary programs (CSSC, 2006). It was also noted that while voluntary programs were rarely
successful, they saw a higher success rate when incentives were established for retrofitting.
While there was a 20% rate of retrofit for the eight cities with voluntary programs and economic
incentives, the 31 jurisdictions without incentives had a 14% rate of retrofit (CSSC, 2006). This
lends to the conclusion that economic incentives can increase the rate of seismic risk reduction.
Taking this into consideration, the CAPSS team suggests that deadlines requiring
evaluations and retrofitting of weak buildings are needed to provide urgency to the issue. The
team believes that, “Requirements and deadlines show that earthquake risk is an issue the City
government takes seriously; in contrast, a purely voluntary program suggests that this issue is not
viewed as important” (ATC, 2010b).
Page |
73
The CAPSS authors also recommend offering incentives for retrofit of buildings. While
the owners are ultimately responsible for the seismic performance of their buildings, the City
also has an interest in reducing the amount of direct and indirect damage to San Francisco’s
privately owned building stock. Therefore, it only makes sense that the City should enact
various programs to encourage owners to retrofit and to increase their ability to afford the cost of
retrofitting. Incentives recommended by the CAPSS team include modifications to zoning
regulations, tax rebates, loans, and fee waivers (ATC, 2010b). The team also recommends
providing technical assistance and training programs to make retrofitting easier (ATC, 2010b).
In addition to political awareness and incentives to retrofit, public knowledge and
accountability also help provide political recognition for long-term planning (Corotis, 2010).
The CAPSS team suggests that all building owners should be required to get an engineering
evaluation of their buildings and compare the results to a designated minimum seismic retrofit
standard (ATC, 2010b). The results can then be shared with tenants and prospective buyers and
made part of the public city records, along with a required plan of future actions which will
reduce any seismic deficiencies. The seismic evaluation will allow prospective buyers and
building occupants to consider seismic issues when making decisions about purchasing, renting,
or using the building. The CAPSS team recommends the recorded seismic risk to be used to
assist in making decisions to retrofit and also be available as an input for market pricing of real
estate (ATC, 2010b). Publicizing seismic risk provides building owners with heightened
accountability for mitigating seismic risk for their buildings.
Finally, the CAPSS project utilizes strategic financial-based methods as a means of
providing an understanding to the public on the balance of risk and return for retrofitting. The
CAPSS authors decided to assess the risks and benefits of retrofitting by examining losses to the
Page |
74
entire stock of soft-story wood-frame multifamily residential buildings, given the occurrence of
four varying scenario earthquakes. The team also decided to examine four retrofit options, from
the do-nothing alternative, to an intensive ground-floor strengthening option. The CAPSS
authors believed the most meaningful way to interpret the economic losses and benefits due to
retrofitting is to compare the financial impact from the various earthquake scenarios and retrofit
schemes (ATC, 2010a).
Since it is uncertain when an earthquake will occur, the CAPSS authors decided to
present the costs and benefits of retrofitting as if the earthquake occurred today. By doing this,
the study avoided the issue of discounting future benefits and avoided a probabilistic risk
assessment (which would have included a number of uncertainties: the magnitude and location of
earthquakes, the date on which they occur, and so on). In reality, the present value of the
benefits of retrofitting would depend on when earthquakes occur, the discount rate chosen, etc.
By assessing the benefits as if the earthquake occurs today, the present value of the reduction in
future losses larger than if it is discounted. According to the CAPSS study, “It is reasonable to
expect an earthquake that is closer and, perhaps, larger than Loma Prieta to strike San Francisco
soon” (ATC, 2010a). As noted earlier, a statewide assessment of the likelihood of earthquakes
estimates that there is a 63 percent chance of at least one magnitude 6.7 or greater earthquake in
the Bay Area sometime in the period 2008-2037 (WGCEP, 2008). Therefore, assuming an
earthquake will happen in a scenario analysis is not an unrealistic assessment when
communicating risk to the general public.
The soft-story element of the CAPSS project examined how earthquake damage would
lessen in four scenario earthquakes if all 2,800 multi-unit wood-frame buildings studied were
retrofitted to each of the three retrofit schemes in addition to not retrofitting. To reflect the
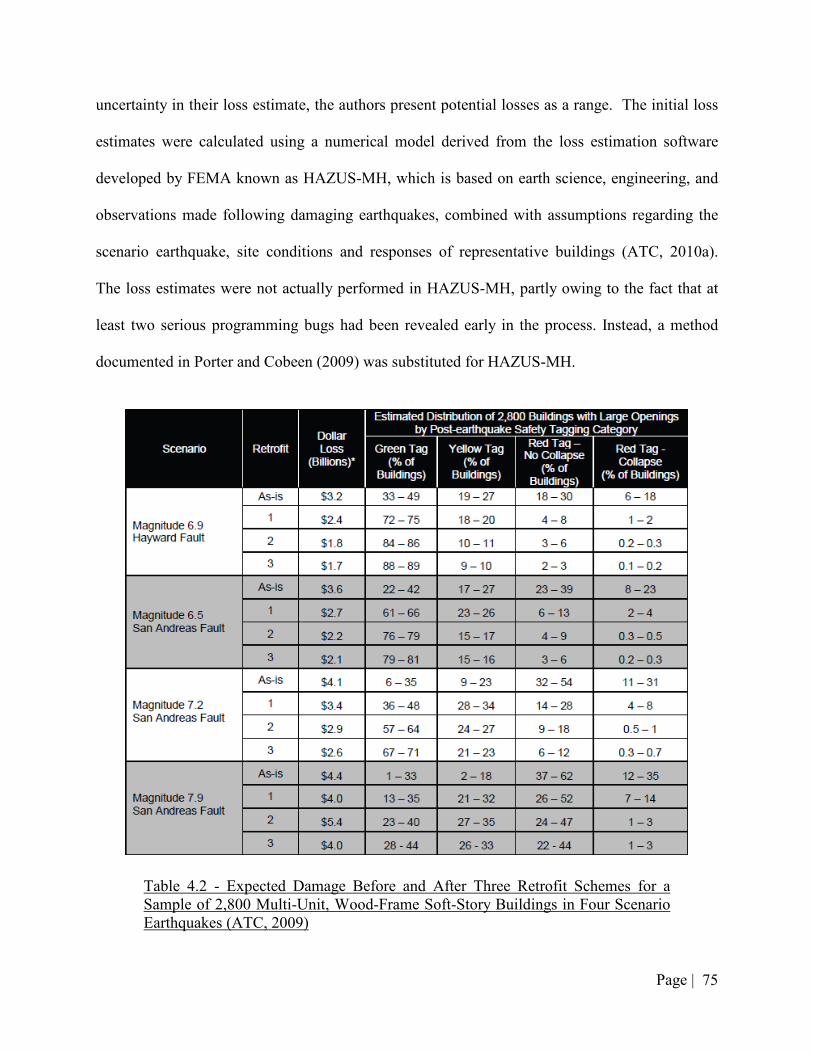
Page |
75
uncertainty in their loss estimate, the authors present potential losses as a range. The initial loss
estimates were calculated using a numerical model derived from the loss estimation software
developed by FEMA known as HAZUS-MH, which is based on earth science, engineering, and
observations made following damaging earthquakes, combined with assumptions regarding the
scenario earthquake, site conditions and responses of representative buildings (ATC, 2010a).
The loss estimates were not actually performed in HAZUS-MH, partly owing to the fact that at
least two serious programming bugs had been revealed early in the process. Instead, a method
documented in Porter and Cobeen (2009) was substituted for HAZUS-MH.
Table 4.2 - Expected Damage Before and After Three Retrofit Schemes for a Sample of 2,800 Multi-Unit, Wood-Frame Soft-Story Buildings in Four Scenario Earthquakes (ATC, 2009)
Retrofit
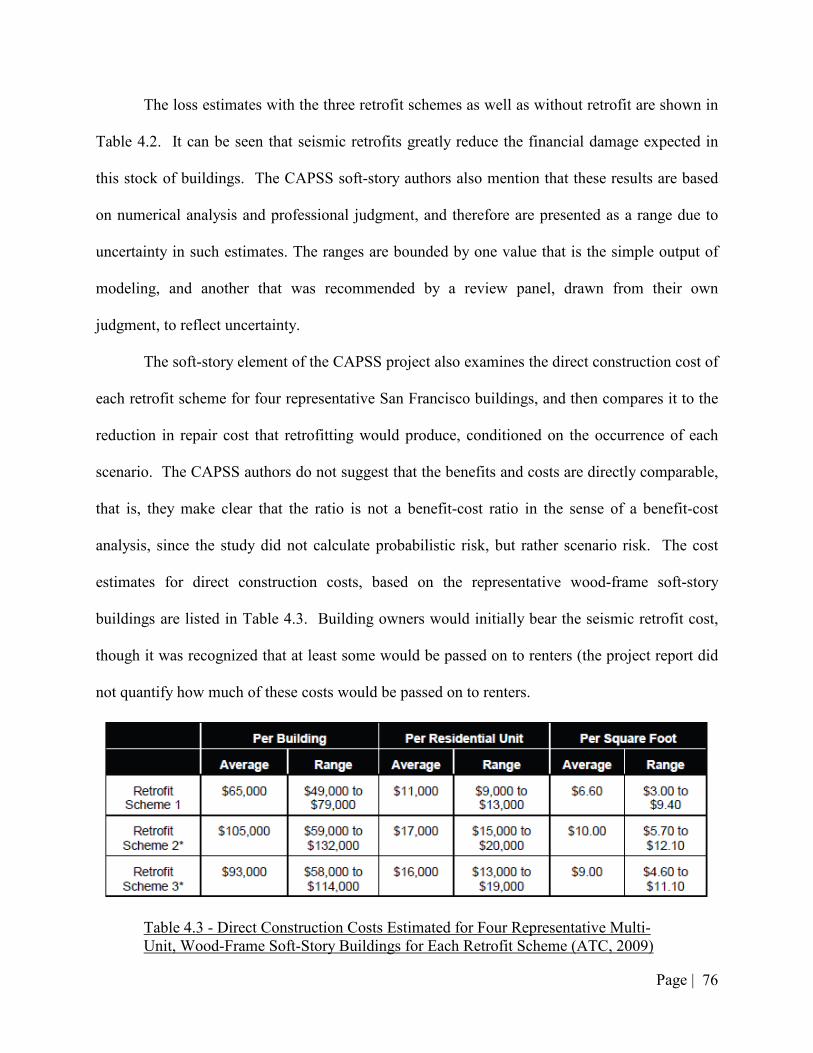
Page |
76
The loss estimates with the three retrofit schemes as well as without retrofit are shown in
Table 4.2. It can be seen that seismic retrofits greatly reduce the financial damage expected in
this stock of buildings. The CAPSS soft-story authors also mention that these results are based
on numerical analysis and professional judgment, and therefore are presented as a range due to
uncertainty in such estimates. The ranges are bounded by one value that is the simple output of
modeling, and another that was recommended by a review panel, drawn from their own
judgment, to reflect uncertainty.
The soft-story element of the CAPSS project also examines the direct construction cost of
each retrofit scheme for four representative San Francisco buildings, and then compares it to the
reduction in repair cost that retrofitting would produce, conditioned on the occurrence of each
scenario. The CAPSS authors do not suggest that the benefits and costs are directly comparable,
that is, they make clear that the ratio is not a benefit-cost ratio in the sense of a benefit-cost
analysis, since the study did not calculate probabilistic risk, but rather scenario risk. The cost
estimates for direct construction costs, based on the representative wood-frame soft-story
buildings are listed in Table 4.3. Building owners would initially bear the seismic retrofit cost,
though it was recognized that at least some would be passed on to renters (the project report did
not quantify how much of these costs would be passed on to renters.
Table 4.3 - Direct Construction Costs Estimated for Four Representative Multi- Unit, Wood-Frame Soft-Story Buildings for Each Retrofit Scheme (ATC, 2009)
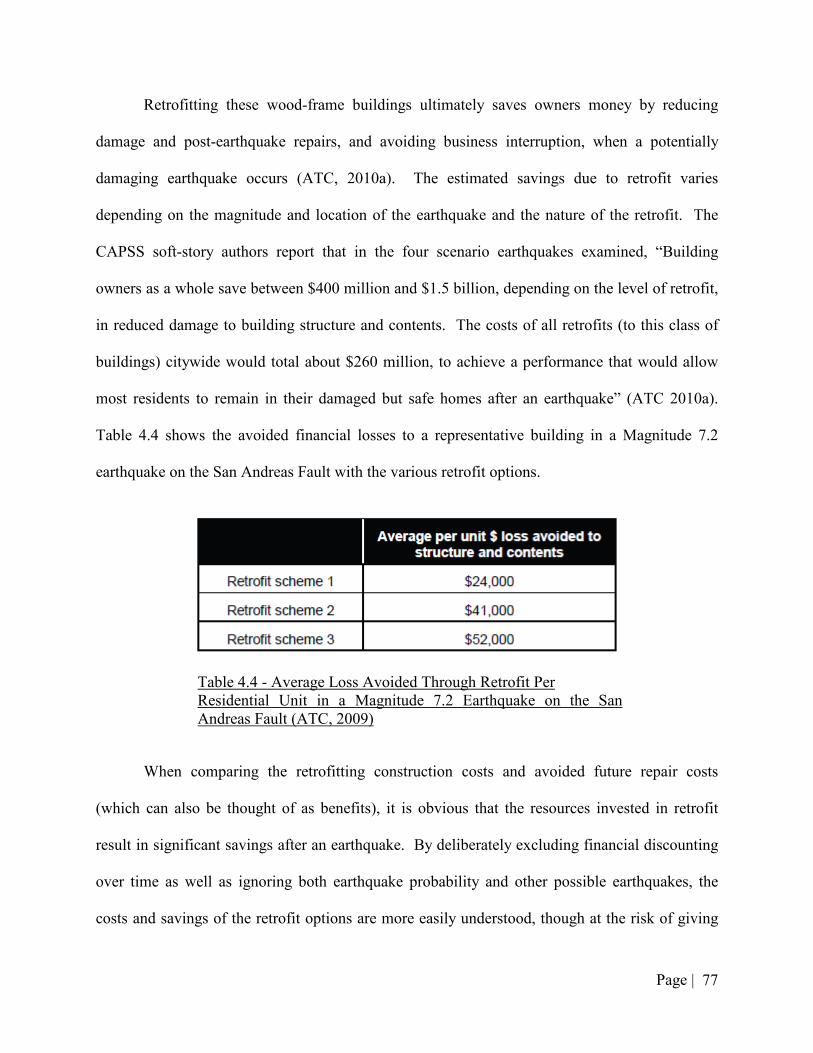
Page |
77
Retrofitting these wood-frame buildings ultimately saves owners money by reducing
damage and post-earthquake repairs, and avoiding business interruption, when a potentially
damaging earthquake occurs (ATC, 2010a). The estimated savings due to retrofit varies
depending on the magnitude and location of the earthquake and the nature of the retrofit. The
CAPSS soft-story authors report that in the four scenario earthquakes examined, “Building
owners as a whole save between $400 million and $1.5 billion, depending on the level of retrofit,
in reduced damage to building structure and contents. The costs of all retrofits (to this class of
buildings) citywide would total about $260 million, to achieve a performance that would allow
most residents to remain in their damaged but safe homes after an earthquake” (ATC 2010a).
Table 4.4 shows the avoided financial losses to a representative building in a Magnitude 7.2
earthquake on the San Andreas Fault with the various retrofit options.
Table 4.4 - Average Loss Avoided Through Retrofit Per Residential Unit in a Magnitude 7.2 Earthquake on the San Andreas Fault (ATC, 2009)
When comparing the retrofitting construction costs and avoided future repair costs
(which can also be thought of as benefits), it is obvious that the resources invested in retrofit
result in significant savings after an earthquake. By deliberately excluding financial discounting
over time as well as ignoring both earthquake probability and other possible earthquakes, the
costs and savings of the retrofit options are more easily understood, though at the risk of giving
Page |
78
the illusory impression of immediate financial savings. However, Porter (2011) explained that
nobody in the public meetings seemed to think there would be immediate benefits from retrofit
and it seemed clear to everyone that the savings would only be realized when an earthquake
occurred.
The CAPSS team took many different approaches which led to the successful completion
of project. Each of the five major strategies discussed in this paper were addressed in the
project, offering both support and new insight to the current knowledge and analysis previously
discussed in this thesis. Effective public education and involvement enabled the project to
communicate seismic risk to the public, particularly in light of community characteristics
specific to San Francisco. The real test to the effectiveness of this communication is whether the
public takes action in reducing this risk voluntarily, or by an imposed mandatory retrofit. With
future goals of adding political oversight to the program, requiring mandatory structural
evaluations of buildings and offering incentives to retrofit, the CAPSS project is intended to not
only communicate seismic risk but also improve future seismic safety and sustainability.
Page |
79
Chapter 5 Conclusion
5.1 Concluding Remarks and Agenda
Engineering risk analysis is currently developing from a purely mathematical field to one
that incorporates the psychological rationale that drives the political decision maker, and more
importantly the public. It is an exciting opportunity for engineers to bridge the gap between low-
probability, high-consequence events and the response and motivation of the public and their
leaders. In order to accomplish this, effective communication strategies must be implemented to
convince the public of the importance of natural hazard risk. In addition to this, financial-based
instruments must be developed to justify and promote making decisions now for long-standing
sustainability.
The methods presented in this paper provide an important next step for incorporating
natural hazard risk into long-term development plans. The solutions and risk communication
tools which were developed in this paper are summarized below in the form of an agenda for
promoting risk mitigation decisions. While this agenda is only advisory, and does not include
concrete rules and steps for incorporating hazard mitigation in policy decisions, it does provide
insight and recommendations for the public, engineers, and decision makers alike to overcome
many challenges which have limited optimal sustainable planning in the past.
• Public Risk Perception: Since people often underestimate the small probabilities
associated with natural hazards, risk communication techniques must be developed to
raise risk awareness and ensure adequate risk perception. This thesis has shown that
expressing probabilities over a longer time period increases the affect and availability of
an event which influences the perceived risk. As past experiences often increase the
Page |
80
imaginability of an event, focusing on historical hazard catastrophes and educating the
public on such disasters can also effect risk perception. Finally, eliminating probability
entirely and presenting risk in terms of a scenario outcome has also been shown to be
more impactful for the general public.
• Public Involvement: Public participation has been shown to increase citizen interest and
support for hazard mitigation. While the discussion in this paper did not review specific
modes of public participation, literature review and case study events share
characteristics of successful public involvement in environmental policy decision
making. This thesis shows that creative participation programs are successful when they
include educating the public on the specific issue at hand, incorporating public values
into alternatives and solutions, and increasing the importance and credibility of public
influence in decision making. Focusing on these key aspects has been shown to increase
public interest and acceptance, and add valuable insight in developing environmental
alternatives and policies.
• Incorporating Community Values: As previously discussed, risk communication is
effective when it addresses what the affected parties believe to be at risk. People want to
know how they will be directly affected. Beyond financial destruction, fatalities, and
injury, there are some direct and indirect losses which are very important to a community.
As seen in the case studies discussed, presenting the costs and benefits of a risk
mitigation activity based on the framework of specific community assets can be
successful for promoting hazard mitigation policy. Incorporating specific regional values
localizes the issue and draws public interest and support. This thesis has also presented
Page |
81
illustration of how hazard mitigation can be “piggy-backed”, or accompany more
immediate community issues which may draw more attention.
• Overcoming Incompatibility of Lifetimes: The conflict between long-term optimal
policy and short-term political decision making can be attributed to lack of showing a
need for hazard mitigation, and comparatively, lack of public and political accountability
for such issues. The implementation of reporting methods similar to the ASCE Report
Card and the Infrastructure RATE Card can be used to promote a sense of accountability
for risk mitigation decisions of a longer time scale. It was noted that a possible
contributing factor to the success of these methods includes more frequent publication
and more localized reporting. As shown by the events in the CAPSS study following the
Mayor’s response to public concern, public education can also influence political
accountability for long-term sustainable planning.
• Cost Presentation Methods: While financial-based tools are effective in
communicating risk and return, this thesis has shown that there are many sensitivities and
varying views when it comes to the components which comprise the financial accounting
of costs and benefits. While the use of a set discount rate is currently used to discount
economic loss, it should be noted that the value of discounting can be individual to the
event, region, type of infrastructure, and owner. By using a scenario event and assessing
costs and benefits as if an event occurred now, discounting can be eliminated. While this
does have its limitation, many professionals believe this provides a more effective way in
communicating the costs and benefits of risk mitigation to the general public and political
leaders. Also, it has been shown that expressing the cost of hazard mitigation as an
Page |
82
equivalent annual cost versus a large present discounted value can be beneficial in
justifying public long-term spending.
5.2 Thesis Limitations
While the recommendations mentioned above are rather broad with respect to where and
for whom they apply, there are certain limitations which would influence the effectiveness of
such communication tools. Noticeable limitations discussed below include the financial
demographic of those at risk to a hazard and geographic location constraints.
The purpose for developing these communication tools is to promote risk mitigation
through retrofit. The recommendations and tools presented in this thesis do not take into
consideration the financial capacity of the public at risk to a natural hazard. If homeowners are
not financially capable to afford retrofitting, communication strategies for risk perception, public
participation, and effective cost presentation methods have little influence on their ability to
retrofit. For example, as of 2005, nearly eighty percent of Haitian citizens lived on less than $2 a
day (U.S. Department of State, 2011). It is obvious that rebuilding and retrofit is essential for
Haiti, but the vast poverty in the country makes retrofitting impossible without financial
assistance. Instead of the communication tools outlined in this thesis, financial solutions for low-
income homeowners to afford retrofit must be developed. The recommendations in this thesis
are ultimately intended for homeowners who are able to afford retrofitting.
Another limitation to this research is geographic constraints. These communication tools
are only effective if people in a region are willing to accept that they are at risk to natural
hazards. Even if regions are at risk, lack of previous local disasters provides a limitation to risk
perception. For example, while people living in the New Madrid seismic zone in the south-
central United States are at risk to future damaging earthquakes, public awareness of such risk
Page |
83
may be low due to the fact that the last destructive earthquake in the region dates back to 1812.
This limits the effectiveness of utilizing some of the recommendations with respect to public risk
perception presented in this thesis.
Finally, this thesis does not take into consideration the various alternative uses of funds
which can be put toward mitigation planning. In both public and private spending, there are
various projects, departments, etc. that money can go towards. This thesis is intended to promote
risk investment decisions independent of the availability of funds and issues arising from the
alternate uses of the same mitigation funds.
Additional challenges to this research may also spur from political instabilities and
cultural differences. Many of the recommendations in this thesis are generic and can be
modified with respect to a region’s social, economic, and political characteristics.
5.3 Future Research
As natural hazard risk communication is a very broad topic, there are many additional
issues and factors which were not included in this thesis. Further focus and research on each
topic discussed may lend additional insight and conclusions into effective risk communication
methods. However, the general goal of this paper is to develop communication techniques that
overcome the prevalent gap between short-term planning and long-term sustainability. By
focusing on a variety of issues that pose a challenge to risk mitigation, it is possible to develop
ways to overcome various incompatibilities affecting risk perception, thus leading to better
promotion of the importance of hazard mitigation. The general literature review and
reassessment of each topic is intended to give an idea of the main issues involved and possible
solutions.
Page |
84
For future research, the next step would be developing a specific tool that would directly
increase public understanding, perception, and accountability of infrastructure risk, and also
promote retrofit. This could be in the form of a reporting system similar to the proposed
Infrastructure RATE Report Card, or perhaps in the form of a marketing tool.
In addition to various communication methods presented in this paper developed to
maximize risk perception and promote retrofit, people are often incentivized to retrofit through
financial rewards. While many regions already incorporate financial incentives to retrofit in the
form of tax rebates, loans, grants, etc., a possible research topic would be the incorporation of
hazard mitigation into insurance premiums. Each building owner would be required to get a
structural evaluation of his or her structure, which notifies the owner of any structural
deficiencies, along with retrofit options. The owner’s insurance premiums and resale value
would then be adjusted to reflect the level of their building’s structural performance against
earthquakes. For example, if a structure was built to the current seismic building codes, the
insurance premium would be at a minimum. On the other hand, if a building was severely
under-designed, the insurance premium would be inflated and the resale value of the building
would be much lower than if the structure were built to code requirements. The overall
objectives would be to increase public accountability for seismic performance, increase public
safety, and provide incentive to retrofit.
Obviously, there is much research that must be done on the economic, social, and
political implications behind such a program. This research would begin by investigating the
background and effectiveness of similar programs and study various modifications and
improvements to such programs. Surveys, questionnaires and discussions with affected building

Page |
85
owners would be necessary as well as incorporating their concerns into the development of the
program.
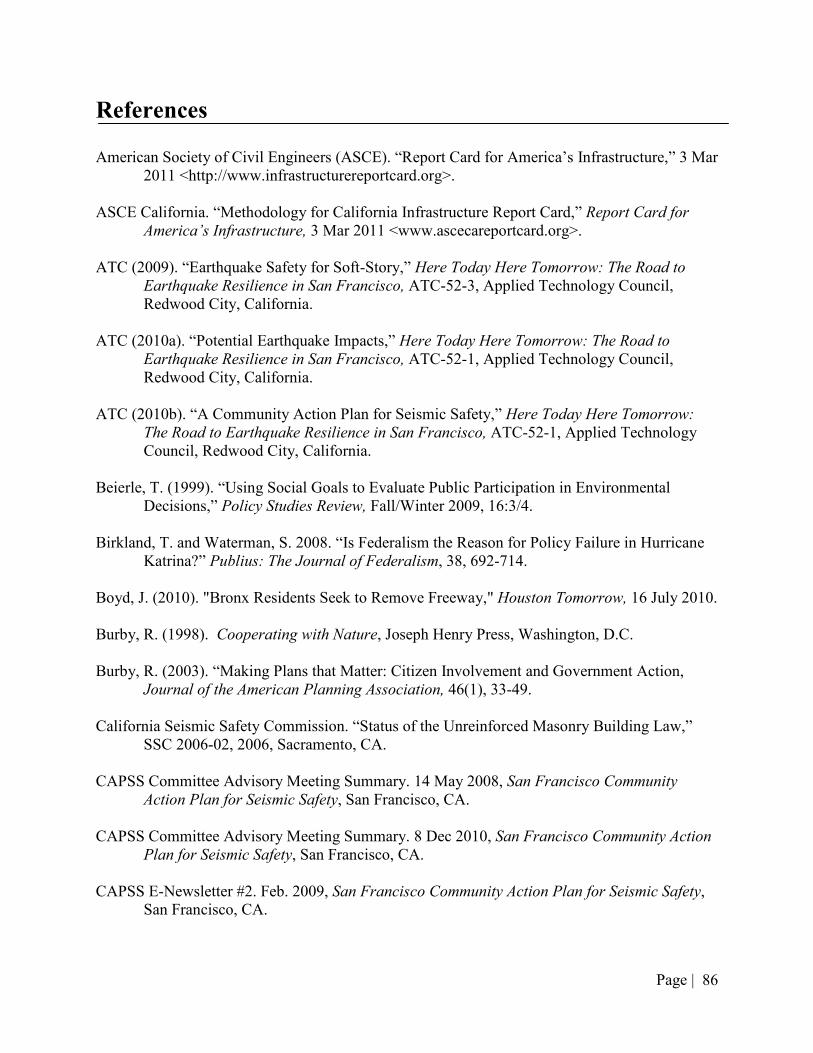
Page |
86
References
American Society of Civil Engineers (ASCE). “Report Card for America’s Infrastructure,” 3 Mar 2011 <http://www.infrastructurereportcard.org>.
ASCE California. “Methodology for California Infrastructure Report Card,” Report Card for
America’s Infrastructure, 3 Mar 2011 <www.ascecareportcard.org>. ATC (2009). “Earthquake Safety for Soft-Story,” Here Today Here Tomorrow: The Road to
Earthquake Resilience in San Francisco, ATC-52-3, Applied Technology Council, Redwood City, California.
ATC (2010a). “Potential Earthquake Impacts,” Here Today Here Tomorrow: The Road to
Earthquake Resilience in San Francisco, ATC-52-1, Applied Technology Council, Redwood City, California.
ATC (2010b). “A Community Action Plan for Seismic Safety,” Here Today Here Tomorrow:
The Road to Earthquake Resilience in San Francisco, ATC-52-1, Applied Technology Council, Redwood City, California.
Beierle, T. (1999). “Using Social Goals to Evaluate Public Participation in Environmental
Decisions,” Policy Studies Review, Fall/Winter 2009, 16:3/4. Birkland, T. and Waterman, S. 2008. “Is Federalism the Reason for Policy Failure in Hurricane
Katrina?” Publius: The Journal of Federalism, 38, 692-714. Boyd, J. (2010). "Bronx Residents Seek to Remove Freeway," Houston Tomorrow, 16 July 2010. Burby, R. (1998). Cooperating with Nature, Joseph Henry Press, Washington, D.C. Burby, R. (2003). “Making Plans that Matter: Citizen Involvement and Government Action,
Journal of the American Planning Association, 46(1), 33-49. California Seismic Safety Commission. “Status of the Unreinforced Masonry Building Law,”
SSC 2006-02, 2006, Sacramento, CA. CAPSS Committee Advisory Meeting Summary. 14 May 2008, San Francisco Community
Action Plan for Seismic Safety, San Francisco, CA. CAPSS Committee Advisory Meeting Summary. 8 Dec 2010, San Francisco Community Action
Plan for Seismic Safety, San Francisco, CA. CAPSS E-Newsletter #2. Feb. 2009, San Francisco Community Action Plan for Seismic Safety,
San Francisco, CA.
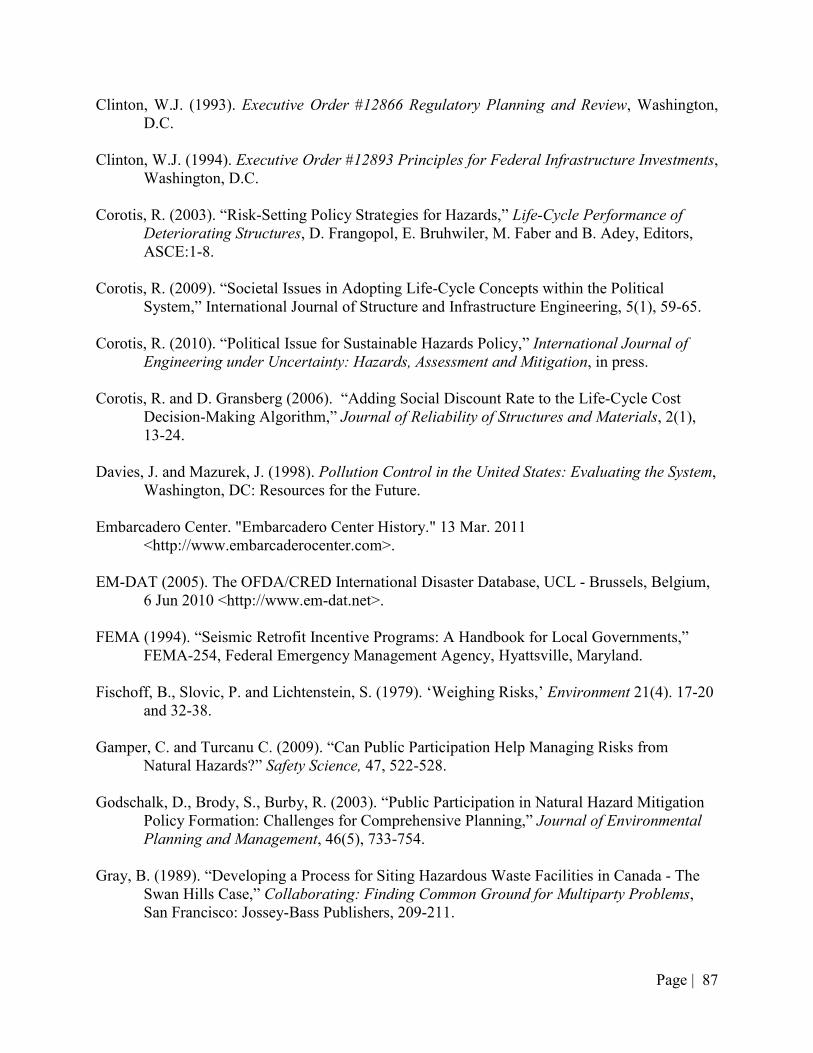
Page |
87
Clinton, W.J. (1993). Executive Order #12866 Regulatory Planning and Review, Washington, D.C.
Clinton, W.J. (1994). Executive Order #12893 Principles for Federal Infrastructure Investments,
Washington, D.C. Corotis, R. (2003). “Risk-Setting Policy Strategies for Hazards,” Life-Cycle Performance of
Deteriorating Structures, D. Frangopol, E. Bruhwiler, M. Faber and B. Adey, Editors, ASCE:1-8.
Corotis, R. (2009). “Societal Issues in Adopting Life-Cycle Concepts within the Political
System,” International Journal of Structure and Infrastructure Engineering, 5(1), 59-65. Corotis, R. (2010). “Political Issue for Sustainable Hazards Policy,” International Journal of
Engineering under Uncertainty: Hazards, Assessment and Mitigation, in press. Corotis, R. and D. Gransberg (2006). “Adding Social Discount Rate to the Life-Cycle Cost
Decision-Making Algorithm,” Journal of Reliability of Structures and Materials, 2(1), 13-24.
Davies, J. and Mazurek, J. (1998). Pollution Control in the United States: Evaluating the System,
Washington, DC: Resources for the Future. Embarcadero Center. "Embarcadero Center History." 13 Mar. 2011
<http://www.embarcaderocenter.com>. EM-DAT (2005). The OFDA/CRED International Disaster Database, UCL - Brussels, Belgium,
6 Jun 2010 <http://www.em-dat.net>. FEMA (1994). “Seismic Retrofit Incentive Programs: A Handbook for Local Governments,”
FEMA-254, Federal Emergency Management Agency, Hyattsville, Maryland. Fischoff, B., Slovic, P. and Lichtenstein, S. (1979). ‘Weighing Risks,’ Environment 21(4). 17-20
and 32-38. Gamper, C. and Turcanu C. (2009). “Can Public Participation Help Managing Risks from
Natural Hazards?” Safety Science, 47, 522-528. Godschalk, D., Brody, S., Burby, R. (2003). “Public Participation in Natural Hazard Mitigation
Policy Formation: Challenges for Comprehensive Planning,” Journal of Environmental Planning and Management, 46(5), 733-754.
Gray, B. (1989). “Developing a Process for Siting Hazardous Waste Facilities in Canada - The
Swan Hills Case,” Collaborating: Finding Common Ground for Multiparty Problems, San Francisco: Jossey-Bass Publishers, 209-211.
Page |
88
Gregory, R. (2000). “Using Stakeholder Values to Make Smarter Environmental Decisions,” Environment: Science and Policy for Sustainable Development, 42(5).
Harris, J. (2011). Personal Communication. 4 Mar. 2011. Healy, A. and Malhotra, N. (2009). “Myopic Voters and Natural Disaster Policy,” American
Political Science Review, 103(3), 387-406. Herbert, B. (2010). “What’s Wrong with Us?” The New York Times, February 16, 2010. Hess, R. (2008). “Unreinforced Masonry (URM) Buildings,” The ShakeOut Scenario
Supplemental Study. Prepared for the United States Geological Survey, Pasadena CA and the California Geological Survey, Sacramento, CA.
Irvin, R. and Stansbury, J. (2004). “Citizen Participation in Decision Making: Is it Worth the
Effort?” Public Administration Review, 64(1), 55-65. Ivashchenko, A. et al. (1997). “The Neftegorsk, Sakhalin Island, Earthquake of 27 May 1995,”
Island Arc, 6(3), 288-302. James, R. and Blamey, R. (1999). “Public Participation in Environmental Decision-Making –
Rhetoric to Reality?” International Symposium on Society and Resource Management, Brisbane, Australia.
Jackson, E. (1981). “Response to earthquake hazard,” Environment and Behavior, 13, 387–416. Kahneman, D. and Tversky, A. (2000). Editors, Choices, Values, and Frames, Cambridge
University Press, Cambridge. Keller, C., Siegrist, M. and Gutscher, H. (2006). “The Role of the Affect and Availability
Hueristics in Risk Communication,” Risk Analysis, 26(3), 631-639. Kerjan, M., and Slovic, P. (Eds.). (2010). The Irrational Economist, New York: Public Affairs. Kunreuther, H. (2010). “What the Volcano Taught me,” The Washington Post, 10 May 2010. Kunreuther, H. and Michel-Kerjan, E. (2010). “Overcoming Myopia,” The Milken Institue
Review, Fourth Quarter. Malloy, B. “San Francisco City Hall: Beaux Arts Building is Taller than the U.C. Capitol,”
About.com California Travel, 10 Mar 2011 <http://gocalifornia.about.com/od/casfmenu/a/cityhall.htm>.
McDaniels, T., Gregory, R., Fields, D. (1999). Democratizing Risk Management: Successful
Public Involvement in Local Water Management Decisions. Risk Analysis, 19 (3).
Page |
89
National Research Council (1996). Understanding Risk: Informing Decisions in a Democratic Society, Washington, DC: National Academy Press.
National Research Council (2010). Building Community Disaster Resilience Through Private-
Public Collaboration. Washington, D.C.: The National Academies Press. Newell, R. and Pizer, W. (2001). “Discounting the Benefits of Climate Change Mitigation,” Pew
Center on Global Climate Change, Dec. 2001. Newsom, G. (2008). Executive Directive 08-07, Seismic Strengthening of Soft Story Buildings,
July 7, 2008, Office of the Mayor, City & County of San Francisco. Olshansky, R. (1999). Urbanism and its Legacy of Vulnerability, Building Disaster Resilient
Communities, FEMA Training, 1999. Olshansky, R. (2003). Examples of Successful Seismic Safety Advocacy. Earthquake
Engineering Research Institute Mitigation Center, Oakland, CA. Patt, A. and Schrag, D. (2003). “Using specific language to describe risk and probability,”
Climate Change, 61(1-2), 17-30. Paxton, J. (2004). “Earthquakes: San Francisco at Risk,” SPUR Newsletter, 2004. Percoco, M. (2002). “Discounting for Environmental Effects in Infrastructure Project Appraisal,”
Swiss Transport Research Conference, Bocconi University. Porter, K. And Cobeen, K. (2009). “Loss Estimates for Large Soft-Story Woodframe Buildings
in San Francisco,” San Francisco Community Action Plan for Seismic Safety, San Francisco, CA.
Porter, K. (2011). Personal Communication. 25 Feb 2011. ProVention Consortium. “Disaster risk reduction and cost-benefit analysis,” The International
Federation of Red Cross and Red Crescent Societies, Geneva, Switzerland, 3 Mar 2011 <http://www.proventionconsortium.org/?pageid=26>.
Prater, C. And Lindell, M. (2000). “Politics of Hazard Mitigation,” Natural Hazards Review,
May 2000, 73-82. Risk Management Solutions (RMS), Inc. (2004). “Northridge Earthquake 10-year
Retrospective,” Revised May 13, 2004. Rough, J. (2010). Personal Communication. 24 Dec. 2010. Samant, L. et al. (2009). “Mitigating San Francisco’s Soft-Story Building Problem,” San
Francisco Community Action Plan for Seismic Safety, San Francisco, CA.
Page |
90
Samant, L. (2011). Personal Communication. 10 Mar 2011. San Francisco International Airport (SFO). (2010). SFO Climate Action Plan, San Francisco,
CA. Seattle Urban Mobility Plan (2008). “Case Studies,” Seattle.gov Department of Transportation,
25 Feb 2011 <http://www.cityofseattle.net/transportation/docs> Selna, R. (2008). “San Francisco Disregards Danger of Weakest Buildings; Classic Structures
Abound, Many on Unstable Ground,” San Francisco Chronicle, June 29, 2008, Main News, pg A-1.
Slovic, P. (1993). “Perceived Risk, Trust, and Democracy,” Risk Analysis 13(6): 675-682. Slovic, P., Monahan, J., and MacGregor, D. (2000). “Violence Risk Assessment and Risk
Communication: The Effects of Using Actual Cases, Providing Instruction, and Employing Probability Versus Frequency Formats,” Law and Human Behavior, 24, 271–296.
Slovic, P., Finucane, M. L., Peters, E., & MacGregor, D. G. (2004). “Risk as Analysis and Sisk
as Feelings: Some Thoughts about Affect, Reason, Risk, and Rationality”, Risk Analysis, 24(2), 311–322.
Stave, K. (2002). “Using System Dynamics to Improve Public Participation in Environmental
Decisions,” Systems Dynamics Review, 18(2). 139-167. Structural Engineers of Northern California (SEAONC). "San Francisco City Hall," Celebrating
Earthquake Safety, 25 Feb 2011 <http://www.celebratingeqsafety.com/sf-city-hall.html>. Taleb, N. (2010). The Black Swan: The Impact of the Highly Improbable, New York: Random
House and Penguin. Tobin, T. (1994). “Legacy of the Loma Prieta Earthquake,” Practical Lessons From the Loma
Prieta Earthquake, Washington, DC: National Academies Press, 1-18. Tobin, T. (2011). Personal Communication. 12 Apr. 2010. Thaler, R. (1981). “Some Empirical Evidence on Dynamic Inconsistency,” Economic Letters,
Vol. 8, 201-207. Tierney, K. (2011). Personal Communication. 3 Mar 2011. Toll Bridge Program Oversight Committee (TBPOC) (2010), “2010 Fourth Quarter Toll Bridge
Seismic Retrofit Program Report,” San Francisco Bay Area Toll Bridge Seismic Retrofit and Regional Measure 1 Program, California Department of Transportation.
Page |
91
Tversky, A. and Bar-Hillel, M. “Risk: The Long and the Short,” Journal of Experimental
Psychology: Learning, Memory, and Cognition, 9(4), October, 1983, American Psychological Association, 713-717.
United States (US) Department of State (2011). Committee on Governmental Affairs. “Post-
Earthquake USG Haiti Strategy Toward Renewal and Economic Opportunity,” 3 Jan. 2011 <http://www.state.gov/documents/organization/156448.pdf>.
United States (US) Census Bureau. 3 Jan. 2010. Viscusi, W. and Zeckhauser, R. (2006). "National Survey Evidence on Disasters and Relief: Risk
Beliefs, Self-Interest, and Compassion," Risk Uncertainty, 33, 13-36. Webler, T. and Tuler, S. (2001). “Public Participation in Watershed Management Planning:
Views on Process from People in the Field,” Human Ecology Review, 8(2). WGCEP (2008). The Uniform California Earthquake Rupture Forecast, Version 2 (UCERF 2),
Working Group on California Earthquake Probabilities, USGS Open File Report 2007-1437/CGS Special Report 203/SCEC Contribution #1138, U. S. Geological Survey, Reston, Virginia.
Page |
92
APPENDIX A: Earthquake Retrofitting Questionnaire
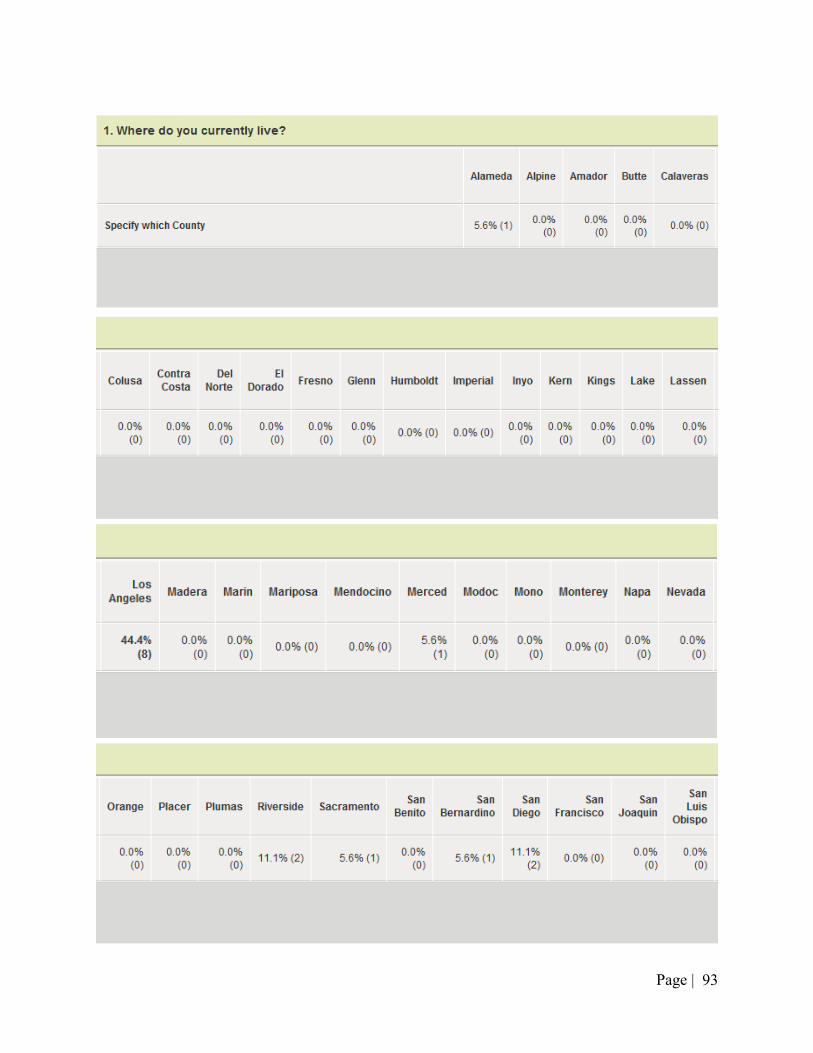
Page |
93
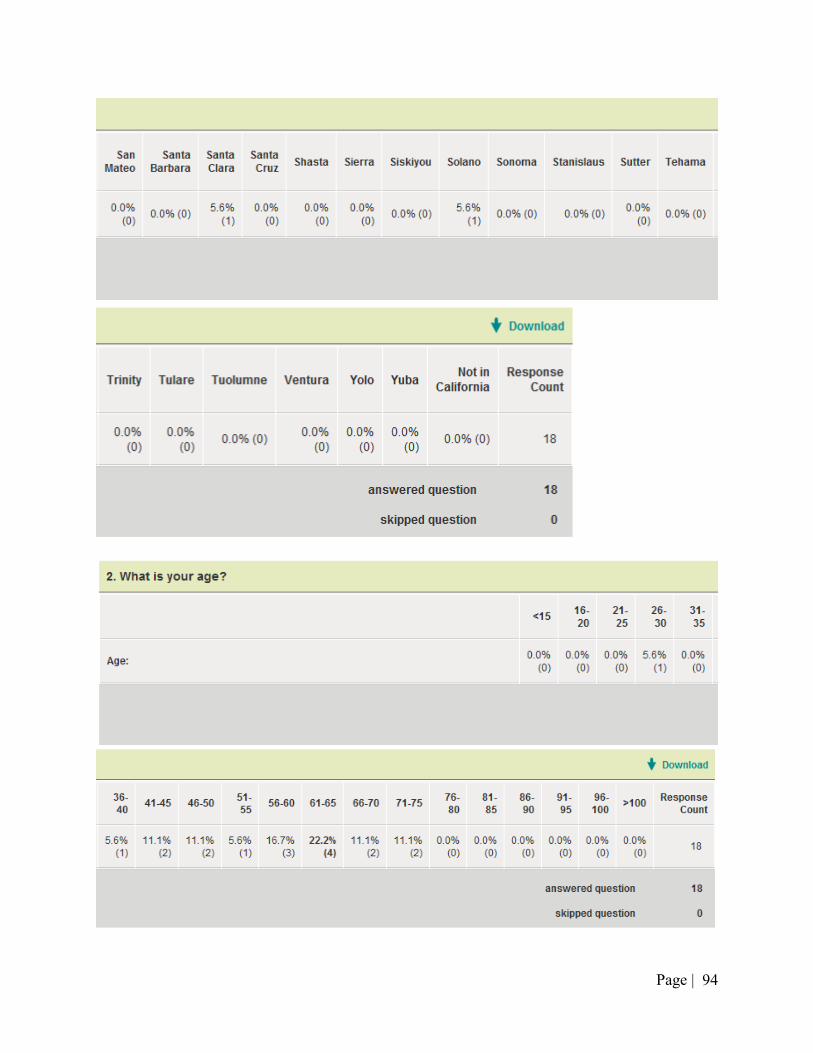
Page |
94
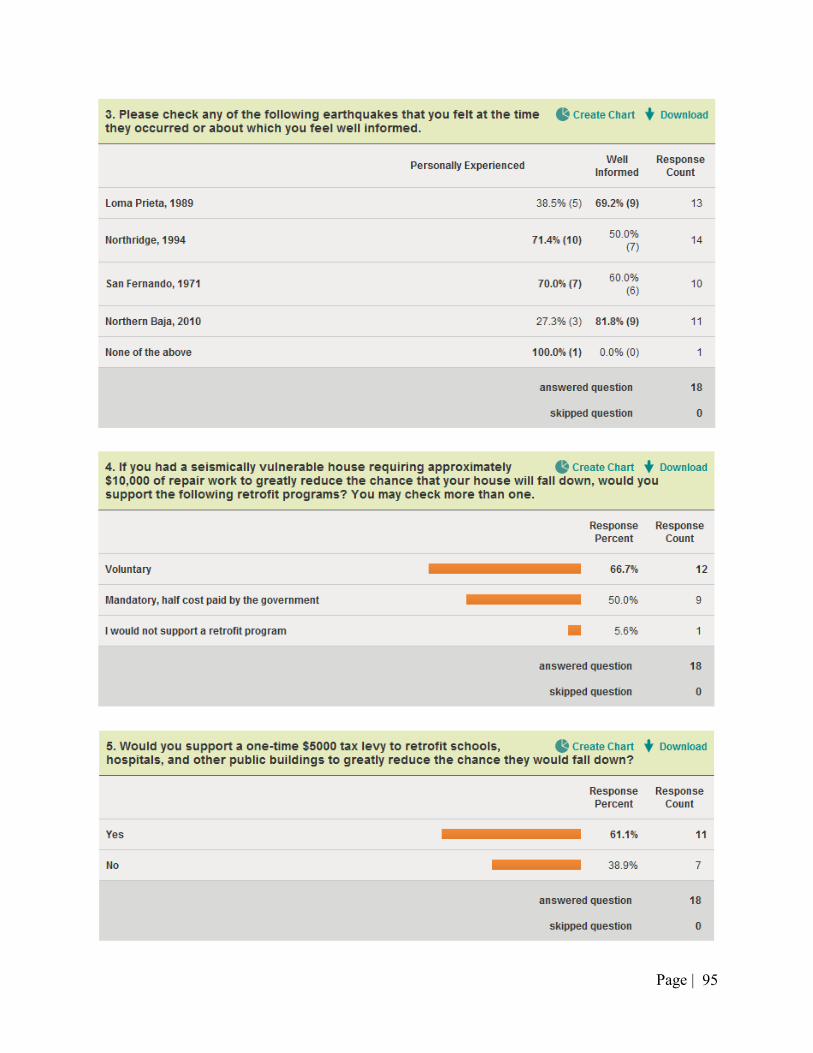
Page |
95
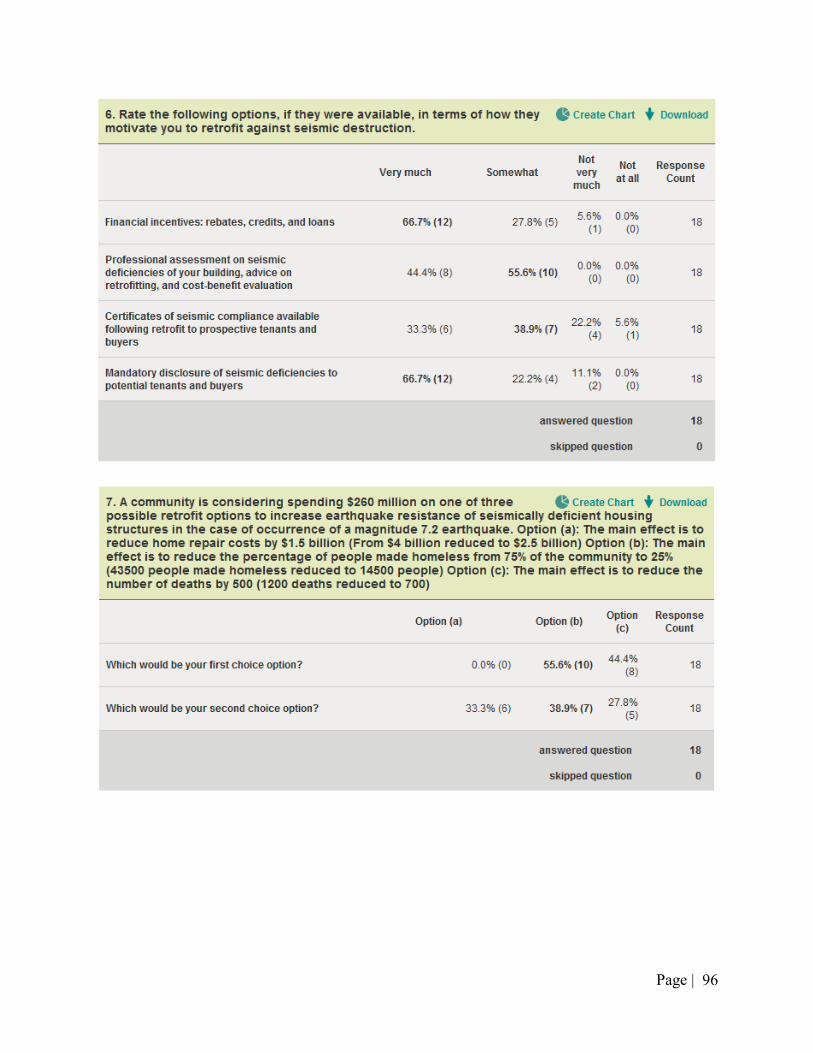
Page |
96
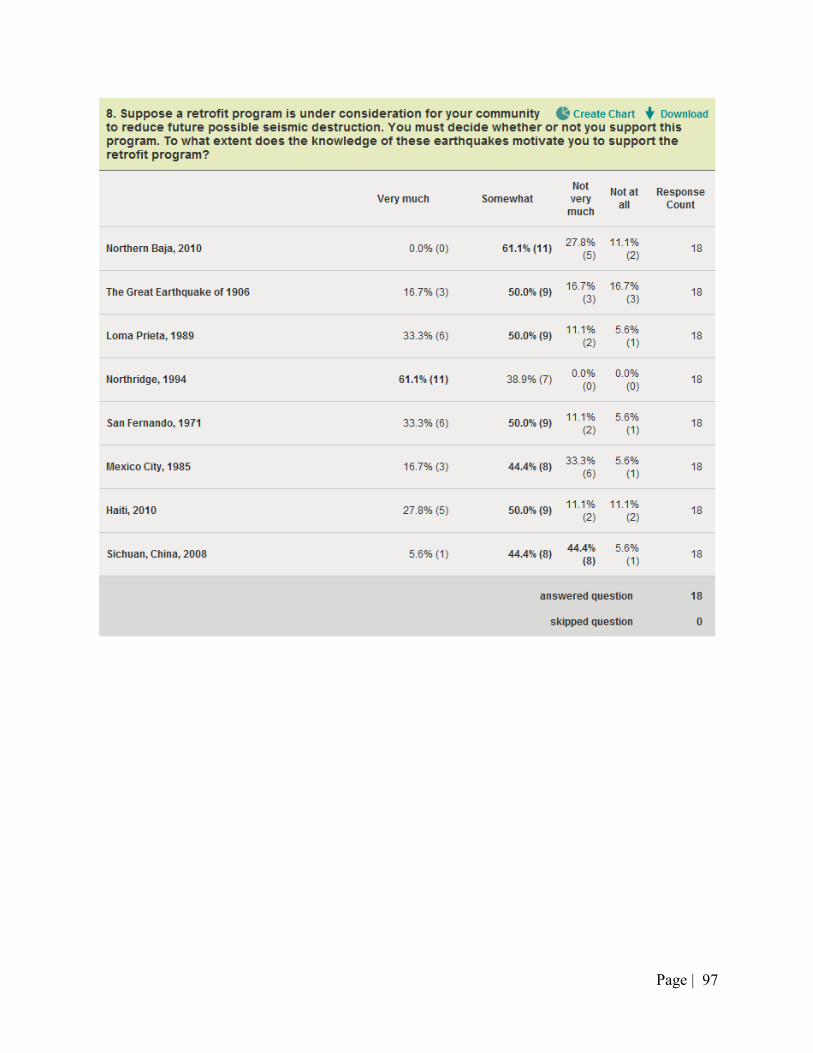
Page |
97
Page |
98
APPENDIX B: Risk Perception Questionnaire: Versions A-D
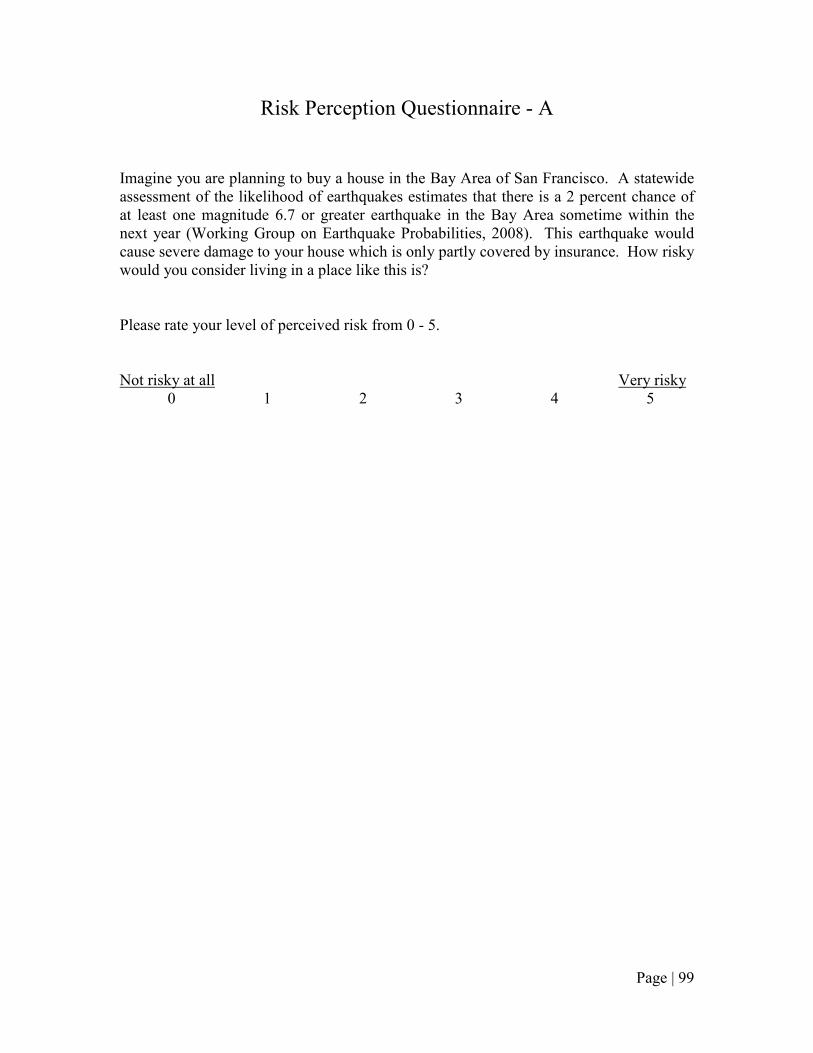
Page | 99
Risk Perception Questionnaire - A
Imagine you are planning to buy a house in the Bay Area of San Francisco. A statewide
assessment of the likelihood of earthquakes estimates that there is a 2 percent chance of
at least one magnitude 6.7 or greater earthquake in the Bay Area sometime within the
next year (Working Group on Earthquake Probabilities, 2008). This earthquake would
cause severe damage to your house which is only partly covered by insurance. How risky
would you consider living in a place like this is?
Please rate your level of perceived risk from 0 - 5.
Not risky at all Very risky
0 1 2 3 4 5
Page | 100
Risk Perception Questionnaire - B
Imagine you are planning to buy a house in the Bay Area of San Francisco. A statewide
assessment of the likelihood of earthquakes estimates that there is a 63 percent chance of
at least one magnitude 6.7 or greater earthquake in the Bay Area sometime in the next
three decades (Working Group on Earthquake Probabilities, 2008). This earthquake
would cause severe damage to your house which is only partly covered by insurance.
How risky would you consider living in a place like this is?
Please rate your level of perceived risk from 0 - 5.
Not risky at all Very risky
0 1 2 3 4 5

Page | 101
Risk Perception Questionnaire - C
Imagine you are planning to buy a house in the Bay Area of San Francisco. A statewide
assessment of the likelihood of earthquakes estimates that there is a 2 percent chance of
at least one magnitude 6.7 or greater earthquake in the Bay Area sometime within the
next year (Working Group on Earthquake Probabilities, 2008). This earthquake would
cause severe damage to your house which is only partly covered by insurance. The
following images were taken in a similar area of San Francisco after the Loma Prieta
Earthquake in 1989.
http://pubs.usgs.gov
How risky would you consider living in a place like this is?
Please rate your level of perceived risk from 0 - 5.
Not risky at all Very risky
0 1 2 3 4 5
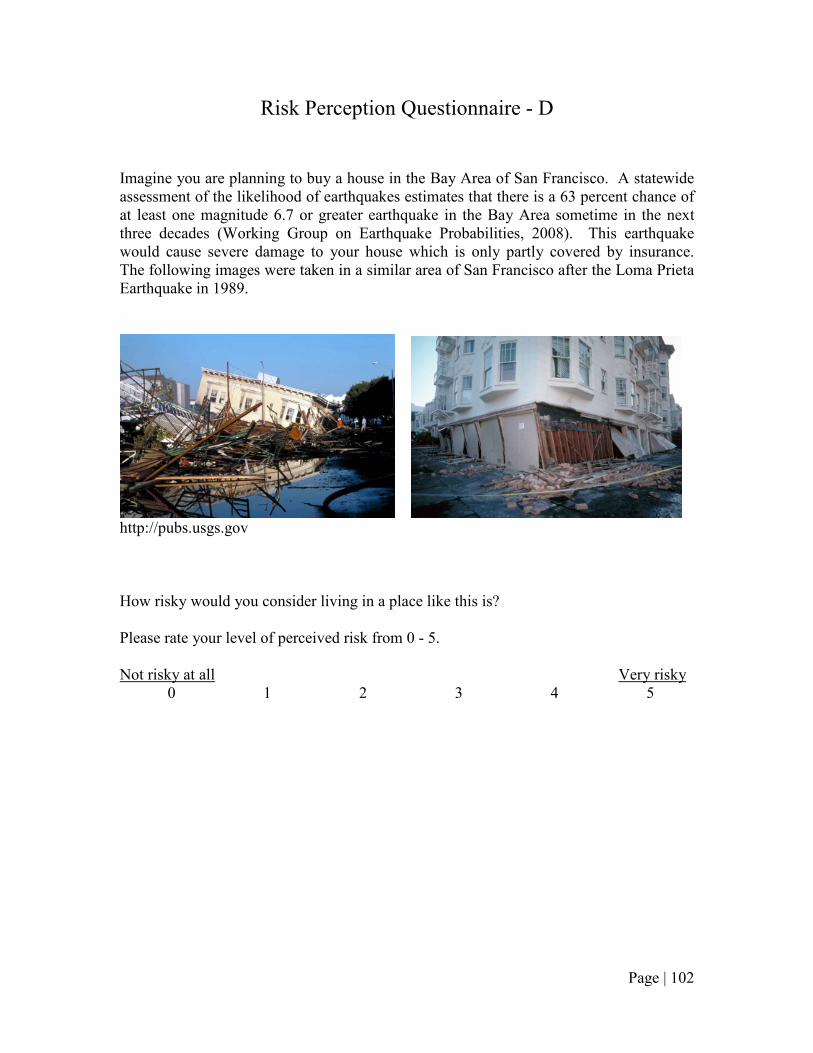
Page | 102
Risk Perception Questionnaire - D
Imagine you are planning to buy a house in the Bay Area of San Francisco. A statewide
assessment of the likelihood of earthquakes estimates that there is a 63 percent chance of
at least one magnitude 6.7 or greater earthquake in the Bay Area sometime in the next
three decades (Working Group on Earthquake Probabilities, 2008). This earthquake
would cause severe damage to your house which is only partly covered by insurance.
The following images were taken in a similar area of San Francisco after the Loma Prieta
Earthquake in 1989.
http://pubs.usgs.gov
How risky would you consider living in a place like this is?
Please rate your level of perceived risk from 0 - 5.
Not risky at all Very risky
0 1 2 3 4 5
Page |
103
APPENDIX C: Financial-based Methods Discussion Questions and Reponses
Page |
104
3/05/2011 Discussion
Questions on financial-based methods used in a cost – benefit analysis for retrofitting
against natural hazard risk.
This questionnaire deals with the costs and benefits of retrofit for natural hazards, such as
seismic retrofit. It involves issues surrounding the discount rates used in the analysis. The use
of a constant discount rate for environmental consequences and casualty risk is controversial
since over a longer time horizon, future life safety benefits become trivial. This questionnaire
elicits your thoughts about different cost-presentation modes.
Jim Harris: I am an advocate of taking in account the time value of money in regards to
earthquake design rules that have to do with fundamentally averting future monetary losses.
This means the hazard level at which one is going to analyze the cost-benefit is not the 2500 year
earthquake since with a constant discount rate, there would be no present value when discounted.
I believe they are going to settle between 30 years and 200 years; probably 70-100 years in terms
of mean recurrence of earthquake ground motion in terms of economic loss. This is to be used
for an average person; society in general. For instance if you’re going to spend money to brace
things that break and spill fluids but don’t threaten life in a serious way, you probably don’t want
to spend the money if the probability of avoiding a future loss is nil. Thinks it will be a big point
of discussion over the next decade in earthquake engineering.
This questionnaire elicits your thoughts about different cost-presentation modes.
1. Discounting: Do you believe using a constant discount rate, for example 3% or some
value, to discount all future benefits, including monetary, life-safety and intangible
benefits, is appropriate for a benefit-cost analysis of natural–hazard mitigation?
Kathleen Tierney: No. I have a hard time with discount rates in general because of the
issue of the cup of coffee. There are multiple costs and benefits that are comparable and
not comparable. In light of the fact that there is a commensurability problem around
benefits and costs, discount rates should be used with caution. It is also based on the
point of view of the person. We should find out an individual’s own discount rates.
Perhaps the choice of the weighing is individual. An ordinary decision maker does not
use cost benefit analysis in the same way as the office of management does. For
example, if the property in question is a historic family farm and the owner wants to give
it to his children, a much different discount rate may be used in a cost benefit analysis
versus a typical house.
Jim Harris: In controlling economic loss, one must pick a discount rate. 3% sounds like
an accurate rate. If you are doing private sector investing, you want a bigger rate of
return than 3%, but if you go to 10%, you make stupid decisions with respect to future

Page |
105
risks. The discount rate used could vary by the circumstances. You might adopt
different discount rates for different kinds of physical elements. For important public
infrastructure, you might adopt a lower tolerance for future losses. For instance, in San
Francisco or Memphis, there are a few really significant bridges. If you lose those
bridges, the overall regional economy is severely impacted. When doing cost benefit
analysis, this must be taken into account. On the other hand, if you design a bridge over
a little creek that has four alternate routes within 4 miles, the significance of the bridge
not collapsing is much lower. Similarly, if you’re in a big city with 14 hospitals with
trauma centers, you may not need to have the same safety levels on the hospitals versus a
city with a one hospital .
Keith Porter: I will split my answer into monetary and life-safety benefits, and ignore
intangibles. For monetary benefits, with one caveat that I will explain later, I have no
problem with using a constant discount rate equal to the cost of capital minus inflation.
For life-safety benefit, before answering the question, I offer this premise: While the
price of something is a quantity that can be observed, the value of something is a personal
judgment. The can of tomato paste may be priced at $1.35, but I have to decide if it is
worth at least $1.35 to me before I buy it. Like the can of tomato paste, the value of
avoiding a statistical fatality is a personal judgment. The federal government can set the
price it is willing to pay, or cause others to pay, to avoid a statistical fatality, but that
decision is typically based on a synthesis of the apparent value that various groups of
Americans seem willing to pay. This means that the government price essentially rests on
the value that people like me place on avoiding a statistical fatality. Economists can offer
rationale for and against discounting human life, but the rationale only matters if I (or
others like me) find it compelling and integrate it into the value that we individually
assign to a avoiding a statistical fatality 100 years from now. That is to say, the burden
rests with the economists or other advocates of discounting to convince me that I should
assign a lower value to intergenerational fatalities avoided than to one avoided next year.
With this premise in mind, I offer the following opinion on discounting the value of
human life. I have read the rationale offered by some economists for intergenerational
discounting of human life, and find what I have read uncompelling, some of it internally
inconsistent, and fatally flawed in at least one way: if one accepts any positive discount
rate that applies perpetually, then at some point in the future, avoiding the fatalities of 1
million people would be worth less to me now than the café mocha on my table. This
conclusion is morally repugnant to me, and I can therefore reject the notion of
intergenerational of discounting by reductio ad absurdum. I also reject the notion of intra-
generational discounting of human life (fatalities avoided within the next 25 years) for
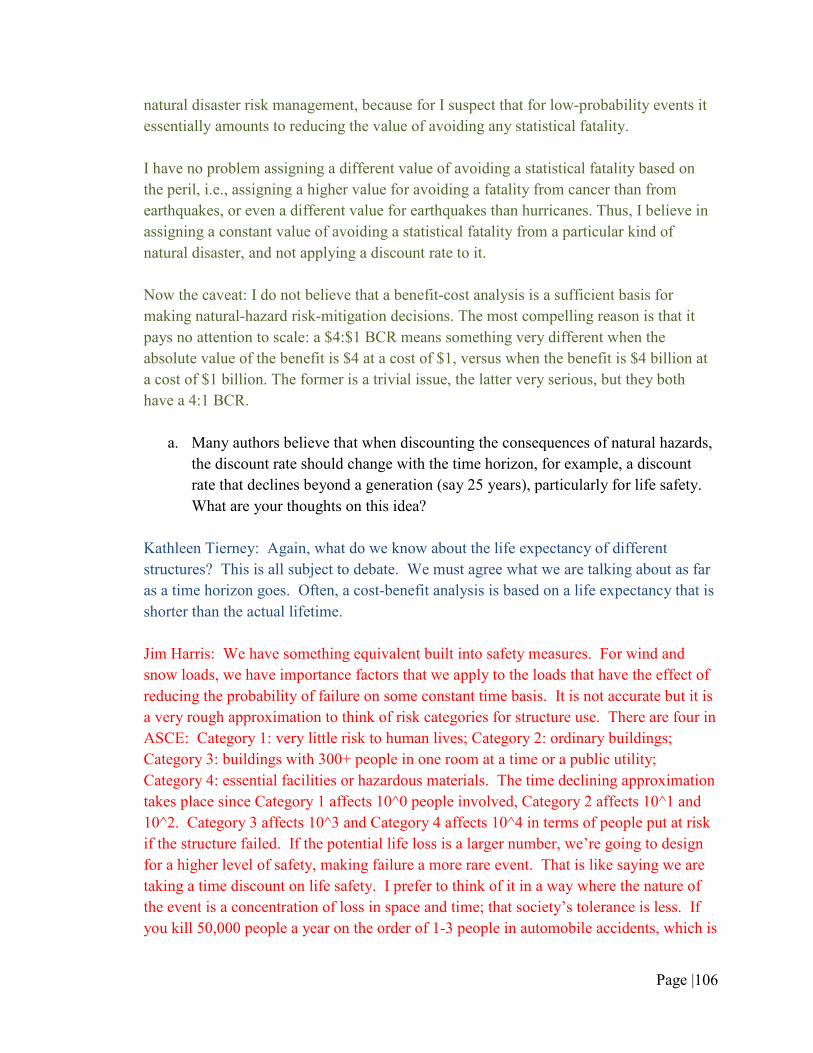
Page |
106
natural disaster risk management, because for I suspect that for low-probability events it
essentially amounts to reducing the value of avoiding any statistical fatality.
I have no problem assigning a different value of avoiding a statistical fatality based on
the peril, i.e., assigning a higher value for avoiding a fatality from cancer than from
earthquakes, or even a different value for earthquakes than hurricanes. Thus, I believe in
assigning a constant value of avoiding a statistical fatality from a particular kind of
natural disaster, and not applying a discount rate to it.
Now the caveat: I do not believe that a benefit-cost analysis is a sufficient basis for
making natural-hazard risk-mitigation decisions. The most compelling reason is that it
pays no attention to scale: a $4:$1 BCR means something very different when the
absolute value of the benefit is $4 at a cost of $1, versus when the benefit is $4 billion at
a cost of $1 billion. The former is a trivial issue, the latter very serious, but they both
have a 4:1 BCR.
a. Many authors believe that when discounting the consequences of natural hazards,
the discount rate should change with the time horizon, for example, a discount
rate that declines beyond a generation (say 25 years), particularly for life safety.
What are your thoughts on this idea?
Kathleen Tierney: Again, what do we know about the life expectancy of different
structures? This is all subject to debate. We must agree what we are talking about as far
as a time horizon goes. Often, a cost-benefit analysis is based on a life expectancy that is
shorter than the actual lifetime.
Jim Harris: We have something equivalent built into safety measures. For wind and
snow loads, we have importance factors that we apply to the loads that have the effect of
reducing the probability of failure on some constant time basis. It is not accurate but it is
a very rough approximation to think of risk categories for structure use. There are four in
ASCE: Category 1: very little risk to human lives; Category 2: ordinary buildings;
Category 3: buildings with 300+ people in one room at a time or a public utility;
Category 4: essential facilities or hazardous materials. The time declining approximation
takes place since Category 1 affects 10^0 people involved, Category 2 affects 10^1 and
10^2. Category 3 affects 10^3 and Category 4 affects 10^4 in terms of people put at risk
if the structure failed. If the potential life loss is a larger number, we’re going to design
for a higher level of safety, making failure a more rare event. That is like saying we are
taking a time discount on life safety. I prefer to think of it in a way where the nature of
the event is a concentration of loss in space and time; that society’s tolerance is less. If
you kill 50,000 people a year on the order of 1-3 people in automobile accidents, which is
Page |
107
more acceptable than killing 50,000 in 3 or 4 building collapses. We had 3000 lives lost
in Sept 11 2001 in a building collapse due to fire. Even though most of the country put it
in terms of an active war, some people put it in terms of a building failure and that the
buildings weren’t engineered well enough. It is how people react to loss.
2. Presentation of costs: This question is used to compare the response to presenting the
costs and benefits of retrofitting as a present discount value versus an annual discounted
value. Suppose you are the owner of a commercial building with a 1% risk of significant
damage due to an earthquake each year. It would cost $750,000 to retrofit your building
to dramatically increase its strength in an earthquake and the cost of damage without
retrofitting would be $4 million dollars. Which cost-presentation method would you find
most meaningful, and why? The following are all equivalent for a 25-year lifetime and
3% annual discount rate (after subtracting inflation).
a. The present discounted cost of retrofitting is $750,000 while the present
discounted savings from retrofitting is $1.9 million.
b. The annual discounted cost of retrofitting is $43,000 while the annual discounted
savings from retrofitting is $110,000.
c. You could take a loan at 6% interest and not pay anything now. The annual cost
is $58,000 and the annual savings from retrofitting is $110,000.
Kathleen Tierney: I probably would not have a tendenancy to retrofit with either of them
due to anchoring on the 1%. If the percentage was given over 30 years that would be
different. The average person would baulk at $750,000 present value retrofit cost given
only a 1% probability earthquake per year. They would more likely accept the annual
discounted retrofit cost of $43,000. There is a whole literature on framing and numeracy.
It is quite counterintuitive with percentages compared to absolute numbers.
Jim Harris: No input.
Keith Porter: Let’s consider two cases: (1) I am a real-estate investor, and (2) I am
responsible for institutional property, such as the real estate manager for Stanford
University. First case (1), and let us assume the typical case, that I plan on holding the
building for a normal investment period (3-10 years). In this case I have a hard time
choosing between these options, because I find the investment uncompelling in any case.
Reason is that it is an investment with only a 3-10% chance of producing any benefit. I
do not believe the retrofit will have a market value when I sell the building.
Page |
108
Case (2) is different. I will make my choice based on the presentation I think will be most
compelling or meaningful to the Board of Governors, or whoever I report to on capital
investments. I would tend to use presentation method (c), offering (a) as another way to
look at the investment, and possibly (b) as a 3rd viewpoint if I felt the Board assigned the
issue enough importance.
3. Scenarios: Instead of using probabilities and discounting in their cost-benefit analysis,
some studies have been basing their analysis on the scenario that the earthquake will
happen today. Since the cost of retrofitting and dollars saved are tabulated as if the
earthquake happens now, there is no discounting involved in the analysis. Therefore, the
perceived benefits may be greater than in an analysis that uses discounting. Do you
believe this is an appropriate presentation of the costs and benefits to retrofitting? Do
you see a role of certain simplifications when presenting costs to the public (i.e.
eliminating discount rate or eliminating costs)?
Kathleen Tierney: For the average decision maker, yes, provided there is a range
presented. Refer to RAND robust decision making by Robert Lempert about utility
decision making.
Jim Harris: Certainly in the case of earthquakes and hurricanes. Scenario events and
walking through the consequences is probably a better way of communicating risk o the
public than a probabilistic basis. It’s not as attractive as a quantitative method of
separating one risk from another when you are thinking of developing engineering
standards of practice. The public doesn’t do well with probability especially rare
probabilities. To some extent, mass media is changing this, but one of the big problems
with earthquakes is that unless you live in an area where earthquakes are very frequent,
you and no one to whom you are related to that is living has ever been in a serious
earthquake. Because of this, it is difficult to think that you need to be planning for what
might happen and building things so that they stand up in an earthquake. The earthquake
that severely damaged Assisi, a moderately active earthquake area, , Italy a few years
back knocked down buildings that were 500 years old. So you are dealing with real risks
that are in a time frame that people can’t relate to. The scenario event tends to get around
that.
Keith Porter: I do think this is appropriate, with a few caveats. It is appropriate because,
in my experience (CAPSS, ShakeOut, ARkStorm…) the general public finds this
presentation method much easier to grasp than loss-exceedance curves, benefit-cost
ratios, etc. Some constituencies (firefighters, emergency managers, etc.) explicitly ask for
scenarios and say they do not want depictions of probabilistic outcomes. That was the
Page |
109
case in ShakeOut, and seemed to apply in ARkStorm as well. One caveat is that
statistically savvy groups such as insurance actuaries do prefer probabilistic measures
such as PML or loss exceedance curves. When I have presented probabilistic measures to
lay audiences they either ask follow-up questions that relate to scenarios (from which I
infer that that is how they prefer to understand a risk estimate), or they do not seem to
understand the results. By contrast, when I have offered scenario results, lay audiences
seem to understand clearly, and sometimes even intuit the other caveats, which are that:
(a) the ratio of scenario benefits to retrofit costs is not a proper benefit-cost ratio, and (b)
that many other earthquakes are possible, and that the scenario could happen next year or
50 years in the future.
4. Time period: Discounted benefits are greater assuming an infinite planning period versus
a finite one. Given the same scenario commercial building and financial cost/future
savings of retrofitting discussed earlier, which cost comparison do you find more
informative:
a. 50 year lifetime, 3% discount rate: $30,000 annual cost paid over 50 years
b. Infinite lifetime, 3% discount rate: $22,500 annual cost paid over infinite years
but the structure is assumed to last for centuries.
Kathleen Tierney: None of these seem attractive. People have a very difficult time
thinking in infinite terms.
Jim Harris: I think that the 50 year time frame sounds better to most people who are in
positions to make decisions on an economic basis about buildings. There are
occasionally real estate transactions that have lifetimes longer than 50 years. There is
sometimes land leased for 100 or 200 years and then buildings are built on that land and
are owned by people that have leased land. That gives you an idea that people will spend
a large amount of dollars to build a new structure because they think of it in terms of a
limited life in a sense. There is a mind set in the real estate world that the value of real
estate will go up, generally due to scarcity of land and the reduction in the value of
currency due to inflation. Those two ideas contradict each other but they are held in the
mind of many people in the real estate world at the same time. For example, I am not
going to base my decision on an infinite life of the building but I am going to base my
thoughts on the value of the building going up. That can’t happen. I think that people
who make decision about cost-benefit ratios probably prefer to make decisions on a
deterministic time frame, not an amorphous time frame. It is similar to talking about a
fire proof or earthquake proof building – no such thing.
Keith Porter: I think this sort of presentation is only appropriate for very large
institutions and governments. I would tend to choose some middle ground, neither 50
Page |
110
years nor infinite. If I were a representative of the General Services Administration with
authority to set the planning period for presentation to Congress, or some similar role in
state government, my preference would be to use a reasonable estimate of the likely
future life of the building based on the ages of the oldest comparable buildings in Europe
or Asia. For example, let us consider the seismic retrofit of an architecturally important
seat of local or state government, such as the San Francisco City Hall or Sacramento
Capitol Building. How long is it likely to exist? The London County Hall is nearly 90
years old and is still in use (though no longer as the seat of government). The Paris Hotel
de Ville (its city hall) is now 380 years old. One of the buildings in the Moscow Kremlin
survived about 600 years before Josef Stalin had it torn down. The Topkapi Palace in
Istanbul is about 550 years old. So what planning period would I choose? 250 years
seems to be an appropriate compromise, long enough to be effectively infinite for BCR
purposes, but short enough to be strongly defensible against “cooking-the-books” attacks.
5. Do you have any additional comments on discounting or cost presentation related to risk
mitigation cost-benefit analysis?
Keith Porter: Your questionnaire deals with the parameters used within benefit-cost
analysis (CBA), and to how the costs and benefits are best presented. My response here
may seem somewhat beside the point, but I’d like to emphasize one of the limitations
common to all modes of presenting benefits in a BCA. As noted earlier, benefit-cost
analyses do not capture scale, but even less do they offer a way to quantify the existential
threat some natural disasters can pose to a city or state. By “existential threat” I mean that
they can threaten the existence of a city or state. For example, in the 27 May 1995
Sakhalin Island earthquake, the town of Neftegorsk was effectively destroyed:
approximately 2,000 of the 3,176 residents in the town were killed, and the settlement has
not been rebuilt. On a larger scale, the city of Lisbon was nearly abandoned after the
1755 earthquake, and the AD 79 eruption of Mt Vesuvius permanently destroyed
Pompeii and Herculaneum. It is unclear to me how any of the modes considered here for
presenting mitigation costs and benefits can address such existential threats. What is the
benefit of avoiding destruction of a city or state? Presumably it could be larger than the
value of avoiding the individual fatalities and the sum of the property value exposed to
loss.