Embed Size (px)
Citation preview
1
USAEE Case Competition 2014
Justin Montgomery, Yichen Du, Arthur Yip
Technology & Policy Program
Engineering Systems Division, MIT
June 16, 2014
Overcoming obstacles for private investment in energy efficiency
Agenda for presentation
2
Presentation – 15 minutes
Introduction
–Background and motivation
–Defining the initial investment market
Our solution and its key aspects
–Lowering transaction costs with protocols
–Cooperative ecosystem and scalability
–Cheaper capital through securitization
–Targeted government support
Summary – how we overcome investment obstacles
Q&A/Discussion – 15 minutes
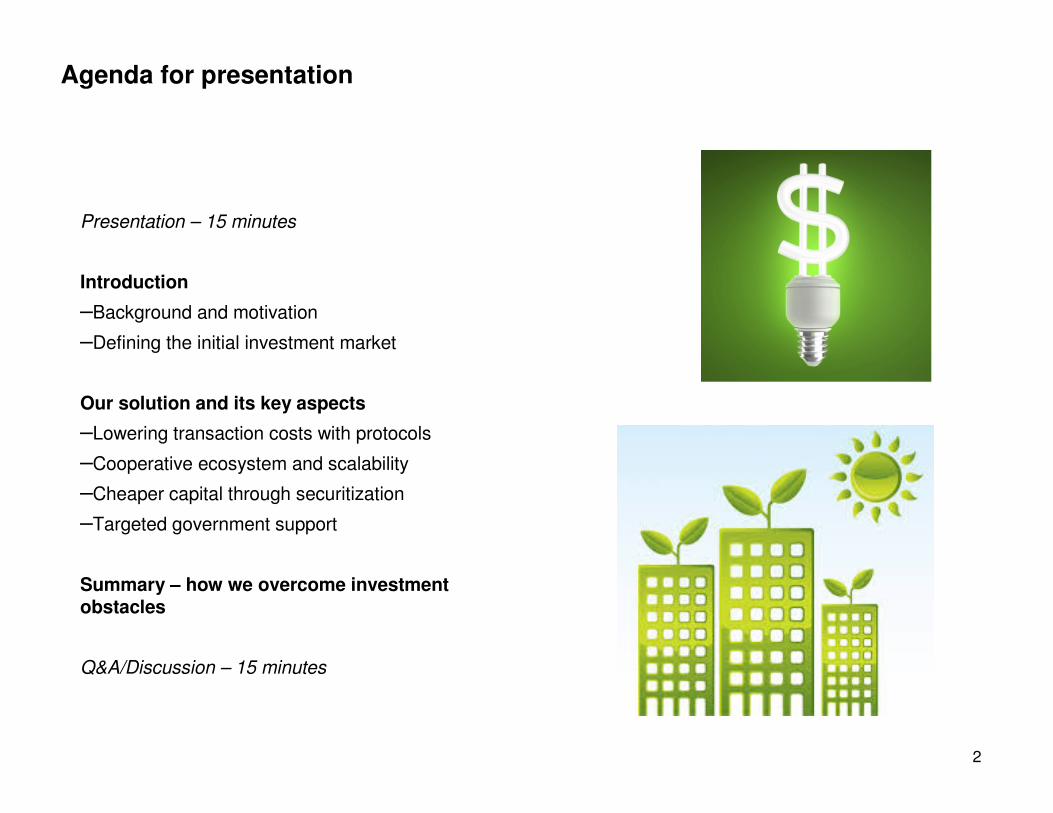
A gap exists between current energy efficiency (EE) investment and opportunity – Rather than wait for policy action, by lowering transaction costs private sector investment can be unlocked to fill this gap
3Chart from McKinsey V2.1 Global Greenhouse Gas Abatement Cost Curve
Buildings represent 28% of potential EE investment
GHG Marginal Abatement Cost Curve (MACC)
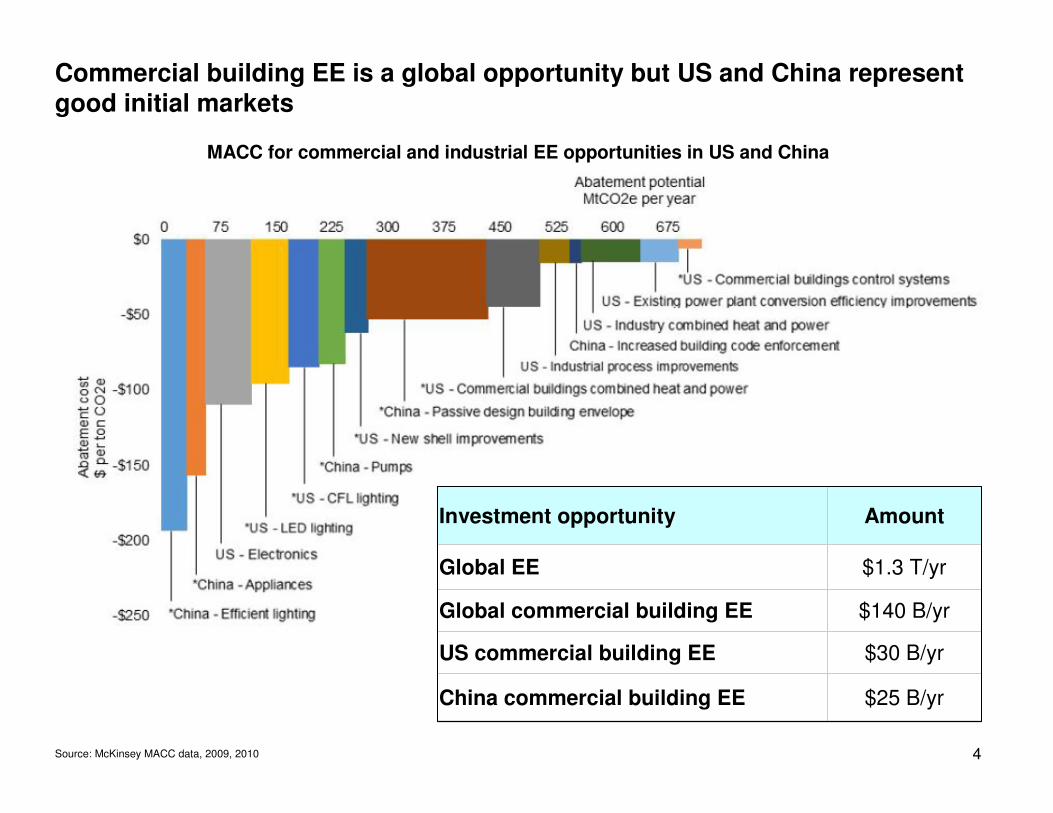
Commercial building EE is a global opportunity but US and China represent good initial markets
4Source: McKinsey MACC data, 2009, 2010
MACC for commercial and industrial EE opportunities in US and China
Investment opportunity Amount
Global EE $1.3 T/yr
Global commercial building EE $140 B/yr
US commercial building EE $30 B/yr
China commercial building EE $25 B/yr
5
We propose the creation of a securitized investment fund that will invest directly in energy efficiency projects while leveraging
–Standard protocols for all aspects of projects
–A cooperative, scalable energy efficiency investment ecosystem
–Targeted policy assistance
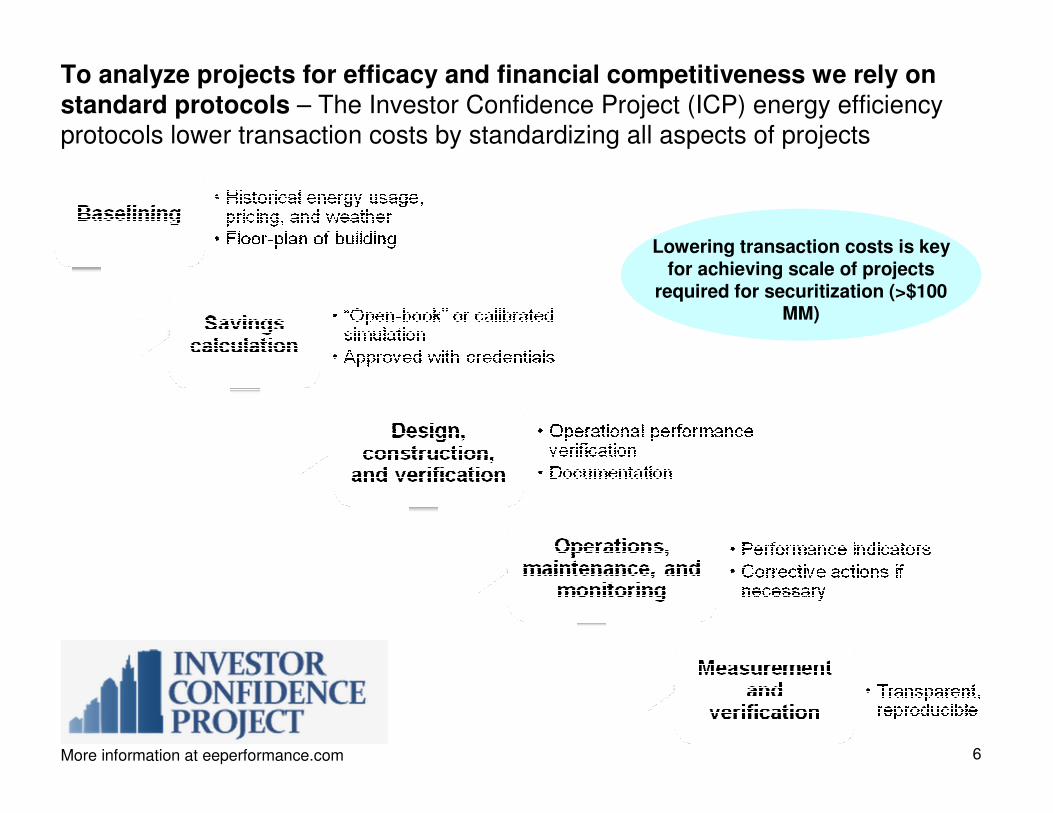
To analyze projects for efficacy and financial competitiveness we rely on standard protocols – The Investor Confidence Project (ICP) energy efficiency protocols lower transaction costs by standardizing all aspects of projects
6More information at eeperformance.com
Lowering transaction costs is key for achieving scale of projects
required for securitization (>$100 MM)
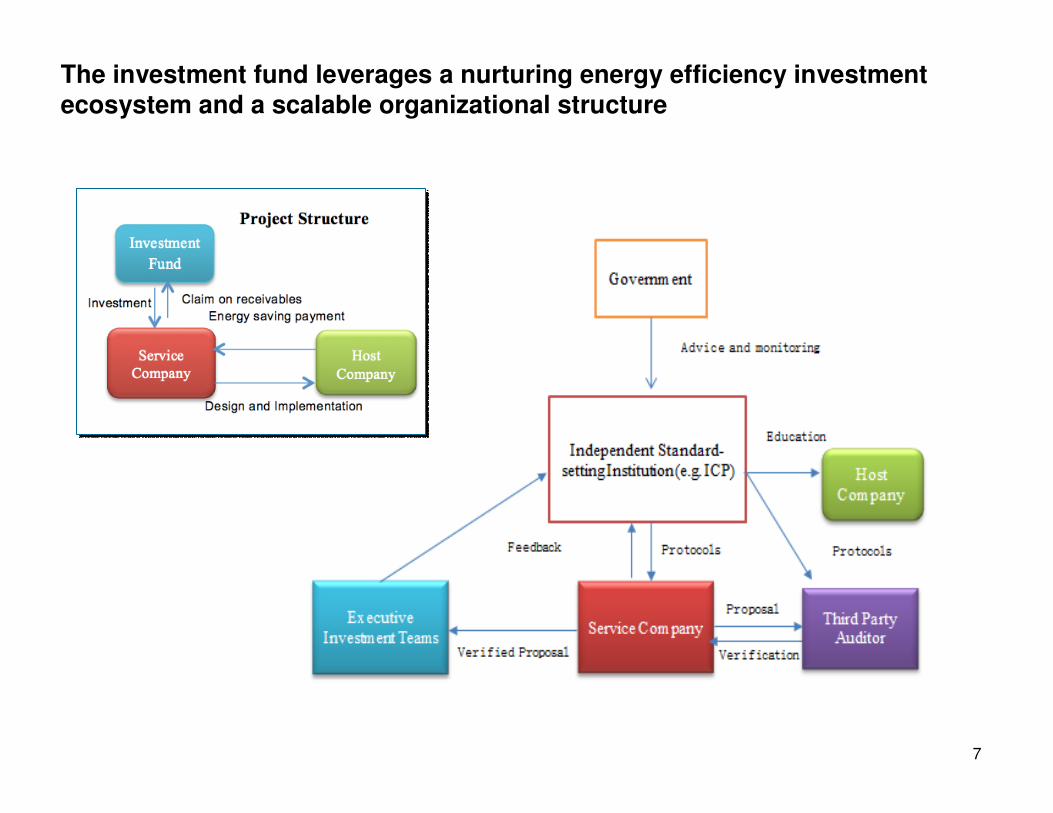
The investment fund leverages a nurturing energy efficiency investment ecosystem and a scalable organizational structure
7
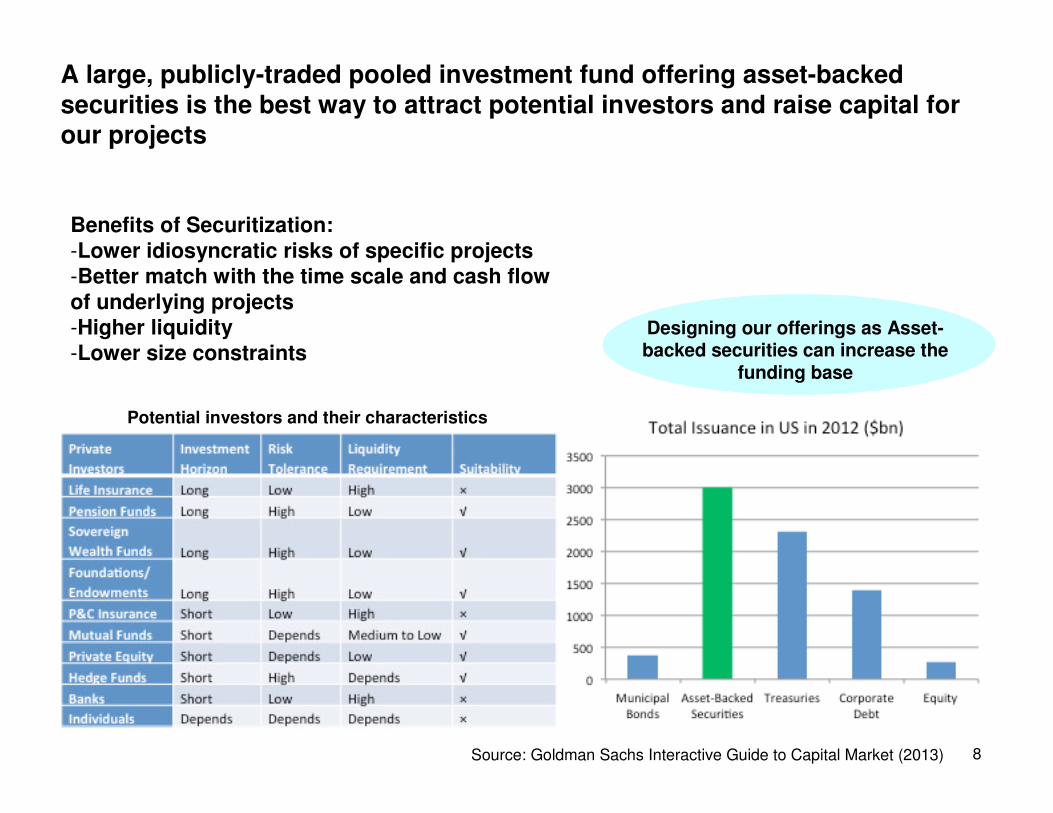
A large, publicly-traded pooled investment fund offering asset-backed securities is the best way to attract potential investors and raise capital for our projects
8
Benefits of Securitization:-Lower idiosyncratic risks of specific projects-Better match with the time scale and cash flow of underlying projects-Higher liquidity-Lower size constraints
Designing our offerings as Asset-backed securities can increase the
funding base
Source: Goldman Sachs Interactive Guide to Capital Market (2013)
Potential investors and their characteristics
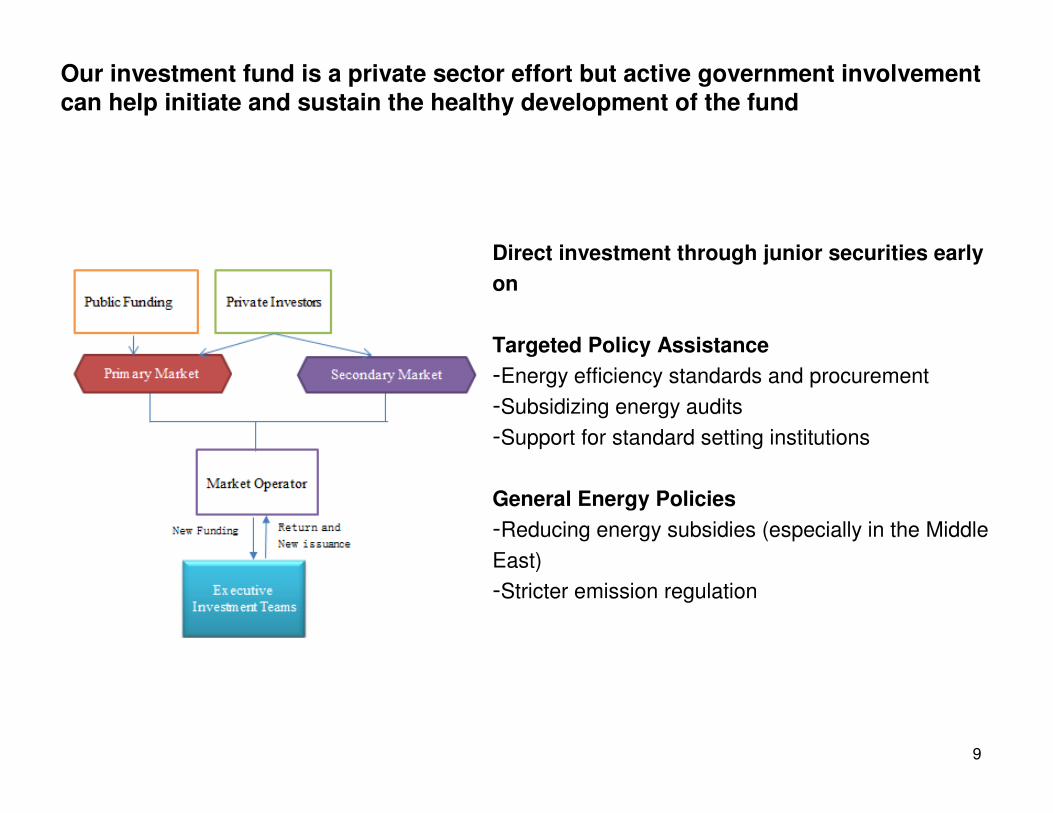
Our investment fund is a private sector effort but active government involvement can help initiate and sustain the healthy development of the fund
9
Direct investment through junior securities early
on
Targeted Policy Assistance
-Energy efficiency standards and procurement
-Subsidizing energy audits
-Support for standard setting institutions
General Energy Policies
-Reducing energy subsidies (especially in the Middle
East)
-Stricter emission regulation
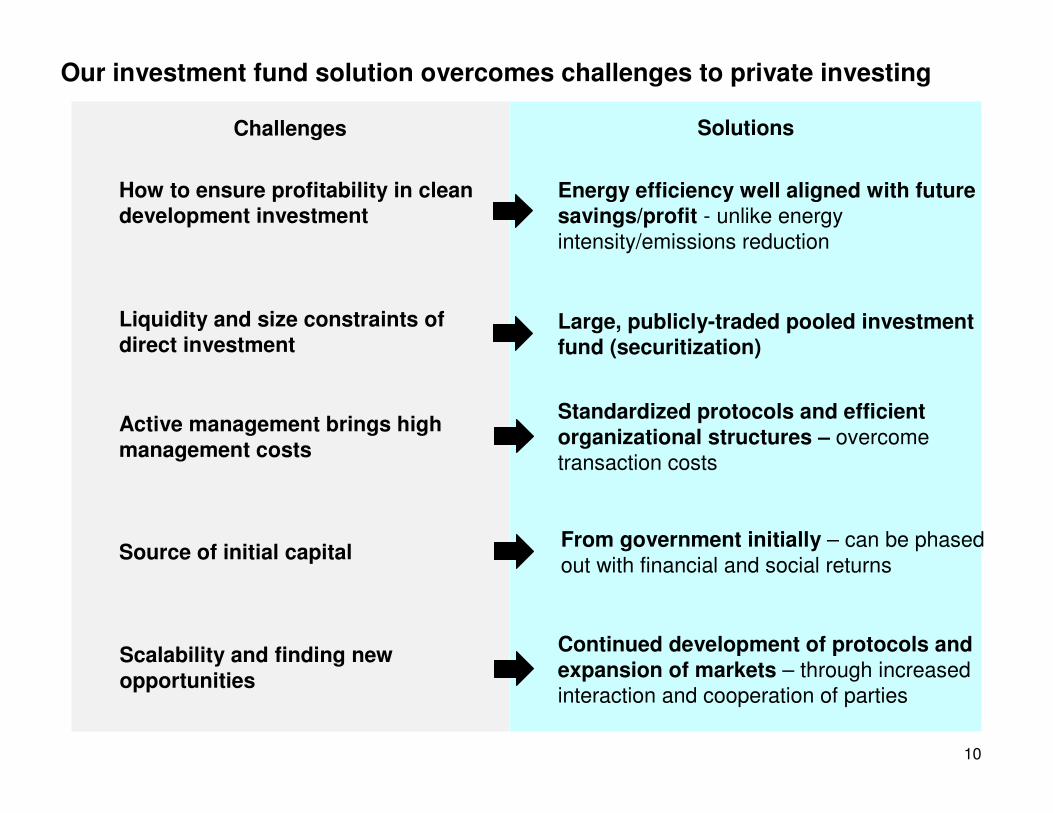
Our investment fund solution overcomes challenges to private investing
10
How to ensure profitability in clean development investment
Energy efficiency well aligned with future savings/profit - unlike energy intensity/emissions reduction
Challenges Solutions
Liquidity and size constraints of direct investment
Large, publicly-traded pooled investment fund (securitization)
Active management brings high management costs
Standardized protocols and efficient organizational structures – overcome transaction costs
Source of initial capitalFrom government initially – can be phased out with financial and social returns
Scalability and finding new opportunities
Continued development of protocols and expansion of markets – through increased interaction and cooperation of parties

Sta
nd
ard
izati
on
Pri
va
te I
nve
stm
en
t
Go
vern
men
tal
Su
pp
ort
Str
on
g E
co
syste
m
Scala
bilit
y
Secu
riti
zati
on
The Golden Equation for a Clean Investment Mechanism
Q&A / Discussion
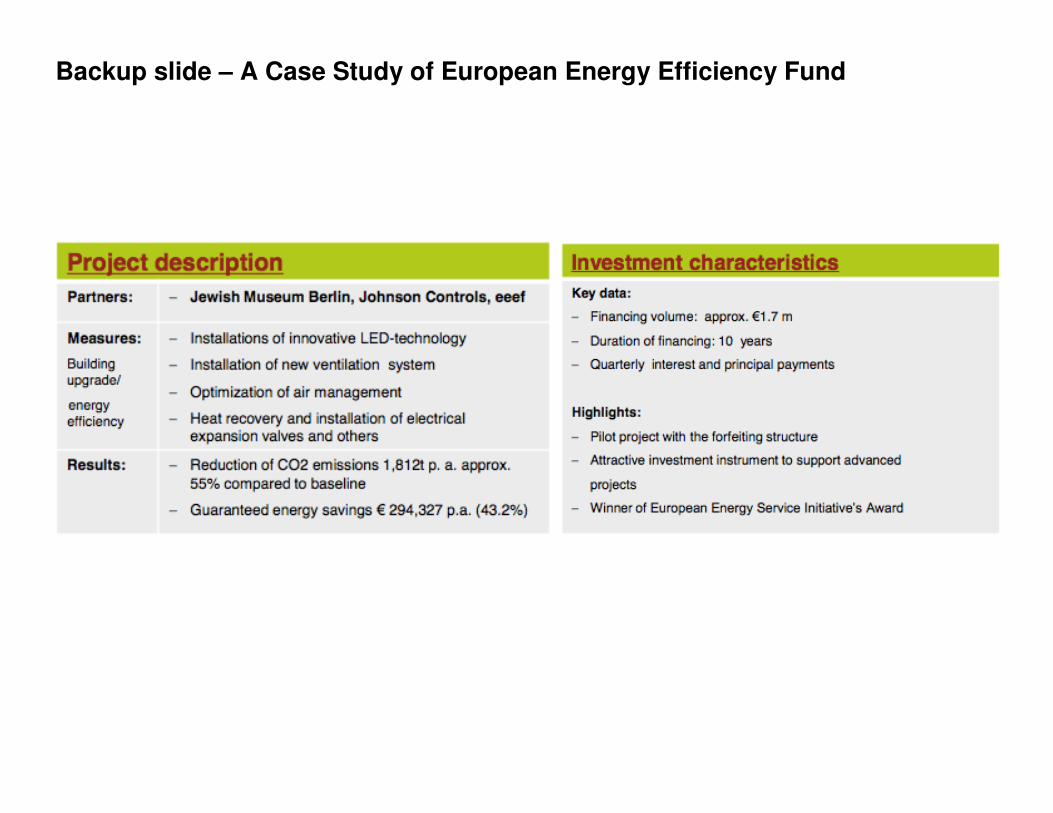
Backup slide – A Case Study of European Energy Efficiency Fund
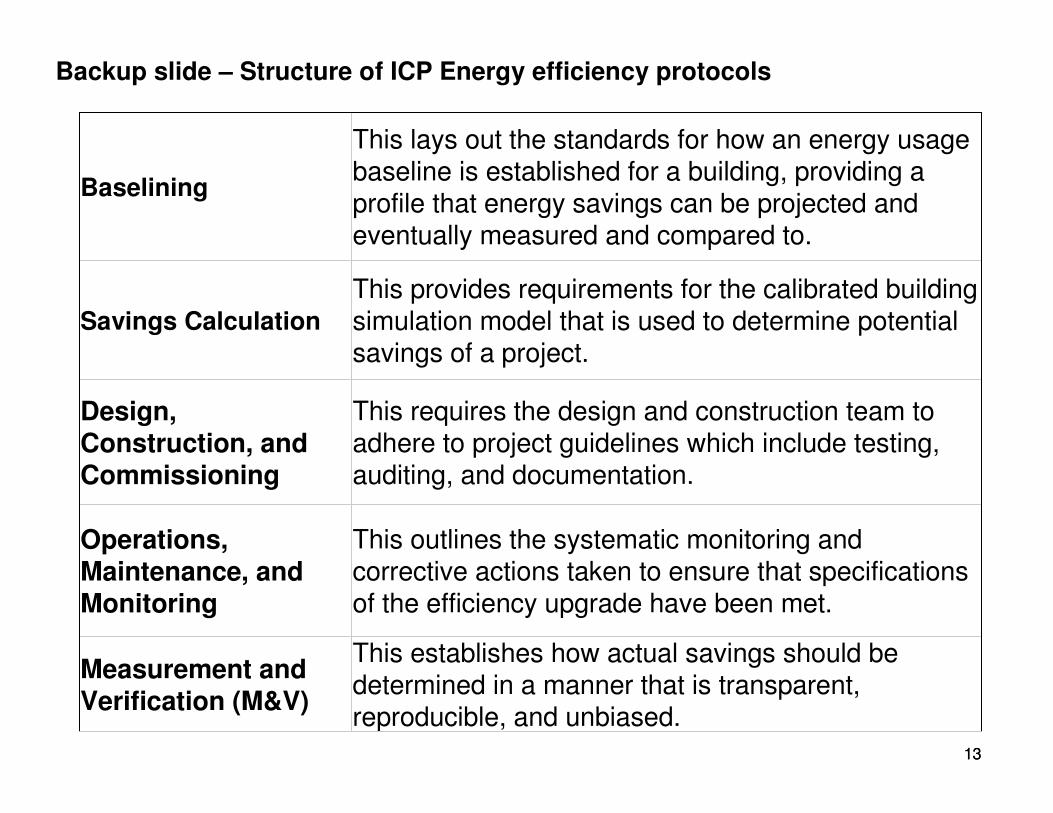
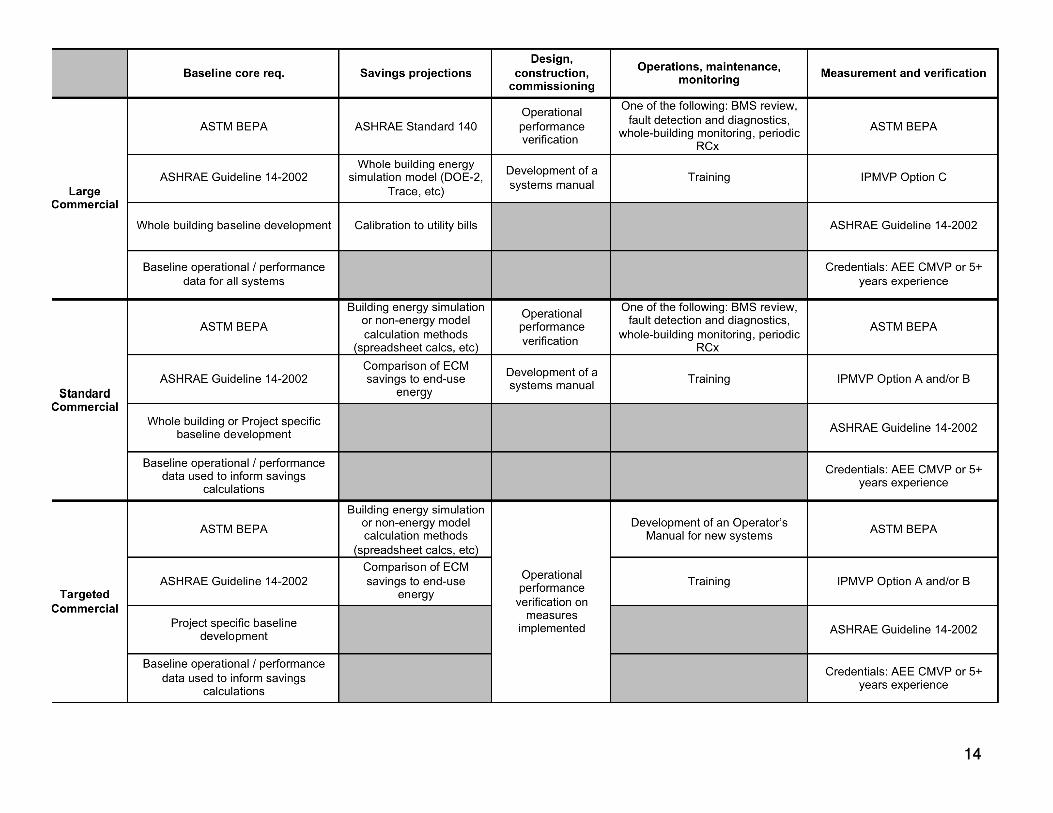
Backup slide – Structure of ICP Energy efficiency protocols
1313
Baselining
This lays out the standards for how an energy usage baseline is established for a building, providing a profile that energy savings can be projected and eventually measured and compared to.
Savings Calculation
This provides requirements for the calibrated building simulation model that is used to determine potential savings of a project.
Design, Construction, and Commissioning
This requires the design and construction team to adhere to project guidelines which include testing, auditing, and documentation.
Operations, Maintenance, and Monitoring
This outlines the systematic monitoring and corrective actions taken to ensure that specifications of the efficiency upgrade have been met.
Measurement and Verification (M&V)
This establishes how actual savings should be determined in a manner that is transparent, reproducible, and unbiased.
1414
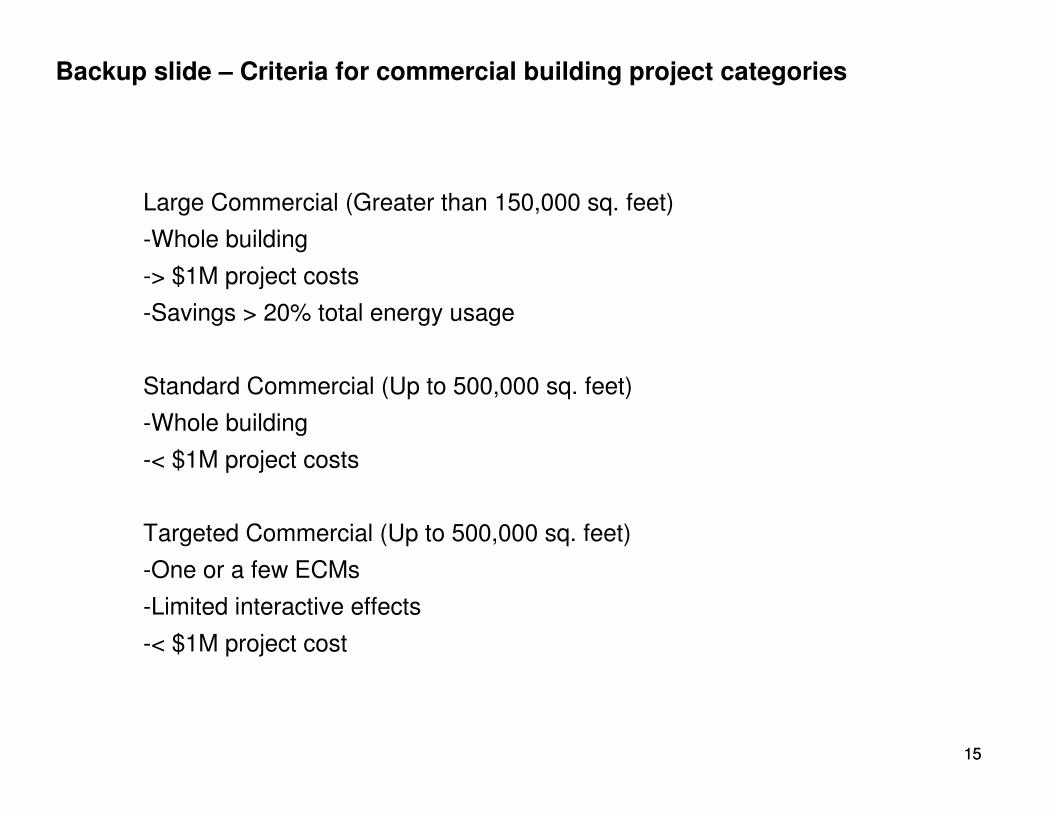
Backup slide – Criteria for commercial building project categories
1515
Large Commercial (Greater than 150,000 sq. feet)
-Whole building
-> $1M project costs
-Savings > 20% total energy usage
Standard Commercial (Up to 500,000 sq. feet)
-Whole building
-< $1M project costs
Targeted Commercial (Up to 500,000 sq. feet)
-One or a few ECMs
-Limited interactive effects
-< $1M project cost
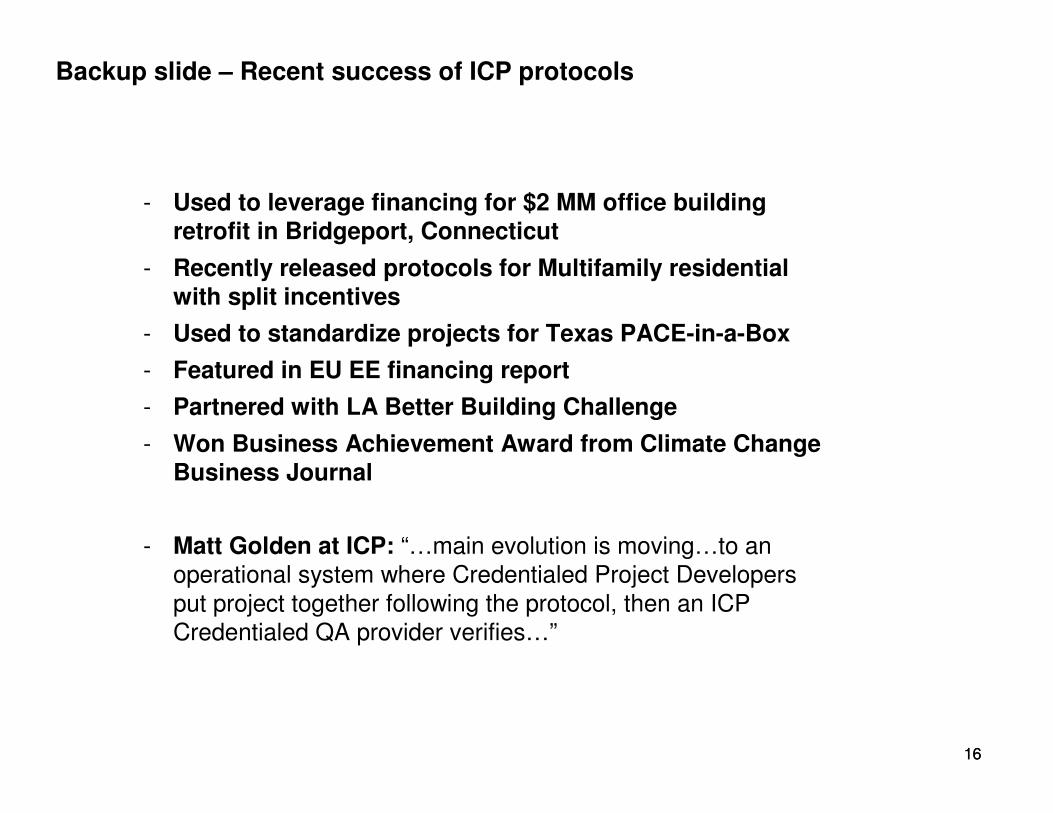
Backup slide – Recent success of ICP protocols
1616
- Used to leverage financing for $2 MM office building retrofit in Bridgeport, Connecticut
- Recently released protocols for Multifamily residential with split incentives
- Used to standardize projects for Texas PACE-in-a-Box
- Featured in EU EE financing report
- Partnered with LA Better Building Challenge
- Won Business Achievement Award from Climate Change Business Journal
- Matt Golden at ICP: “…main evolution is moving…to an operational system where Credentialed Project Developers put project together following the protocol, then an ICP Credentialed QA provider verifies…”
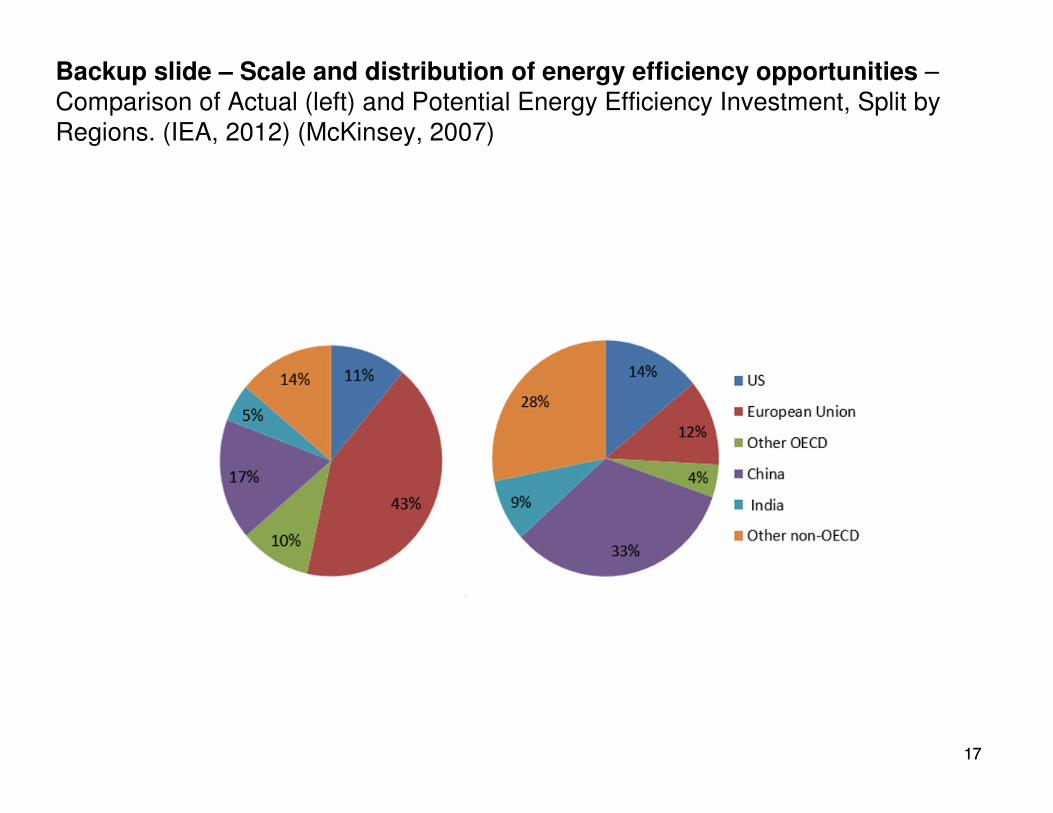
Backup slide – Scale and distribution of energy efficiency opportunities –Comparison of Actual (left) and Potential Energy Efficiency Investment, Split by Regions. (IEA, 2012) (McKinsey, 2007)
1717
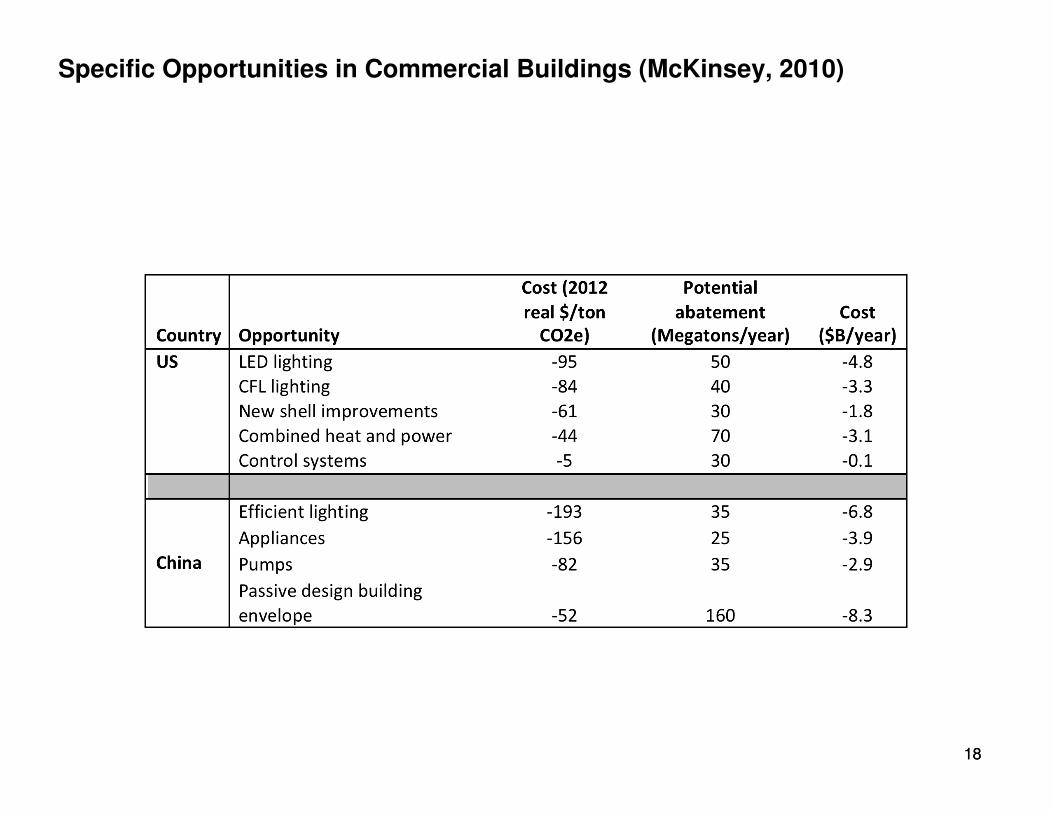
Specific Opportunities in Commercial Buildings (McKinsey, 2010)
1818