Embed Size (px)
Citation preview
1
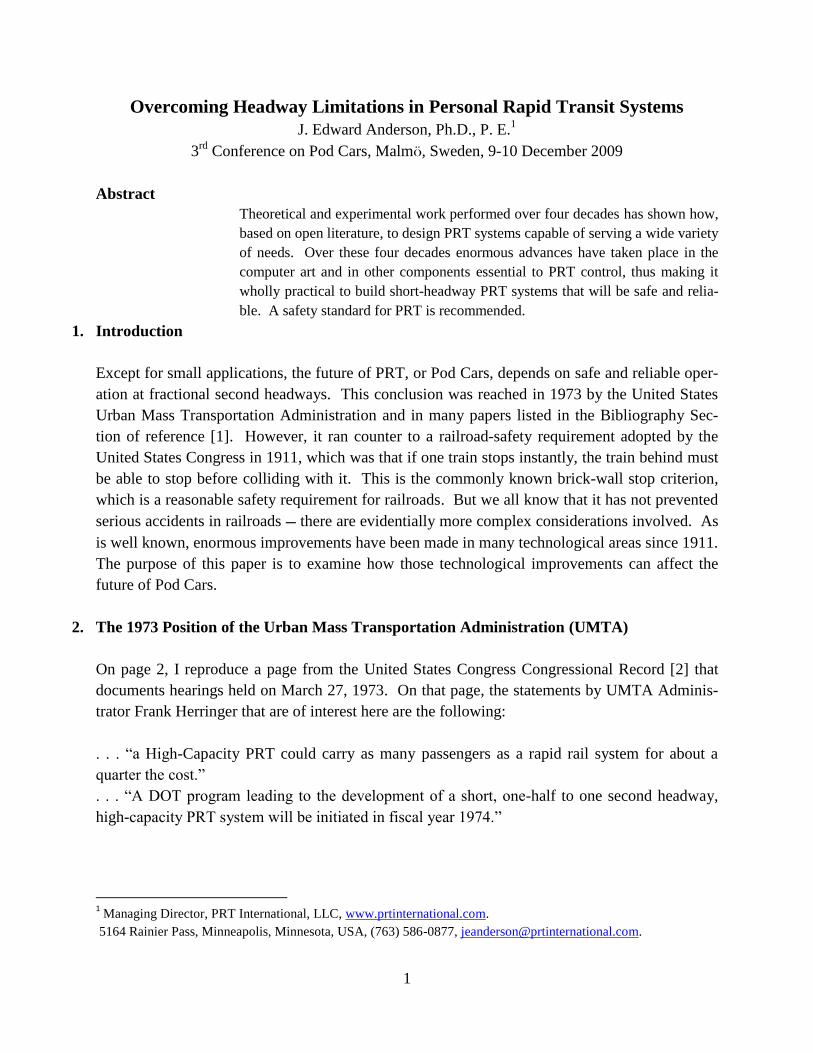
Overcoming Headway Limitations in Personal Rapid Transit Systems
J. Edward Anderson, Ph.D., P. E.1
3rd
Conference on Pod Cars, Malmö, Sweden, 9-10 December 2009
Abstract
Theoretical and experimental work performed over four decades has shown how,
based on open literature, to design PRT systems capable of serving a wide variety
of needs. Over these four decades enormous advances have taken place in the
computer art and in other components essential to PRT control, thus making it
wholly practical to build short-headway PRT systems that will be safe and relia-
ble. A safety standard for PRT is recommended.
1. Introduction
Except for small applications, the future of PRT, or Pod Cars, depends on safe and reliable oper-
ation at fractional second headways. This conclusion was reached in 1973 by the United States
Urban Mass Transportation Administration and in many papers listed in the Bibliography Sec-
tion of reference [1]. However, it ran counter to a railroad-safety requirement adopted by the
United States Congress in 1911, which was that if one train stops instantly, the train behind must
be able to stop before colliding with it. This is the commonly known brick-wall stop criterion,
which is a reasonable safety requirement for railroads. But we all know that it has not prevented
serious accidents in railroads — there are evidentially more complex considerations involved. As
is well known, enormous improvements have been made in many technological areas since 1911.
The purpose of this paper is to examine how those technological improvements can affect the
future of Pod Cars.
2. The 1973 Position of the Urban Mass Transportation Administration (UMTA)
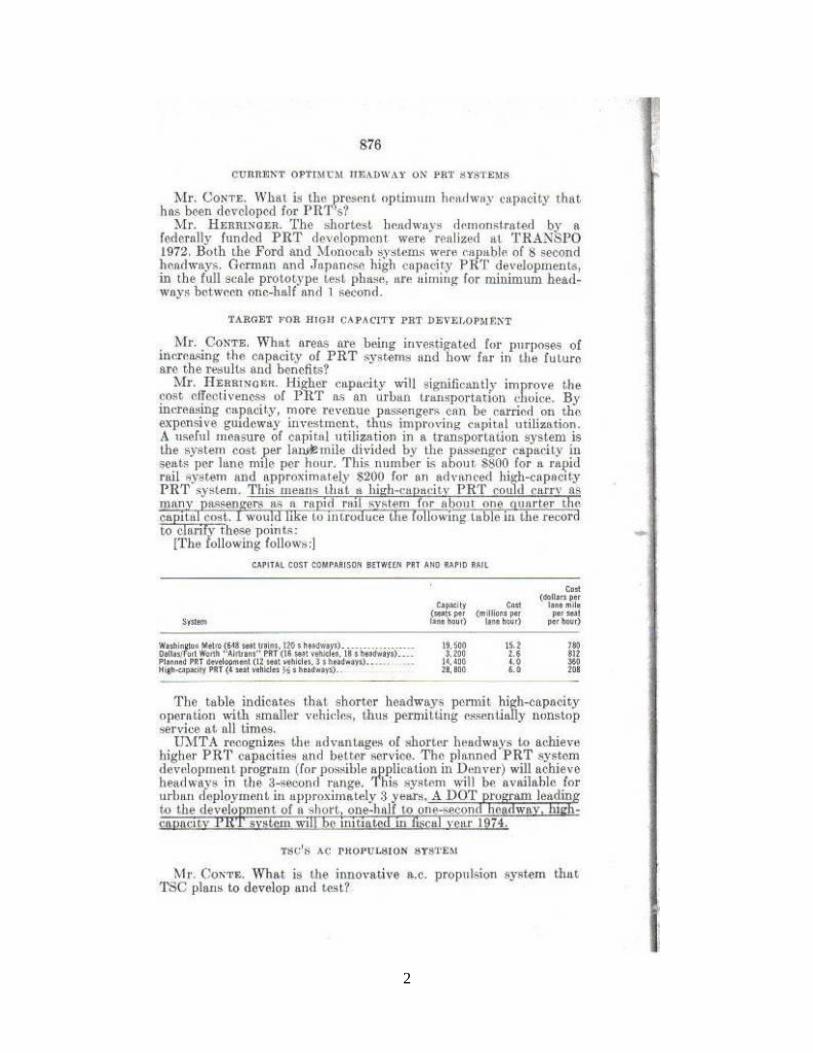
On page 2, I reproduce a page from the United States Congress Congressional Record [2] that
documents hearings held on March 27, 1973. On that page, the statements by UMTA Adminis-
trator Frank Herringer that are of interest here are the following:
. . . “a High-Capacity PRT could carry as many passengers as a rapid rail system for about a
quarter the cost.”
. . . “A DOT program leading to the development of a short, one-half to one second headway,
high-capacity PRT system will be initiated in fiscal year 1974.”
1 Managing Director, PRT International, LLC, www.prtinternational.com.
5164 Rainier Pass, Minneapolis, Minnesota, USA, (763) 586-0877, [email protected].
2
3
So, why didn’t the UMTA program proceed? In short, it was too much too soon for an estab-
lished transportation industry [3]. To use a phrase coined by ARPA-E, an agency of the U. S.
Department of Energy, Personal Rapid Transit is disruptive and transformational. To quote
from a Funding Opportunity Announcement released by ARPA-E on April 27, 2009:
“This is the first solicitation for the Advanced Research Projects Agency – Energy (ARPA-E).
ARPA-E is a new organization within the Department of Energy (DOE), created specifically to
foster research and development (R&D) of transformational energy-related technologies. Trans-
formational technologies are by definition technologies that disrupt the status quo. They are not
merely better than current technologies, they are significantly better. Often, a technology is con-
sidered transformational when it so outperforms current approaches that it causes an industry to
shift its technology base to the new technology. The Nation needs transformational energy-
related technologies to overcome the threats posed by climate change and energy security, aris-
ing from its reliance on traditional uses of fossil fuels and the dominant use of oil in transporta-
tion.” (Emphasis added.)
Today, the situation is very different than it was in 1973. Automobile manufacturing companies
continue to do what they know how to do and what their shareholders expect. More and more
automobile manufacturers in more and more countries believe they need to build more and more
automobiles ever year, notwithstanding that cities are already clogged with automobiles, and that
the enormous land requirements of automobiles (30% in residential areas, and 50% to 70% in
major activities centers) cause low-density living patterns that will be more and more difficult to
serve as energy gets more and more expensive. Forty years of experience of government subsidy
of conventional scheduled, all-stop transit shows that a relatively small fraction of the urban
population opts for these systems. In 1968, studies authorized by the United States Congress and
funded through the newly founded Urban Mass Transportation Administration concluded that if
the United States encourages only expansion of its conventional scheduled, all-stop transit sys-
tems, congestion will continually worsen, but if the new personal transit systems are deployed, it
will be possible to reverse the trend [4]. A great gap exists between automobiles and convention-
al transit, a gap that can be filled by systems we have called High-Capacity PRT or in Sweden
Pod Cars.
3. Advances in Computer Technology since 1973
While every Pod Car Conference attendee is well aware of the enormous advances in computer
technology since 1973, i.e. 36 years ago, it is worthwhile to review these advances quantitatively
to the extent we can without becoming computer historians.
4
Since about 1960, computer memory has followed a “law” pronounced by Intel Co-Founder
Gordon Moore: It has doubled every 18 months! In 36 years there are 24 18-month periods
and 224
is 16,777,216.
How about computer speed? In 1975 the state of the art was about 2 kilobytes per second.
Today, high performance computers run at 12 gigabytes per second, an improvement by a
factor of 6,000,000.
Reliability: The main problem with continuously decreasing the size of computer compo-
nents is heat dissipation. Too much heat destroys the tiny transistors. By backing off the
present maximum transistor density by one order of magnitude, safety-critical microproces-
sors hardly ever fail, and these devices are now tiny compared to their size even a decade
ago.
As to the ease of computer programming, any experienced computer programmer will attest
to enormous improvements.
Computer design tools likewise have improved in sophistication and speed by many orders
of magnitude. In 1975 we did all our computing on mainframe computers costing hundreds
of dollars an hour for computer time. Since the 1980s, the personal computer has become
more and more useful — now for many uses taking over the function formerly assigned to
the work station.
4. Calculating Headway
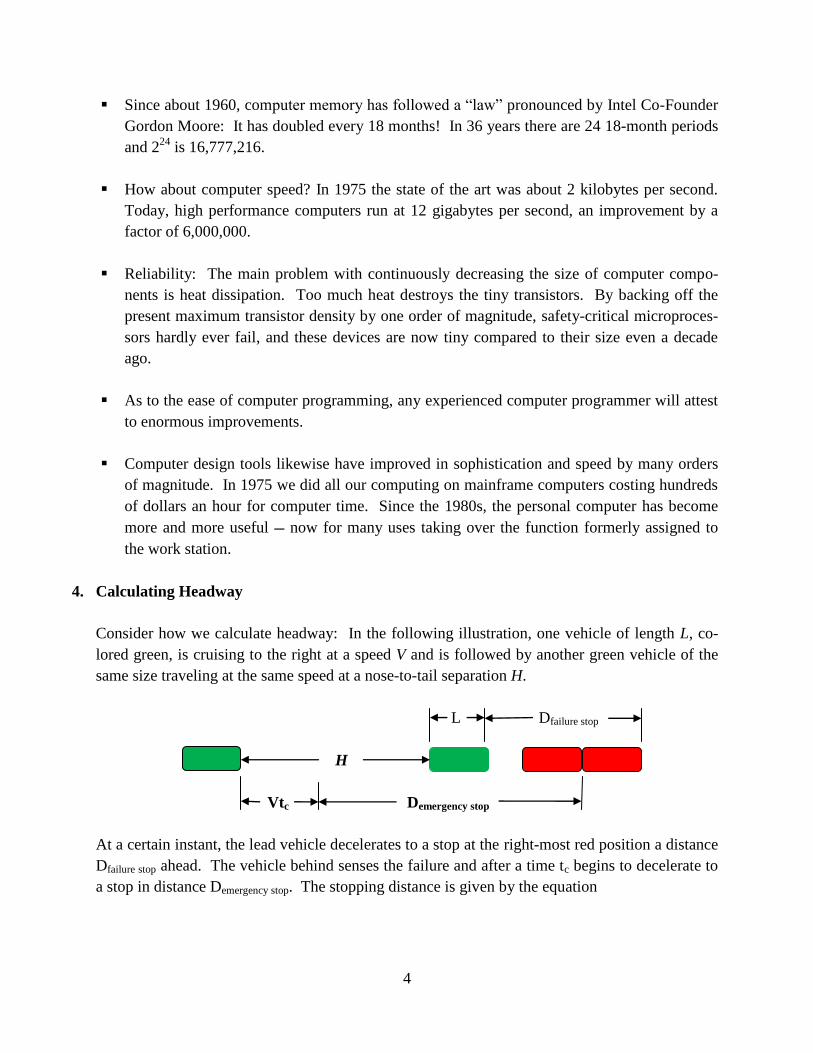
Consider how we calculate headway: In the following illustration, one vehicle of length L, co-
lored green, is cruising to the right at a speed V and is followed by another green vehicle of the
same size traveling at the same speed at a nose-to-tail separation H.
L Dfailure stop
H
Vtc Demergency stop
At a certain instant, the lead vehicle decelerates to a stop at the right-most red position a distance
Dfailure stop ahead. The vehicle behind senses the failure and after a time tc begins to decelerate to
a stop in distance Demergency stop. The stopping distance is given by the equation
5
𝑆𝑡𝑜𝑝 𝐷𝑖𝑠𝑡𝑎𝑛𝑐𝑒 =1
2𝑉 × 𝑆𝑡𝑜𝑝𝑇𝑖𝑚𝑒 𝑆𝑡𝑜𝑝𝑇𝑖𝑚𝑒 =
𝑉
𝐴+
𝐴
𝐽
in which A is the deceleration and J is the jerk. From the diagram, we have
𝐻 = 𝑉𝑡𝑐 +1
2𝑉 𝐸𝑚𝑒𝑟𝑔𝑒𝑛𝑐𝑦𝑆𝑡𝑜𝑝𝑇𝑖𝑚𝑒 − 𝐹𝑎𝑖𝑙𝑢𝑟𝑒𝑆𝑡𝑜𝑝𝑇𝑖𝑚𝑒
The time headway is the nose-to-nose separation divided by speed V. Thus
𝑇𝑖𝑚𝑒 𝐻𝑒𝑎𝑑𝑤𝑎𝑦 =𝐿 + 𝐻
𝑉=
𝐿
𝑉+ 𝑡𝑐 +
1
2 𝐸𝑚𝑒𝑟𝑔𝑒𝑛𝑐𝑦𝑆𝑡𝑜𝑝𝑇𝑖𝑚𝑒 − 𝐹𝑎𝑖𝑙𝑢𝑟𝑒𝑆𝑡𝑜𝑝𝑇𝑖𝑚𝑒
It is clear that the shortest time headway is obtained if the reaction time tc is very short and if no
reasonable failure can cause a vehicle to stop in a time shorter than any vehicle can stop if the
emergency brakes are applied [5]. Thus, for a fractional-second-headway PRT system, the time
headway is given by
𝑇𝑖𝑚𝑒 𝐻𝑒𝑎𝑑𝑤𝑎𝑦 =𝐿
𝑉+ 𝑡𝑐
5. How do we keep Vehicles from Crashing?
The means of control I recommend is described in Reference [6]. This strategy can be classified
as an “asynchronous point follower.” It is “asynchronous” because the operation of a PRT sys-
tem is entirely demand activated. Such a system requires no clock synchronization for any rea-
son other than that calculation of speed and position must be done in real time and, just as in the
automobile system, merge conflicts are resolved at each merge. The strategy I recommend is a
“point follower” because the vehicles closely follow speeds and positions that are calculated as
functions of real time, are commanded by wayside computers, and are monitored by these way-
side computers. I have found [7, 19] that the code required to operate an asynchronous point-
following strategy is the simplest that can be devised.
The instruments we use today to measure position and speed are much more accurate than we
need and today our computers respond to and correct speed and position two hundred times per
second. Wayside zone controllers closely monitor vehicle motion and cause the vehicles to slow
to creep speed if an anomaly is sensed. The state of the art now is such that computers routinely
land airplanes on aircraft-carrier decks, a much more complex problem because both the airplane
and the carrier deck are subject to three translational and three rotational motions, while we need
only be concerned with PRT motion in one direction, with the merging of two one-dimensional
streams the most complex maneuver. More detail on this fundamentally important question fol-
lows.
6
6. The 1990’s Automated Highway Project (PATH2)
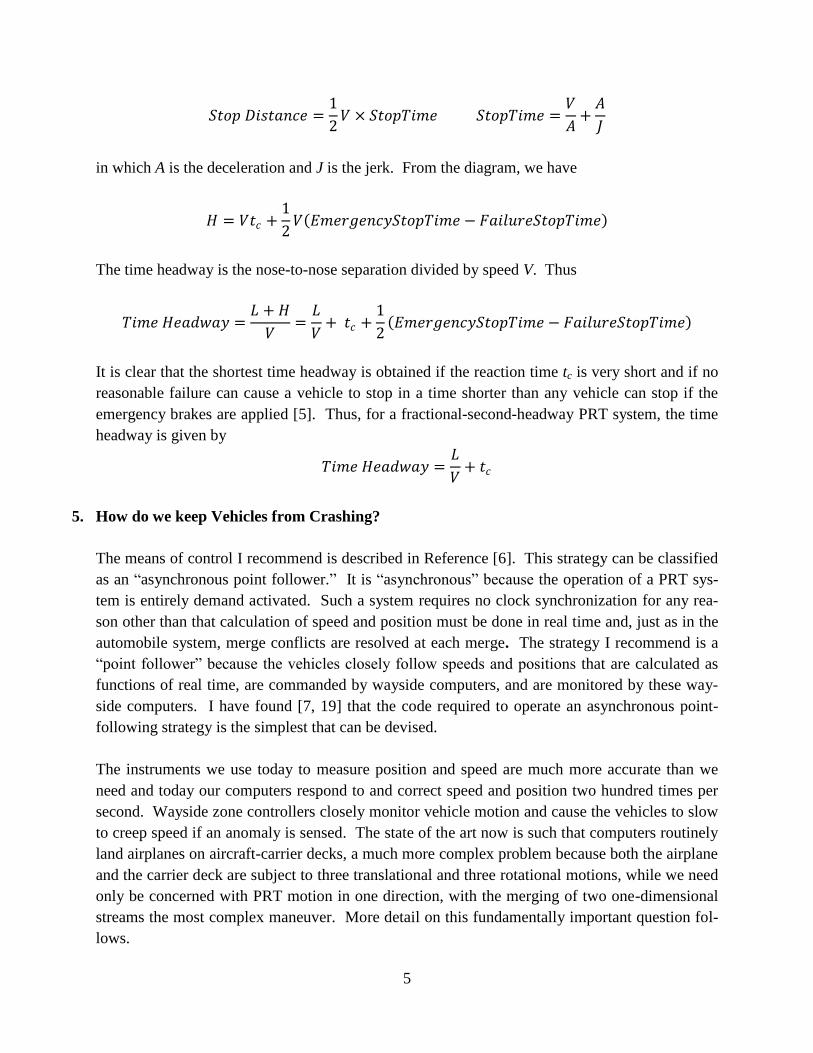
The picture to the right is of six 17-ft (5.18 meter) long Buick automobiles operating during the
1990s under automatic control on a freeway near San Diego, California [8]. At 60 mph or 26.8
meters per second the closest headway these vehicles operated at was a nose-to-tail spacing of
seven feet (2.13 m). Thus the minimum time headway
was (5.18 + 2.13)/26.8 = 0.273 seconds, which is closer
than we need in a PRT system. At such a close headway,
the emergency braking time must be as short as the fail-
ure braking time, in which case tc = H/V = 2.13/26.8 =
0.080 sec. The PATH program was funded by the United
States Federal Government and was monitored by the Na-
tional Highway Traffic Safety Board. Thus, if high-
capacity PRT could be classified as a type of automated
highway, safety certification would already be in hand. Figure 1. Buicks operating at short headway.
7. The Minimum-Headway Graph
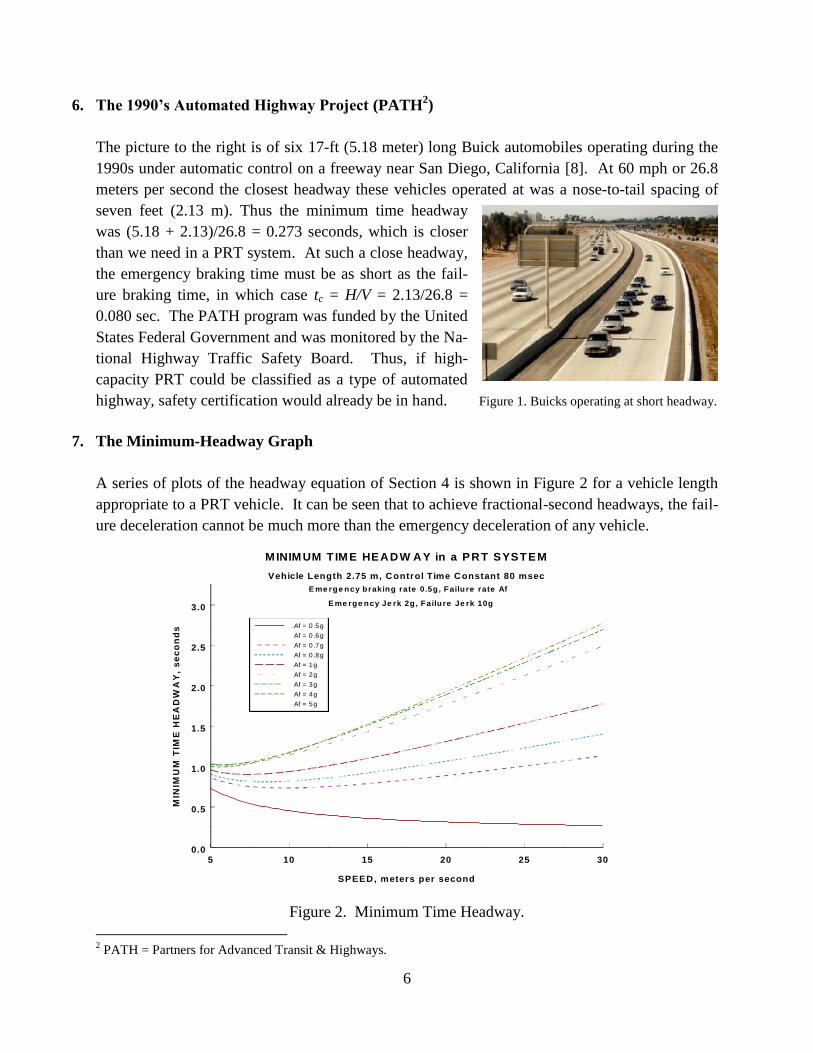
A series of plots of the headway equation of Section 4 is shown in Figure 2 for a vehicle length
appropriate to a PRT vehicle. It can be seen that to achieve fractional-second headways, the fail-
ure deceleration cannot be much more than the emergency deceleration of any vehicle.
Figure 2. Minimum Time Headway.
2 PATH = Partners for Advanced Transit & Highways.
5 10 15 20 25 30
SPEED, meters per second
0.0
0.5
1.0
1.5
2.0
2.5
3.0
MIN
IMU
M T
IME
HE
AD
WA
Y,
se
co
nd
s
MINIMUM T IME HEADW AY in a PRT SYSTEM
Vehicle Length 2.75 m, Control Time Constant 80 msec
E me rge ncy braking rate 0.5g, Failure rate Af
Af = 0 .5g
Af = 0 .6g
Af = 0 .7g
Af = 0 .8g
Af = 1g
Af = 2g
Af = 3g
Af = 4g
Af = 5g
E me rge ncy Je rk 2g, Failure Je rk 10g
7
8. The Use of Linear Induction Motors
In the PATH Program, described in Section 6, the vehicles are propelled and braked through the
wheels. High-capacity in PRT can be attained much more safety and reliably in all reasonable
weather conditions if we propel and brake the vehicles using linear induction motors (LIMs).
The operation of LIMs is described in the Appendix. Let us compare the characteristics of these
two means of propulsion and braking:
Braking rate
Wheel braking depends on friction, grade, or wind and it is necessary to assume the worst
conditions when calculation the minimum safe headway. LIM braking is constant as com-
manded, independent of friction, grade, or wind and we can depend on a LIM-operated ve-
hicle to stop as quickly as a failed vehicle independent of the friction of the running surface.
Reaction time
Based on the data I have seen, it takes several hundred milliseconds for the full effect of a
wheel-brake command to be felt. When a LIM is operational braking is almost instantaneous.
Moving parts
A vehicle propelled and braked through wheels has many moving parts. With LIM propul-
sion and braking the only moving part is a fan need for air cooling of the LIM, and that is not
a safety critical item. If one of at least two fans on a LIM were to fail, and the vehicle has two
LIMs, the one with the defective fan can be shut off and the vehicle stopped at the next sta-
tion, where passengers would egress, following which the vehicle would be sent empty to the
nearest maintenance station.
How can we obtain an adequate braking force?
With propulsion and braking through wheels (in PRT usually rubber tired) the running surface
must be sufficiently rough to enable any vehicle to stop quickly on a wet or icy surface.
Raytheon, having opted for propulsion and braking through wheels in Phase II of the Chicago
PRT project, discovered too late that wet-weather operation required them to roughen the
running surface by bonding to it a type of sand used on aircraft carrier decks to prevent crew
members from sliding on a wet deck. Two problems result:
1. If the irrevocable emergency brakes need to be applied on a dry, roughened surface,
the deceleration rate is between 0.7 and 0.9 g, which is enough to throw an unre-
8
strained passenger into the windshield. Yet the Chicago RTA lawyers insisted that
there be no restraining devices in the vehicles — they didn’t want to set precedence.
This problem was never resolved.
2. Repeated acceleration and braking through the rubber tires leaves some tire material
imbedded in the roughened surface, and eventually the surface must be replaced, re-
sulting in a large maintenance cost.
With LIM propulsion and primary braking, we want the running surface to be as smooth as prac-
tical, and we want the wheels to be rollers only, i.e., no braking through the wheels. In this case,
in the remote chance that a wheel bearing were to freeze, the decelerating force will be less than
about 20% of one quarter of the gross weight of the vehicle, which would cause a deceleration
rate of no more than about 0.05g.
There must be a backup emergency braking system. We have proposed a pair of brake shoes
supported from the lower surface of the vehicle chassis through parallelogram linkages, so that
they remain parallel to and very close to the running surface. Each of two independent brake
shoes is activated by a no-power-on, no-power-off ball-screw actuator and is restrained from
moving past the point of maximum extension, thus satisfying the requirement that they be irre-
vocable. No-power-on means that power is not required to maintain the on condition and simi-
larly for the off condition. The actuators are electrically connected to activate from an auxiliary
on-board battery if vehicle emergency deceleration is a tolerance less than commanded emergen-
cy deceleration. Each brake shoe will be fitted with a high-friction braking surface, while the
main support tires will be selected for low friction.
Each of two LIMs is driven by a variable-frequency, variable-voltage drive. Study of such
drives interacting with a LIM shows that at each speed there is a frequency that minimizes cur-
rent, and that this frequency increases linearly with speed. Since the electrical losses increase as
the square of the current, it is important to operate the LIMs close to the frequency at each speed
that minimizes current.
9. The Hardware for Control
Operation of the control system requires on-board and wayside sensors of position and speed, a
communication link between the vehicles and wayside zone controllers, a communication link
between the zone controllers and a central computer, and computers on each vehicle, at wayside
zones, and in a central location.
9
For on-board position and speed measurement we use digital encoders [9]. The position accu-
racy of these devices is currently well under one millimeter. Since time can be measured to a
few nanoseconds, speed accuracy by differentiation is well better than we need.
For continuous communication between vehicles to zone controllers we use a commercially
available leaky cable inside the guideway only a centimeter away from transmitters and re-
ceivers mounted on the vehicle. The antenna required for these devices is only about 15 cm
in diameter. Such cables were not commercially available in the 1970s, which made the
communications problem then more difficult.
For communication between each wayside zone controller and a central computer we use fi-
ber optic cables.
For wayside position and speed measurement we use strategically spaced pairs of magnetic
markers inside the guideway.
Our computers on board vehicles, at wayside zones, and in a central location will be checked
dual duplex (see Section 10).
For independent backup emergency control that would be activated in the highly unlikely case
of a failure of the software of the primary emergency control system we will use either a sonar
or radar position sensing system.
All of these components are available as commodities or easily designed.
10. The 1984 Boeing Advanced Group Rapid Transit (AGRT) Program
Reference [10] and its 50 references document the extensive work of Boeing Aerospace Compa-
ny on the federally funded AGRT program. Notwithstanding the 25 years that have passed since
this work was completed, it is the most recent work related to automated transit funded by the
United States Government, it is the most well-documented work as a precursor to our work on
PRT control, it contains much useful information that can guide any new PRT control group, and
it was performed by a first-class group of control engineers. Moreover, it is available to the pub-
lic, and it was a valuable source of information for our Chicago RTA PRT Design Study [11],
which work is also available.
Safety Criterion. UMTA retained the Battelle Memorial Institute as its safety contractor on
the AGRT program. Battelle specified that AGRT had to be as safe as a modern rapid rail
system. When Boeing managers asked for a more specific definition, they were told to as-
sume that it was as if the vital relay that determines the safety of a modern rapid rail system
10
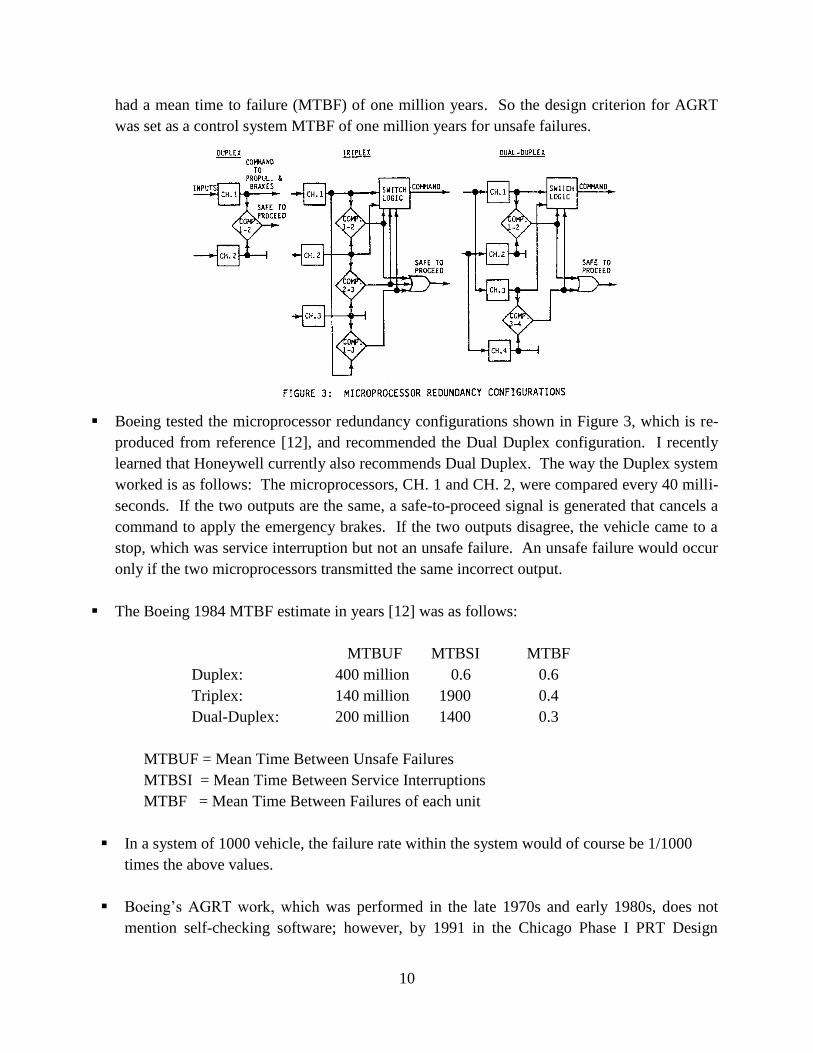
had a mean time to failure (MTBF) of one million years. So the design criterion for AGRT
was set as a control system MTBF of one million years for unsafe failures.
Boeing tested the microprocessor redundancy configurations shown in Figure 3, which is re-
produced from reference [12], and recommended the Dual Duplex configuration. I recently
learned that Honeywell currently also recommends Dual Duplex. The way the Duplex system
worked is as follows: The microprocessors, CH. 1 and CH. 2, were compared every 40 milli-
seconds. If the two outputs are the same, a safe-to-proceed signal is generated that cancels a
command to apply the emergency brakes. If the two outputs disagree, the vehicle came to a
stop, which was service interruption but not an unsafe failure. An unsafe failure would occur
only if the two microprocessors transmitted the same incorrect output.
The Boeing 1984 MTBF estimate in years [12] was as follows:
MTBUF MTBSI MTBF
Duplex: 400 million 0.6 0.6
Triplex: 140 million 1900 0.4
Dual-Duplex: 200 million 1400 0.3
MTBUF = Mean Time Between Unsafe Failures
MTBSI = Mean Time Between Service Interruptions
MTBF = Mean Time Between Failures of each unit
In a system of 1000 vehicle, the failure rate within the system would of course be 1/1000
times the above values.
Boeing’s AGRT work, which was performed in the late 1970s and early 1980s, does not
mention self-checking software; however, by 1991 in the Chicago Phase I PRT Design
11
Study [11] Raytheon engineers with whom I worked recommended self-checking software,
which has the added advantage that the microprocessor with a failure can be identified. This
extends the system MTBUF remarkably.
11. Requirements for High-Capacity PRT System Safety and Reliability[5]
Few moving parts in the vehicle.
No safety-critical moving parts in the motors.
Propulsion and braking independent of friction.
No moving track parts in the switch.
Redundant motors, sensors, and power supply.
Checked Dual Duplex computers.
Safety-critical, fault-tolerant hardware and software with built-in tests.
Dual independent emergency braking.
Exclusive guideway.
Result: The chance of injury is close to zero!
12. Examples of Safe Design
Each wayside zone controller (ZC) emits its speed signal every 100 millisecs.
With no speed signal the vehicles are programmed to stop.
Each ZC receives position and speed from each vehicle every 100 millisecs.
With no communication, the cognizant ZC stops the speed signal and reports upstream.
Independent wayside means for measuring position and speed of each vehicle.
All commands returned and verified before action is taken.
Thruster temperature sensors report possible over-heat conditions.
The emergency brake command is ON unless OFF is received every 100 millisecs.
When the switch is thrown, a command is given to stop unless canceled in 500 milliseconds
(the switch-throw time with tolerance) by a signal from a proximity sensor.
Sonar or radar back-up emergency control available in case of a software fault.
13. Do Reliability Requirements increase with System Size?
Define DEPENDABILITY = 1 – Person-Hours of delay/Person-Hours of operation. This is a
valuable quantity that cannot be measured routinely in conventional transit systems without great
expense and inconvenience, but it is the primary measure of system on-time performance [13].
Because a PRT system must know every trip destination, dependability can routinely be both
measured in an operating system and calculated in advance during the system development
process. These calculations were performed during our Phase I PRT Design Study [11] with a
12
resulting estimate of dependability of 99.967% [14]. An important conclusion from reference
[13] is that dependability is independent of system size.
My paper on optimum reliability allocation [15] comes to a similar conclusion: The component
reliability needed to minimize life cycle cost of the entire system while meeting a given depen-
dability requirement is independent of system size.
14. The Recommended Control Strategy
From system simulation work [7, 19] done during the above-mentioned Chicago project, I found
[6], as mentioned above, that the best strategy for operation of a PRT system of any size or con-
figuration is an asynchronous point follower. Just as in a highway system, the events in a PRT
network are determined by actions of individuals such as when and how much time they need to
ingress and egress from vehicles, which can be treated as a normal distribution with a certain
mean and a certain variance. There is no need for clock synchronization for any reason other
than to calculate commanded maneuvers in real time. The latter of course is a function not found
in a highway system, but one that permits precise control of the position and speed of each ve-
hicle at all times, whether the speed is changing or held constant. The speed and position of each
vehicle can now be measured more accurately than necessary by means of commercially availa-
ble digital encoders. With this information and with a high-gain control system the vehicles
closely follow commanded maneuvers.
In reference [16] I show that if one can assume the propulsion system can be represented at least
roughly as a first-order lag, the required control gains can be calculated in terms of well-
understood quantities – an assumed vehicle mass, a natural frequency, a damping ratio, and a
dimensionless parameter that lies between 0 and 1. The gains are as follows:
2 1
2 12
Assumed vehicle mass
Control system natural frequency, radians per sec
= Damping ratio
= A dimensional parameter between 0 and 1.
c n
c n
c
n
Position Gain m
Speed Gain m
m
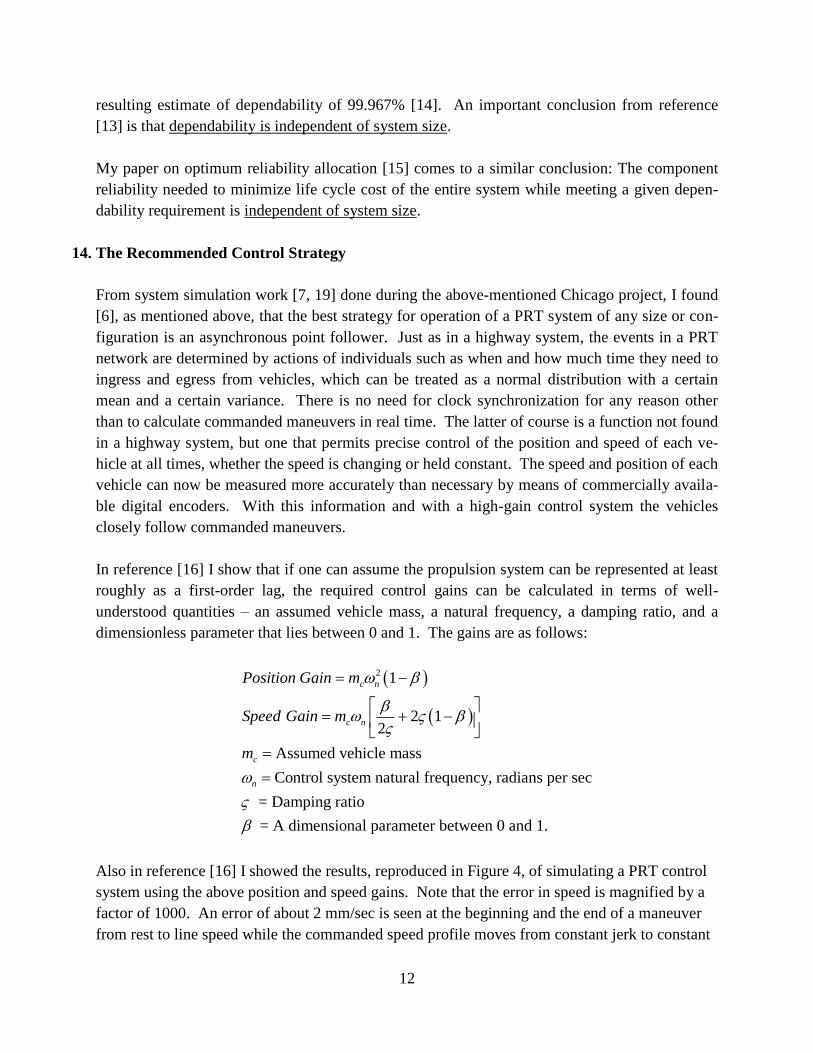
Also in reference [16] I showed the results, reproduced in Figure 4, of simulating a PRT control
system using the above position and speed gains. Note that the error in speed is magnified by a
factor of 1000. An error of about 2 mm/sec is seen at the beginning and the end of a maneuver
from rest to line speed while the commanded speed profile moves from constant jerk to constant
13
acceleration and back again. A large wind gust produces a deviation in actual speed from com-
manded speed barely more than one mm/sec.
Figure 4. Simulated Response to a Wind Gust.
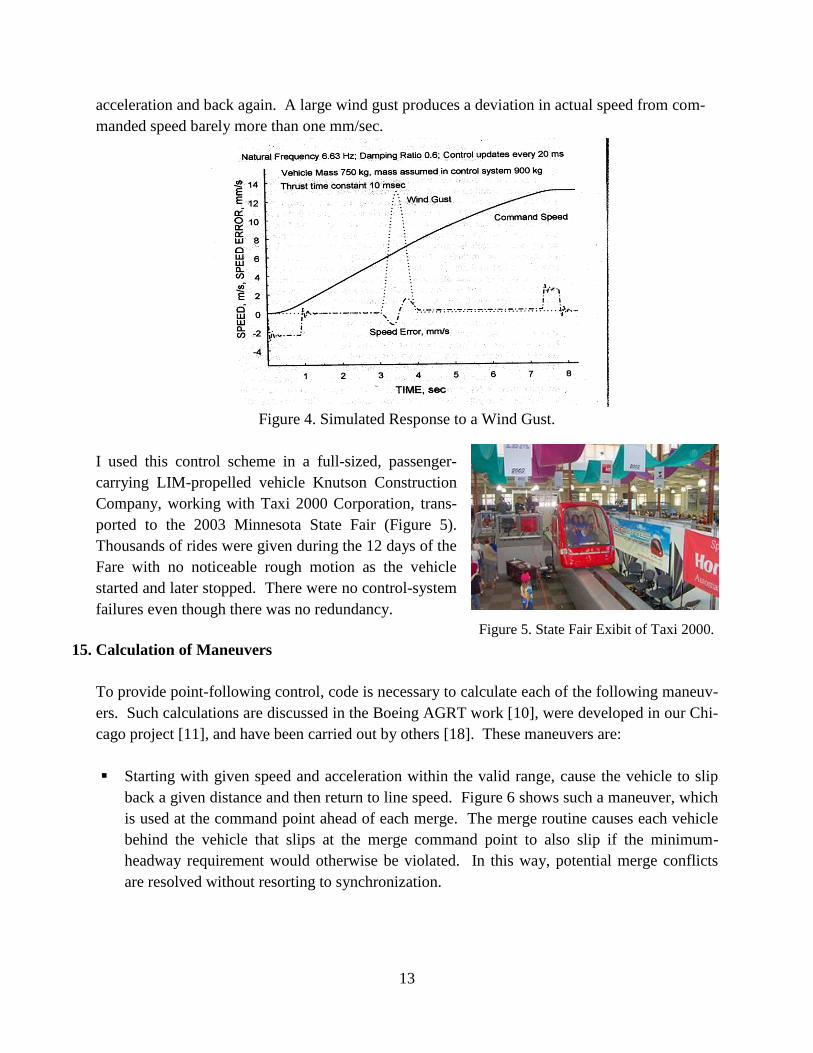
I used this control scheme in a full-sized, passenger-
carrying LIM-propelled vehicle Knutson Construction
Company, working with Taxi 2000 Corporation, trans-
ported to the 2003 Minnesota State Fair (Figure 5).
Thousands of rides were given during the 12 days of the
Fare with no noticeable rough motion as the vehicle
started and later stopped. There were no control-system
failures even though there was no redundancy.
Figure 5. State Fair Exibit of Taxi 2000.
15. Calculation of Maneuvers
To provide point-following control, code is necessary to calculate each of the following maneuv-
ers. Such calculations are discussed in the Boeing AGRT work [10], were developed in our Chi-
cago project [11], and have been carried out by others [18]. These maneuvers are:
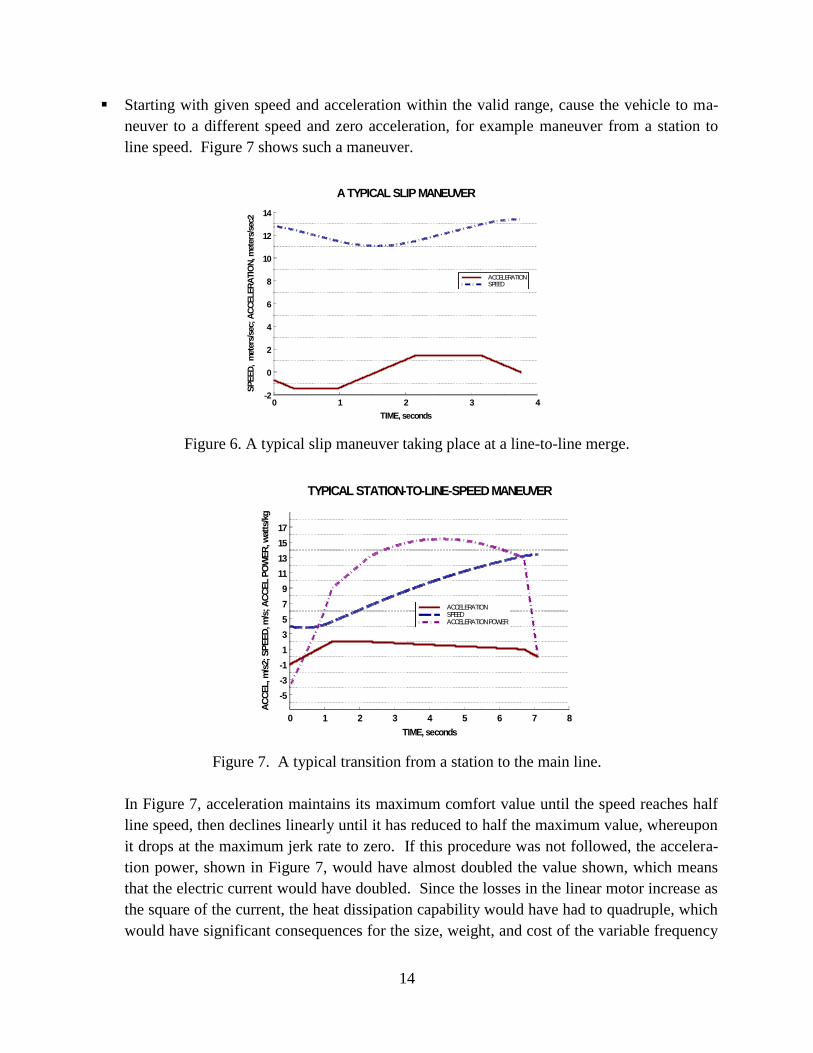
Starting with given speed and acceleration within the valid range, cause the vehicle to slip
back a given distance and then return to line speed. Figure 6 shows such a maneuver, which
is used at the command point ahead of each merge. The merge routine causes each vehicle
behind the vehicle that slips at the merge command point to also slip if the minimum-
headway requirement would otherwise be violated. In this way, potential merge conflicts
are resolved without resorting to synchronization.
14
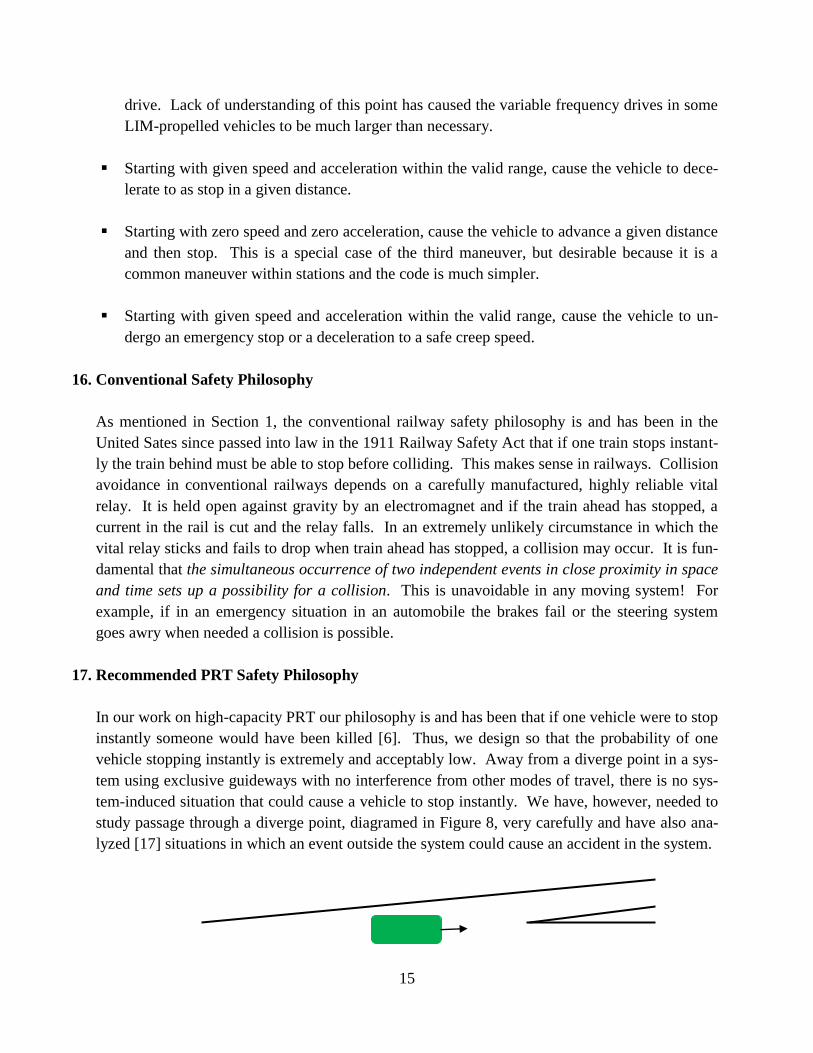
Starting with given speed and acceleration within the valid range, cause the vehicle to ma-
neuver to a different speed and zero acceleration, for example maneuver from a station to
line speed. Figure 7 shows such a maneuver.
Figure 6. A typical slip maneuver taking place at a line-to-line merge.
Figure 7. A typical transition from a station to the main line.
In Figure 7, acceleration maintains its maximum comfort value until the speed reaches half
line speed, then declines linearly until it has reduced to half the maximum value, whereupon
it drops at the maximum jerk rate to zero. If this procedure was not followed, the accelera-
tion power, shown in Figure 7, would have almost doubled the value shown, which means
that the electric current would have doubled. Since the losses in the linear motor increase as
the square of the current, the heat dissipation capability would have had to quadruple, which
would have significant consequences for the size, weight, and cost of the variable frequency
0 1 2 3 4
TIME, seconds
-2
0
2
4
6
8
10
12
14
SP
EE
D,
met
ers/
sec;
AC
CE
LE
RA
TIO
N, m
eter
s/se
c2
ACCELERATIONSPEED
A TYPICAL SLIP MANEUVER
0 1 2 3 4 5 6 7 8
TIME, seconds
-5
-3
-1
1
3
5
7
9
11
13
15
17
AC
CE
L, m
/s2;
SP
EE
D, m
/s; A
CC
EL P
OW
ER
, wat
ts/k
g
TYPICAL STATION-TO-LINE-SPEED MANEUVER
ACCELERATIONSPEEDACCELERATION POWER
15
drive. Lack of understanding of this point has caused the variable frequency drives in some
LIM-propelled vehicles to be much larger than necessary.
Starting with given speed and acceleration within the valid range, cause the vehicle to dece-
lerate to as stop in a given distance.
Starting with zero speed and zero acceleration, cause the vehicle to advance a given distance
and then stop. This is a special case of the third maneuver, but desirable because it is a
common maneuver within stations and the code is much simpler.
Starting with given speed and acceleration within the valid range, cause the vehicle to un-
dergo an emergency stop or a deceleration to a safe creep speed.
16. Conventional Safety Philosophy
As mentioned in Section 1, the conventional railway safety philosophy is and has been in the
United Sates since passed into law in the 1911 Railway Safety Act that if one train stops instant-
ly the train behind must be able to stop before colliding. This makes sense in railways. Collision
avoidance in conventional railways depends on a carefully manufactured, highly reliable vital
relay. It is held open against gravity by an electromagnet and if the train ahead has stopped, a
current in the rail is cut and the relay falls. In an extremely unlikely circumstance in which the
vital relay sticks and fails to drop when train ahead has stopped, a collision may occur. It is fun-
damental that the simultaneous occurrence of two independent events in close proximity in space
and time sets up a possibility for a collision. This is unavoidable in any moving system! For
example, if in an emergency situation in an automobile the brakes fail or the steering system
goes awry when needed a collision is possible.
17. Recommended PRT Safety Philosophy
In our work on high-capacity PRT our philosophy is and has been that if one vehicle were to stop
instantly someone would have been killed [6]. Thus, we design so that the probability of one
vehicle stopping instantly is extremely and acceptably low. Away from a diverge point in a sys-
tem using exclusive guideways with no interference from other modes of travel, there is no sys-
tem-induced situation that could cause a vehicle to stop instantly. We have, however, needed to
study passage through a diverge point, diagramed in Figure 8, very carefully and have also ana-
lyzed [17] situations in which an event outside the system could cause an accident in the system.
16
Figure 8. A vehicle approaching a diverge point.
18. Design of the Guideway Diverge
The problem of safety as a vehicle passes through a diverge point is considered in detail in refer-
ence [17], assuming a specific means of switching. There it is shown how to design the switch-
ing procedure in such a way that to set up the conditions for possible impact with the diverge
junction would require the simultaneous occurrence of two independent highly unlikely failures
in close proximity in space and time plus an “Act of God” such as a lightning stroke that could, if
it occurred at precisely the right time and was of a specific shape, cause the switch to throw even
though measures are taken to shield the switch torquer from a voltage spike.
In general the requirements for safe passage through diverge sections of the guideway are the
following:
The vehicle must be constrained to one side of guideway so that under normal circumstances
it cannot be forced away from that side as a result of a combination of the maximum cross-
wind that would be permitted under operational conditions (the Chicago RTA specified the
maximum cross wind to be 70 mph [112 km/hr]) plus the maximum unbalanced passenger
load.
In the distance ahead of the diverge point through which the vehicle moves at line speed
during the switch-throw time, the design must prevent an unauthorized throw of the switch
as a result of, for example, a lightning stroke.
The front of both vehicle and the wayside diverge junction must by design be as narrow as
practical to minimize the probability of impaling the vehicle on the diverge junction in the
remote possibility that the vehicle became unconstrained.
19. Design Requirements for Minimum Safe Headway
With some repetition from Section 11, the design requirements to achieve the minimum practical
safe headway are as follows:
All controllers on board and at wayside are checked dual duplex.
The switch is bi-stable, in-vehicle, and conservatively designed.
The switch torquer is shielded from stray voltage spikes.
There is either instantaneous back-up to primary power or there is no mode in which prima-
ry power can fail suddenly.
17
If power is supplied from wayside, the power-pickup shoes must be designed so that there is
no reasonable way they can fall off or in any emergency situation rotate and short out the
power rails.
Propulsion and primary braking must be frictionless.
The emergency braking system must be completely independent of primary braking.
Independent sonar or radar back up must be provided for collision warning in case of a
software error in the primary control system, even when it has been thoroughly checked.
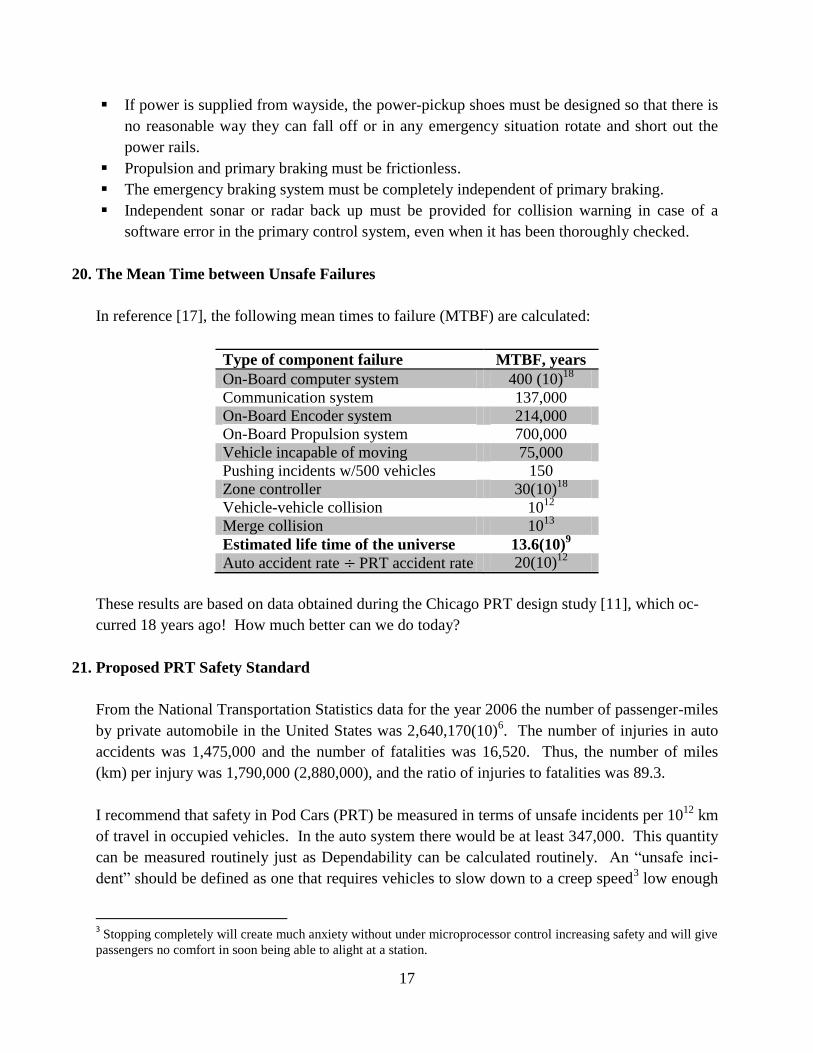
20. The Mean Time between Unsafe Failures
In reference [17], the following mean times to failure (MTBF) are calculated:
Type of component failure MTBF, years
On-Board computer system 400 (10)18
Communication system 137,000
On-Board Encoder system 214,000
On-Board Propulsion system 700,000
Vehicle incapable of moving 75,000
Pushing incidents w/500 vehicles 150
Zone controller 30(10)18
Vehicle-vehicle collision 1012
Merge collision 1013
Estimated life time of the universe 13.6(10)9
Auto accident rate ÷ PRT accident rate 20(10)12
These results are based on data obtained during the Chicago PRT design study [11], which oc-
curred 18 years ago! How much better can we do today?
21. Proposed PRT Safety Standard
From the National Transportation Statistics data for the year 2006 the number of passenger-miles
by private automobile in the United States was 2,640,170(10)6. The number of injuries in auto
accidents was 1,475,000 and the number of fatalities was 16,520. Thus, the number of miles
(km) per injury was 1,790,000 (2,880,000), and the ratio of injuries to fatalities was 89.3.
I recommend that safety in Pod Cars (PRT) be measured in terms of unsafe incidents per 1012
km
of travel in occupied vehicles. In the auto system there would be at least 347,000. This quantity
can be measured routinely just as Dependability can be calculated routinely. An “unsafe inci-
dent” should be defined as one that requires vehicles to slow down to a creep speed3 low enough
3 Stopping completely will create much anxiety without under microprocessor control increasing safety and will give
passengers no comfort in soon being able to alight at a station.
18
so that a collision with the vehicle ahead would not cause a deceleration of more than 0.5 g.
Such incidents would be required to be reported to authorities. Considering the auto injury rate, I
recommend that an unsafe Pod Car (PRT) system be defined as one in which the distance tra-
velled for one unsafe incident be less than 1012
km. This is such a large number that for many
years it will have to be estimated through exhaustive investigation of all failure modes.
22. Early Applications
Early applications will by necessity have to be small, in which case headways between 2 and
3 seconds are sufficient. These headways do not violate the 1911 Railway Safety Act.
The system should be designed with shorter headways in mind.
The system must be tested at shorter headways without passengers until safety is assured.
It will be necessary to inspect independently and rigorously all aspects of the control system.
23. Conclusions
The state of the art of computers and other critical components needed in a high-capacity PRT
system is today such that we can design and build PRT systems suitable to be expanded to serve
entire metropolitan areas, thus making fully practical the essential pioneering work of The Aero-
space Corporation led by its genius Vice President Dr. Jack H. Irving [18]. An unsafe Pod Car
(PRT) system should be defined as one in which there is more than one unsafe incident in 1012
km of travel in occupied vehicles. Finally, we observe that High-Capacity PRT has much more
in common with an automated highway than with a railroad.
24. References
[1] J. E. Anderson 2005. “The Future of High-Capacity Personal Rapid Transit,” www.prtnz.com.
[2] Department of Transportation and Related Agencies Appropriations for 1974. Hearings held on March
27, 1973 before a Sub-committee of the Committee on Appropriations, House of Representatives, Ninety-
Third Congress, John J. McFall, Chairman, Part I, Urban Mass Transportation Administration, page 876.
See page 11 for a reproduction of page 876.
[3] J. E. Anderson, 2009. “Evolution of Personal Rapid Transit,” www.prtnz.com.
[4] W. F. Hamilton and D. K. Nance. 1969. “Systems Analysis of Urban Transportation.” Scientific
American, July 1969.
[5] J. E. Anderson, 1988, “Safe Design of Personal Rapid Transit Systems," Journal of Advanced Trans-
portation (JAT), 28:1:1-15. www.prtnz.com.4
4 Posted with permission.
19
[6] J. E. Anderson, 1998. "Control of Personal Rapid Transit Systems," JAT, 32:57-74. www.prtnz.com.
[7] J. E. Anderson, 1998. “Simulation of the Operation of Personal Rapid Transit Systems.” Computers in
Railways VI, WIT Press, Boston, Southampton, 523-532. www.prtnz.com.
[8] California Partners for Advanced Transit and Highways.
http://repositories.cdlib.org/its/path/reports/UCB-ITS-PRR-97-26/
[9] R. P. Lang and D. J. Warren. 1984. “Microprocessor Based Speed and Position Measurement Sys-
tem,” Automated Transportation Systems, Boeing Aerospace Company, an IEEE Paper.
[10] D. D. Lyttle, D. B. Freitag, and D. H. Christenson , 1986. “Advanced Group Rapid Transit Phase IIB
Executive Summary & Final Report,” UMTA-WA-06-0011-86-1. Available to the public through the Na-
tional Technical Information Service, Springfield, Virginia 22161. 205pp.
[11] Personal Rapid Transit. 1992. Phase I Baseline Documentation, Volume I & II, System Design Re-
port, System Element Design Report.
[12] R. C. Milnor & R. S. Washington, 1984. “Effects of System Architecture on Safety and Reliability
of Multiple Microprocessor Control Systems,” IEEE Conference Paper.
[13] J. E. Anderson. 1992. "Dependability as a Measure of On-Time Performance of Personal Rapid
Transit Systems," JAT, 26:3(1992):101-212. www.prtnz.com.
[14] 1991. Fault Tree Analysis/Reliability, Availability, Maintainability Report. Personal Rapid Transit
Program, Stone & Webster Engineering Corporation, Prepared for Regional Transportation Authority,
Chicago, Illinois, Table 5-1, page 5-3.
[15] J. E. Anderson. 1977. "Life-Cycle Costs and Reliability Allocation in Automated Transit,"
High Speed Ground Transportation, 11:1:1-18. www.prtnz.com.
[16] J. E. Anderson. 1997. "Longitudinal Control of a Vehicle," JAT, 31:3:237-247. www.prtnz.com.
[17] J. E. Anderson. 2000. “Failure Modes and Effects Analysis and Minimum Headway in PRT,”
www.skyloop.org, www.prtnz.com.
[18] Jack H. Irving, Harry Bernstein, C. L. Olson, and Jon Buyan, 1978. Fundamentals of Personal Rapid
Transit, Lexington Books, D. C. Heath and Company.
[19] J. E. Anderson, 2000. “A Review of the State of the Art of Personal Rapid Transit.” JAT, 34:1:3-29.
www.prtnz.com.

20
We call our system an “Intelligent Transportation-Network System” (ITNS)The Generic Name “Personal Rapid Transit” (PRT)
“Make big plans; aim high in hope and work, remembering that a noble, logical diagram once recorded will never die, but long after we are gone will be a living thing, asserting itself with ever growing insistency.”
Daniel H. BurnhamChicago Planner
Hats off to Sweden for its big plan for Pod Cars!
www.prtinternational.com
21
Appendix. The Linear Induction Motor
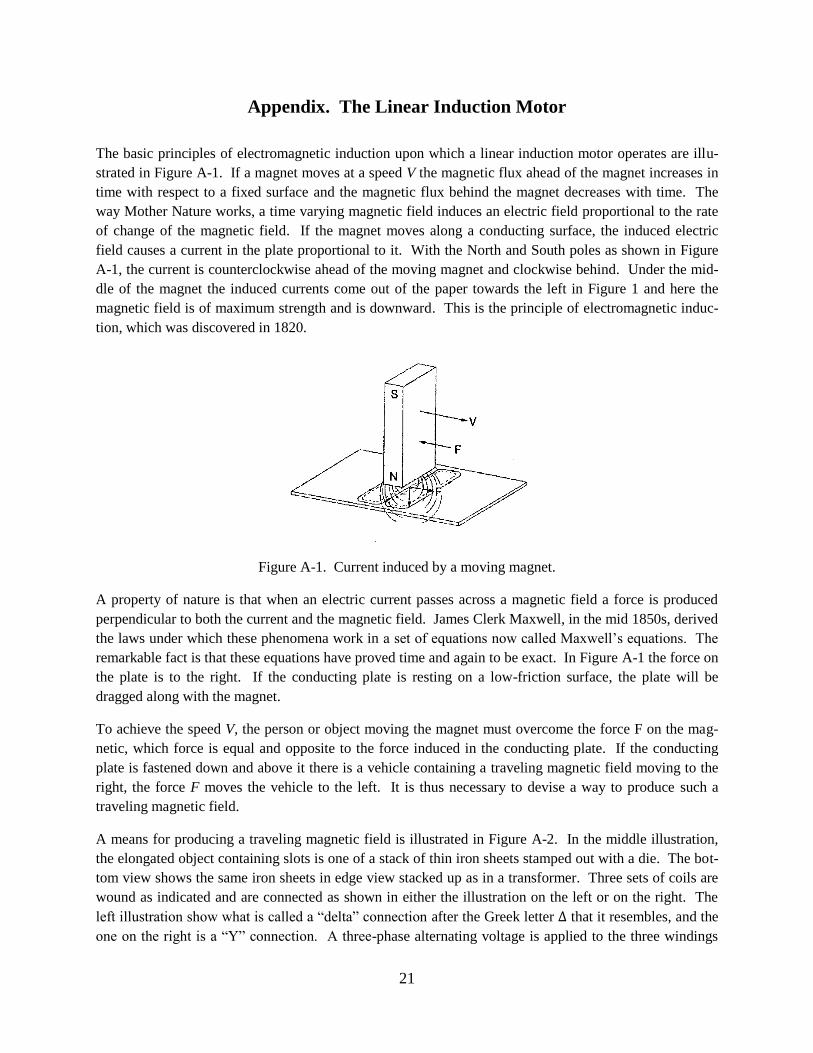
The basic principles of electromagnetic induction upon which a linear induction motor operates are illu-
strated in Figure A-1. If a magnet moves at a speed V the magnetic flux ahead of the magnet increases in
time with respect to a fixed surface and the magnetic flux behind the magnet decreases with time. The
way Mother Nature works, a time varying magnetic field induces an electric field proportional to the rate
of change of the magnetic field. If the magnet moves along a conducting surface, the induced electric
field causes a current in the plate proportional to it. With the North and South poles as shown in Figure
A-1, the current is counterclockwise ahead of the moving magnet and clockwise behind. Under the mid-
dle of the magnet the induced currents come out of the paper towards the left in Figure 1 and here the
magnetic field is of maximum strength and is downward. This is the principle of electromagnetic induc-
tion, which was discovered in 1820.
Figure A-1. Current induced by a moving magnet.
A property of nature is that when an electric current passes across a magnetic field a force is produced
perpendicular to both the current and the magnetic field. James Clerk Maxwell, in the mid 1850s, derived
the laws under which these phenomena work in a set of equations now called Maxwell’s equations. The
remarkable fact is that these equations have proved time and again to be exact. In Figure A-1 the force on
the plate is to the right. If the conducting plate is resting on a low-friction surface, the plate will be
dragged along with the magnet.
To achieve the speed V, the person or object moving the magnet must overcome the force F on the mag-
netic, which force is equal and opposite to the force induced in the conducting plate. If the conducting
plate is fastened down and above it there is a vehicle containing a traveling magnetic field moving to the
right, the force F moves the vehicle to the left. It is thus necessary to devise a way to produce such a
traveling magnetic field.
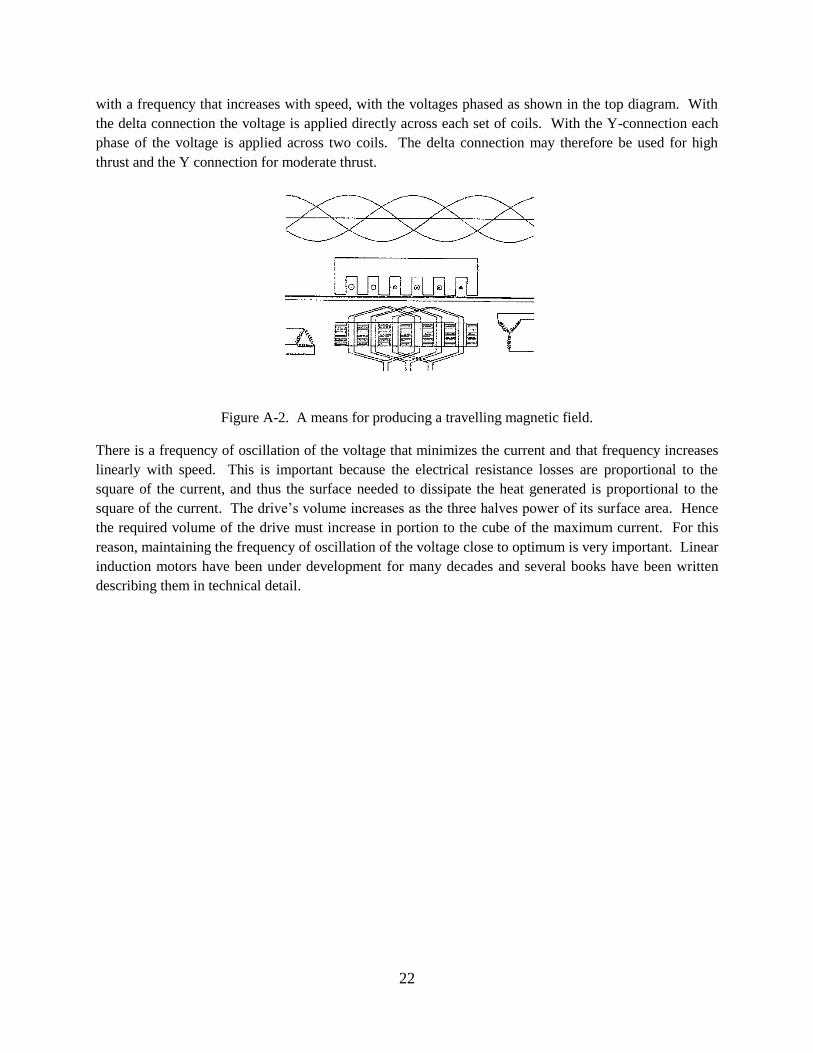
A means for producing a traveling magnetic field is illustrated in Figure A-2. In the middle illustration,
the elongated object containing slots is one of a stack of thin iron sheets stamped out with a die. The bot-
tom view shows the same iron sheets in edge view stacked up as in a transformer. Three sets of coils are
wound as indicated and are connected as shown in either the illustration on the left or on the right. The
left illustration show what is called a “delta” connection after the Greek letter ∆ that it resembles, and the
one on the right is a “Y” connection. A three-phase alternating voltage is applied to the three windings
22
with a frequency that increases with speed, with the voltages phased as shown in the top diagram. With
the delta connection the voltage is applied directly across each set of coils. With the Y-connection each
phase of the voltage is applied across two coils. The delta connection may therefore be used for high
thrust and the Y connection for moderate thrust.
Figure A-2. A means for producing a travelling magnetic field.
There is a frequency of oscillation of the voltage that minimizes the current and that frequency increases
linearly with speed. This is important because the electrical resistance losses are proportional to the
square of the current, and thus the surface needed to dissipate the heat generated is proportional to the
square of the current. The drive’s volume increases as the three halves power of its surface area. Hence
the required volume of the drive must increase in portion to the cube of the maximum current. For this
reason, maintaining the frequency of oscillation of the voltage close to optimum is very important. Linear
induction motors have been under development for many decades and several books have been written
describing them in technical detail.