Embed Size (px)
Citation preview

OVERCOMING CHALLENGES IN FIRE DEBRIS ANALYSIS CAUSED BY
EVAPORATION
By
Rebecca Brehe
A THESIS
Submitted to
Michigan State University
in partial fulfillment of the requirements
for the degree of
Forensic Science—Master of Science
2015

ABSTRACT
OVERCOMING CHALLENGES IN FIRE DEBRIS ANALYSIS CAUSED BY
EVAPORATION
By
Rebecca Brehe
The comparison of chromatograms from fire debris and known ignitable liquid reference
collections is complicated by the evaporation of the ignitable liquids during a fire, which causes
chemical changes in the evaporated liquids. Although forensic laboratories include evaporated
standards in their reference collections of ignitable liquids and there has been an increasing
interest in the study of evaporation, there is currently no standardized method for evaporating
ignitable liquids. This research investigated different factors that affect evaporation and the
application of a mathematical model to fire debris analysis.
Gasoline was evaporated under different agitation conditions and in vessels with different
surface areas to determine the effect of these parameters on the evaporation process. Fraction
remaining plots were generated for several characteristic compounds in gasoline with a range of
volatility to assess the reproducibility associated with the different factors. Ultimately, agitation
was determined to generate the most reproducible data.
A previously developed mathematical model was used with three petroleum distillates and
gasoline to generate theoretical chromatograms of the evaporated liquids. Pearson product-
moment correlation (PPMC) coefficients were used to assess the correlation between the
theoretical and experimental chromatograms. Strong correlation was observed for all three
petroleum distillates, while the model showed potential for predicting the evaporation of gasoline
as well.

iii
ACKNOWLEDGEMENTS
I would like to thank Dr. Ruth Smith for all of her guidance and support throughout these last
two years at Michigan State and for helping me to become a better scientist and researcher. I
would also like to thank Dr. Victoria McGuffin for her insight into my research and for taking
the time to share her expertise with me during my time at Michigan State. Thank you to Dr. Tom
Holt for serving as one of my committee members and for being so patient with all of the
changes that have occurred over the past few months.
Thank you to Dr. Kathryn Severin for assisting with instrumentation throughout my research.
I would like to thank everyone in the Forensic Science program for their support and
encouragement. I would especially like to thank Becca Ray, Tim Antinick, and Kristen Reese for
being such wonderful friends and for making this experience so much more entertaining and
memorable.
Finally, I would like to thank my parents, grandparents, and siblings for their support
throughout this time in my life. I could not have made it through this experience without the love
and support I received from all of you! I would especially like to thank my mother for always
believing in me and encouraging me to follow my dreams!!

iv
TABLE OF CONTENTS
LIST OF TABLES………………………………………………………………………………vi
LIST OF FIGURES…………………………………………………………………………….vii
Chapter 1: Introduction…………………………………………………………………………1
1.1 Arson………………………………………...……………………………………………1
1.2 Fire Debris Analysis……………………………………………………………………..1
1.3 Evaporation of Ignitable Liquids……………………………………………………….6
1.4 Development of the Mathematical Model……………………………………………...9
1.5 Research Objectives…………………………………………………………………….13
REFERENCES………………………………………………………………………………….17
Chapter 2: Instrument and Data Analysis Theory…………………………………………...20
2.1 Instrumentation: Gas Chromatography (GC), Mass Spectrometry (MS), and Flame
Ionization Detector (FID)………………………………………………………………20
2.1.1 Gas Chromatography (GC)………………………………………………………….20
2.1.2 Mass Spectrometry (MS)…………………………………………………………………….24
2.1.3 Flame Ionization Detector (FID)…………………………………………………….28
2.2 Correlation Optimized Warping (COW) Alignment…………………………………28
2.3 Retention Index…………………………………………………………………………30
2.4 Pearson Product-Moment Correlation (PPMC) Coefficients………………………..32
REFERENCES………………………………………………………………………………….34
Chapter 3: Factors Influencing the Evaporation of Gasoline………………………………..36
3.1 Introduction……………………………………………………………………………..36
3.2 Materials and Methods…………………………………………………………………36
3.2.1 Collection and Preparation of Gasoline Samples…………………………………...36
3.2.2 Evaporation of Gasoline Samples……………………………………………………37
3.2.3 GC-MS Analysis……………………………………………………………………...38
3.2.4 Data Analysis………………………………………………………………………...39
3.3 Results and Discussion………………………………………………………………….40
3.3.1 Effect of Evaporation on the Chemical Composition of Gasoline…………………...40
3.3.2 Effect of Agitation Rate on Evaporation of Gasoline………………………………..47
3.3.3 Effect of Stir Bar Shape on Evaporation of Gasoline………………………………..54
3.3.4 Effect of the Exposed Surface Area on Evaporation of Gasoline……………………58
REFERENCES………………………………………………………………………………….65
Chapter 4: Mathematical Modeling of Evaporated Ignitable Liquid Standards…………..67
4.1 Introduction……………………………………………………………………………..67
4.2 Materials and Methods…………………………………………………………………67
4.2.1 Sample Collection, Evaporation, and Preparation…………………………………..67
4.2.2 GC-MS Analysis……………………………………………………………………...68

v
4.2.3 Data Analysis………………………………………………………………………...69
4.2.3.1 Correlation Optimized Warping (COW) Alignment………..…………….....69
4.2.3.2 Removal of the Internal Standard, Octadecane (C18)……..……………….…70
4.2.4 Modifications of the Theoretical Model…………………………………...…………72
4.2.4.1 Determination of Experimental Fraction Remaining…………….…………..72
4.3 Results and Discussion………………………………………………………………….75
4.3.1 Petroleum Distillates………………………………………………………………...75
4.3.1.1 Chemical Composition and Evaporation of Kerosene……………………….75
4.3.1.2 Application of Mathematical Model for Predicting the Fraction
Remaining……………………………………………………………..……..81
4.3.2 Gasoline……………………………………………………………………………...86
4.3.2.1 Chemical Composition and Evaporation of Gasoline………………………..86
4.3.2.2 Application of Mathematical Model for Predicting Fraction Remaining...….92
APPENDICES……………………………...………………………………………………..101
Appendix A: Unevaporated and Evaporated Torch Fuel……………………………….102
Appendix B: Unevaporated and Evaporated Lamp Oil………………………………...107
REFERENCES………………………………………………………………………………...112
Chapter 5: Conclusions and Future Work…………………………………………………..114
5.1 Conclusions…………………………………………………………………………….114
5.2 Future Work…………………………………………………………………………...116

vi
LIST OF TABLES
Table 1-1. ASTM Classification…………………………………………………………...……2
Table 4-1. Mean PPMC coefficients for petroleum distillates……………………………….82
Table 4-2. Mean PPMC coefficients for gasoline……………………..………………………93
Table 4-3. Change in fraction remaining and PPMC coefficient for gasoline……..……….98

vii
LIST OF FIGURES
Figure 1-1. General diagram of evaporation: the lower phase is liquid, the upper phase is
gas, the star represents a volatile molecule moving from the liquid phase to the gas phase,
and the equation representing the shift from liquid to gas…………………………….……...4
Figure 1-2. Chromatogram of (A) unevaporated and (B) 90% evaporated gasoline. The axis
of chromatogram B is expanded to show the characteristic compounds of gasoline.………..5
Figure 1-3. Decay curve for decane (C10), dodecane (C12), and tetradecane (C14) in diesel
evaporated at 20 °C…………………………………………………………………………11
Figure 1-4. Rate constants (k) as a function of retention index (I) for compounds in diesel:
n-alkanes (squares), branched alkanes (circles), alkyl benzenes (diamonds), and
polycyclic hydrocarbons (triangles)……………………………………………………….12
Figure 1-5. (A) Experimental unevaporated diesel chromatogram and (B) Fraction
remaining (F) curve calculated according to equation 1-3 and 1-4……………………...14
Figure 1-6. Overlaid experimental and theoretical chromatograms for diesel evaporated for
100 hours at 20 °C.……………….…………………………………………………………15
Figure 2-1. General diagram for a gas chromatograph-mass spectrometer………………..21
Figure 2-2. Chromatogram generated from gas chromatographic analysis………………..23
Figure 2-3. General diagram of ionization chamber…………………………………………24
Figure 2-4. General diagram of single quadrupole MS detector showing the pathway of a
stable ion through the mass analyzer to the detector…………………………………….25
Figure 2-5. General diagram of electron multiplier………………………………………….26
Figure 2-6. Mass spectrum generated by mass spectrometer……………...………………...27
Figure 2-7. General diagram of flame ionization detector (FID)……………………………29
Figure 2.8. Plot of retention index versus boiling point showing linear relationship………31
Figure 2.9. Chromatogram of unevaporated diesel with retention time on the x-axis.…….31
Figure 2.11. Chromatogram of unevaporated diesel with retention index on the x-axis…..32

viii
Figure 3-1. Images of the spinfin®, the spinvane®, and the micro stir bars, respectively...38
Figure 3-2. Chromatogram of unevaporated gasoline………………………………………..41
Figure 3-3. Chromatogram of gasoline evaporated to 25% by volume (A) with no dilution
adjustment and (B) with dilution adjustment………………………….……………………..43
Figure 3-4. Chromatogram of gasoline evaporated to 50% by volume……………………..44
Figure 3-5. Chromatogram of gasoline evaporated to 75% by volume……………………..45
Figure 3-6. (A) Chromatogram of gasoline evaporated to 90% by volume and (B) Zoomed
in chromatogram of gasoline evaporated to 90% by volume……………………………46
Figure 3-7. Fraction remaining plots for toluene using agitation rates of (A) 109 ± 2 rpm,
(B) 134 ± 2 rpm, and (C) 199 ± 2 rpm……………………………………………………..48
Figure 3-8. Fraction remaining plot for toluene using all three agitation rates and no
agitation……………………………………………………………………………………..50
Figure 3-9. Fraction remaining plot for p-xylene (a C2-alkylbenzene) using all three
agitation rates and no agitation……………………………………………………………51
Figure 3-10. Fraction remaining plot for 1,2,3-trimethylbenzene (a C3-alkylbenzene) using
all three agitation rates and no agitation………………………………………………….52
Figure 3-11. Fraction remaining plot for 1,2,4,5-tetramethylbenzene (a C4-alkylbenzene)
using all three agitation rates and no agitation…………………………………………...53
Figure 3-12. Fraction remaining plot for toluene using three different stir bars…………..55
Figure 3-13. Fraction remaining plot for p-xylene (a C2-alkylbenzene) using three different
stir bars…………………………………………………………………….………………..56
Figure 3-14. Fraction remaining plot for 1,2,3-trimethylbenzene (a C3-alkylbenzene) using
three different stir bars…………………………………………………………………….57
Figure 3-15. Fraction remaining plot for 1,2,4,5-tetramethylbenzene (a C4-alkylbenzene)
using three different stir bars……………………………………………………………...58
Figure 3-16. Illustration of dimensions of graduated cylinder versus a Petri dish, each
containing 10 mL of gasoline………………………………………………………………60
Figure 3-17. Fraction remaining plot for toluene in a graduated cylinder with and without
agitation and in a Petri dish without agitation………………………………..…………..61
ix
Figure 3-18. Fraction remaining plot for p-xylene (a C2-alkylbenzene) in a graduated
cylinder with and without agitation and in a Petri dish without agitation……..……….62
Figure 3-19. Fraction remaining plot for 1,2,3-trimethylbenzene (a C3-alkylbenzene) in a
graduated cylinder with and without agitation and in a Petri dish without
agitation……………………………………………………………………………………..63
Figure 3-20. Fraction remaining plot for 1,2,4,5-tetramethylbenzene (a C4-alkylbenzene) in
a graduated cylinder with and without agitation and in a Petri dish without
agitation……………………………………………………………………………………..63
Figure 4-1. (A) Peak misalignment between unevaporated and evaporated chromatograms
of kerosene and (B) Peak alignment between same two chromatograms following an
initial COW alignment with a warp of 20 data points and a segment size of 75 data
points and a second alignment with a warp of 5 data points and a segment size of 50
data points……………………………………………………………..……………………70
Figure 4-2. (A) Chromatogram of unevaporated kerosene and (B) Fraction remaining
curves for kerosene at 26%, 52%, 78%, and 94% evaporated………………………….76
Figure 4-3. Overlay of experimental and theoretical chromatograms of kerosene
evaporated 26% by volume………………………………………………………………...78
Figure 4-4. Overlay of experimental and theoretical chromatograms of kerosene
evaporated 52% by volume………………………………………………………………...79
Figure 4-5. Overlay of experimental and theoretical chromatograms of kerosene
evaporated 78% by volume………………………………………………………………...80
Figure 4-6. Overlay of experimental and theoretical chromatograms of kerosene
evaporated 94% by volume………………………………………………………………...81
Figure 4-7. Overlaid theoretical and experimental chromatograms of Medallion lamp oil
94% evaporated by volume with the third replicate shown in purple and the theoretical
in red; left inset shows region of the third replicate with lowest abundance and right
inset shows region of the third replicate with highest abundance…………………..…...83
Figure 4-8. (A) Chromatogram of unevaporated gasoline and (B) Fraction remaining
curves for gasoline at 26%, 52%, 78%, and 94% evaporated…………………………...88
Figure 4-9. Chromatogram of gasoline evaporated to 26% by volume……………………..89
Figure 4-10. Chromatogram of gasoline evaporated to 52% by volume……………………90
Figure 4-11. Chromatogram of gasoline evaporated to 78% by volume……………………91

x
Figure 4-12. Chromatogram of gasoline evaporated to 94% by volume……………………92
Figure 4-13. (A) Chromatogram of unevaporated gasoline using MS detector and (B)
Chromatogram of unevaporated gasoline using FID detector. Note that the x-axis is
retention time rather than retention index for this comparison…………..……………..95
Figure 4-14. Chromatogram of cryogenically cooled gasoline sample…………..…………..96
Figure 4-15. Plot of fraction remaining for 94% gasoline versus PPMC coefficient..……...98
Figure 4-16. Overlay of chromatograms of experimental, initial theoretical (FR 0.108), and
optimal theoretical (FR 0.360) 94% evaporated gasoline……………..…………………99
Figure A-1. Chromatogram of unevaporated Tiki torch fuel………………………………102
Figure A-2. Chromatogram of Tiki torch fuel evaporated 26% by volume……………….103
Figure A-3. Chromatogram of Tiki torch fuel evaporated 52% by volume……………….104
Figure A-4. Chromatogram of Tiki torch fuel evaporated 78% by volume……………….105
Figure A-5. Chromatogram of Tiki torch fuel evaporated 94% by volume……………….106
Figure B-1. Chromatogram of unevaporated Medallion lamp oil…………………………107
Figure B-2. Chromatogram of Medallion lamp oil evaporated 26% by volume………….108
Figure B-3. Chromatogram of Medallion lamp oil evaporated 52% by volume………….109
Figure B-4. Chromatogram of Medallion lamp oil evaporated 78% by volume………….110
Figure B-5. Chromatogram of Medallion lamp oil evaporated 94% by volume…………111

1
Chapter 1: Introduction
1.1 Arson
Arson is the intentional setting of a fire, with the intent to cause damage and destruction.
According to the National Fire Incident Reporting System, approximately 1,835 intentional fires
were reported in Michigan during 20141. These fires resulted in six deaths, over 22 injuries, and
$16,213,642 in property damage1. Arson incidents typically involve the use of an accelerant,
which is any material that increases the spread and intensity of a fire. As ignitable liquids, such
as gasoline, are commonly used as accelerants, residue from these liquids can often be detected
on debris from the scene of an intentional fire. Fire debris analysts are responsible for
determining if an ignitable liquid is present in fire debris samples submitted to the forensic
laboratory.
1.2 Fire Debris Analysis
In the laboratory, ignitable liquids are typically extracted from fire debris samples through
passive-headspace extraction before being analyzed by gas chromatography-mass spectrometry
(GC-MS) with the primary goal of determining if an ignitable liquid is present in the debris. To
do this, the total ion chromatograms (TICs) of the submitted sample and suitable reference
standards are compared based on retention time. In addition, for every compound present in the
sample, a mass spectrum is obtained, which can be used to identify the compounds. Once the
identities of all major compounds in the submitted sample are known, the chemical class of the
liquid can be determined, following the classification system defined by the American Society
for Testing and Materials (ASTM) International2. The eight ASTM classes (Table 1-1) are based
on chemical composition of the liquid and include gasoline, petroleum distillates, isoparaffinics,
naphthenic paraffinics, aromatics, normal alkanes, oxygenated solvents, and miscellaneous.

2
Class Composition Light (C4 – C9) Medium (C8 – C13) Heavy (C8 – C20+)
Gasoline – all brands,
including gasohol
C3- and C4-alkylbenzenes with
aliphatic compounds Fresh gasoline is typically in the range of C4 – C12
Petroleum Distillates Homologous series of n-alkanes;
other compounds less abundant
Petroleum ether,
cigarette lighter fluids,
camping fuels
Charcoal starters,
paint thinners, dry
cleaning solvents
Kerosene, diesel, jet
fuels, charcoal
starters
Isoparaffinic products Branched chain (isoparaffinic); cyclic
and n-alkanes absent or insignificant
Aviation gas, specialty
solvents
Charcoal starters,
paint thinners,
copier toners
Commercial specialty
solvents
Aromatic products Aromatic compounds; aliphatic
compounds absent or insignificant
Paint and varnish
removers, automotive
parts cleaners, xylenes
Automotive parts
cleaners,
insecticides; fuel
additives
Insecticides,
industrial cleaning
solvents
Naphthenic paraffinic
products
Branched chain and cyclic alkanes; n-
alkanes absent or insignificant
Cyclohexane-based
solvents/products
Charcoal starters,
insecticides, lamp
oils
Insecticides, lamp
oils, industrial
solvents
n-Alkane products Only n-alkanes, usually less than 5 Solvents, pentane,
hexane, heptanes
Candle oils, copier
toners
Candle oils,
carbonless forms,
copier toners
Oxygenated solvents
Alcohols, esters, ketones; major
components include xylene and
toluene
Alcohol, ketones,
lacquer thinners
Lacquer thinners,
industrial solvents
Miscellaneous Liquids that cannot be classified
Single component
liquids, blended
products
Turpentine and
blended products
Specialty and blended
products
Table 1-1. ASTM Classification2

3
For example, petroleum distillates are dominated by normal (n) alkanes with other compounds
present at substantially lower abundance (Table 1-1). In contrast, a naphthenic paraffinic
contains mainly branched and cyclic alkanes with n-alkanes present at substantially lower
abundance (Table 1-1). Each class, with the exception of gasoline, can be further subcategorized
based on the range of n-alkanes present in the liquid. For example, a petroleum distillate
containing butane (C4) – nonane (C9) would be a light petroleum distillate, while one containing
n-alkanes ranging from octane (C8) – tridecane (C13) would be a medium petroleum distillate
(Table 1-1). Finally, a petroleum distillate containing octane (C8) – eicosane (C20) would be
considered a heavy petroleum distillate (Table 1-1). Some liquids may contain a range of normal
alkanes that spans two subclasses. For example, a petroleum distillate containing n-alkanes from
heptane (C7) – undecane (C11) would be classified as a light to medium petroleum distillate
(Table 1-1).
Using these procedures, any ignitable liquid present in the fire debris can be identified.
However, the interpretation of the fire debris evidence can be extremely difficult due to several
factors that can easily complicate the comparison of chromatograms and mass spectra and the
subsequent identification of ignitable liquids. Although pyrolysis and substrate interferences
affect the interpretation, the focus in this research will be on evaporation and the challenges this
can cause in the interpretation of ignitable liquids in fire debris.
During a fire, the temperature increases, causing the compounds within a liquid to change
from a liquid into a gas, through a process known as evaporation (Figure 1-1). Compounds with
a lower boiling point will evaporate first, as their boiling point will be reached before those
compounds with higher boiling points. Although the compounds can become gaseous regardless
of their position in the liquid, only those at the surface of the liquid can evaporate. As the more

4
volatile compounds, or those with low boiling points, completely evaporate from the liquid, the
less volatile compounds will begin to evaporate until only the most stable compounds remain.
Figure 1-1. General diagram of evaporation: the lower phase is liquid, the upper phase is gas, the
star represents a volatile molecule moving from the liquid phase to the gas phase, and the
equation representing the shift from liquid to gas
Ignitable liquids evaporate readily, making them ideal accelerants. However, evaporation
changes the chemical composition of the liquids, resulting in chromatograms of fire debris that
look completely different, depending on the concentration or volume of liquid present, from the
chromatograms of the reference standards (Figure 1-2). The more volatile compounds, which
have lower boiling points, will evaporate at a faster rate than compounds with higher boiling
points (Figure 1-2). As a result, depending on the ignitable liquid used in an arson, the majority
of the liquid may be completely evaporated by the time the fire is extinguished and the debris is
sent to the laboratory for analysis. For example, gasoline is commonly used as an accelerant due
to its accessibility and high volatility (Figure 1-2). Unevaporated gasoline, shown in Figure 1-
2A, contains toluene, C2-alkylbenzenes including ethylbenzene, p-xylene, and o-xylene,
Solution
Liquid Gas

5
Figure 1-2. Chromatogram of (A) unevaporated and (B) 90% evaporated gasoline. The axis of
chromatogram B is expanded to show the characteristic compounds of gasoline
0
3
2 4 6 8 10 12 14
No
rmali
zed
Ab
un
dan
ce
Retention Time (min)
Toluene
C2-alkyl benzenes
Methyl naphthalenes
C4-alkyl benzenes
C3-alkyl benzenes
0
0.1
2 4 6 8 10 12 14
No
rmali
zed
Ab
un
dan
ce
Retention Time (min)
Toluene
C2-alkyl benzenes
Methyl naphthalenes
C4-alkyl benzenes
C3-alkyl benzenes
A
B

6
C3-alkylbenzenes including propylbenzene and 1,2,4-trimethylbenzene, C4-alkylbenzenes
including 1,2,4,5-tetramethylbenzene and 1-methyl-4-(2-propenyl)benzene, and two
methylnaphthalenes (1-methylnaphthalene and 2-methylnaphthalene) in relatively high
abundance. The presence of these compounds is required to identify a liquid as gasoline,
according to ASTM guidelines2. Additionally, certain ratios of peak abundances for
alkylbenzenes (e.g. 1:3:1 ratio for the C2-alkylbenzenes) must be observed along with the
presence of the methylnaphthalenes in a 2:1 ratio3. However, in 90% evaporated gasoline (Figure
1-2B), toluene and all of the compounds eluting before the C2-alkylbenzenes are completely
evaporated, while the remaining compounds are substantially reduced in abundance compared to
the unevaporated liquid. As a result, at this high level of evaporation (90%), it can be extremely
difficult to identify the liquid as gasoline due to the effects of evaporation.
1.3 Evaporation of Ignitable Liquids
To address this issue of evaporation, forensic laboratories include evaporated and
unevaporated standards in their reference collection of ignitable liquids. The National Center of
Forensic Science (NCFS) maintains the national Ignitable Liquid Reference Collection (ILRC) in
compliance with the Scientific Working Group/Technical Working Group for Fire and
Explosions (SWG/TWGFEX). This reference collection contains over 500 liquids that represent
all eight ASTM classes4. Additionally, for each unevaporated standard in the database, there are
2 - 4 samples of the liquid that have been evaporated to different levels (e.g. 25, 50, 75, 90, or
95% evaporated by volume). The database includes the chromatogram for each unevaporated
and evaporated standard for comparison to the chromatogram of submitted samples. In addition
to the chromatogram, analysts can request samples of liquids for analysis in their own
laboratories for inclusion into their individual reference collections.
7
However, evaporation affects not only the evaporation of ignitable liquids in the fire debris
samples but also the evaporation of the ignitable liquid standards in the laboratory reference
collections. Regardless of the controlled environment used to generate the evaporated standards,
chemical changes will occur, altering the overall composition of the evaporated liquid.
Depending on the conditions used for evaporation, the accuracy and reproducibility of the
evaporation process could be affected. Although each forensic laboratory has its own protocol
for generating a reference collection of ignitable liquids, there is no standardized method used by
all forensic laboratories. In fact, although a few laboratories provide their standard operating
procedures (SOPs) for the analysis of fire debris evidence, there is no mention of how the
ignitable liquids in the reference collection are evaporated5, 6, 7
.
Many research groups have conducted experiments in the area of evaporation. Although the
majority of the research was conducted on oil samples for environmental applications, it is still
relevant to the discussion of the evaporation of ignitable liquids as many of the ignitable liquids
in the ASTM classes originate from crude oil. Throughout the literature on the study of
evaporation, many different methods are used to generate the evaporated liquids.
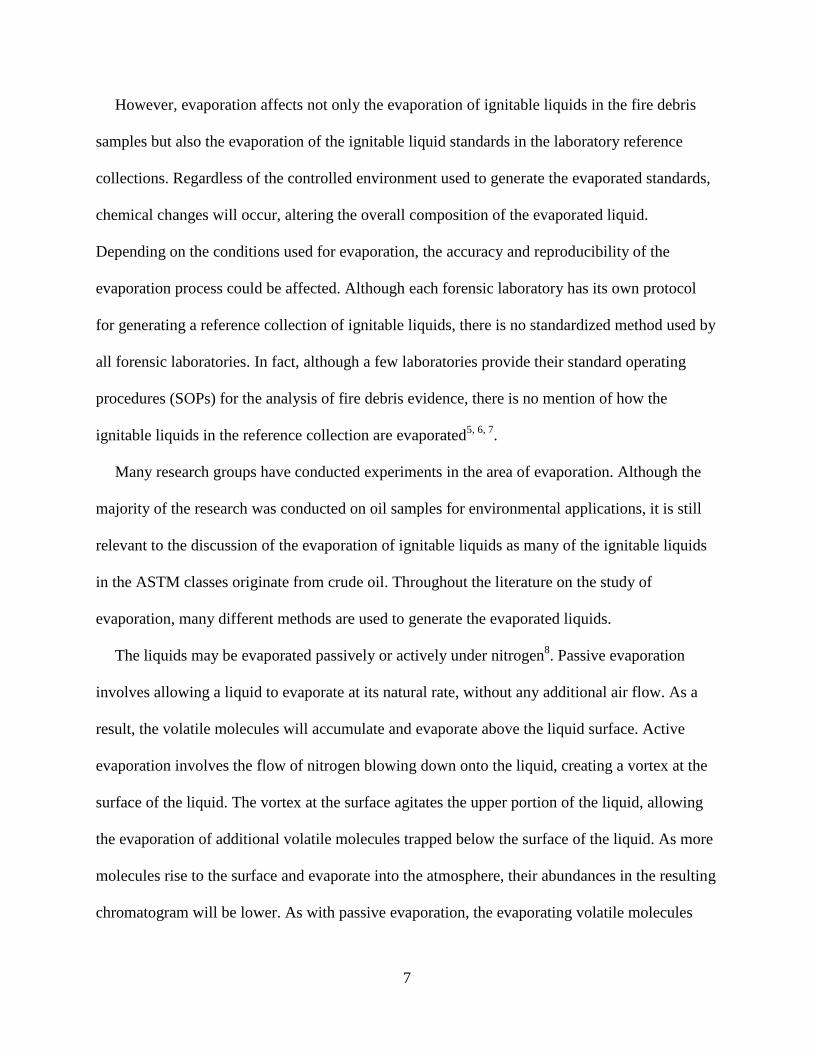
The liquids may be evaporated passively or actively under nitrogen8. Passive evaporation
involves allowing a liquid to evaporate at its natural rate, without any additional air flow. As a
result, the volatile molecules will accumulate and evaporate above the liquid surface. Active
evaporation involves the flow of nitrogen blowing down onto the liquid, creating a vortex at the
surface of the liquid. The vortex at the surface agitates the upper portion of the liquid, allowing
the evaporation of additional volatile molecules trapped below the surface of the liquid. As more
molecules rise to the surface and evaporate into the atmosphere, their abundances in the resulting
chromatogram will be lower. As with passive evaporation, the evaporating volatile molecules

8
will accumulate above the surface of the liquid. However, the flow of nitrogen removes the
accumulated volatile molecules, shifting the equilibrium reaction toward evaporation. Therefore,
active evaporation causes the volatile molecules to evaporate at their natural rate without the
limitations caused by diffusion. While the NCFS generates evaporated standards for the ILRC
using active evaporation3, only Kuk and Spagnola actively evaporated their samples under
nitrogen9. The other research groups, including Hetzel, Malmquist et al., and Zorzetti and
coworkers, used passive evaporation for their evaporated samples10, 11, 12
.
There is currently no standard vessel used for evaporation. For example, liquids may be
evaporated in a graduated cylinder, a beaker, or a Petri dish8. Not only do the vessels themselves
differ in size and shape, but the exposed surface area available for evaporation and the thickness,
or depth, of the liquid varies as well, depending on the dimensions of the vessel being used. For
example, 10 mL of a liquid in a Petri dish with dimensions 60 x 15 mm would resemble a thin
film covering the bottom of the dish with an exposed surface area of ~32.9 cm2, while 10 mL of
that same liquid in a 10-mL graduated cylinder with a diameter of 1.2 cm and a height of 7.80
cm would have a very narrow surface area of ~1.1 cm2 available for evaporation. Furthermore,
the thickness of the liquid in this particular Petri dish might be ~0.1 cm, while the thickness of
this same liquid might be 7.80 cm in the graduated cylinder. A smaller exposed surface area
combined with a larger distance for the molecules to travel in order to evaporate will decrease
the rate of evaporation, resulting in more abundant compounds in the chromatogram. The NCFS
evaporates the liquid standards for the ILRC in graduated microvials4, while Sandercock and
coworkers generated evaporated samples of gasoline in 7 mL vials13
. Hetzel used 18 x 150 mm
test tubes as vessels for evaporation10
. All three of these vessels have exposed surface areas and
liquid thicknesses similar to that of a graduated cylinder. However, Malmquist et al. performed

9
their evaporation experiments in Petri dishes11
, while Okamoto et al. performed multiple studies
using liquid samples evaporated in an open tray, which has an exposed surface area similar to
that of a Petri dish14, 15, 16
.
Another factor that can affect evaporation is the use of agitation. Molecules can only
evaporate into the environment from the surface of the liquid. By changing the rate of agitation,
the evaporation rate for each compound may be altered. For example, increasing the agitation
rate will allow volatile molecules near the bottom of the liquid to rise to the surface, evaporating
into the environment. As a result, the evaporation rate will not be limited by diffusion,
decreasing the amount of time necessary for evaporation to occur. Although the studies
performed by both Fingas and Heymes et al. involved evaporating samples under windy and
non-windy conditions17, 18
, no studies used agitation during the evaporation process.
Although there are multiple ways to address the need for a standardized method for
evaporating liquids, only two methods will be addressed in this thesis. The first method focuses
on investigating the different factors that are known to affect the rate of evaporation to ensure the
most accurate representation of the ignitable liquid standards possible. The second method
involves the use of a model to mathematically generate chromatograms of evaporated liquids
based only on the unevaporated ignitable liquid standard. By using a mathematical model, all of
the potential influences on the evaporation process are eliminated.
1.4 Development of the Mathematical Model
The mathematical model developed by McIlroy et al. was originally developed for
environmental purposes and used diesel fuel that was passively evaporated in a thin film as its
basis19, 20
. The model, which can predict the fraction remaining for individual compounds, was
originally designed for use in determining the behavior of crude oil in large scale oil spills. By

10
predicting the fraction remaining for each compound within the diesel fuel, the fraction
remaining of the total fuel could be estimated at different time and temperature intervals.
To develop the model, a thin film of diesel fuel on top of water in a Petri dish was passively
evaporated at room temperature inside an evaporation chamber. Samples were taken at nine
different time points throughout the evaporation process19, 20
. The evaporated samples were then
analyzed by GC-MS. Retention indices were calculated for all of the compounds in the diesel
sample.
Decay curves were generated for four different classes of compounds (n-alkanes, branched
alkanes, alkyl benzenes, and polycyclic hydrocarbons) present in diesel by plotting the
evaporation time versus the abundance, which was normalized to the peak height of the n-alkane,
C21. Decay curves for the n-alkanes C10, C12, and C14 are shown in Figure 1-3. Decane (boiling
point 174.1 °C) evaporates rapidly and is almost fully evaporated after 150 hours. Dodecane
(boiling point 216.2 °C) and tetradecane (boiling point 253.5 °C) do not evaporate as readily.
From these data, the first-order kinetic rate constants, k, were calculated using non-linear
regression, shown in Equation 1-1,
Equation 1-1
where Ct is the concentration of the compound at a certain time (t) and C0 is the initial
concentration of the compound. The calculated rate constants decrease as the volatility of the
compound decreases. For example, C10 has a faster rate constant than C12, and C14 has a rate
constant of zero, indicating that its concentration does not change noticeably over 300 hours.
The rate constants were plotted as a function of retention index and modeled using multiple
linear regression (Equation 1-2),
Equation 1-2

11
where ln (k) is the natural log of the rate constant, -1.04 × 10⁻²
and 6.70 are constants
representing the slope and intercept, respectively, and I is the retention index. Retention index
was used for the model because it has a linear relationship with boiling point, making it
advantageous over retention time. Retention index is based on the number of carbons in the n-
alkane (n), the retention time of the compound of interest (tx), and the retention times of the
normal alkanes eluting before and after the compound (tn and tn+1, respectively), shown in
Equation 1-3.
Equation 1-3
Figure 1-3. Decay curve for decane (C10), dodecane (C12), and tetradecane (C14) in diesel
evaporated at 20 ºC19, 20
Retention index has several advantages compared to retention time because retention index is
not affected by many gas chromatography parameters that affect retention time, such as mobile
0
12
0 100 200 300
No
rma
lize
d A
bu
nd
an
ce
Evaporation Time (h)
C14 k=0.0x100 hr-1
C10 k=-2.01x10⁻² hr-1
C12 k=-2.20x10⁻³ hr-1

12
phase flow rate, column dimensions, and oven temperature program. The regression models for
each of the four chemical classes were then combined into a comprehensive regression model
(Figure 1-4).
Figure 1-4. Rate constant (k) as a function of retention index (I) for compounds in diesel: n-
alkanes (squares), branched alkanes (circles), alkyl benzenes (diamonds), and polycyclic
hydrocarbons (triangles)19, 20
The rate constants were then used to predict the fraction remaining for each individual
compound in diesel. The fraction remaining (F) of each compound was calculated using the rate
constant (k) calculated from Equation 1-2, and time (t), shown in Equation 1-4.
Equation 1-4
The fraction remaining ranged from 0 to 1, with 1 indicating no evaporation and 0 indicating
complete evaporation. The fraction remaining for each individual retention index was then used
to generate the fraction remaining curve, which showed the fraction remaining for the total fuel.
-7
-1
750 850 950 1050 1150 1250
ln (
k)
(h-1
)
Retention Indexpolycyclic hydrocarbons n-alkanes alkyl benzenes branched alkanes

13
The fraction remaining curve was used to generate the compound distribution in the
chromatogram after evaporation using just the chromatogram of the unevaporated liquid.
The chromatogram of an unevaporated liquid, such as diesel (Figure 1-5A), was multiplied by
the fraction remaining curve for that liquid (Figure 1-5B) to generate theoretical chromatograms
of the liquid corresponding to different evaporation levels. These theoretical chromatograms
were compared to the corresponding experimental chromatogram (Figure 1-6). McIlroy et al.
used Pearson product-moment correlation (PPMC) coefficients (discussed in Chapter 2, Section
2.4) to assess the similarity between the theoretically derived chromatograms and the
experimentally obtained chromatograms19, 20
. A strong correlation was observed between each
set of experimental and theoretical chromatograms, indicating that the model was extremely
accurate at predicting the evaporation of diesel.
Although the model was validated with kerosene (a petroleum distillate) and marine fuel
stabilizer (a naphthenic paraffinic product), the primary focus was on the environmental
applications, which involves determining the time necessary for evaporation, rather than the
forensic applications, which emphasizes the level of evaporation instead of the time. As a result,
the model needs to be applied to additional classes of ignitable liquids, particularly gasoline, to
be applicable in forensic laboratories.
1.5 Research Objectives
The first objective in this research was to investigate the effect of various factors on the
reproducibility of the evaporation process. Gasoline was selected for this initial investigation due
to its high volatility and common use as an accelerant. Gasoline was actively evaporated under
nitrogen to different levels by volume, under different conditions, before being analyzed by GC-
MS. The evaporated samples were generated with and without agitation in both a graduated

14
Figure 1-5. (A) Experimental unevaporated diesel chromatogram and (B) Fraction remaining (F)
curve calculated according to equation 1-3 and 1-4
0
7.5
700 1200 1700 2200 2700
No
rma
lize
d A
bu
nd
an
ce
Retention Index
0
1
700 1200 1700 2200 2700
Fra
cti
on
Re
ma
inin
g
Retention Index
A
B

15
Figure 1-6. Overlaid experimental and theoretical chromatograms for diesel evaporated for 100
hours at 20 °C
cylinder and a Petri dish, and the mass lost for each sample was determined. For the agitated
samples, three different agitation rates and three different shaped stir bars were investigated.
The second objective in this research was to investigate the application of the previously
developed mathematical model for fire debris analysis. The model was used to mathematically
generate chromatograms for three petroleum distillate standards and one gasoline standard based
solely on the corresponding chromatogram of the unevaporated liquid. Chromatograms
corresponding to four different evaporation levels were generated using the model based on the
experimental fraction remaining by mass. PPMC coefficients were then used to compare the
theoretical chromatograms to experimentally derived chromatograms to assess the utility of the
mathematical model for this application.
0
7.5
700 1200 1700 2200 2700
No
rmalized
Ab
un
dan
ce
Retention Index
Experimental
Predicted

16
By determining the factors that affect the evaporation of ignitable liquid reference standards,
this research will provide the first step in developing a standardized method for generating
reference standards evaporated to different levels for inclusion in databases. This research will
also be the first step in assessing the utility of a previously generated mathematical model for
applications in fire debris analysis.

17
REFERENCES
18
REFERENCES
1. State of Michigan. May 4, 2015 Michigan’s Official Website. Michigan: State of
Michigan, 2015. http://www.michigan.gov/som/0,4669,7-192-29943_34759-353757--
,00.html (accessed July 6, 2015).
2. ASTM International. ASTM E1618-11: standard test method for ignitable liquid residues
in extracts from fire debris samples by gas chromatography-mass spectrometry. Annual
book of ASTM standards, Vol 14.02. West Conshohocken, PA: ASTM International,
2011.
3. Stauffer E, Newman R, Dolan JA. Fire debris analysis. 1st edition. London, UK: Elsevier,
2008.
4. National Center for Forensic Science and University of Central Florida. Ignitable Liquids
Reference Collection (ILRC Database). Orlando, FL: National Center for Forensic
Science and University of Central Florida, 2000. http://ilrc.ucf.edu (accessed February
2015).
5. Idaho State Police Forensic Services. Fire Evidence Analysis Rev 10. State of Idaho:
Idaho State Police Forensic Services, 2013.
http://www.isp.idaho.gov/forensics/index.html (accessed July 10, 2015).
6. Virginia Department of Forensic Science. Trace Evidence Procedures Manual Rev 12.
Richmond, Virginia: Department of Forensic Science, 2005 – 2015.
http://www.dfs.virginia.gov/laboratory-forensic-services/trace-evidence/procedure-
manuals (accessed July 15, 2015).
7. Alaska Scientific Crime Detection Laboratory. Fire Debris Analysis Manual Version:
FD2012 R0 archived. State of Alaska: State of Alaska Department of Public Safety,
2012. dps.alaska.gov archived (accessed September 20, 2014).
8. Personal communication with forensic chemist at Bureau of Alcohol, Tobacco, Firearms
and Explosives (ATF) via email in May 2014.
9. Kuk RJ, Spagnola MV. Extraction of alternative fuels from fire debris samples. J
Forensic Sci 2008; 53(5): 1123 – 9.
10. Hetzel S. Survey of American (USA) gasolines (2008). J Forensic Sci 2014; 60(s1): S197
– S206.

19
11. Malmquist LMV, Rasmus RR, Hansen AB, Andersen O, Christensen JH. Assessment of
oil weathering by gas chromatography-mass spectrometry, time warping, and principal
component analysis. J Chromatogr A 2007; 1164: 262 – 70.
12. Zorzetti BM, Shaver JM, Harynuk, JJ. Estimation of the age of a weathered mixture of
volatile organic compounds. Anal Chim Acta 694 (2011) 31 – 7.
13. Sandercock PML, Du Pasquier E. Chemical fingerprinting of gasoline 2: Comparison of
unevaporated and evaporated automotive gasoline samples. Forensic Sci Int 2004; 140:
43 – 59.
14. Okamoto K, Watanabe N, Hagimoto Y, Miwa K, Ohtani H. Evaporation characteristics
of multi-component liquid. J Loss Prevent Proc 2010; 23: 89 – 97.
15. Okamoto K, Hiramatsu M, Miyamoto H, Hino T, Honma M, Watanabe N, et al.
Evaporation and diffusion behavior of fuel mixtures of gasoline and kerosene. Fire Saf J
2012; 49: 47 – 61.
16. Okamoto K, Watanabe N, Hagimoto Y, Miwa K, Ohtani H. Changes in evaporation rate
and vapor pressure of gasoline with progress of evaporation. Fire Saf J 2009; 44: 756 –
63.
17. Fingas MF. Modeling evaporation using models that are not boundary-layer regulated. J
Hazard Mater 2004; 107: 27 – 36.
18. Heymes F, Aprin L, Bony A, Forestier S, Cirocchi S, Dusserre G. An experimental
investigation of evaporation rates for different volatile organic compounds. Process Saf
Prog on behalf of the American Institute of Chemical Engineers 2013; 32(2): 193 – 8.
19. McIlroy JW, Jones AD, McGuffin VL. Gas chromatographic retention index as a basis
for predicting evaporation rates of complex mixtures. Anal Chim Acta 2014; 852: 257 –
66.
20. McIlroy JW. Kinetic models for the prediction of weathering of complex mixtures on
natural waters [dissertation]. East Lansing (MI): Michigan State University, 2014.

20
Chapter 2: Instrument and Data Analysis Theory
2.1 Instrumentation: Gas Chromatography (GC), Mass Spectrometry (MS), and Flame
Ionization Detector (FID)
2.1.1 Gas Chromatography (GC)
Chromatography techniques involve the separation of compounds that is achieved via
interactions with a stationary and a mobile phase. The mobile phase is typically a gas or a liquid
that carries the compounds through the stationary phase, which is usually a liquid or a solid.
Although there are many types of chromatography, gas chromatography is most commonly used
for the analysis of fire debris evidence. Gas chromatography (GC) is based primarily on the
partitioning of an analyte between a gaseous mobile phase and a liquid stationary phase, which is
thinly coated onto the inner wall of a capillary column. The general diagram of a GC coupled to
a mass spectrometer, which is commonly used in forensic laboratories, is shown in Figure 2-1.
A liquid sample is injected into the instrument through a heated (typically 250 °C) injector
port using a microsyringe. There are two different types of injection: splitless and split. A
splitless injection refers to the injection of the entire volume of the sample, with none of the
sample being sent to waste. A split injection (typically 50:1 or 100:1) involves the division of the
sample being injected into the column. As the ratio of the split increases, the amount of sample
that enters the column decreases. A split injection is commonly used when a sample is
concentrated or if the concentration is unknown, in order to avoid overloading or contaminating
the system, while a splitless injection is necessary for low concentration samples.
The vaporized sample is then carried through the column by the flow of the mobile phase
(typically 1 mL/min). Helium is commonly used as the mobile phase, or carrier gas, because it is
inert and does not interact with the compounds being separated. However, the choice of carrier

21
Figure 2-1. General diagram for a gas chromatograph-mass spectrometer
gas may depend on the type of detector being used. The compounds within the sample will elute,
or travel through the column to the detector, at different rates based, primarily, on boiling point
and, secondarily, on the interactions between each compound and the column stationary phase.
Depending on the composition of the column stationary phase, certain compounds will interact
more than others. A column containing a 5%-diphenyl-95%-dimethylpolysiloxane stationary
phase is commonly used in forensic laboratories. The phenyl groups give the stationary phase
slightly polar characteristics, which influences the elution of certain types of compounds such as
aromatics and polycyclic hydrocarbons. A column with a 100% poly(dimethylsiloxane)
Gas
Cylinder
Injector Port
Syringe
Column
Transfer
Line
Mass
Spectrometer
Oven

22
stationary phase is the most non-polar commercially available stationary phase, resulting in
compounds eluting based solely on boiling point. Additionally, oven temperature programs are
commonly used to improve the separation and reduce the amount of time a sample spends in the
column.
As GC is a separation-based technique, it is subject to the effects of the Golay equation
(Equation 2-1), which is typically utilized to optimize the separation of analytes in the sample.
Equation 2-1
The B term, which is related to the longitudinal diffusion caused by the migration of analytes
from an area of high concentration to an area of low concentration, is extremely important in GC
separations. The diffusion rate depends on numerous variables, including temperature and the
solute-solvent system. As the samples in GC are gaseous in the mobile phase, the rate of
diffusion is much faster (1 to 0.1 cm2/sec) than if the compounds were liquid. The use of lower
oven temperatures or an oven temperature program can minimize the B term by lowering the
diffusion coefficient of the analytes. The C terms are related to the mass transfer between the
mobile and stationary phases. The Cs term is affected by the thickness of the stationary phase
film, while the Cm term is related to the mass transfer in the mobile phase. As the films used in
this GC system are very thin, the Cs term is negligible. However, the Cm term is still a factor.
One way to reduce the Cm term is to use a column with a narrower inner diameter.
The sample moves through the column, and analytes are separated based on boiling point.
Each separated analyte reaches the detector, taking a different amount of time to travel through
the system, which is known as the retention time of the analyte. The more volatile analytes, or
those with lower boiling points, will reach the detector before the less volatile analytes. One of
the outputs from a GC analysis is a chromatogram, which is a plot of abundance on the y-axis

23
and retention time on the x-axis. Each separated analyte is present as a peak in the
chromatogram, shown in Figure 2-2. The ideal chromatographic peak will be Gaussian in
appearance, although misshapen peaks are not uncommon due to the effects of non-linear
isotherms and some extra-column sources, such as the injection and detection volumes. The x-
axis represents the retention time, or the time it takes for each compound to travel through the
column to the detector. The height of each peak is dependent on the concentration, or amount, of
that compound present in the original sample. Therefore, the relative abundances, or peak
heights, can provide information about the ratio of compound concentrations within the sample.
While GC separates compounds and provides qualitative and quantitative information about
each compound, GC alone cannot be used to definitively identify a compound because it does
not provide structural information. Therefore, it must be combined with some type of detector
that can be used for identification purposes. One such type of detector is the mass spectrometer.
Figure 2-2. Chromatogram generated from gas chromatographic analysis
0
3
2 4 6 8 10 12 14
No
rmali
zed
Ab
un
dan
ce
Retention Time (min)

24
2.1.2 Mass Spectrometry (MS)
As the sample moves through the column encased within the transfer line, it passes through
the heated interface (typically 280 °C) between the GC and the MS detector. This allows a
continuous introduction of sample into the MS from the GC column. Although there are many
types of detectors, ionization methods, and mass analyzers, only the system most commonly used
in forensic laboratories will be discussed here. The entire system is under vacuum to achieve low
pressure, which is essential to generate ions and electrons. Pressures typically range from 10-2
to
10-5
Pa to minimize the chance for collisions within the mass analyzer.
Once the sample moves completely through the interface, it enters the ionization chamber
(Figure 2-3), where electron ionization occurs. In electron ionization, a high-energy beam of
electrons (e-) bombards the sample (M) entering the chamber, causing the sample to lose
electrons, resulting in positively charged ions. The molecular ions (M+) then fragment due to an
excess of energy, producing fragment ions. However, each molecule will fragment differently,
resulting in unique fragmentation patterns.
Figure 2-3. General diagram of electron ionization chamber
e-
e-
e-
M M+
M
+ M
Mass
Analyzer Column
Filament
Repeller

25
The charged ions then travel into the quadrupole mass analyzer (Figure 2-4), which consists
of four rods arranged in a diamond shape. Each pair of parallel rods has the same charge, with
one pair being positively charged and the other pair being negatively charged. Due to the
different charges, an electromagnetic field forms and is able to separate ions based on their mass-
to-charge (m/z) ratio due to a combination of radiofrequency (RF) and direct-current (DC) fields.
Depending on the m/z of the ions, certain ions with collide with the rods and be pumped away by
the vacuum system, while other ions will maintain a steady trajectory and pass through the center
of the mass analyzer to the detector. For each set of RF/DC voltages, only a specific range of m/z
values will be allowed through the entire mass analyzer. By scanning all RF/DC voltages, ions
with different m/z values will be allowed to reach the detector. This method results in the full
mass range being scanned in order to generate the mass spectrum of the sample.
Figure 2-4. General diagram of single quadrupole MS detector showing the pathway of a stable
ion through the mass analyzer to the detector
Once the ions with different m/z ratios have been separated, they enter the detector, which
detects the relative abundance of each ion. In order to accurately detect all of the ions flowing
Ion Source
Single quadrupole mass analyzer
Detector
+ +
-
-

26
through, the detector converts the signal from the ions into an electric current, which represents
the abundance of the detected ions at a specific m/z value at any given point in time. In order to
increase the sensitivity of the MS detector, an electron multiplier is used to magnify the signal
from each ion. An electron multiplier, shown in Figure 2-5, consists of a series of flat metal
dynodes coated with lead oxide, arranged in a funnel-like pattern. As each ion enters the
detector, it will collide with one of the plates, resulting in the emission of electrons. Due to
different potentials applied to each plate, the electrons will collide with the next plate, resulting
in additional emissions of electrons. As each collision occurs, the quantity of electrons emitted
increases, causing an amplification effect. The amplified current from the electrons can then be
detected. Although the electron multiplier does result in increased sensitivity, it does not
uniformly respond to ions of all masses.
Figure 2-5. General diagram of electron multiplier
Mass spectrometry can be used to definitively identify compounds because it provides
structural information about the chemical composition of the compound. When each compound
fragments during the ionization process, the resulting fragmentation pattern is unique to that
Ion
Potential
measured by
detector

27
compound under those specific conditions. As a result, the mass spectrum, shown in Figure 2-6,
for each compound can be viewed as that compound’s fingerprint, allowing for definitive
identification. The mass spectrum consists of a series of peaks, each of which correspond to a
specific m/z ratio. Each m/z ratio, in turn, represents a specific fragmented portion of the original
compound. The height of each peak represents the abundance of that particular fragment ion. The
molecular ion peak (M+) corresponds to the molecular mass of the compound, helping with
identification. The most abundant peak, known as the base peak, is the most commonly formed
fragment ion for a specific compound.
Figure 2-6. Exemplar mass spectrum generated by mass spectrometer
Molecular
ion peak M+
Base
peak
Mass-to-charge (m/z)
Abundan
ce

28
Each peak in the chromatogram results in its own mass spectrum. The mass spectrum of each
peak is then compared to known mass spectra in a reference library in order to identify the
compound. By looking at each mass spectrum, all of the compounds in the sample can be
identified.
2.1.3 Flame Ionization Detector (FID)
Another type of detector used with gas chromatography is the flame ionization detector
(FID). Like the mass spectrometer, which is considered a universal detector, the FID is also a
universal detector and is very sensitive with a dynamic range of 107 and a sensitivity range of 10
– 100 pg.
A general schematic for the FID is shown in Figure 2-7. As the compounds exit the column,
they enter the FID where they are combusted by a hydrogen flame, forming ions. Although ions
are formed in both FID and MS detectors, the ions are not separated prior to entering the FID
and, therefore, are detected all at the same time. As a result, FID cannot be used for definitive
identification as structural information is not provided due to the lack of separation. The ions
move to the collector, which contains two plates. A potential difference is applied to the plates.
As analyte ions begin to enter the collector, the current increases, and the new current is
detected. Therefore, the current is dependent on the presence of ions in the collector. Although
the FID is insensitive to water and carbon dioxide, the temperature of the detector must be high
enough that condensation does not occur due to the combustion process. The resulting signal is
determined by the number of carbon atoms in the flame.
2.2 Correlation Optimized Warping (COW) Alignment
Correlation optimized warping (COW) alignment is a type of retention-time alignment,
designed to correct for natural shifts in the apex of chromatographic peaks due to drifts in

29
Figure 2-7. General diagram of flame ionization detector (FID)
retention time. These drifts in retention time can be caused by changes in the mobile phase flow
rate, injection volume, and column length. This process aligns chromatographic data by
performing piecewise linear stretching and warping of the retention time axis in each
chromatogram2. One chromatogram is used as the target and must contain all of the compounds
present in the chromatograms being aligned. The other chromatograms are then adjusted to align
with the target, one at a time. Each chromatogram is split into equal-sized segments, which may
vary depending on the software program being used. In order to properly align the
Exit end of
column
Detector
Power
Supply
Collector
Inside oven wall
H2-air
flame
Air
H2 gas
Igniter

30
chromatograms, a certain number of data points, known as the warp or slack, are either added or
subtracted until the apex of each peak in every segment of the chromatogram is aligned with the
corresponding peak apex in the target chromatogram segments. Although data points are added
or removed, no chemical information is lost or added, and each individual segment remains in
the same position in the overall chromatogram. The alignment is then evaluated by determining
the correlation coefficient between each individual segment in the chromatogram compared to
the corresponding segment in the target chromatogram2.
The segment size and warp are user-defined parameters, although guidelines exist for
selecting these features. Typically, the segment size is first chosen to match the number of data
points across a peak, and a small warp, which consists of only a few data points, is used.
Depending on the amount of adjustment necessary, the segment size and warp are varied one at a
time until the optimal parameters are determined3. To assess the alignment, local correlation of
each segment is determined, followed by global correlation of the aligned data.
2.3 Retention index
Kováts introduced the concept of retention indices, after demonstrating the linear relationship
between retention of normal alkanes on a non-polar stationary phase and boiling point (Figures
2-8 to 2-10)5. As a result, retention indices can be calculated for compounds in a chromatogram
based on the retention times of the compounds of interest (tx) and the retention times of the
normal alkanes eluting before and after the compounds (tn and tn+1, respectively), within the same
injection, as shown in Equation 2-2. This equation is only applicable for separations under
temperature programmed conditions.
Equation 2-2

31
Figure 2-8. Plot of retention index versus boiling point showing linear relationship6, 7
Figure 2-9. Chromatogram of unevaporated diesel with retention time on the x-axis7
375
400
425
450
475
500
525
750 850 950 1050 1150 1250
Bo
ilin
g P
oin
t (K
)
Retention Index
*
0
7
0 5 10 15 20 25 30 35 40
Ab
un
dan
ce
Retention Time (min)
C8
C11
C9
C10
C21
C20
C19
C18
C17
C16
C15
C14
C13
C12
32
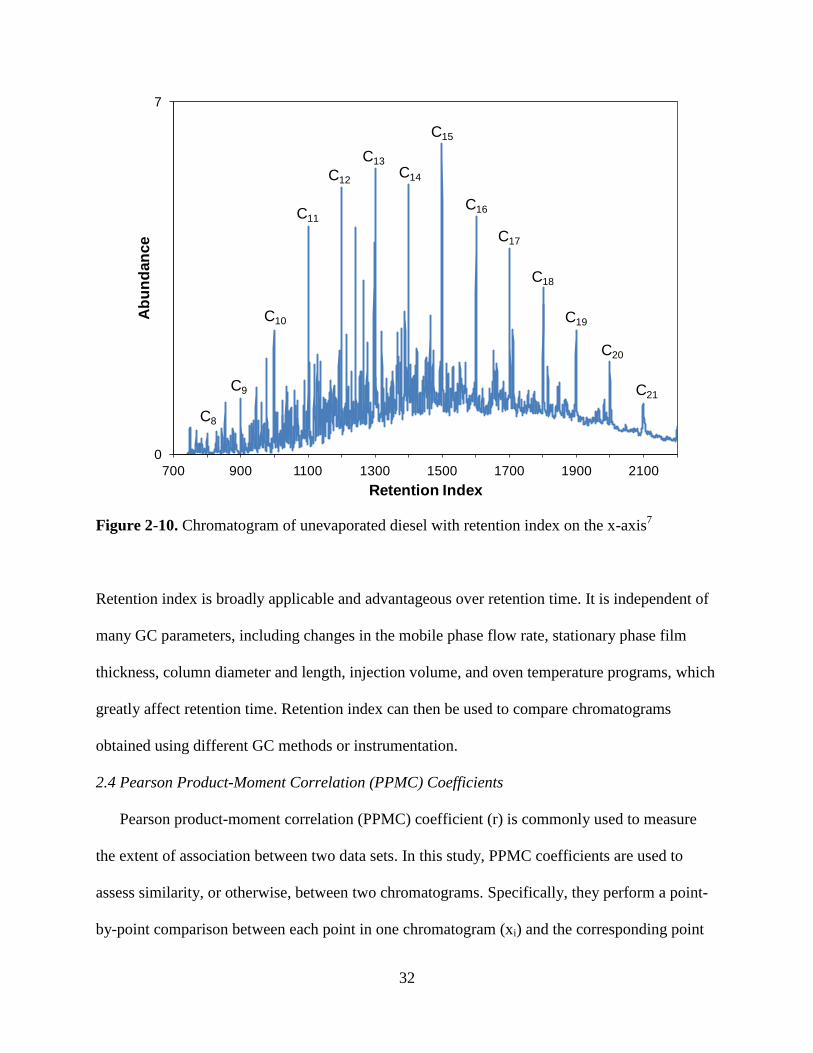
Figure 2-10. Chromatogram of unevaporated diesel with retention index on the x-axis7
Retention index is broadly applicable and advantageous over retention time. It is independent of
many GC parameters, including changes in the mobile phase flow rate, stationary phase film
thickness, column diameter and length, injection volume, and oven temperature programs, which
greatly affect retention time. Retention index can then be used to compare chromatograms
obtained using different GC methods or instrumentation.
2.4 Pearson Product-Moment Correlation (PPMC) Coefficients
Pearson product-moment correlation (PPMC) coefficient (r) is commonly used to measure
the extent of association between two data sets. In this study, PPMC coefficients are used to
assess similarity, or otherwise, between two chromatograms. Specifically, they perform a point-
by-point comparison between each point in one chromatogram (xi) and the corresponding point
0
7
700 900 1100 1300 1500 1700 1900 2100
Ab
un
dan
ce
Retention Index
C8
C11
C9
C10
C21
C20
C19
C18
C17
C16
C15
C14
C13
C12

33
in the second chromatogram (yi). The equation for calculating PPMC coefficients is shown in
Equation 2-3.
Equation 2-3
The variables xi and yi represent the same specific data point in each of the chromatograms
being compared, while the x and y represent the average data points in the two chromatograms,
respectively. In essence, the PPMC coefficients are calculated by dividing the summation of the
differences between each specific data point and the averages in both chromatograms by the
summation of the standard deviations from each chromatogram. Therefore, the PPMC
coefficients demonstrate how the two variables vary together by determining the covariance, or
the numerator, and how they vary independently by determining the variance, or the denominator
(Equation 2-3)4. Although instrument replicates should theoretically have a correlation of 1,
indicating perfect correlation, this will only rarely occur due to instrumental drift and other
minute differences. PPMC coefficients range from 1 to 0 with any value ± 0.99 – 0.8 indicating a
strong correlation. Moderate correlation relates to PPMC coefficients ranging from ± 0.79 – 0.5,
and weak correlation relates to PPMC coefficients < ± 0.5. A correlation value of 0 indicates no
correlation between the two variables. A positive correlation indicates that both points of
comparison have similar behavior, while a negative correlation indicates that one point is rising
while the other is falling.

34
REFERENCES

35
REFERENCES
1. Stauffer E, Newman R, Dolan JA. Fire debris analysis. 1st edition. London, UK: Elsevier,
2008.
2. Skoog DA, Holler FJ, Crouch SR. Principles of instrumental analysis. 6th
edition.
Belmon, CA: Thompson, 2007.
3. Vest Nielsen N-P, Carstensen JM, Smedsgaard J. Aligning of single and multiple
wavelength chromatographic profiles for chemometric data analysis using correlation
optimised warping. J Chromatogr A 1998; 805: 17 – 35.
4. McIlroy JW. Effects of data pretreatment on the multivariate statistical analysis of
chemically complex samples [Master’s thesis]. East Lansing (MI): Michigan State
University, 2014.
5. Erdey L, Takács J, Szalánczy É. Contribution to the theory of the retention index system
I. Retention indices using programmed-temperature gas chromatography. J Chromatogr
A 1970; 46: 29 – 32.
6. McIlroy JW, Jones AD, McGuffin VL. Gas chromatographic retention index as a basis
for predicting evaporation rates of complex mixtures. Anal Chim Acta 2014; 852: 257 –
66.
7. McIlroy JW. Kinetic models for the prediction of weathering of complex mixtures on
natural waters [dissertation]. East Lansing (MI): Michigan State University, 2014.
8. Devore JL. (1991). Probability and statistics for engineering and the sciences. 3rd
edition.
Belmont, CA: Duxbury Press, Wadsworth, Inc.

36
Chapter 3: Factors Influencing the Evaporation of Gasoline
3.1 Introduction
Numerous factors, such as the rate of agitation and the exposed surface area available for
evaporation, influence the evaporation of gasoline. In this chapter, several studies were
conducted to determine the effect of each of these factors on the reproducibility of gasoline after
evaporation. As evaporation can complicate the identification of ignitable liquids, especially for
volatile liquids such as gasoline, the standards used for comparison need to be as accurate and
reproducible as possible. By determining the effect of these different factors on the evaporation
process, forensic laboratories can begin to develop a more standardized method for the
evaporation of the standards in the ignitable liquid reference collections.
3.2 Materials and Methods
3.2.1 Collection and Preparation of Gasoline Samples
Two samples of gasoline, collected approximately six months apart, were used for these
experiments. Both gasolines were collected from the same gas station in the East Lansing, MI
area.
A ten-milliliter graduated cylinder (product number 70075-10, Corning, Inc., Corning, NY),
containing a stir bar and covered with a piece of aluminum foil, was weighed on an analytical
balance (serial number 60403, Mettler H80, Columbus, OH), and the mass recorded. Ten
milliliters of gasoline were poured into the graduated cylinder, and the new mass was recorded.
The cylinder was then placed in the center of a stir plate (model number S130815, Thermo
Scientific, Waltham, MA) in the fume hood. The gasoline was actively evaporated using house
nitrogen for all experiments, but was agitated at different rates using different stir bars and vessel
dimensions, depending on the specific conditions of the experiment. Samples of gasoline were

37
individually evaporated to approximately 25%, 50%, 75%, and 90% by volume. Once the
desired volume was reached, the graduated cylinder was removed from the fume hood and the
remaining liquid was poured into a pre-weighed vial and capped. The vial was re-weighed, and
the new mass recorded. Finally, the foil was replaced on top of the cylinder, and the cylinder was
reweighed to determine the mass of residual gasoline present. Based on these masses, the mass
of gasoline evaporated was determined and recorded. Although evaporation level was
determined by volume and by mass, the latter was used throughout to increase the accuracy of
the denoted evaporation level. The graduated cylinder and stir bar were then thoroughly rinsed
with dichloromethane (HPLC/UHPLC grade, J.T. Baker, Avantor Performance Materials, Inc.,
Center Valley, PA) before being left to air dry.
Following evaporation, ten microliters of each sample were transferred into a two-milliliter
volumetric flask and diluted with dichloromethane to the calibrated mark. The diluted liquid was
transferred into a vial and analyzed by GC-MS.
3.2.2 Evaporation of Gasoline Samples
The first two studies were conducted using a small stir plate (model number S130815,
Thermo Scientific), which enabled the evaporation of one experimental replicate at a time. The
first study investigated the effect of agitation rate on the evaporation of gasoline. Three separate
experiments were performed, in each case using a spinfin® stir bar (product number
F371250012, Bel-Art Products, Inc., Wayne, NJ) with different agitation rates, corresponding to
speed settings of 7 (109 ± 2 rpm), 9 (134 ± 2 rpm), and 11 (199 ± 2 rpm), respectively. For each
agitation rate, the gasoline was evaporated to the aforementioned levels in triplicate, generating
three experimental replicates.
The second study investigated the effect of different shaped stir bars, shown in Figure 3-1, on

38
the evaporation of gasoline. Three experiments were performed, one using a spinfin® stir bar
(product number F371250012, Bel-Art Products, Inc.), one using a spinvane® stir bar (product
number F371340000, Bel-Art Products, Inc.), and one using a micro stir bar (product number
F371190002, Bel-Art Products, Inc.). Again, the gasoline was evaporated to the four different
levels in triplicate, generating three experimental replicates for each stir bar shape.
Figure 3-1. Images of the spinfin®, the spinvane®, and the micro stir bars, respectively1
Non-agitated samples of evaporated gasoline were obtained for comparison to the agitated
samples from the two agitation studies. The gasoline was actively evaporated under nitrogen in
the same graduated cylinder to the four different levels in triplicate, resulting in three
experimental replicates.
The final study involved the evaporation of gasoline in a Petri dish (part number 3160-60BO,
Corning, Inc., Corning, NY) without agitation. Again, the gasoline was evaporated to the four
different levels in triplicate, generating three experimental replicates.
3.2.3 GC-MS Analysis
The unevaporated and evaporated gasoline samples were analyzed using an Agilent 6890N
GC coupled to a 5975 MSD with an Agilent 7683B automatic liquid sampler (Agilent
Technologies, Palo Alto, CA). A 1 µL injection volume was injected in pulsed (0.25 min at
pressure 15.0 psi) splitless mode into the injection port, which was heated to 250 °C. Ultra high-
purity helium (Airgas Great Lakes, Independence, OH) was used as the carrier gas with a

39
nominal flow rate of 1 mL/min. A 5% diphenyl-95% dimethylpolysiloxane stationary phase (30
m × 0.25 mm × 0.25 µm), was used with the following oven temperature program: 40 °C for 3
min, 10 °C/min to 280 °C, with final hold for 4 min. A transfer line temperature of 280 °C was
also used. The mass spectrometer used electron ionization (70 eV, 230 °C) and a quadrupole
mass analyzer (150 °C), with a mass scan range of 50 – 550 amu and a scan rate of 2.91 scans/s.
3.2.4 Data Analysis
The total ion chromatograms (TICs) were exported from the ChemStation software (version
E.01.01.335, Agilent Technologies) to Microsoft Excel 2007 (Microsoft Corporation, Redmond,
WA) for further processing. The data were normalized to the maximum peak height of 2-
methylnaphthalene with the assumption that 2-methylnaphthalene does not evaporate. However,
this is not completely true. Due to its boiling point of 241.1 °C, 2-methylnaphthalene is
somewhat volatile and will be affected by evaporation. Therefore, the normalization may be
affected by the slight evaporation of 2-methylnaphthalene.
To investigate the effect of each parameter on the evaporation of gasoline, the following
compounds were considered: toluene, p-xylene (a C2-alkylbenzene), 1,2,3-trimethylbenzene (a
C3-alkylbenzene), and 1,2,4,5-tetramethylbenzene (a C4-alkylbenzene). These compounds are
considered characteristic of gasoline and cover a wide range in volatility.
Initially, the mean peak area and peak height for each compound of interest, along with the
associated relative standard deviation (RSD) were calculated for each set of experimental
replicates. However, the RSDs do not provide an accurate representation of the experimental
replicates because of differences in the mass lost in each replicate. Due to variability in the
evaporation process, the mass lost varies for different replicates. Fraction remaining by mass
values account for these slight differences, while RSDs do not. For example, the fraction

40
remaining by mass for three experimental replicates of 25% evaporated gasoline was 0.764,
0.768, and 0.773, respectively. The RSD for these three replicates is 0.59. The fraction remaining
by mass for three experimental replicates of 90% evaporated gasoline was 0.0620, 0.0928, and
0.107, respectively. The RSD for these three replicates is 26%. The RSD of the experimental
replicates was extremely high at 90% evaporated, due to the variability in the evaporation
process at low volumes and, thus, provided a false representation of the relationship among the
experimental replicates.
Because of the differences in mass lost among experimental replicates, the fraction of each
gasoline remaining after evaporation was also taken into account. The experimental fraction
remaining by mass was determined by dividing the mass remaining after evaporation by the
initial mass of gasoline. The abundance of the compound of interest in a particular replicate was
then plotted against the fraction of gasoline remaining for that replicate. These plots were
generated for each compound to allow an assessment of the effect of the parameter under
investigation on the reproducibility of the evaporation.
3.3 Results and Discussion
3.3.1 Effect of Evaporation on the Chemical Composition of Gasoline
The chromatogram of unevaporated gasoline, shown in Figure 3-2, contains a characteristic
pattern of abundant aromatic compounds, which typically consists of toluene, C2-alkylbenzenes
(including ethylbenzene, p-xylene, and o-xylene), C3-alkylbenzenes (including propylbenzene
and 1,2,4-trimethylbenzene), C4-alkylbenzenes (including 1,2,4,5-tetramethylbenzene and 1-
methyl-4-(2-propenyl)benzene), and two methylnaphthalenes (1-methylnaphthalene and 2-
methylnaphthalene). The composition of the gasoline standard used in this research was in
accordance with ASTM guidelines2, which requires the presence of toluene, the C2-, C3-, and C4-

41
alkylbenzenes, and the methylnaphthalenes as well as specific ratios of the peak heights of these
compounds (e.g. C2-alkylbenzenes 1:3:1 ratio of abundance, methylnaphthalenes 2:1 ratio of
abundance) for the definitive identification of gasoline.
As evaporation occurs, compounds with lower boiling points evaporate at a faster rate than
those with higher boiling points, due to their high volatility. Therefore, the compounds eluting at
the beginning of the chromatogram, such as toluene and the C2-alkylbenzenes, will decrease in
abundance relatively quickly as evaporation progresses.
Figure 3-2. Chromatogram of unevaporated gasoline
However, as these compounds begin to completely evaporate, the compounds with higher boiling
points, such as the C3- and C4-alkylbenzenes and the methylnaphthalenes, will begin to decrease
in abundance as well, though at a slower rate than the more volatile compounds. Based on the
volatility and the boiling points of the compounds in gasoline, toluene will evaporate at the
0
2.5
2 4 6 8 10 12 14
No
rmali
zed
Ab
un
dan
ce
Retention Time (min)
Toluene
C2-alkyl benzenes
Methyl naphthalenes
C4-alkyl benzenes
C3-alkyl benzenes

42
fastest rate, followed by the C2-, C3-, and C4-alkylbenzenes and the methylnaphthalenes,
respectively.
At 25% evaporated by volume, shown in Figure 3-3, the abundance of the compounds with
boiling points less than 138.4 °C, including toluene and the C2-alkylbenzenes, have decreased
compared to the abundance of these compounds in the unevaporated gasoline sample (Figure 3-
2). Additionally, due to the higher boiling points and slower rates of evaporation for the C3-
alkylbenzenes, the C2- and C3-alkylbenzenes now have approximately the same abundance.
In fact, the overall abundance of the compounds in the chromatogram of 25% evaporated is
actually higher than the overall abundance of the compounds in the chromatogram of the
unevaporated gasoline (Figure 3-3A). This discrepancy in the overall abundance is due to a
dilution error introduced during sample preparation. Ten microliters of each evaporated gasoline
sample were used for analysis, regardless of the volume remaining after evaporation. This leads
to a preconcentration of the more evaporated gasoline samples, causing an increase in the
abundance of the compounds in the chromatograms of the more evaporated samples. To address
this preconcentration issue, a chromatographic adjustment was performed, which is explained
fully in Chapter 4, Section 4.3.1.2.4. The chromatograms for the four different evaporation levels
have all been adjusted (Figures 3-3B to 3-6).
At 50% evaporated by volume (Figure 3-4), the abundance of toluene has decreased further,
while the abundances of the C2- and C3-alkylbenzene peaks only slightly decreased. There are
also several compounds present at low abundance that elute before toluene and between toluene
and the C2-alkylbenzenes, with boiling points lower than that of the C2-alkylbenzenes (138.4
°C). At 75% evaporated by volume (Figure 3-5), the abundances of these compounds have
decreased and are almost completely evaporated. Toluene has also decreased in abundance

43
Figure 3-3. Chromatogram of gasoline evaporated to 25% by volume (A) with no dilution
adjustment and (B) with dilution adjustment
0
4
2 4 6 8 10 12 14
No
rmali
zed
Ab
un
dan
ce
Retention Time (min)
Toluene
C2-alkyl benzenes
Methyl naphthalenes
C4-alkyl benzenes
C3-alkyl benzenes
0
2.5
2 4 6 8 10 12 14
No
rmali
zed
Ab
un
dan
ce
Retention Time (min)
Toluene
C2-alkyl benzenes
Methyl naphthalenes
C4-alkyl benzenes
C3-alkyl benzenes
A
B

44
due to evaporation and is approximately the same height as the C2- and C3-alkylbenzene peaks.
At 90% evaporated by volume (Figure 3-6), all of the compounds eluting before the C2-
alkylbenzenes with boiling points below 138.4 °C, are completely evaporated, and the remaining
compounds are significantly lower in abundance.
Figure 3-4. Chromatogram of gasoline evaporated to 50% by volume
0
2.5
2 4 6 8 10 12 14
No
rmali
zed
Ab
un
dan
ce
Retention Time (min)
TolueneC2-alkyl
benzenes
Methyl naphthalenes
C4-alkyl benzenes
C3-alkyl benzenes

45
Figure 3-5. Chromatogram of gasoline evaporated to 75% by volume
0
2.5
2 4 6 8 10 12 14
No
rmali
zed
Ab
un
dan
ce
Retention Time (min)
Toluene
C2-alkyl benzenes
Methyl naphthalenes
C4-alkyl benzenes
C3-alkyl benzenes

46
Figure 3-6. (A) Chromatogram of gasoline evaporated to 90% by volume and (B) Zoomed in
chromatogram of gasoline evaporated to 90% by volume
0
2.5
2 4 6 8 10 12 14
No
rmali
zed
Ab
un
dan
ce
Retention Time (min)
Toluene
C2-alkyl benzenes
Methyl naphthalenes
C4-alkyl benzenes
C3-alkyl benzenes
A
0
0.1
2 4 6 8 10 12 14
No
rmali
zed
Ab
un
dan
ce
Retention Time (min)
Toluene
C2-alkyl benzenes
Methyl naphthalenes
C4-alkyl benzenes
C3-alkyl benzenes
B
47
3.3.2 Effect of Agitation Rate on Evaporation of Gasoline
Fraction remaining plots for representative compounds from each characteristic group of
compounds in gasoline were generated. The fraction remaining by mass was calculated by
dividing the measured mass after evaporation by the measured mass before evaporation for each
of the evaporation levels (Figures 3-2 – 3-6). The abundance of the compound in each
experimental replicate was then plotted against the calculated fraction remaining value for each
replicate. These plots were used to evaluate the data for each of the studies.
The plot of abundance versus fraction remaining for toluene at each agitation rate is shown in
Figure 3-7. The abundance of toluene decreases as the evaporation level increases, with full
evaporation observed at fraction remaining values of 0.06 – 0.11, which correspond to 90%
evaporated by volume. This trend is observed for all three agitation rates as well as the non-
agitated samples (Figure 3-8). The spread in the replicates on the y-axis is more noteworthy than
the spread on the x-axis as the y-axis indicates differences in the abundance of the compound for
specific fraction remaining values. The spread of the replicates on the x-axis does not provide
information about the precision of the data as it only generates a more accurate representation of
the individual fraction remaining for each experimental replicate. There is less precision with the
non-agitated samples at the higher evaporation levels (75% and 90% evaporated by volume),
indicating that agitation produces better reproducibility at the higher evaporation levels. In fact,
at 90% evaporated by volume, toluene is completely evaporated for the agitated samples, while
there is still some toluene present in the non-agitated samples. There are no noticeable
differences in the reproducibility of the data for the different agitation rates, indicating that, for
toluene, agitation is necessary to generate reproducible data at the higher evaporation levels.

48
Figure 3-7. Fraction remaining plots for toluene using agitation rates of (A) 109 ± 2 rpm, (B)
134 ± 2 rpm, and (C) 199 ± 2 rpm
0
45
0 0.2 0.4 0.6 0.8 1
Ab
un
dan
ce
Fraction Remaining (F)
A
0
45
0 0.2 0.4 0.6 0.8 1
Ab
un
dan
ce
Fraction Remaining (F)
B

49
Figure 3-7 (cont’d)
Figure 3-7. Fraction remaining plots for toluene using agitation rates of (A) 109 ± 2 rpm, (B)
134 ± 2 rpm, and (C) 199 ± 2 rpm
0
45
0 0.2 0.4 0.6 0.8 1
Ab
un
dan
ce
Fraction Remaining (F)
C

50
Figure 3-8. Fraction remaining plot for toluene using all three agitation rates and no agitation
The fraction remaining plot for a representative C2-alkylbenzene using all three agitation
rates and no agitation is shown in Figure 3-9. In general, the abundance of this C2-alkylbenzene
remains relatively constant for the 25% - 50% evaporated by volume for the agitated samples.
However, for the non-agitated samples, there is a marked decrease in abundance as the
evaporation level increases from 25% to 50% evaporated by volume. There is a decrease in the
abundance at 75% - 90% evaporated by volume, although complete evaporation does not occur.
This trend is observed for all three agitation rates as well as the non-agitated samples, although
the non-agitated samples appear to have a more linear decrease in abundance as the evaporation
level increases. The precision of the experimental replicates at 90% evaporated by volume is
poorer for two of the agitation rates as well as the non-agitated samples, indicating that there is
more variation at this particular high evaporation level. However, the precision for the high
0
45
0 0.2 0.4 0.6 0.8 1
Ab
un
dan
ce
Fraction Remaining (F)Low Medium High No Agitation

51
agitation rate is actually slightly higher at the 90% evaporated by volume level compared to the
75% evaporated by volume level. The non-agitated samples do appear to have the poorest
precision at the 90% evaporated by volume level, suggesting that agitation produces better
reproducibility at this evaporation level. These data indicate that agitation is necessary to
generate reproducible data at the higher evaporation levels.
Figure 3-9. Fraction remaining plot for p-xylene (a C2-alkylbenzene) using all three agitation
rates and no agitation
The fraction remaining plot for a representative C3-alkylbenzene using all three agitation rates
and no agitation is shown in Figure 3-10. In general, the abundance of this C3-alkylbenzene
remains relatively constant for the 25% - 50% evaporated by volume for the agitated samples,
while the abundance of the non-agitated samples appear to markedly decrease between these two
evaporation levels. However, there is a decrease in the abundance at 75% - 90% evaporated by
0
12
0 0.2 0.4 0.6 0.8 1
Ab
un
dan
ce
Fraction Remaining (F)Low Medium High No Agitation

52
volume, although complete evaporation does not occur. This trend is observed for all three
agitation rates as well as the non-agitated samples, although the non-agitated samples appear to
have a more linear decrease in abundance as the evaporation level increases. The precision of the
experimental replicates at 90% evaporated by volume is lowest for the low agitation rate,
indicating that a faster agitation rate is needed to produce reproducible data. The non-agitated
samples appear to have better precision at the 90% evaporated by volume level than that of the
low agitation rate. However, the medium and high agitation rates appear to have better precision
than the non-agitated samples, suggesting that faster agitation may be required to generate better
reproducibility for this particular compound. Additionally, the abundance of the non-agitated
samples is higher than the abundance of the agitated samples, which indicates that agitation
allows additional volatile molecules to evaporate compared to non-agitation.
Figure 3-10. Fraction remaining plot for 1,2,3-trimethylbenzene (a C3-alkylbenzene) using all
three agitation rates and no agitation
0
18
0 0.2 0.4 0.6 0.8 1
Ab
un
dan
ce
Fraction Remaining (F)Low Medium High No Agitation

53
The fraction remaining plot for a representative C4-alkylbenzene using all three agitation
rates and no agitation is shown in Figure 3-11. In general, the abundance of this C4-alkylbenzene
appears to remain relatively constant for 25% - 75% evaporated by volume with a slight decrease
in abundance at 90% evaporated by volume. This trend is observed for all three agitation rates as
well as the non-agitated samples. The precision of the experimental replicates at 90% evaporated
by volume is poorest for the low agitation rate, indicating that the medium and high agitation
rates are again necessary to produce reproducible data. For this compound, the non-agitated
samples appear to have poorer precision at the 50% evaporated by volume level, suggesting that
faster agitation may be required to generate better reproducibility for this particular compound at
every evaporation level.
Figure 3-11. Fraction remaining plot for 1,2,4,5-tetramethylbenzene (a C4-alkylbenzene) using
all three agitation rates and no agitation
0
2
0 0.2 0.4 0.6 0.8 1
Ab
un
dan
ce
Fraction Remaining (F)Low Medium High No Agitation

54
Overall, agitation appears to improve the reproducibility of the experimental replicates,
especially at 90% evaporated by volume. However, for the less volatile compounds, there is a
similar decrease in precision at 90% evaporated by volume for both the low agitation rate and the
non-agitation replicates. This indicates that a faster rate of agitation is necessary to generate
reproducible data for the more stable compounds at the highest evaporation level. The necessity
of a faster agitation rate is most likely caused by the increased variation in the evaporation
process at such high levels of evaporation.
3.3.3 Effect of Stir Bar Shape on Evaporation of Gasoline
Although the agitation rate study used a spinfin® stir bar, the effects of two other stir bars
were also evaluated (Figure 3-1). Each stir bar has a unique shape and purpose. The dimensions
of the stir bar itself can impact the agitation, and subsequently, the evaporation process. For
example, the micro stir bar is uniform in length and diameter, resulting in more continuous
agitation compared to the spinvane® stir bar, which has a triangular shape that could affect the
uniformity of the agitation. Due to the triangular shape of the spinvane® stir bar, the wider edge
of the stir bar could agitate a larger volume of the liquid than the narrow edge, resulting in
disproportionate stirring. As the micro stir bar is smaller than the spinfin® stir bar, it does not
interfere with the determination of the liquid volume at extremely high evaporation levels as the
spinfin® stir bar does. As the volume of the liquid remaining was used to determine when the
desired evaporation level was reached, the reading error was more prominent with the spinfin®
stir bar than with the micro stir bar because the micro stir bar has smaller dimensions than that of
the spinfin® stir bar. As a result, the fraction remaining by mass values were more variable for
the spinfin® stir bar compared to the values for the micro stir bar. Additionally, the spinfin® stir
bar is most effective for round bottom flasks as well as cylinders and test tubes. The spinvane®

55
stir bar is most useful in test tubes, micro vials, and centrifuge tubes with cone-shaped bottoms,
and the micro stir bar is ideal for stirring small volumes in small vessels, including vials and
tubes1. Based on the specific uses for each stir bar, the micro stir bar is likely to generate the
most reproducible data compared to the other stir bars.
The trends observed for both the spinvane® stir bar and micro stir bar are similar to those
shown in Figures 3-7 – 3-11 for the spinfin® stir bar. The plot of abundance versus fraction
remaining of toluene using all three stir bars at the low agitation rate is shown in Figure 3-12.
There is less precision with the spinvane® stir bar at the 25% - 75% evaporation levels,
indicating that a stir bar with a more uniform shape produces more reproducible data for toluene.
However, at 90% evaporated by volume, toluene is completely evaporated. These data indicate
that, for toluene, agitation with either the spinfin® or the micro stir bar is necessary to generate
reproducible data at all evaporation levels.
Figure 3-12. Fraction remaining plot for toluene using three different stir bars
0
40
0 0.2 0.4 0.6 0.8 1
Ab
un
dan
ce
Fraction Remaining (F)Spinfin Spinvane Micro
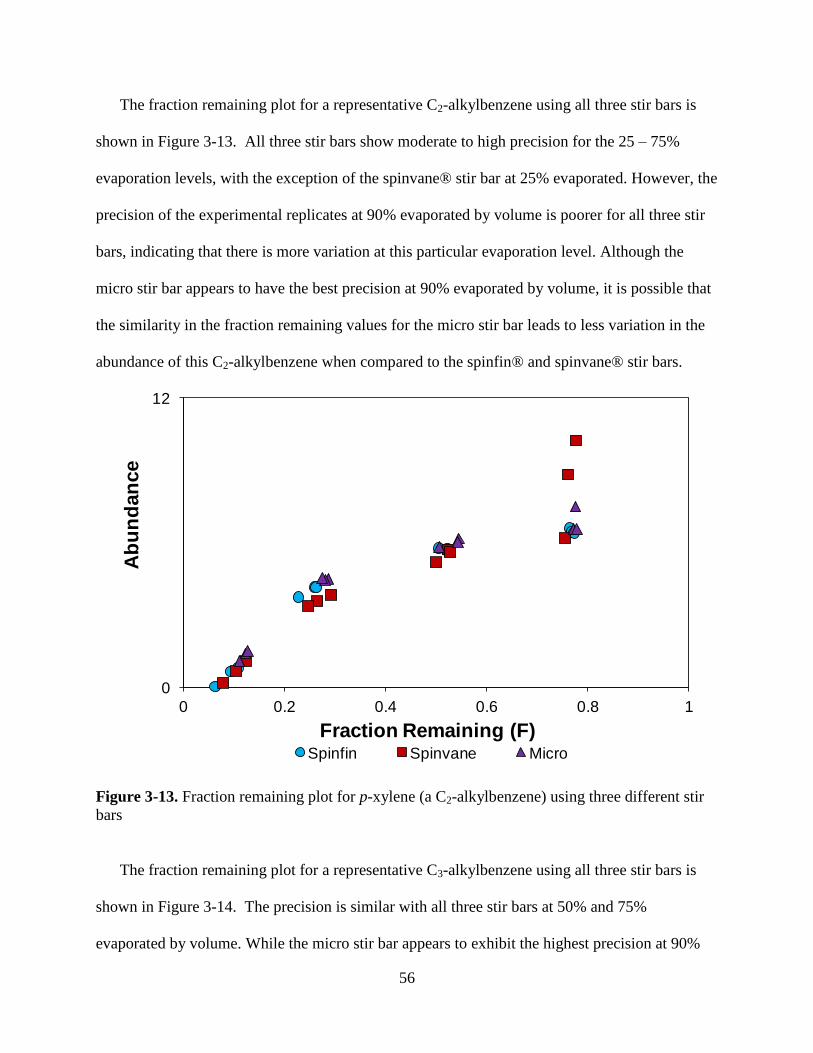
56
The fraction remaining plot for a representative C2-alkylbenzene using all three stir bars is
shown in Figure 3-13. All three stir bars show moderate to high precision for the 25 – 75%
evaporation levels, with the exception of the spinvane® stir bar at 25% evaporated. However, the
precision of the experimental replicates at 90% evaporated by volume is poorer for all three stir
bars, indicating that there is more variation at this particular evaporation level. Although the
micro stir bar appears to have the best precision at 90% evaporated by volume, it is possible that
the similarity in the fraction remaining values for the micro stir bar leads to less variation in the
abundance of this C2-alkylbenzene when compared to the spinfin® and spinvane® stir bars.
Figure 3-13. Fraction remaining plot for p-xylene (a C2-alkylbenzene) using three different stir
bars
The fraction remaining plot for a representative C3-alkylbenzene using all three stir bars is
shown in Figure 3-14. The precision is similar with all three stir bars at 50% and 75%
evaporated by volume. While the micro stir bar appears to exhibit the highest precision at 90%
0
12
0 0.2 0.4 0.6 0.8 1
Ab
un
dan
ce
Fraction Remaining (F)Spinfin Spinvane Micro

57
evaporated by volume, it is possible that the similarity in the fraction remaining values for the
micro stir bar leads to less variation in the abundance of this C3-alkylbenzene when compared to
the spinfin® and spinvane® stir bars.
The fraction remaining plot for a representative C4-alkylbenzene using all three stir bars is
shown in Figure 3-15. The precision is similar with all three stir bars at 50% and 75%
evaporated by volume. While the micro stir bar appears to exhibit the highest precision at
Figure 3-14. Fraction remaining plot for 1,2,3-trimethylbenzene (a C3-alkylbenzene) using three
different stir bars
90% evaporated by volume, it is possible that the similarity in the fraction remaining values for
the micro stir bar leads to less variation in the abundance of this C4-alkylbenzene when
compared to the spinfin® and spinvane® stir bars.
0
18
0 0.2 0.4 0.6 0.8 1
Ab
un
dan
ce
Fraction Remaining (F)Spinfin Spinvane Micro

58
Overall, the micro stir bar seems to generate the most reproducible data for every compound
at each evaporation level, although this could be due to similarity in the fraction remaining
values leading to less variation in abundance compared to the other two stir bars. This could
indicate that using the micro stir bar, which is designed to agitate small volumes, is ideal for
generating reproducible data for all of the compounds at all evaporation levels.
Figure 3-15. Fraction remaining plot for 1,2,4,5-tetramethylbenzene (a C4-alkylbenzene) using
three different stir bars
3.3.4 Effect of the Exposed Surface Area on Evaporation of Gasoline
The agitation rate and stir bar studies were all conducted in a graduated cylinder, which has
an exposed surface area of 1.13 cm2 available for evaporation of molecules out of the liquid into
the environment. In the absence of agitation, Equation 3-1 shows the time (t) necessary for
0
2
0 0.2 0.4 0.6 0.8 1
Ab
un
dan
ce
Fraction Remaining (F)Spinfin Spinvane Micro

59
molecules at the bottom of the graduated cylinder (Figure 3-16) to diffuse to the surface using a
typical diffusion coefficient (D) for the liquid phase.
Equation 3-1
For a distance (d) of 7.80 cm (which is the distance from the bottom of the cylinder to the 10 mL
mark), it would take 845 hours for the molecules at the bottom to diffuse (Equation 3-1). As a
result, the use of agitation and active evaporation is essential in order to decrease the time
necessary to evaporate gasoline. However, a molecule only needs to diffuse ~0.1 cm to reach the
surface of the liquid and evaporate in a Petri dish (Figure 3-16). As diffusion takes only 8.3 min,
agitation is not necessary (Equation 3-2).
Equation 3-2
The evaporation of gasoline in a Petri dish is also more realistic as it simulates the surface area
available for evaporation and the thickness of a liquid during a fire. The ignitable liquid is spread
out over the surface of the scene, resulting in a thin film of liquid. Therefore, the evaporation of
standards in a Petri dish is more comparable to the evaporation of an ignitable liquid occurring
during a fire compared to evaporation in a graduated cylinder.
The trends observed for this study are similar to those shown in Figures 3-7 – 3-11 for the
agitation rate study. The plot of abundance versus fraction remaining for toluene in a graduated
cylinder with and without agitation and in a Petri dish without agitation is shown in Figure 3-17.
It appears that the graduated cylinder without agitation samples have better precision than the
other two data sets at each evaporation level, although the Petri dish without agitation has similar
precision at the 50% evaporation level. If a curve was drawn through each set of samples, then

60
Figure 3-16. Illustration of dimensions of a graduated cylinder versus a Petri dish, each
containing 10 mL of gasoline
the Petri dish without agitation and the graduated cylinder with agitation samples actually appear
to be more accurate and reproducible. Additionally, the abundance of toluene at each evaporation
level is consistently higher for the graduated cylinder without agitation samples compared to the
other two data sets. At 90% evaporated by volume, toluene is completely evaporated for the Petri
dish without agitation and the graduated cylinder with agitation, while toluene is still present in
the graduated cylinder without agitation. This indicates that agitation in a graduated cylinder or
the use of a Petri dish without agitation result in the evaporation of additional volatile toluene
molecules compared to the graduated cylinder without agitation samples.
The fraction remaining plot for a representative C2-alkylbenzene is shown in Figure 3-18.
Although the precision of the experimental replicates at 90% evaporated by volume is lower
7.80 cm
1.2 cm
0.1 cm
6.5 cm
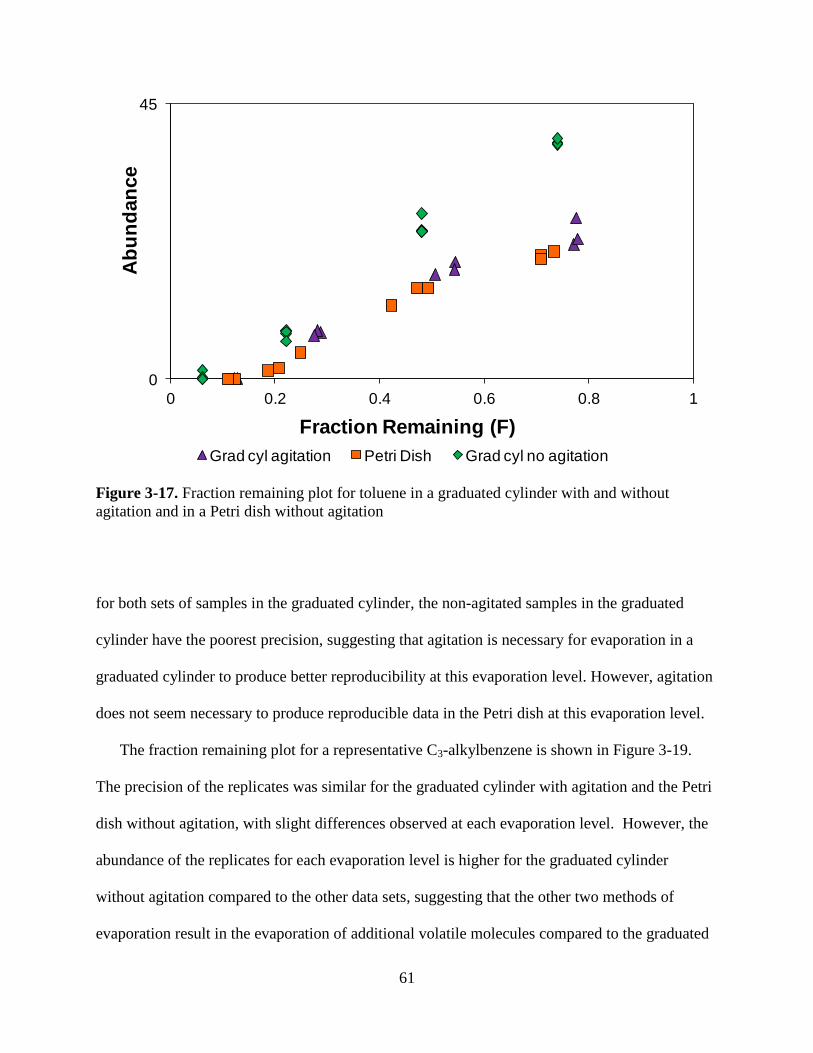
61
Figure 3-17. Fraction remaining plot for toluene in a graduated cylinder with and without
agitation and in a Petri dish without agitation
for both sets of samples in the graduated cylinder, the non-agitated samples in the graduated
cylinder have the poorest precision, suggesting that agitation is necessary for evaporation in a
graduated cylinder to produce better reproducibility at this evaporation level. However, agitation
does not seem necessary to produce reproducible data in the Petri dish at this evaporation level.
The fraction remaining plot for a representative C3-alkylbenzene is shown in Figure 3-19.
The precision of the replicates was similar for the graduated cylinder with agitation and the Petri
dish without agitation, with slight differences observed at each evaporation level. However, the
abundance of the replicates for each evaporation level is higher for the graduated cylinder
without agitation compared to the other data sets, suggesting that the other two methods of
evaporation result in the evaporation of additional volatile molecules compared to the graduated
0
45
0 0.2 0.4 0.6 0.8 1
Ab
un
dan
ce
Fraction Remaining (F)
Grad cyl agitation Petri Dish Grad cyl no agitation

62
Figure 3-18. Fraction remaining plot for p-xylene (a C2-alkylbenzene) in a graduated cylinder
with and without agitation and in a Petri dish without agitation
cylinder without agitation samples. Furthermore, the precision of the replicates for the graduated
cylinder without agitation decreases as the evaporation level increases.
The fraction remaining plot for a representative C4-alkylbenzene is shown in Figure 3-20.
Although the graduated cylinder without agitation data appear to have less precision at the 50%
and 75% evaporated by volume levels, the precision is similar to that of the other data sets for
the 25% and 90% evaporation levels. The similarity in precision at the high evaporation levels
indicates that the use of agitation or an increased surface area may not be necessary for more
stable compounds.
Overall, agitation appears to improve the reproducibility of the experimental replicates
evaporated in the graduated cylinder. Additionally, the Petri dish data appear to be comparable to
that of the agitated graduated cylinder data, suggesting that the evaporation processes occurring
0
12
0 0.2 0.4 0.6 0.8 1
Ab
un
dan
ce
Fraction Remaining (F)
Grad cyl agitation Petri Dish Grad cyl no agitation
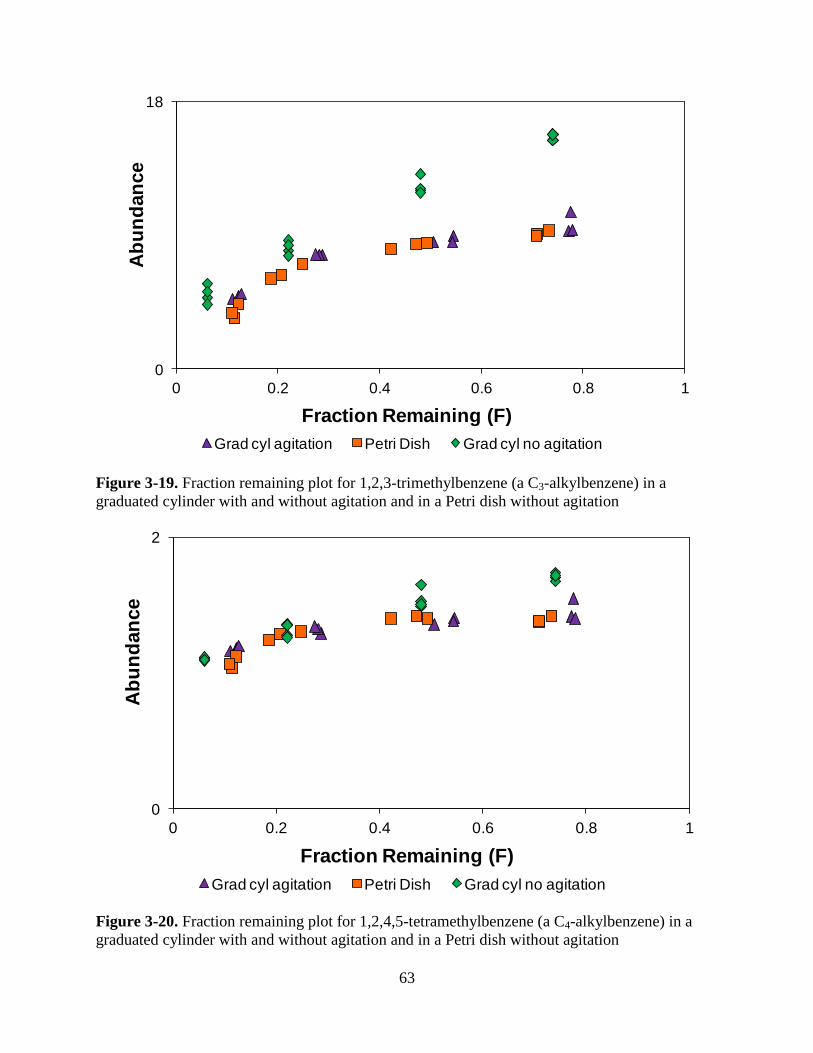
63
Figure 3-19. Fraction remaining plot for 1,2,3-trimethylbenzene (a C3-alkylbenzene) in a
graduated cylinder with and without agitation and in a Petri dish without agitation
Figure 3-20. Fraction remaining plot for 1,2,4,5-tetramethylbenzene (a C4-alkylbenzene) in a
graduated cylinder with and without agitation and in a Petri dish without agitation
0
18
0 0.2 0.4 0.6 0.8 1
Ab
un
dan
ce
Fraction Remaining (F)
Grad cyl agitation Petri Dish Grad cyl no agitation
0
2
0 0.2 0.4 0.6 0.8 1
Ab
un
dan
ce
Fraction Remaining (F)
Grad cyl agitation Petri Dish Grad cyl no agitation

64
in each vessel are similar.
Determining the various factors that affect the evaporation of gasoline may improve the
reproducibility of the evaporation process, which could lead to the development of a
standardized method for the evaporation of ignitable liquid standards. However, the factors
influencing the evaporation process will still exist and affect the evaporation of the standards.
Furthermore, there is no true standard for what the chromatogram of evaporated gasoline should
look like. As a result, another method for generating evaporated standards that is not affected by
these factors and can accurately simulate the evaporation process is needed.

65
REFERENCES

66
REFERENCES
1. Bel-Art Products, Inc. Scienceware® Spinbar® Magnetic Stirring Bar Guide. Wayne, NJ:
Bel-Art Products, 2012. http://www.belart.com (pdf accessed July 23, 2015).
2. ASTM International. ASTM E1618-11: standard test method for ignitable liquid residues
in extracts from fire debris samples by gas chromatography-mass spectrometry. Annual
book of ASTM standards, Vol 14.02. West Conshohocken, PA: ASTM International,
2011.

67
Chapter 4: Mathematical Modeling of Evaporated Ignitable Liquid Standards
4.1 Introduction
As the evaporation process is affected by various factors, a method for generating evaporated
standards that is unaffected by these factors is needed. A mathematical model previously
developed by McIlroy et al. based on first-order kinetics has the potential for forensic
applications1. This model was used to predict the fraction remaining of the individual compounds
of three petroleum distillates and gasoline, which was plotted versus retention index to generate
chromatograms of the liquids at four different evaporation levels. The modeled chromatograms
were then compared to the corresponding chromatograms derived experimentally, using Pearson
product moment-correlation (PPMC) coefficients. This chapter will focus primarily on the
application of the model to kerosene and gasoline. Kerosene contains compounds that include a
wide range of retention indices, making kerosene less volatile than gasoline. Gasoline is highly
volatile and is commonly encountered in fire debris analysis.
4.2 Materials and Methods
4.2.1 Sample Collection, Evaporation, and Preparation
Two of the petroleum distillate standards were commercial ignitable liquids obtained from
local stores. These petroleum distillate standards were lamp oil (Lamplight® Medallion®,
Lamplight Farms, Inc., Menomenee Falls, WI) and torch fuel (Tiki®, Lamplight Farms, Inc.,
Menomenee Falls, WI). The third petroleum distillate standard, kerosene, and gasoline were
collected from gas stations in the East Lansing, MI area.
A ten-milliliter graduated cylinder, containing a spinfin® stir bar and covered with a piece of
aluminum foil, was weighed in an analytical balance (Mettler H80, Serial no. 60403), and the
mass recorded. Ten milliliters of ignitable liquid were poured into the graduated cylinder, and the

68
new mass was recorded before the cylinder was placed in the center of a stir plate (Thermo
Scientific, model S130815) in the fume hood. Each liquid was actively evaporated using house
nitrogen and agitated at 109.3 ± 1.5 rpm. Each liquid was individually evaporated to 26%, 52%,
78%, and 94% by volume, which corresponds to 7.5, 5.0, 2.5, and 1.0 milliliters, respectively.
Once the desired volume was reached, the graduated cylinder was removed from the fume hood
and the remaining liquid was poured into a pre-weighed vial and capped. The vial was re-
weighed, and the new mass recorded. Finally, the foil was replaced on top of the cylinder, and
the cylinder was reweighed to determine the mass of residual ignitable liquid present. Based on
these weighings, the mass of the ignitable liquid evaporated was also determined and recorded.
Although the liquids were evaporated by volume, the mass loss was determined to increase the
accuracy of the experimental evaporated liquids. The cylinder and stir bar were then thoroughly
rinsed with dichloromethane (CH2Cl2) (HPLC/UHPLC grade, J.T. Baker, Avantor Performance
Materials, Inc., Center Valley, PA) before being left to air dry. This process was repeated for
each liquid, resulting in three experimental replicates per evaporation level. Ten microliters of
each evaporated liquid were transferred into a two-milliliter volumetric flask. Forty microliters
of the internal standard solution (0.1162 g octadecane (Sigma Chemical Company, St. Louis,
MO) in 50 mL DCM) were then added before the sample was diluted with DCM to the calibrated
mark. The diluted liquid was poured into a labeled vial and analyzed by gas chromatography-
mass spectrometry (GC-MS).
4.2.2 GC-MS Analysis
All ignitable liquids, unevaporated and evaporated, were analyzed using an Agilent 6890N
gas chromatograph(GC) coupled to a 5975 mass spectrometer detector (MSD) with an Agilent
7683B automatic liquid sampler (Agilent Technologies, Palo Alto, CA). A 1 µL volume of each

69
liquid was injected in pulsed splitless mode into the injection port, which was heated to 250 °C.
Ultra high-purity helium (Airgas Great Lakes, Independence, OH) was used as the carrier gas
with a nominal flow rate of 1 mL/min. A DB-1 column, which has a 100%
poly(dimethylsiloxane) stationary phase (30 m × 0.25 mm × 0.25 µm) was used with an oven
temperature program of: 40 °C for 3 min, 10 °C/min to 280 °C, with final hold for 4 min. A
transfer line temperature of 280 °C was also used. The mass spectrometer used an electron
ionization ion source (70 eV, 230 °C) and a quadrupole mass analyzer (150 °C), with a mass
scan range of 50 – 550 amu and a scan rate of 2.91 scans/s.
4.2.3 Data Analysis
The total ion chromatograms (TICs) were exported from the ChemStation software (version
E.01.01.335, Agilent Technologies) to Microsoft Excel 2007 (Microsoft Corporation, Redmond,
WA). The data were normalized to the maximum peak height of the internal standard,
octadecane.
4.2.3.1 Correlation Optimized Warping (COW) Alignment
The normalized data were retention-time aligned to the chromatogram of the corresponding
unevaporated liquid using a correlation optimized warping (COW) algorithm (Version 10.2, The
Unscrambler® X, CAMO Software AS, Woodbridge, NJ) (discussed in Chapter 2, Section 2.2).
Most of the chromatograms were acquired over a short time period and, due to their similarity in
alignment, were all aligned using a warp of 5 data points and a segment size of 50 data points.
However, other chromatograms were acquired after routine column maintenance and had more
variability in retention times. These chromatograms required a two-step procedure to align them
to the target chromatogram. Of these chromatograms, the majority started with a warp of 20 data
points and a segment size of 75 data points, followed by a warp of 5 data points and segment size

70
of 50 data points, while the last six chromatograms started with a warp of 30 data points and a
segment size of 75 data points, followed by a warp of 5 data points and segment size of 50 data
points. This realignment is illustrated in Figure 4-1.
Figure 4-1. (A) Peak misalignment between unevaporated and evaporated chromatograms of
kerosene and (B) Peak alignment between same two chromatograms following an initial COW
alignment with a warp of 20 data points and a segment size of 75 data points and a second
alignment with a warp of 5 data points and a segment size of 50 data points
4.2.3.2 Removal of the Internal Standard, Octadecane (C18)
0
5
16.2 16.3 16.4 16.5
Ab
un
da
nc
e
Retention Time (min)
0
5
16.2 16.3 16.4 16.5
Ab
un
da
nc
e
Retention Time (min)
A
B
71
The next step in the modification of the model involved the removal of the peak
corresponding to the internal standard used for normalization. When PPMC coefficients were
initially calculated, the chromatograms consisted of retention indices 800 – 2200, including the
internal standard with a retention index of 1800. The resulting PPMC coefficients showed a
moderate to strong correlation at the 94% evaporation level.
As octadecane was added as the internal standard after evaporation was completed, the same
volume and concentration of internal standard was used for each unevaporated and evaporated
liquid. However, the model attempted to predict the behavior of octadecane as though it was
undergoing evaporation. According to the fraction remaining curves for kerosene at all four
evaporation levels (Figure 4-2), octadecane is unaffected by evaporation, even at 94%
evaporated. Therefore, when the abundance of octadecane in the chromatogram of unevaporated
kerosene was multiplied by the fraction remaining for octadecane, the abundance of the internal
standard peak in the theoretical chromatograms was over-predicted by the model. As the primary
interest for the model application was to assess the model’s ability to predict the evaporation of
each ignitable liquid, zeroes were entered into the chromatographic data for the compounds in
the RI range 1780 – 1810. The PPMC coefficients would then account for differences in the
more volatile compounds rather than the less volatile compounds. After removing the C18 peak,
the PPMC coefficients for all three petroleum distillates improved, especially at 94% evaporated
by volume, resulting in strong correlation for all three liquids.
4.2.3.3 Area Adjustment of Aligned Data to Address Sample Dilution Error
The final issue encountered during the application of this model involved a sample dilution
error for the experimentally derived data. During preparation, 10 µL of each evaporated liquid
are diluted in dichloromethane. By using the same volume of liquid for analysis, regardless of

72
the original volume of the evaporated liquid, the more evaporated liquids are preconcentrated,
compared to the less evaporated liquids. For example, in the 94% evaporated liquid, only 1 mL
of liquid remains and 10 µL of this remaining liquid is diluted, while for the 26% evaporated
liquid, 7.5 mL of liquid remains but only 10 µL are used for analysis. As the evaporation level
increases, the preconcentration of the diluted sample increases as well. This preconcentration
resulted in the presence of compounds whose abundances were inflated due to the increased
concentration. As a result, the experimental chromatograms contained more compounds than the
theoretical chromatograms (illustrated in Figure 3-3). To address this issue, an area adjustment of
the chromatographic data for the evaporated liquids was performed, which used the fraction
remaining of the compound in the evaporated liquid (Fe) and the ratio of the evaporated and
unevaporated areas (Ae and Au, respectively) to adjust for the dilution error, shown in Equation
4-1,
Equation 4-1
where D0 and Df are the initial abundance of the data point and the adjusted abundance of the
data point, respectively. This area adjustment did correct the experimental chromatograms so that
the data were on the same order of magnitude as the theoretical chromatograms. However, the
adjustment could not eliminate the compounds artificially inflated due to the evaporation and
dilution error. Although this dilution/preconcentration error does affect the magnitude of the
abundance of the compounds, it does not invalidate the overall conclusions of this research.
4.2.4 Modifications of the Theoretical Model
4.2.4.1 Determination of Experimental Fraction Remaining
Retention indices were calculated for each liquid, based on the maximum peak height for
each n-alkane in the aligned chromatograms. The model was originally developed as a function

73
of time with evaporation being predicted at specific times, rather than at different levels of
evaporation. However, in order to determine the forensic applications of the model, the model
needed to be modified until it was based on a function of fraction remaining, rather than time. To
successfully modify the model, the experimental fraction remaining by mass was determined for
each experimental replicate at all four evaporation levels by dividing the final mass by the initial
mass. The theoretical time for evaporation was then systematically adjusted by changing the time
necessary for evaporation until the theoretical fraction remaining was similar to the experimental
fraction remaining.
The fraction remaining was originally determined based on the signal, which was determined
by dividing the signal in the chromatogram of the evaporated liquid by the signal in the
chromatogram of the unevaporated liquid. As the experimentally derived chromatograms were
evaporated by volume, the fraction remaining for the theoretical chromatograms was determined
by the experimental fraction remaining by volume. However, the model was more accurate when
the fraction remaining was determined by mass because the individual mass lost for each
replicate caused by variation in the evaporation process was addressed. Although differences in
the fraction remaining were observed when determined by mass, they were more prominent
when determined by volume. For example, three experimental replicates of gasoline at 94%
evaporated gave fraction remaining by mass values of 0.06, 0.09, and 0.10. However, the
fraction remaining by volume was assumed to be 0.06 for all three replicates, as it was the
nominal fraction remaining value for 90% evaporated. By accounting for the mass lost for each
replicate, variation in the evaporation process can be addressed. Therefore, the chromatograms
generated by the model were based on the mass, rather than the volume of the remaining

74
ignitable liquid. As there were three experimental replicates for each evaporation level, the
average fraction remaining of the three replicates was used in the model.
Both the original and modified mathematical models used the normalized, unevaporated
chromatograms of each of the ignitable liquid standards to calculate the retention index (I) and
evaporation rate constant (k) for all of the compounds in each liquid between octane (C8) and
docosane (C22), shown in Equation 4-2,
Equation 4-2
where mI and mT are the slopes with respect to retention index and temperature, respectively, T
is the temperature, and bT is the intercept with respect to temperature. The rate constants were
then used to calculate the fraction remaining for each individual compound in the liquid
(Equation 1-4). Fraction remaining curves were generated by plotting the individual fraction
remaining for each compound against retention index. Changing the time necessary for
evaporation will result in a different curve. Therefore, each time, which results in a specific
evaporation level, will generate its own unique fraction remaining curve. The fraction remaining
curve was then multiplied by the chromatogram of the unevaporated ignitable liquid to generate
a theoretical chromatogram at a certain evaporation level.
The normalized experimental chromatogram for each evaporated sample was compared to the
corresponding chromatogram generated by the model using Pearson product moment-correlation
(PPMC) coefficients (Equation 2-3). The model is able to determine the rate constants for each
compound in the liquid, generating theoretical chromatograms that are essentially the true
“standard” for the evaporated liquid at different evaporation levels. Therefore, the PPMC

75
coefficients can assess how accurately the experimentally derived chromatograms compare to the
“true standards”.
4.3 Results and Discussion
4.3.1 Petroleum Distillates
4.3.1.1 Chemical Composition and Evaporation of Kerosene
The unevaporated kerosene has a unimodal distribution of normal alkanes (Figure 4-1A),
ranging from nonane to heptadecane. The less abundant compounds consist of branched alkanes,
aromatics, and polycyclic hydrocarbons. As there are so many compounds in kerosene, the
chromatogram cannot be baseline resolved. According to ASTM standard E16181, kerosene is
classified as a “petroleum distillate” due to the dominance of the n-alkanes and as “heavy” based
on the range of n-alkanes present (i.e. C8 – C20), as shown in Table 1-1.
Fraction remaining curves corresponding to the different evaporation levels were generated
for kerosene, shown in Figure 4-1B. The fraction remaining is based on the rate constant and
time. Therefore, changing the length of time required for evaporation provides a different
fraction remaining curve. As the evaporation level increases, the range of compounds that have
completely evaporated also increases. The fraction remaining curve for kerosene at 26%
evaporated shows that all compounds from RI 800 – 900 are completely evaporated, while the
compounds from RI 900 – 1300 experience evaporation to different extents. The compounds
after RI 1300 do not evaporate at all. By 52% evaporated, all compounds from RI 800 – 1050 are
completely evaporated, compounds from RI 1050 – 1600 evaporate to different extents, and
compounds after RI 1600 are unaffected by evaporation. The curve for 78% evaporated shows
the complete evaporation of all compounds in the RI range of 800 – 1200, with the compounds
from RI 1200 – 1700 evaporated to different extents. At 90% evaporated, all of the compounds

76
Figure 4-2. (A) Chromatogram of unevaporated kerosene and (B) Fraction remaining curves for
kerosene at 26%, 52%, 78%, and 94% evaporated
0
2.2
800 1000 1200 1400 1600 1800 2000 2200
No
rmalized
Ab
un
dan
ce
Retention Index
C10
C16
C15
C14
C13C12
C11
C17
C9
0
1
800 1000 1200 1400 1600 1800 2000 2200
Fra
cti
on
Rem
ain
ing
(F
R)
Retention Index
FR at 26%
FR at 52%
FR at 78%
FR at 94%
B
A

77
from RI 800 – 1350 are completely evaporated, and all compounds from RI 1350 – 1800 are
partially affected by evaporation. Only those compounds after RI 1800 do not evaporate.
Although the same general evaporation trends are observed for the other two petroleum
distillates, the fraction remaining curves differ slightly for each liquid due to differences in
chemical composition.
The evaporation of kerosene predicted by the fraction remaining curves is consistent with the
evaporation observed in the experimental chromatograms at each of the four evaporation levels
(Figures 4-3 – 4-6). Therefore, only the evaporation observed in the 26% evaporated
chromatogram will be discussed in detail. At 26% evaporated by volume, shown in Figure 4-3,
the more volatile compounds, with boiling points less than 151 °C, are completely evaporated,
from RI 800 – 900. Only a few extremely low abundant compounds eluting before C10 are still
present. The abundances of the compounds between C9 and C13 (RI range 900 – 1300), with
boiling points ranging from 151 °C – 234 °C, also show signs of evaporation, with the loss in
abundance decreasing as the boiling point of the compound increases.
The chromatograms generated by the model are theoretically correct and avoid variability
introduced during the experimental evaporation process. Therefore, this model provides a
potential method for generating evaporated standards. Furthermore, evaporating kerosene to
different evaporation levels for a reference collection is extremely time-consuming. In this
research, the evaporation process took approximately three days for 26% evaporated kerosene
and one month for 94% evaporated kerosene. The same trend in evaporation was observed in the
torch fuel and lamp oil standards analyzed in this research (Appendices B and C, respectively).
As a result, this mathematical model will address the need for a quicker method for generating
evaporated standards for comparison to fire debris samples.

78
Figure 4-3. Overlay of experimental and theoretical chromatograms of kerosene evaporated 26%
by volume
0
2.2
800 1000 1200 1400 1600 1800 2000 2200
No
rmalized
Ab
un
dan
ce
Retention Index
Experimental
Theoretical
C10
C16
C15
C14
C13
C12
C11
C17

79
Figure 4-4. Overlay of experimental and theoretical chromatograms of kerosene evaporated 52%
by volume
0
2.2
800 1000 1200 1400 1600 1800 2000 2200
No
rmalized
Ab
un
dan
ce
Retention Index
Experimental
Theoretical
C11
C17
C16
C15
C14
C13
C12

80
Figure 4-5. Overlay of experimental and theoretical chromatograms of kerosene evaporated 78%
by volume
0
2.2
800 1000 1200 1400 1600 1800 2000 2200
No
rmalized
Ab
un
dan
ce
Retention Index
Experimental
Theoretical
C13
C17
C16
C15C14
C12

81
Figure 4-6. Overlay of experimental and theoretical chromatograms of kerosene evaporated 94%
by volume
4.3.1.2 Application of Mathematical Model for Predicting the Fraction Remaining
Once the model was modified (Sections 4.2.3 and 4.2.4), PPMC coefficients were
recalculated. The mean PPMC coefficients for the different evaporation levels of kerosene
ranged from 0.9942 ± 0.0005 to 0.954 ± 0.002 (Table 4-1). A strong correlation between the
theoretical and experimental chromatograms of kerosene at each evaporation level was observed.
However, the correlation between the experimental and theoretical chromatograms decreased
slightly as the evaporation level increased, which could be due to variation in the evaporation of
the experimental replicates at the higher evaporation levels or to the additional compounds
0
2.2
800 1000 1200 1400 1600 1800 2000 2200
No
rmalized
Ab
un
dan
ce
Retention Index
Experimental
Theoretical
C14
C17
C16
C15

82
present in the experimental chromatograms as a result of the dilution error discussed in Section
4.2.3.3.
Table 4-1. Mean PPMC coefficients for petroleum distillates
Mean PPMC Coefficient ± Standard Deviation (n = 9)
% Evaporated by Volume Kerosene Lamp Oil Torch Fuel
26 0.9942 ± 0.0005 0.9979 ± 0.0006 0.987 ± 0.003
52 0.9881 ± 0.0019* 0.9900 ± 0.0006 0.991 ± 0.004
78 0.976 ± 0.004 0.966 ± 0.003 0.988 ± 0.004
94 0.954 ± 0.002 0.88 ± 0.03 0.973 ± 0.005
*n = 12
This same trend was also observed in lamp oil, with strong correlation being observed for all
four evaporation levels and the PPMC coefficients decreasing slightly from 0.9979 ± 0.0006 to
0.88 ± 0.03 (Table 4-3) as the evaporation level increased. After model modification, the mean
PPMC coefficient for the 94% evaporated lamp oil was only 0.88, which, while still indicating
strong correlation, is substantially lower than the PPMC coefficients for the other petroleum
distillate standards at this same evaporation level. This unexpected decrease in correlation is due
to a lower correlation between the theoretical chromatogram and one of the three experimental
replicates. When the chromatograms were visually examined, the abundances of the two most
dominant peaks (C11 and C12) in lamp oil were lower in one replicate compared to the other two
As a result, this one replicate was lowest in abundance compared to the abundance of the
theoretical. The abundances of the rest of the compounds were actually higher in this particular

83
replicate compared to the other two, shown in Figure 4-7, with the third replicate now being
highest in abundance compared to the abundance of the theoretical.
Figure 4-7. Overlaid theoretical and experimental chromatograms of Medallion lamp oil 94%
evaporated by volume with the third replicate shown in purple and the theoretical in red; left
inset shows region of the third replicate with lowest abundance and right inset shows region of
the third replicate with highest abundance
These differences in abundance can be partially explained by the differences in the fraction
remaining of the third replicate compared to the other two replicates. The first two replicates had
fraction remaining values of 0.10 and 0.09 by mass, while the third replicate had a fraction
remaining value of 0.07 by mass. Differences in the mass fraction remaining are more influential
at the higher evaporation levels due to error in reading the volume on the graduated cylinder and
the small volumes remaining at such high evaporation levels. Slight differences in the volume of
0
0.5
800 1300 1800
No
rmalized
Ab
un
dan
ce
Retention Index

84
the remaining liquid result in slight differences in the mass lost. The differences in abundance
could also be due to different rates of evaporation. However, at small volumes, these differences
are more influential than at larger volumes. Therefore, although the differences are very small,
the variation in the chromatograms caused by these slight differences cause a loss in correlation
between the theoretical and experimental chromatograms.
In order to examine this issue, a theoretical chromatogram for 94% evaporated lamp oil was
generated for each replicate based on the individual experimental fraction remaining of that
replicate, rather than the average fraction remaining. By using the actual fraction remaining for
each experimental replicate, the differences in evaporation and the fraction remaining by mass
can be addressed. Although the correlation at 94% evaporated is not as high for lamp oil as it is
for kerosene, there is still a strong correlation at all four evaporation levels for lamp oil (Table 4-
1).
Strong correlation was also observed for all four evaporation levels of torch fuel. Initially,
torch fuel did not appear to follow the same trend as kerosene and lamp oil. The other two
petroleum distillates exhibited a substantial decrease in correlation as the evaporation level
increased, e.g. from 0.99 for 26% evaporated to 0.88 for 94% evaporated lamp oil. However, the
mean PPMC coefficients for torch fuel only ranged from 0.987 ± 0.003 for 26% evaporated by
volume to 0.973 ± 0.005 for 94% evaporated by volume. In fact, the PPMC coefficient for the
comparison of the experimental and theoretical 52% evaporated (0.991) was actually higher than
for the comparison of the experimental and theoretical 26% evaporated (0.987) torch fuel,
although the coefficients were not statistically different. Upon performing t-tests comparing the
mean PPMC coefficients for all four evaporation levels, the only statistical difference among the
PPMC coefficients was between the 52% and 94% evaporated liquids. As there are no statistical

85
differences among the PPMC coefficients, with the exception of the 52% and 94% evaporated
liquids, it is impossible to determine if the trend is present in the torch fuel standard.
Additionally, in general, the standard deviation was small for the replicates of all three petroleum
distillates, indicating good precision among the experimental replicates.
The trend observed in both kerosene and lamp oil with the PPMC coefficients decreasing as
the evaporation level increased indicates that the correlation between the experimental and
theoretical chromatograms decreased as the evaporation level increased. There are two potential
explanations for this trend. First, the decrease could be due to differences in the evaporation
process between the model (developed based on passive evaporation of a thin film) and the
experiment (active evaporation under nitrogen in graduated cylinder).
When the ignitable liquid is present as a thin film, the entire surface of the liquid is exposed to
the environment, allowing the more volatile compounds spread throughout the liquid to
evaporate more quickly. However, during active evaporation, the liquid is in a graduated cylinder
and there is less surface area available for evaporation, as discussed in Chapter 3, Section 3.3.4.
The nitrogen blowing onto the liquid combined with the agitation allow the more volatile
compounds present near the bottom of the cylinder to diffuse to the surface where they can
evaporate into the environment. As more of the compounds within each liquid are evaporated by
the higher evaporation levels, the differences between the passive and active evaporation is more
pronounced, resulting in lower PPMC coefficients. However, due to the similarities in
reproducibility and precision of the samples evaporated in a graduated cylinder and a Petri dish
(Chapter 3, Section 3.3.4), this potential error is unlikely to be the primary source of error.
Second, the dilution error in the sample preparation contributed to this decrease in correlation
as evaporation increased. Due to the preconcentration of the evaporated samples, especially at

86
the higher evaporation levels, additional compounds were observed in the experimental
chromatograms compared to the corresponding theoretical chromatograms. The dilution error
caused compounds that would normally be present below the threshold of detection to reach a
concentration level detectable by GC-MS. These compounds were especially noticeable at the
higher evaporation levels due to the small volumes involved. As the theoretical chromatograms
were based on the unevaporated chromatogram, these additional compounds were not present in
the theoretical chromatograms. This discrepancy in the presence of these compounds due to the
dilution error is the most likely cause of the slight decrease in correlation as the evaporation level
increased.
Despite these issues and the slight decrease in PPMC coefficients, there is still a strong
correlation between the theoretical and experimental chromatograms even at the highest
evaporation level. This indicates that the model is able to accurately predict the fraction
remaining of different compounds in the petroleum distillates, regardless of the evaporation
level. Based on these results, the model is able to accurately predict the evaporation of multiple
petroleum distillates and not just diesel, the liquid used for the initial development of the model1.
4.3.2 Gasoline
4.3.2.1 Chemical Composition and Evaporation of Gasoline
The chromatogram of unevaporated gasoline, shown in Figure 4-8A, contains a characteristic
pattern of abundant aromatic compounds, which typically consists of toluene, C2-alkylbenzenes
including ethylbenzene, p-xylene, and o-xylene, C3-alkylbenzenes including propylbenzene and
1,2,4-trimethylbenzene, and two methylnaphthalenes (1-methylnaphthalene and 2-
methylnaphthalene). The composition of the gasoline standard used in this research was in
accordance with ASTM guidelines2 (Table 1-1).

87
Fraction remaining curves corresponding to the different evaporation levels were generated
for gasoline (Figure 4-8B). As the evaporation level increases, the range of compounds that have
completely evaporated also increases. The evaporation of the compounds is discussed in detail
later in the chapter.
At 26% evaporated by volume (Figure 4-9), the abundance of toluene and the C2-
alkylbenzenes has decreased compared to their abundance in the unevaporated chromatogram. In
contrast, the abundance of the C3-alkylbenzenes has increased so that now, the C2- and C3-
alkylbenzenes have approximately the same abundance. At 52% evaporated by volume (Figure
4-10), the abundance of toluene has decreased, while the abundances of the C2- and C3-
alkylbenzene peaks only decreased. There are also several low abundance compounds present
before toluene and between toluene and the C2-alkylbenzenes. These compounds, including
toluene, have lower boiling points than the C2-alkylbenzenes, so they will evaporate before the
alkylbenzenes. At 78% evaporated by volume (Figure 4-11), the abundances of the compounds
eluting before and after toluene have significantly decreased and are almost completely
evaporated. Toluene has also decreased in abundance due to evaporation and is approximately
the same height as the C2- and C3-alkylbenzene peaks. At 94% evaporated by volume (Figure 4-
12), all of the compounds eluting before RI 800 are completely evaporated, and the remaining
compounds are significantly lower in abundance.
As with the petroleum distillates, the model could provide a more accurate representation of
the evaporation with no variability due to various factors that affect the evaporation process.
However, all of the compounds present in gasoline have boiling points below 253.5 °C and are
greatly affected by evaporation, whereas most petroleum distillates contain compounds that are
less volatile. As a result, gasoline is more affected by evaporation due to the volatile nature of

88
Figure 4-8. (A) Chromatogram of unevaporated gasoline and (B) Fraction remaining curves for
gasoline at 26%, 52%, 78%, and 94% evaporated
0
6
650 850 1050 1250 1450
No
rmalized
Ab
un
dan
ce
Retention Index
Toluene
Methyl naphthalenes
C2-alkyl benzenes
C3-alkyl benzenes
C4-alkyl benzenes
0
1
650 850 1050 1250 1450 1650 1850
Fra
cti
on
Rem
ain
ing
(F
R)
Retention Index
FR at 26%
FR at 52%
FR at 78%
FR at 94%
B
A

89
the compounds present. Although gasoline evaporates more quickly than the petroleum
distillates, ranging from approximately five minutes for 26% evaporated to three hours for 94%
evaporated, it is still time-consuming to generate evaporated standards at every evaporation
level.
Figure 4-9. Chromatogram of gasoline evaporated to 26% by volume
0
4.2
650 850 1050 1250 1450
No
rmalized
Ab
un
dan
ce
Retention Index
Experimental
Theoretical
Toluene
C2-alkyl benzenes C3-alkyl
benzenes
Methyl naphthalenes
C4-alkyl benzenes

90
Figure 4-10. Chromatogram of gasoline evaporated to 52% by volume
0
4.2
650 850 1050 1250 1450
No
rmalized
Ab
un
dan
ce
Retention Index
Experimental
Theoretical
Toluene
C2-alkyl benzenes
C3-alkyl benzenes
Methyl naphthalenes
C4-alkyl benzenes

91
Figure 4-11. Chromatogram of gasoline evaporated to 78% by volume
0
4.2
650 850 1050 1250 1450
No
rmalized
Ab
un
dan
ce
Retention Index
Experimental
Theoretical
Toluene
C2-alkyl benzenes
C3-alkyl benzenes
Methyl naphthalenes
C4-alkyl benzenes

92
Figure 4-12. Chromatogram of gasoline evaporated to 94% by volume
4.3.2.2 Application of Mathematical Model for Predicting Fraction Remaining
The modified model was applied to the normalized, aligned chromatogram of unevaporated
gasoline. The experimental chromatograms compared to the corresponding theoretical
chromatograms at each evaporation level for gasoline are shown in Figures 4-9 – 4-12. PPMC
coefficients were calculated to assess the correlation between the theoretical and experimental
chromatograms (Table 4-2). The trend that was present in the petroleum distillate standards, with
the correlation decreasing in relation to the increase in evaporation level, is also observed in
gasoline. However, the decrease is substantially more pronounced with the mean PPMC
0
4.2
650 850 1050 1250 1450
No
rmalized
Ab
un
dan
ce
Retention Index
Experimental
Theoretical
C2-alkyl benzenes
C3-alkyl benzenes
Methyl naphthalenes
C4-alkyl benzenes

93
coefficients decreasing from a strong correlation of 0.9620 ± 0.0014 for 26% evaporated to a
moderate correlation of 0.535 ± 0.015 for 94% evaporated.
Table 4-2. Mean PPMC coefficients for gasoline
% Evaporated by Volume Mean PPMC Coefficient ± Standard Deviation* (n = 9)
26 0.9620 ± 0.0014
52 0.779 ± 0.004
78 0.61 ± 0.03
94 0.535 ± 0.015
By visually assessing the overlaid experimental and theoretical chromatograms (Figures 4-9 –
4-12), noticeable differences between the experimental and theoretical chromatograms are
visible, especially in the region between retention indices 600 – 900 that contains toluene and the
C2-alkylbenzenes. Based on the chromatogram of unevaporated gasoline, the model predicted
that these compounds should be much lower in abundance at each evaporation level than is
actually observed in the experimental chromatogram, with the model over-predicting the
evaporation of these compounds.
To understand the origin of this error, the number of compounds present in gasoline that elute
prior to toluene must be determined. Unleaded gasoline, which was used as the standard for the
gasoline evaporations, contains numerous compounds that evaporate at a faster rate than toluene
and the alkylbenzenes. Unfortunately, due to the GC-MS method used, the compounds are
undetected because the GC oven temperature program starts too high (40 °C) and the MS
detector is turned off for the first three minutes of the analysis as a solvent delay in order to

94
prevent the solvent from saturating the source. Although the compounds are present in the
sample, they are not accounted for by the chromatogram, shown in Figure 4-13A. As a result,
further investigation was necessary to determine how many compounds are present in the
gasoline standard being used.
The gasoline sample was analyzed by GC using a flame ionization detector (FID) in order to
determine the number of compounds eluting before toluene. As the sample is instantly
combusted in the flame, a solvent delay is not necessary. The chromatogram for unevaporated
gasoline (Figure 4-13B) revealed the presence of numerous compounds that are unaccounted for
by the GC-MS method used. The compounds were not definitively identified. However, they are
eluting prior to toluene and are not being detected by the mass spectrometer (MS) detector due to
the solvent delay. Although the retention times of the compounds in the FID chromatogram
differ from those in the MS chromatogram due to differences between the instruments used, the
compounds still elute in the same relative order.
At 26% evaporated by volume, the FID chromatogram showed that the abundances of the
compounds between 3 and 3.5 minutes, which elute prior to toluene (~6.3 min), only slightly
decrease. However, by 94% evaporated, all of the compounds prior to toluene have completely
evaporated, and the abundance of toluene has decreased significantly. This difference is most
likely the primary contributor to the lack of correlation between the experimental and theoretical
chromatograms for gasoline, although differences in other regions of the chromatograms also
contribute to the lack of correlation.

95
Figure 4-13. (A) Chromatogram of unevaporated gasoline using MS detector and (B)
Chromatogram of unevaporated gasoline using FID detector. Note that the x-axis is retention
time rather than retention index for this comparison
0
10
0 2 4 6 8 10 12 14
Ab
un
dan
ce
Retention Time (min)
0
10
0 2 4 6 8 10 12 14
Ab
un
dan
ce
Retention Time (min)
Toluene
Toluene
B
A
C2-alkyl
benzenes
C2-alkyl
benzenes
Toluene
Toluene

96
As the model is based on the chromatogram of the unevaporated gasoline standard, the model
cannot accurately predict the evaporated chromatograms because only two or three compounds
prior to toluene are accounted for in the chromatogram of unevaporated gasoline. Additionally,
the compounds eluting prior to toluene contribute substantially to the overall mass of the
remaining liquid, which is not addressed by the model.
Figure 4-14 shows the chromatogram of unleaded gasoline, obtained using a cryogenic oven,
which allows the GC-MS method to begin at 0 °C. In contrast, the lowest temperature possible
with a conventional GC oven is 10 °C above room temperature (~35 °C). The GC-MS method
used in this research, which is typical for fire debris analysis, begins at 40 °C with a three-minute
solvent delay. The compounds eluting before toluene consist of benzenes and other aliphatic
compounds, among others.
Figure 4-14. Chromatogram of cryogenically cooled gasoline sample3
Toluene C2-AB C3-AB
C4-AB
Toluene = Toluene
C2-AB = C2-alkylbenzenes
C3-AB = C3-alkylbenzenes
C4-AB = C4-alkylbenzenes

97
One solution for addressing the lack of correlation involves the optimization of the PPMC
coefficients, which is possible as the model can predict evaporation at any level. This is
accomplished by systematically increasing the theoretical fraction remaining until the PPMC
coefficients are optimized. By increasing the theoretical fraction remaining, the predicted
abundance of the compounds in gasoline will increase until the overall area of the theoretical
evaporated liquid matches that of the experimental liquid. To test this theory, the fraction
remaining for each evaporation level of gasoline was increased in increments of 0.01 to
determine the difference between the fraction remaining predicted by the model and the actual
fraction remaining by mass determined experimentally. The difference in fraction remaining
would indicate the portion of the experimental fraction remaining provided by the undetected
compounds. The fraction remaining determined experimentally for 94% evaporated gasoline was
0.108, while the fraction remaining necessary to optimize the PPMC coefficient was 0.360,
which increased the mean PPMC coefficient from 0.535 to 0.986 (Figure 4-15).
The difference between the optimal and initial fraction remaining is 0.252. This indicates that
~25% of the mass is due to the compounds unaccounted for by the model due to their absence in
the chromatographic data. This is consistent with the number of compounds typically present in
gasoline that elute prior to toluene (Figure 4-14). Figure 4-16 shows the overlaid chromatograms
of the experimental, initial theoretical, and optimal theoretical chromatograms for 94%
evaporated gasoline. The abundances of the detected compounds in the optimal theoretical
chromatogram are higher in abundance compared to the experimental chromatogram because
they are less evaporated in the theoretical chromatogram due to the evaporation of the undetected
compounds. The original and optimal fraction remaining and PPMC coefficient for each
evaporation level are shown in Table 4-5. The PPMC coefficients increase from moderate

98
correlation for 52% - 94% evaporated to strong correlation at all four evaporation levels,
indicating that optimizing the PPMC coefficients successfully addresses the contributions from
the undetected compounds that elute prior to toluene.
Figure 4-15. Plot of fraction remaining for 94% gasoline versus PPMC coefficient
Table 4-5. Change in fraction remaining and PPMC coefficient for gasoline
% Evaporated
by Volume
Initial Fraction
Remaining
Optimal Fraction
Remaining
Initial PPMC
Coefficient
Optimal PPMC
Coefficient
26 0.774 0.970 0.945 0.999
52 0.536 0.910 0.779 0.999
78 0.265 0.710 0.61 0.992
94 0.108 0.360 0.535 0.986
0
0.2
0.4
0.6
0.8
1
1.2
0 0.1 0.2 0.3 0.4 0.5
PP
MC
Co
eff
icie
nt
Fraction Remaining
PPMCinit 0.535 ± 0.015
Finit 0.108
PPMCopt 0.986 ± 0.002
Fopt 0.360

99
Figure 4-16. Overlay of chromatograms of experimental, initial theoretical (FR 0.108), and
optimal theoretical (FR 0.360) 94% evaporated gasoline
Based on the mean PPMC coefficients for gasoline, the model is applicable to gasoline and
has the potential to predict the evaporation of gasoline at any evaporation level. The optimization
of the PPMC coefficients increases the correlation between the theoretical and experimental
chromatograms by adjusting the theoretical fraction remaining to account for the mass of
compounds not detected by the GC-MS method. This optimization is beneficial to forensic
laboratories. The exact evaporation level of ignitable liquids in fire debris is typically unknown,
and analysts are not interested in predicting specific evaporation levels. By generating theoretical
chromatograms until the PPMC coefficients are optimized, the exact evaporation level of the fire
debris does not need to be determined. However, additional modifications are required before the
0
1.4
650 850 1050 1250 1450
No
rmalized
Ab
un
dan
ce
Retention Index
Optimal Theoretical
Experimental
Initial Theoretical

100
model can be as accurate for gasoline as for the petroleum distillates the model was originally
developed for.

101
APPENDICES

102
APPENDIX A: UNEVAPORATED AND EVAPORATED TORCH FUEL
Figure A-1. Chromatogram of unevaporated Tiki torch fuel
0
8.5
800 1000 1200 1400 1600 1800 2000 2200
No
rmalized
Ab
un
dan
ce
Retention Index
C11
C14
C13
C12

103
Figure A-2. Chromatogram of Tiki torch fuel evaporated 26% by volume
0
8.5
800 1000 1200 1400 1600 1800 2000 2200
No
rmalized
Ab
un
dan
ce
Retention Index
Experimental
Theoretical
C11
C14
C13
C12

104
Figure A-3. Chromatogram of Tiki torch fuel evaporated 52% by volume
0
8.5
800 1000 1200 1400 1600 1800 2000 2200
No
rmalized
Ab
un
dan
ce
Retention Index
Experimental
Theoretical
C11
C14
C13
C12

105
Figure A-4. Chromatogram of Tiki torch fuel evaporated 78% by volume
0
8.5
800 1000 1200 1400 1600 1800 2000 2200
No
rmalized
Ab
un
dan
ce
Retention Index
Experimental
Theoretical
C12
C14
C13

106
Figure A-5. Chromatogram of Tiki torch fuel evaporated 94% by volume
0
8.5
800 1000 1200 1400 1600 1800 2000 2200
No
rmalized
Ab
un
dan
ce
Retention Index
Experimental
Theoretical
C13C14

107
APPENDIX B: UNEVAPORATED AND EVAPORATED LAMP OIL
Figure B-1. Chromatogram of unevaporated Medallion lamp oil
0
5.5
800 1000 1200 1400 1600 1800 2000 2200
No
rmalized
Ab
un
dan
ce
Retention Index
C11
C19C17C16C15
C13
C12

108
Figure B-2. Chromatogram of Medallion lamp oil evaporated 26% by volume
0
5.5
800 1000 1200 1400 1600 1800 2000 2200
No
rmalized
Ab
un
dan
ce
Retention Index
Experimental
Theoretical
C11
C19C17C16C15
C13
C12

109
Figure B-3. Chromatogram of Medallion lamp oil evaporated 52% by volume
0
5.5
800 1000 1200 1400 1600 1800 2000 2200
No
rmalized
Ab
un
dan
ce
Retention Index
Experimental
Theoretical
C11
C12
C13 C15C16 C17 C19

110
Figure B-4. Chromatogram of Medallion lamp oil evaporated 78% by volume
0
5.5
800 1000 1200 1400 1600 1800 2000 2200
No
rmalized
Ab
un
dan
ce
Retention Index
Experimental
Theoretical
C11
C19C17C16C15C13
C12

111
Figure B-5. Chromatogram of Medallion lamp oil evaporated 94% by volume
0
5.5
800 1000 1200 1400 1600 1800 2000 2200
No
rmalized
Ab
un
dan
ce
Retention Index
Experimental
Theoretical
C11 C19C17C16C15C13
C12

112
REFERENCES

113
REFERENCES
1. McIlroy JW, Jones AD, McGuffin VL. Gas chromatographic retention index as a basis
for predicting evaporation rates of complex mixtures. Anal Chim Acta 2014; 852: 257 –
66.
2. ASTM International. ASTM E1618-11: standard test method for ignitable liquid residues
in extracts from fire debris samples by gas chromatography-mass spectrometry. Annual
book of ASTM standards, Vol 14.02. West Conshohocken, PA: ASTM International,
2011.
3. J&W Scientific. J&W Scientific 1994 – 95 Chromatography Catalog & Reference Guide.
Folsom, CA: J&W Scientific, 1994 – 95.

114
Chapter 5: Conclusions and Future Work
5.1 Conclusions
Evaporation of an ignitable liquid during a fire greatly impacts the analysis of fire debris by
altering the chemical composition of the evaporated liquid. Many forensic laboratories now
include evaporated and unevaporated standards in their reference collections of ignitable liquids.
However, there is currently no standardized method for generating the evaporated standards.
This research investigated different factors that affect the evaporation process as well as the
utility of a mathematical model for fire debris applications.
Based on the results of the first two studies, agitation appears to improve the reproducibility
of the evaporation process, especially at the higher evaporation levels. However, for those
compounds with lower volatility, a higher rate of agitation is required to generate reproducible
data at the highest evaporation level, which is most likely due to increased variation in the
evaporation process at such high levels of evaporation. The use of the spinfin® and micro stir
bars resulted in higher precision than the spinvane® stir bar, indicating that using a stir bar with
a more uniform shape is necessary to generate reproducible data at all evaporation levels.
When comparing the agitated and non-agitated samples from the graduated cylinder to the
non-agitated samples in the Petri dish, similar precision was observed for the graduated cylinder
with agitation and the Petri dish without agitation data sets. This indicates that changing the
surface area available for evaporation and decreasing the thickness of the liquid may negate the
need for agitation.
Although determining the different factors that affect the evaporation of gasoline may result
in improved reproducibility of the evaporation process and lead to the development of a
standardized method for evaporation, the factors affecting evaporation will still affect the

115
evaporation of the standards. Furthermore, no true standard for the evaporated liquids actually
exists. Therefore, an alternative method that is unaffected by these factors and can accurately
simulate the evaporation process was investigated.
A previously developed mathematical model was applied to three petroleum distillates and
gasoline, and theoretical chromatograms at four different evaporation levels were generated. The
chromatograms were then compared to corresponding experimental chromatograms to assess the
correlation between the chromatograms. Strong correlation was observed for the three petroleum
distillates at all four evaporation levels, although the correlation did decreases slightly as the
evaporation level increased. However, the strong correlation observed at each evaporation level,
including the 90% evaporation level, indicates that the model can accurately predict the
evaporation of multiple petroleum distillates at any evaporation level.
The trend observed in the petroleum distillates was also observed for gasoline, although the
trend was more prominent in gasoline with only moderate correlation at the higher evaporation
levels. This lack of correlation is due to a limitation in the GC-MS method used for analysis. The
compounds present in gasoline that elute prior to toluene were not observed in the
chromatographic data due to a solvent delay at the start of the analysis. As a result,
approximately 25% of the compounds in gasoline were unaccounted for by the model. To
address this issue, the PPMC coefficients were optimized by increasing the theoretical fraction
remaining until the optimal PPMC coefficient was obtained. The difference between the initial
and optimal fraction remaining values corresponds to the unaccounted compounds, indicating
that these compounds contribute to the overall mass lost during the evaporation process.
Based on the optimal PPMC coefficients for gasoline, the model is applicable to gasoline and
has the potential to predict the evaporation of gasoline at any evaporation level. As the exact

116
evaporation level of the ignitable liquids in fire debris is typically unknown, this optimization is
beneficial to forensic laboratories because the exact evaporation level of the fire debris does not
need to be determined.
Ultimately, the model provides an alternative method for evaporating standards that is
unaffected by the factors affecting the evaporation process. The model eliminates the need for
experimental evaporated reference standards, saving time and resources.
5.2 Future Work
Although the mathematical model is able to accurately predict the evaporation of multiple
petroleum distillates at any evaporation level, additional modifications are required before the
model can be as accurate for gasoline as for the petroleum distillates. The optimization of the
PPMC coefficients shows potential for improving the prediction of evaporation for gasoline.
However, this method does not address the compounds undetected during GC-MS analysis.
By modifying the GC-MS method so that the detector was only off during the time that the
solvent eluted, these compounds could be detected. As a result, the TIC would show all of the
compounds present in gasoline, including those that elute before toluene, without the danger of
saturating or overloading the detector. With a more representative TIC of unevaporated gasoline,
the model could more accurately predict the fraction remaining of the compounds present. The
correlation between the theoretical and experimental chromatograms would improve without the
need for optimization of the PPMC coefficients.
Further investigation into the applicability of the model may focus on the other ASTM classes
of ignitable liquids as well as simulated fire debris samples to determine the universal utility of
the model.